Abstract
To tackle problems such as the difficult separation from sand and the high power consumption of tiger nut harvesting in the sandy areas of Xinjiang, a conveying and separating device for tiger nut harvesters was designed. The axial and radial migrations of materials under screw action and the separation process of materials under vibratory action were analyzed dynamically. A simulation analysis was carried out on the conveying and separating process based on EDEM software. The migration trajectories of tiger nuts and sand particles were extracted, the displacement variations of sand particles on the X-axis, Y-axis, and Z-axis were analyzed in the action area of the screen-cleaning spike teeth and the screw action area, respectively, and the conveying and separation law of the tiger nut harvest mixture was clarified. With key parameters such as the screw velocity ratio, amplitude, vibration frequency, and machine operation velocity as test factors, and with the sand removal rate, crushing rate, and power consumption as test evaluation indicators, a four-factor, five-level orthogonal central composite test design was implemented. The test results were analyzed via the regression variance analysis method, and relation models between variable factors and evaluation indicators were constructed. The test results show that under the combined conditions of a screw velocity ratio of 0.88, an amplitude of 4.7 mm, a vibration frequency of 7.5 Hz, and a machine operation velocity of 0.92 km/h, the sand removal rate is 90.40%, the crushing rate is 1.66%, and the power consumption is 2.24 kW in theory. The optimized results were verified by tests. The sand removal rate was 88.92%, the crushing rate was 1.71%, the total power consumption was 2.29 kW, and the errors from the predicted values were 1.6%, 3.0%, and 2.2%, respectively, meeting the requirements for tiger nut harvesting conveyance and separation. This research can provide support for the development of technology and equipment for mechanized harvesting of tiger nuts in the sandy areas of Xinjiang.
1. Introduction
The tiger nut is a perennial herb of the Cyperaceae family. It is characterized by a developed root system, high adaptability, and strong stress resistance [1,2,3]. Large-scale planting of tiger nuts can not only modify sandy land, prevent wind, and fix sand, but also increase farmers’ economic income and improve people’s living standards [4]. In China, tiger nuts are mainly planted in Xinjiang, Inner Mongolia, Jilin, and Henan. Harvesting is an important aspect of the production of tiger nuts [5]. At present, the plantation of tiger nuts in Xinjiang mainly faces the problem of high power consumption during harvesting. Therefore, it is particularly important to study how to ensure efficient separation of tiger nuts from sand while reducing the power consumption of the whole machine during the conveying and separation process of the tiger nut excavation mixtures.
In recent years, domestic and foreign scholars have studied the related technologies and devices for the conveyance and soil separation of tiger nut harvest and excavation mixtures, achieving some results. The tiger nut harvester, which was used previously in Spain, mainly uses a vibrating screen structure to separate nuts from soil. Its general design principle is still being used today [6]. Zhao Zhuang et al. [7] designed a scraper-type tiger nut conveying device and studied the effects of parameters such as the scraper height, scraper width, and scraper spacing on the conveying performance. He et al. [8] designed a vibrating chain-plate conveying structure and studied the effects of parameters such as the vibration frequency and amplitude on the soil screening efficiency. Liu Xuemin et al. [9] used a vibrating screen structure to separate tiger nuts from clay. Harbin Dongyu Agricultural Engineering Machinery Co., Ltd. [10] separated tiger nuts, straw debris, and soil using a rotating double-layer drum screen and a grid-bar screen body that oscillates reciprocally along an arc. Xinxiang Dilong Pharmaceutical Machinery Co., Ltd. [11] used a post-vibration two-stage separation structure to separate tiger nuts, roots, and sand mixture. Beijing Xinkechuang Tiger Nut Technology Development Co., Ltd. [12] used a spiral screening machine and a vibrating screen to complete conveying and soil screening during the harvesting of tiger nuts. The above studies show that the vibration principle can achieve effective separation of tiger nuts from soil during the conveying and separation process of tiger nut harvested materials. In addition, the vibration principle is also widely used in the separation of fruit and soil during the harvesting process of root crops such as Panax Notoginseng [13,14], potatoes [15,16,17], and peanuts [18,19,20].
On the basis of the above studies, in order to tackle problems such as difficult separation from sand and the high power consumption of tiger nut harvesting in the sandy areas of Xinjiang, we designed a conveying and separating device combining screw conveying and a vibrating screen, implementing a mixed state of vibration and spiral conveying during the conveying process. Compared with the single-vibration sand removal or spiral-conveying threshing and harvesting devices, the sand removal efficiency is higher and the bean damage rate and power consumption are lower. The axial and radial migrations of materials under screw action and the separation process of materials under vibratory action were analyzed dynamically. Simulation analysis was carried out on the conveying and separation process based on EDEM software, and the conveying and separation law of the tiger nut harvest mixture was clarified. A four-factor, five-level orthogonal central composite test was performed to explore the influence law of the screw velocity ratio, amplitude, vibration frequency, machine operation velocity, and other test factors on the conveying and separation performance to determine the optimal operating parameters of the device so as to support the development of the technology and equipment for mechanized harvesting of tiger nuts in the sandy areas of Xinjiang.
2. Materials and Methods
2.1. Agronomy and Plant Characteristics of Tiger Nuts
Our research was conducted by studying the tiger nuts planted in sand by the 54th Regiment of the Third Division of the Xinjiang Production and Construction Corps. The variety is Zhongyousha No. 1, the distribution of the tiger nuts and their rhizomes is shown in Figure 1, and the planting method is flat planting, with a planting row spacing of 30~35 cm and a plant spacing of 5~7 cm. From the end of September to the beginning of October, tiger nuts were harvested. Before harvesting, the planting soil was cut off from the water supply for 7 to 10 days, and the tiger nut grass was harvested first, followed by the tiger nuts themselves. The tiger nut has a strong tillering regeneration capacity and develops roots in a clump-like shape. Their disorderly distributed fibrous root system is interwoven with sand, forming a composite structure of tiger nuts, roots, and sand (hereinafter referred to as “the complex”). The characteristic parameters of tiger nuts were measured by the following measurement tools: a DL91150 digital vernier caliper (maximum measurement length: 150 mm, measurement accuracy: 0.01 mm, manufacturer: Deli Group Co., Ltd., Ningbo City, Zhejiang, China), a Sartorius MA100 electronic moisture analyzer (quality accuracy: 0.001 g, moisture content accuracy: 0.01%, manufacturer: Seydouris, Germany) and so on. The main characteristic parameters of mature tiger nuts are shown in Table 1.
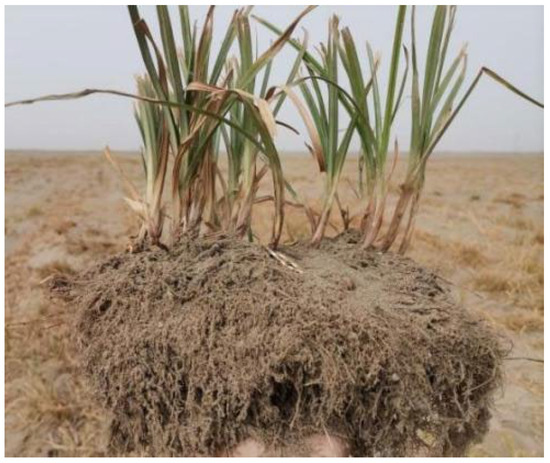
Figure 1.
The distribution of tiger nuts and its rhizomes.

Table 1.
Characteristic parameters of tiger nuts.
2.2. Overall Structure and Working Principle
2.2.1. Overall Structure of Conveying and Separating Device Test Bench
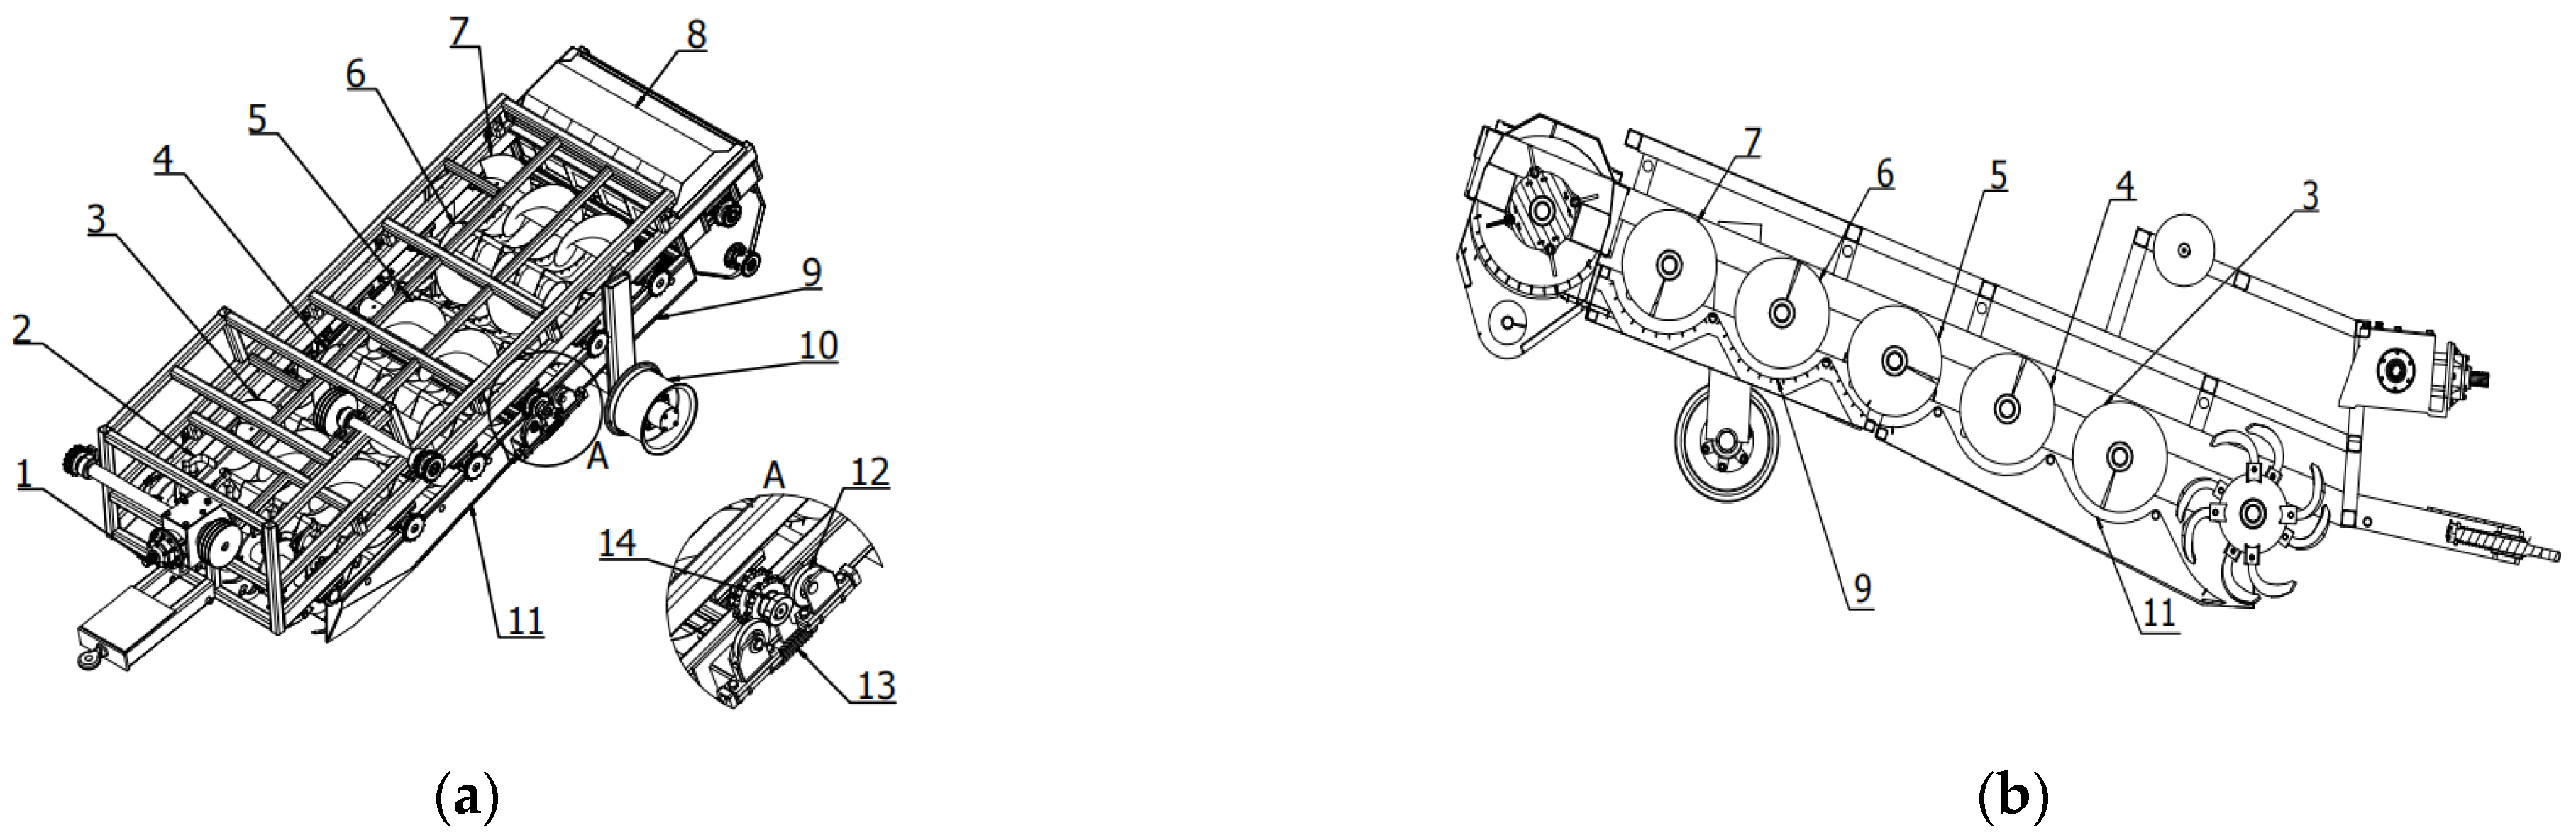
The conveying and separating device is mainly composed of five-stage screw conveying device, front screen, back screen, exciter, exciting roller, return spring, collection box and rack, as shown in Figure 2a, and the sectional drawing of the conveying and separating device is shown in Figure 2b.

Figure 2.
(a): Overall structure of the conveying and separating device. (b): the sectional drawing of the conveying and separating device. 1. Power shaft. 2. Rotary blade. 3. First-stage screw conveyor. 4. Second-stage screw conveyor. 5. Third-stage screw conveyor. 6. Fourth-stage screw conveyor. 7. Fifth-stage screw conveyor. 8. Collection box. 9. Back screen. 10. Tire. 11. Front screen. 12. Exciting roller. 13. Return Spring. 14. Exciter.
2.2.2. Working Principle
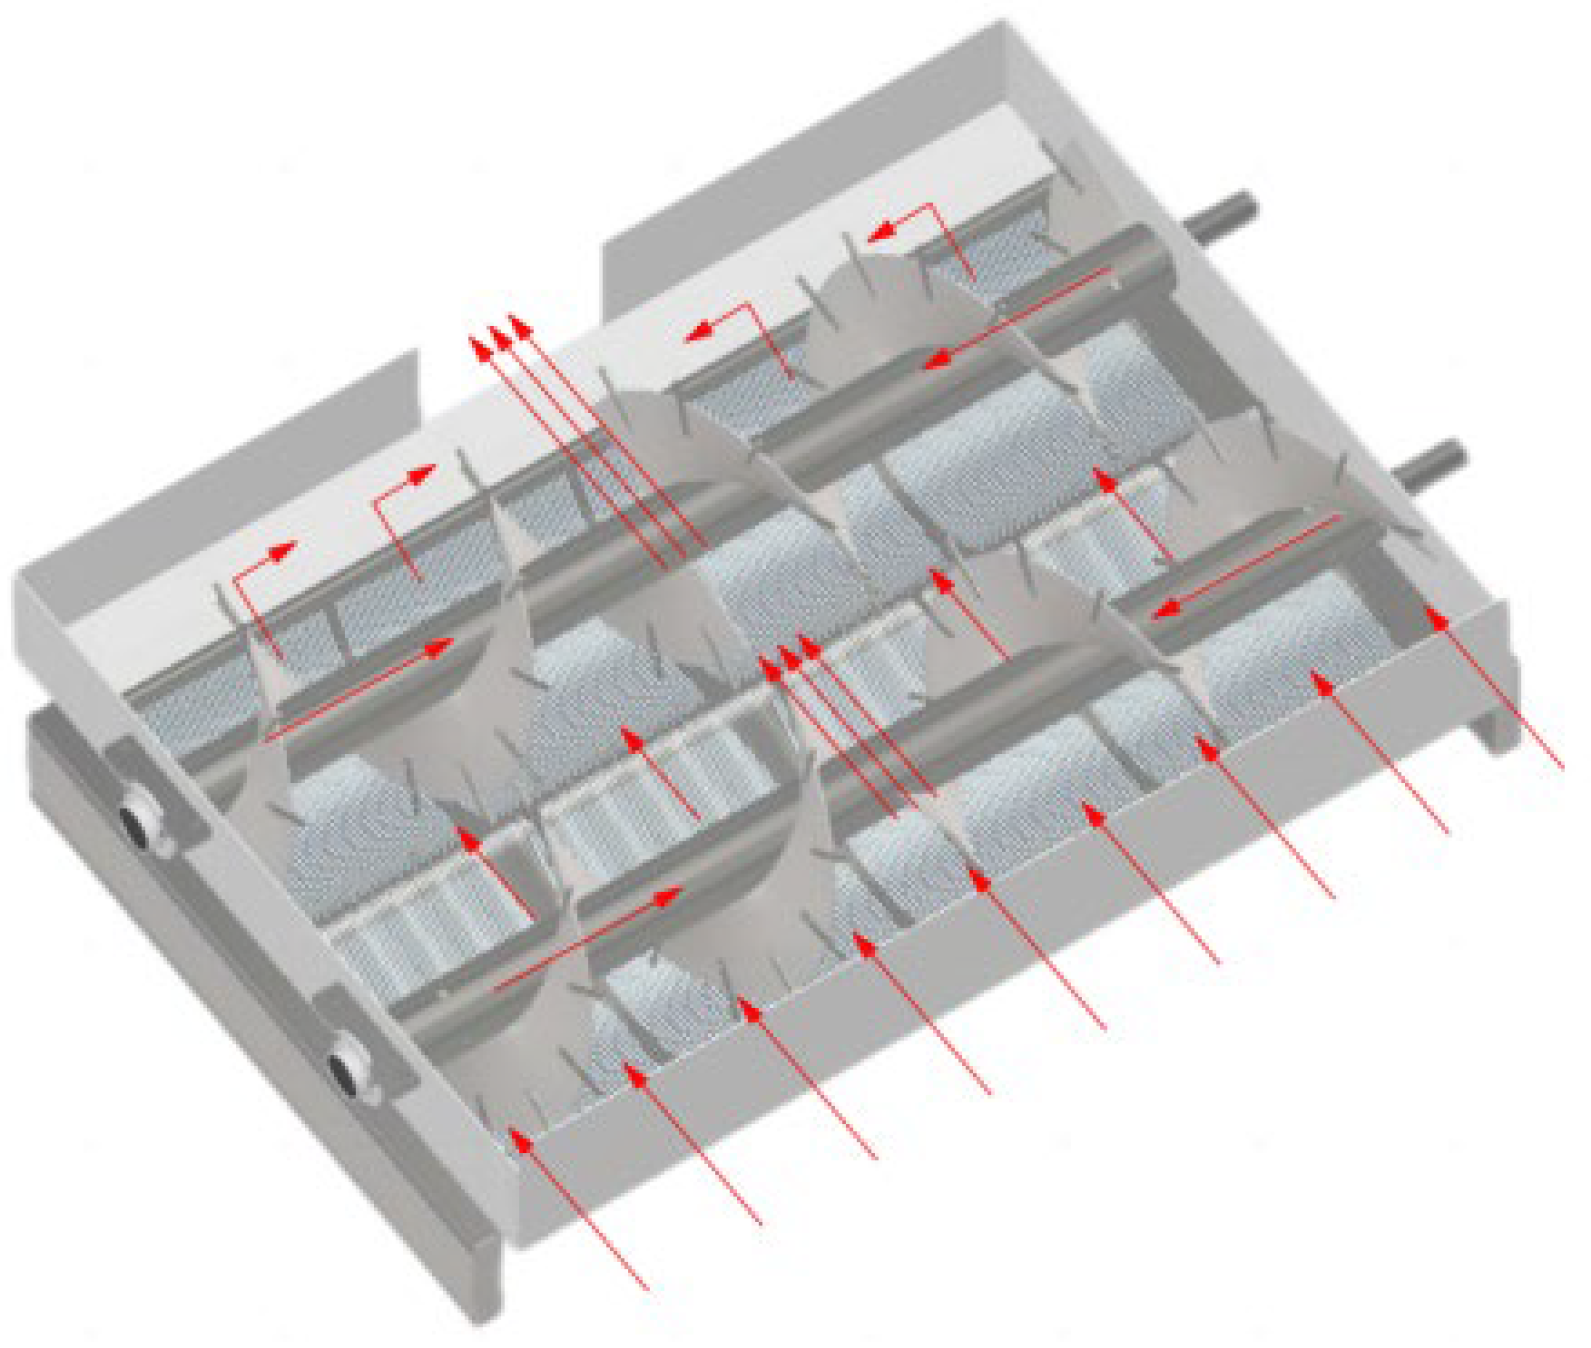
During operation, the rotary blade excavator tosses the excavated mixture of tiger nuts, roots, complexes, and a large amount of sand to the first-stage screw conveyor of the conveying and separating device. The screw blade pushes the mixture axially through augers in the same stage, so that the material moves along the peripheral direction of the screw blade while migrating axially. The mixture is conveyed centrally and tossed between adjacent augers through left-handed and right-handed rotation of blades in opposite directions. During rotation, the exciter interacts with the exciting roller, forcing the front screen and back screen to change from a static state to a state of moving away from the exciter. At the same time, the return spring exerts tension on the front screen and back screen to pull them back to the original positions, thus leading to reciprocating periodic vibrations of the front screen and back screen. Under the combined action of screw conveying and the vibrating screen body, the mixture is in a loose state, which is conducive to the discharge of sand from the screen gaps and also conducive to the destruction of the structural state of the complex, promoting the separation of tiger nuts and roots from sand. In addition, the sand on the surface of the screen body is disturbed by spike teeth to clean the surface of the screen body and avoid blockage of the screen body caused by the accumulation of sand. A schematic diagram of the migration of complexes is shown in Figure 3. The technical parameters of the conveyance and separation test bench are shown in Table 2.
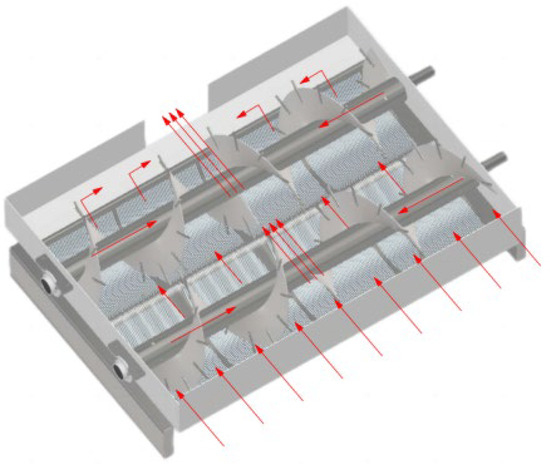
Figure 3.
Migration process of the complexes.
Table 2.
Performance parameters of the conveying and separating device.
2.3. Parameter Design and Analysis of Key Components
2.3.1. Structure and Parameter Design of the Screw Conveyor
A screw conveyor is an operating unit in the five-stage screw conveying device. It is mainly composed of a screw shaft, a screw blade, and screen-cleaning spike teeth and performs axial conveyance of the excavation mixture and radial migration among multistage screw conveyors. As the excavation mixture contains tiger nuts, sand, and other granular materials, a solid helical screw conveyor was selected, and its structure is shown in Figure 4.
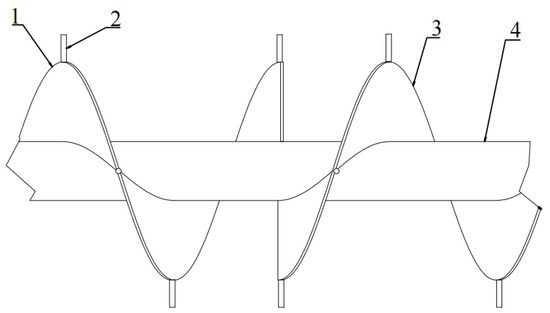
Figure 4.
Screw conveying device. 1. Right-handed blade. 2. Screen-cleaning spike teeth. 3. Left-handed blade. 4. Screw shaft.
The screw blade and screw shaft are the main components of the screw conveyor. The key structure and parameters of the screw conveyor were designed. The mass of sand in the excavation mixture was relatively large, so the sand density was selected as the bulk density of the material. The feed amount of the conveying and separating device was calculated according to the moving velocity and working width of the machine to be . By referring to the literature [21,22], according to Formula (1), it can be obtained that , , , and lead angle . According to the recommended values in the Transport Machinery Type Selection Design Manual [23], let , , and .
In order to reduce the overall weight of the device, a hollow structure was designed for the screw shaft and the inner diameter of the screw shaft was set to be 104 mm.
where —outer diameter of the screw blade, mm; —pitch of the screw blade, mm; —outer diameter of the screw shaft, mm; —characteristic coefficient of the material, 0.05; —conveying capacity, t/h; —filling coefficient, 0.25~0.35; —bulk density, t/m3; —dip coefficient, 1.0 for a horizontal shaft; —lead angle, °; and —frictional angle between sand and screw blade, 23.27°.
The screen-cleaning spike teeth were cylindrical steel teeth with a raised surface and a diameter of 8 mm. They were installed on both sides of the screw blade and uniformly arranged along the helical line, with a spacing of 20 mm. Considering that the particle size of tiger nuts ranges from 8 mm to 12 mm, and in order to avoid blockage of gaps by tiger nut root stubbles, the gaps between screen-cleaning spike teeth and screen body were designed to be 24 mm wide. Given the prerequisite of ensuring the transportation of tiger nuts in mixture and avoiding the phenomenon of damage, the operating line speed of the cleaning nail teeth should be less than 6.75 m/s, referring to the line speed of similar materials such as soybeans in the literature [24]. Using Formula (2), it can be determined that the screw speed cannot exceed 280.8 r/min; that is, the maximum value of the screw speed in the later stages of this article is 280 r/min.
where —line speed of the screen-cleaning spike teeth, m/min; —screw speed, r/min; and —rotary radius of the screen-cleaning spike teeth, m.
2.3.2. Analysis of the Material Conveying Process under Screw Action
(1) Analysis of the particle velocity during axial conveyance of materials
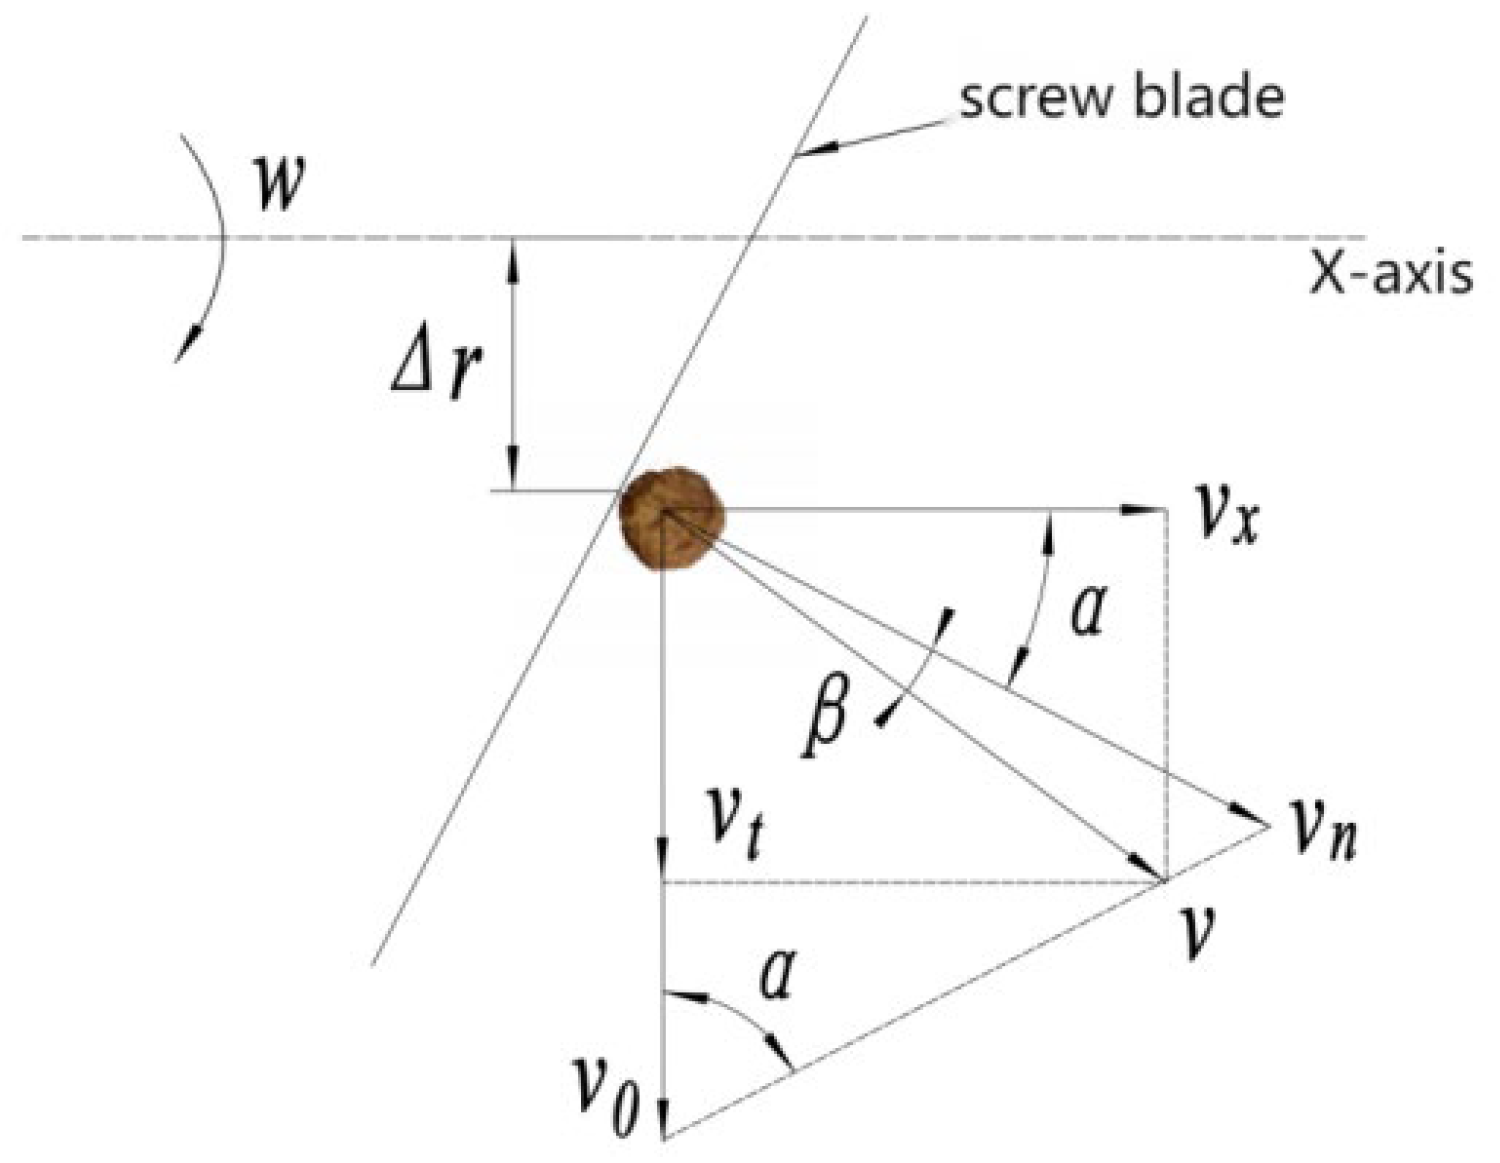
In the process of conveying the complex, the screw conveying shaft rotates around the X-axis at a constant velocity w. The motion state of the complex at a distance r from the center of the screw shaft and on the screw blade surface was analyzed. Under the push and pull of the screw blade, the complex exhibited variable motion. The velocity analysis is shown in Figure 5.
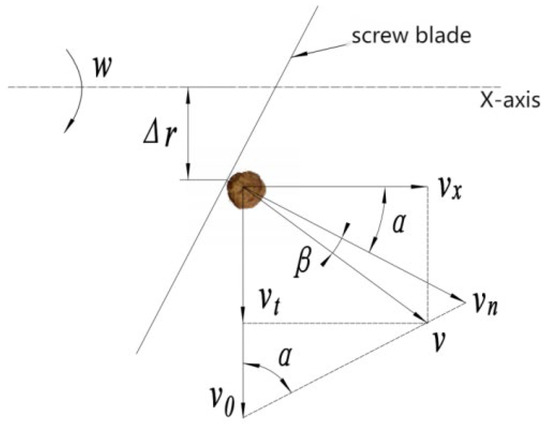
Figure 5.
Analysis of the velocity of the complex on the front screen surface.
When the complex is not under a frictional action, its velocity is perpendicular to the screw blade. When it is under a frictional action, its velocity deviates by β to become v [25,26]. From the velocity analysis in Figure 3, it can be obtained that:
where —carrier velocity of the complex on the screw blade, m/s, and —velocity of the complex perpendicular to the screw blade, m/s.
Meanwhile, the carrier velocity of the complex on the screw blade is:
where r—distance of the complex from the center of the screw shaft, mm; w—angular velocity of the screw conveyor, r/min; and t—conveyance time, s.
At this moment, the axial and circumferential components of the velocities and are:
where α—lead angle, (°); β—frictional angle between the complex and the helical surface, (°); —axial velocity of the complex, m/s; and —resultant velocity of the complex, m/s.
Meanwhile, as and the linear velocity of the edge of the screw blade is the highest, the criticality principle is applied. Suppose Δr = r and substitute Formula (4) into Formula (5) to obtain the axial velocity of the complex:
It can be found from the calculation that:
Substitute Formula (7) into Formula (6) to obtain:
Here, —frictional coefficient, 0.43; —distance between the complex and the shaft center, 0.2 m; and —screw blade pitch, 0.4 m.
When the speeds of the screw conveying shaft and the material are known, at the same radius r, the larger the screw blade pitch, the greater the movement velocity of the materials. To ensure that the complex can be conveyed axially, the axial velocity of complex particles must be greater than the circumferential velocity. From Formulae (5) and (8), the axial velocity and circumferential velocity are obtained, which are 0.81 m/s and 0.74 m/s, respectively, meeting the conditions of axial migration.
(2) Analysis of the particle velocity during radial tossing of materials
In the process of screw conveying of materials, when the radial velocity of the materials increases, the materials will exhibit a tossing movement, and a tossing zone will be formed in the migration process of two adjacent screw conveyor stages. Due to the different arc lengths of the U-shaped conveyor channel, the complex will exhibit two kinds of motion: front tossing and rear tossing. The motion analysis is shown in Figure 6.
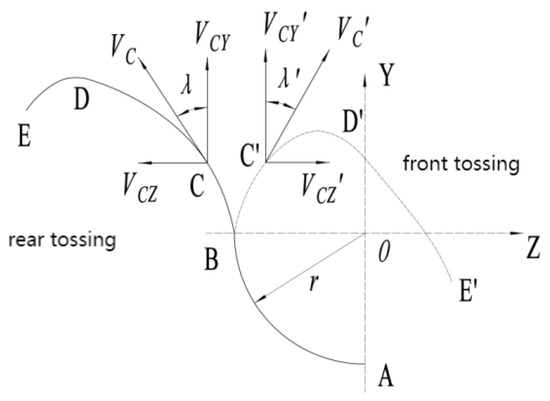
Figure 6.
Analysis of throwing motion.
As can be seen from Figure 6, under the action of the screw blades in opposite rotation directions, the axial velocity of the complex in the tossing zone is equal and opposite. Therefore, in the tossing process, the complex only has a radial velocity [27,28], which can be obtained as follows:
In this case, when the angle δ of arc length AB of the U-shaped conveyor channel is less than or equal to 90°, a rear tossing motion occurs, and the motion trajectory is ABCDE.
When the angle δ of arc length AB of the U-shaped conveyor channel is greater than 90°, a front tossing motion occurs, and the motion trajectory is ABC′D′E′.
From the above analysis, it can be seen that to ensure the effective conveying of materials between two screw conveyor stages, the angle of arc length AB of the U-shaped conveyor channel should be less than or equal to 90°, and it was designed to be 65.5° in this paper.
2.3.3. Structure and Parameter Design of the Vibrating Screen Body
According to the structural form of five-stage screw conveyors, the front screen and back screen of the vibrating screen body were designed as multi-stage curved screens, and the screen body adopted the structural form of a grid screen, as shown in Figure 7. The effective working width was designed to be 1620 mm, and the pores of a single screen were 8 mm × 4 mm. According to the gaps between the screen-cleaning spike teeth and the screen body and the working length of the screen-cleaning spike teeth determined in the previous stage, the radius of the grid screen arc was designed to be 254 mm. Considering the large number, length and load of screen bars, stiffeners were provided to position the screen bars and improve the stiffness of the screen bars.
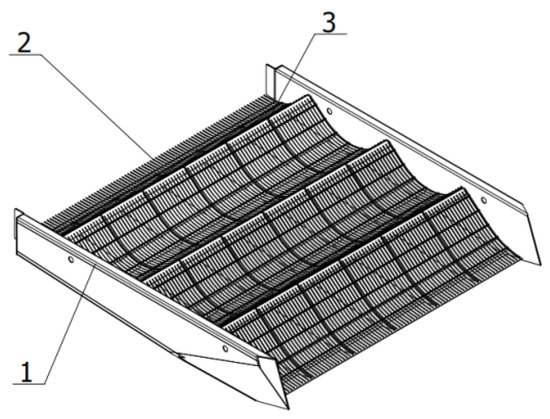
Figure 7.
Structure of the vibrating screen body. 1. Sideways board of the screen body. 2. Curved screen body. 3. Stiffener.
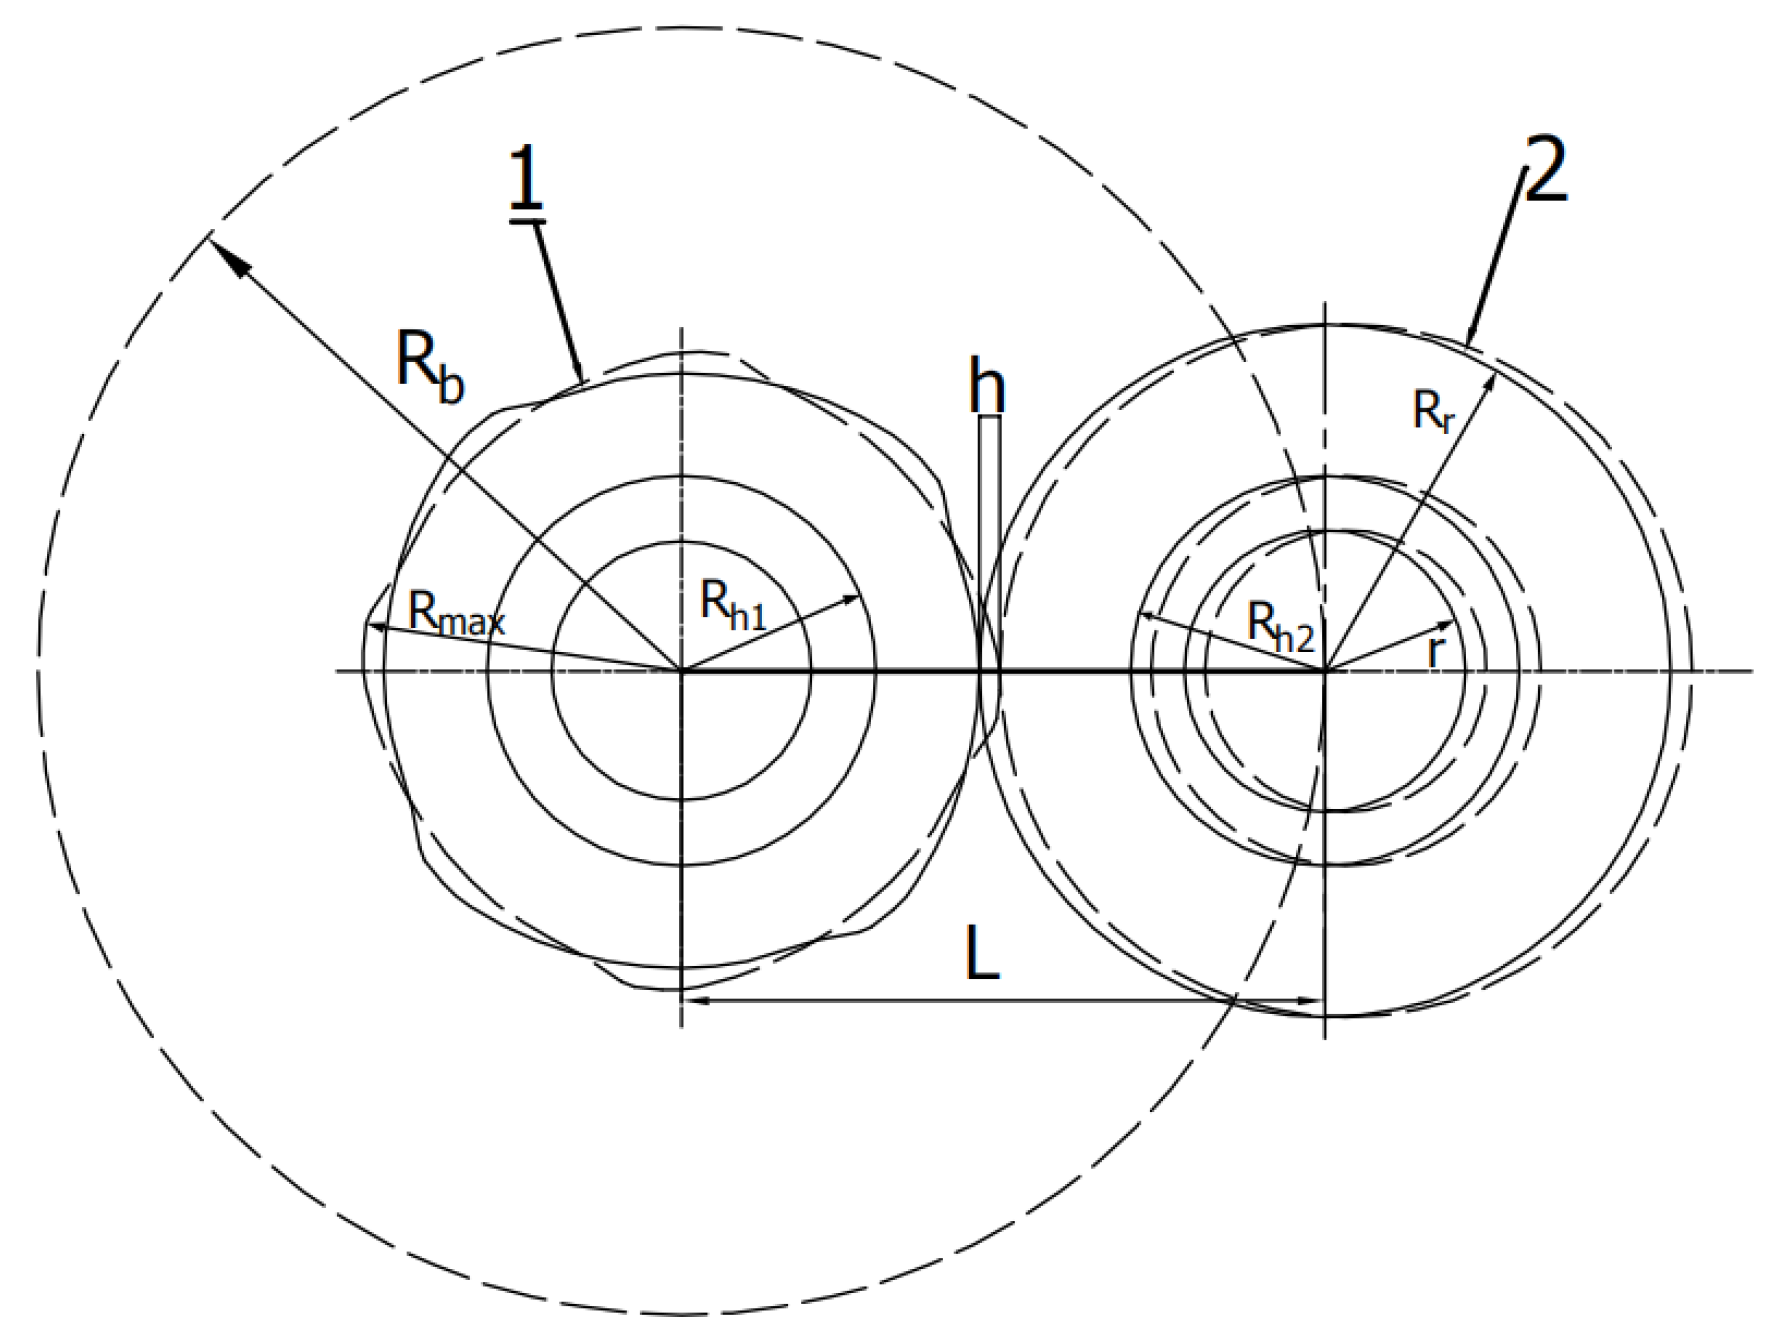
In order to improve the vibration frequency, the exciter was designed as a quad-arc cam structure with a symmetrical distribution of arcs, as shown in Figure 8. To ensure a smooth and stable contact process between the exciter and exciting roller and considering the processing difficulty and cost, the exciting roller was designed to have a circular outline. The parameters of the cam and exciting roller need to satisfy Formula (14). Then, based on the characteristics of the sand and the separation requirements, the design cam base circle radius is mm and the cam hub radius is mm. Let Rr = 64 mm and let the roller shaft radius mm. The roller hub radius was chosen as mm, and then let mm.
where —cam base circle radius, mm; —cam hub radius, mm; —radius of the exciting roller, mm; —radius of the exciting roller shaft, mm; —center distance between cam and roller center, mm; —maximum radius of convex profile, mm; and —roller hub radius, mm.
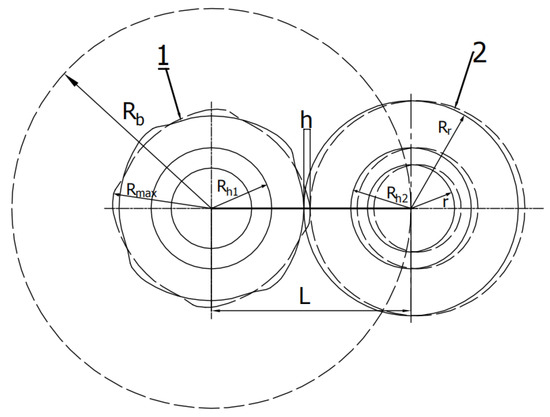
Figure 8.
Vibration generator system. 1. Exciter. 2. Exciting roller.
2.3.4. Analysis of the Material Separation Process under Vibration
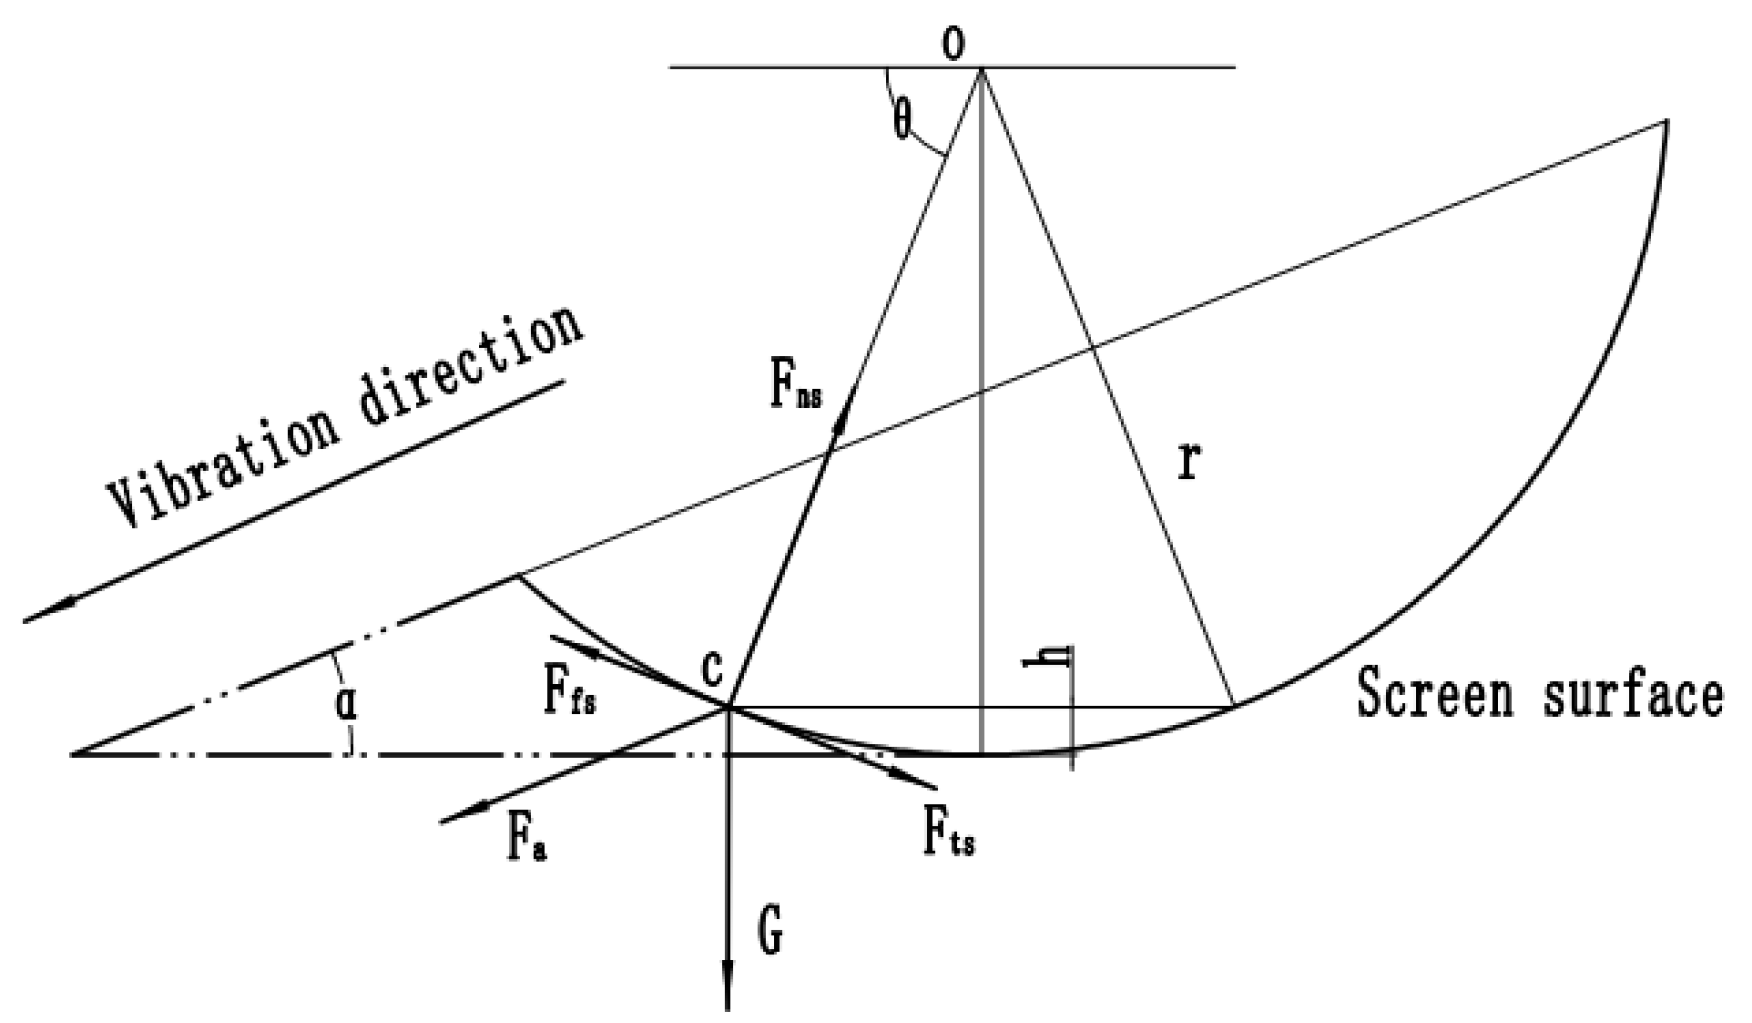
When the motion mode of the screen body is vibration along the screen surface, as shown in Figure 9, the displacement, acceleration, and stress of sand particles were analyzed. The stress analysis of the sand particles on the vibrating screen surface shows that the direction of the inertia force of the sand particles was opposite to the vibration direction of the screen surface. At this moment, the screen body vibrated along the screen surface to the left and right, and the sand moved left and right along the screen surface under the action of inertia force. It is assumed that when the inertia force on the sand particles is leftward, the force on the sand particles at point C of the screen surface is as shown in Figure 9. When the screen body vibrates left and right along the screen surface, the vibration of the screen body can be regarded as a cosine acceleration motion of the cam-push rod mechanism (simple harmonic motion) [29]. The displacement equation and acceleration equation are shown in Formula (15) and Formula (16).
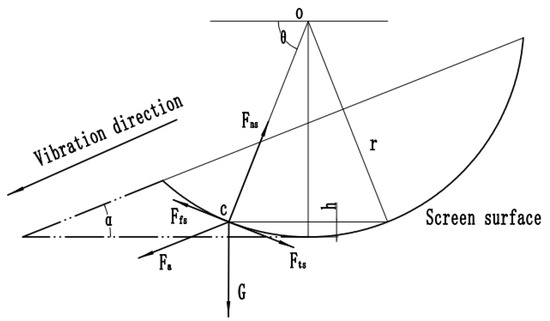
Figure 9.
Force analysis of leftward inertia force of sand particles.
Through the analysis of Figure 9, it can be obtained that the force balance equation of sand particles on the screen surface [30] is:
where Fns—normal component at point C of the arc surface for the force applied on the sand on the screen surface, N; Fa—inertia force of sand, N; G—gravity, N; θ—angle between the connecting line of point C on the screen surface, the circle center Os of the arc surface, and the horizontal line, rad; Fts—tangential component at point C on the arc surface for the force applied on the sand on the screen surface, N; Ffs—frictional force of sand on the screen surface, N; fs—friction factor of the screen surface against the sand; ms—mass of the sand, g; as—acceleration of vibrating screen, m/s2; r—arc surface radius of the vibrating screen, m; hs—vertical distance between sand at point C of the screen surface and the bottom of the arc surface of the vibrating screen, m; and Fs—resultant force on the sand, N.
After substituting Formula (16) into Formula (15), it was rearranged to obtain:
According to Formulas (17) and (18), when ≤ 0, the sand particles are on the surface of the vibrating screen. If > 0, the sand will slide along the screen surface to the right of the arc surface of the screen body; if < 0, the sand will slide along the screen surface to the left of the arc surface of the screen body. When > 0, the sand is tossed diagonally upward by the vibrating screen. If > 0, the sand will be tossed up by the screen body to the right of the screen body normal; if < 0, the sand will be tossed up by the screen body to the left of the screen body normal. To ensure the fluidity and separability of sand, it is necessary to appropriately improve the vibration frequency and amplitude of the vibrating screen. When selecting the amplitude and frequency parameters, a large amplitude and a low frequency should be chosen for materials with a larger particle size, and, vice versa, a small amplitude and a high frequency should be chosen for materials with a smaller particle size [31]. Since the screening materials mainly consist of loose materials such as sand and soil, paper [32] concluded that the optimal screening efficiency of the vibrating screen is achieved with an amplitude of 4 mm, while paper [33] found that the optimal screening efficiency is achieved with an amplitude of 5 mm. Therefore, the preliminary amplitude value is set at 4.5 mm, and experiments will be conducted with this value as the intermediate level for selecting test variable factors. In the tiger nut and castor bean cleaning process, paper [34,35] used 7 Hz as the intermediate level for vibration frequency testing, while paper [36] found that in the process of separating potato soil, the maximum vibration frequency was 9 Hz. Considering factors such as a smaller mesh size and a finer sand particle size, and in accordance with the sand separation requirements of the tiger nut harvesting process, the maximum vibration frequency parameter is set at 9 Hz, with 7 Hz as the intermediate level for selecting test variable factors in later experiments.
3. Simulation Test and Result Analysis
3.1. Setting of Simulation Parameters and Model Construction
In order to verify the rationality of the design of the conveying and separating device, EDEM software was used for simulation analysis of the conveying and separating process. As the motion process and the forms of the complex and sand mass in the device are complex, and the number of simulated particles included in the material modeling is large; thus, a Hertz–Mindlin contact model was used. Referring to our previous article [37] and based on the determined parameters of tiger nuts, sand, the complex, and other materials, as well as the literature [38,39,40,41,42], the intrinsic parameters (Poisson’s ratio, shear modulus, etc.) and the basic contact parameters (collision recovery coefficient, static frictional coefficient and rolling frictional coefficient, etc.) of sand particles, tiger nuts, tiger nut roots, and the geometry of the sand conveying and removing device were set. The intrinsic simulation parameters and contact parameters are shown in Table 3 and Table 4.
Table 3.
Intrinsic parameters.
Table 4.
Contact parameters.
According to the tiger nut planting pattern on the sandy land and the overall working width of the harvester, a soil tank model was constructed in EDEM 2021.2 software. EDEM software is an advanced engineering simulation software that uses the discrete element method to simulate the particle flow, particle dynamics, and particle material interactions. It has many functions such as particle simulations, multi-physical simulations, visualization, and analysis. EDEM software is a powerful and widely used particle dynamics simulation software in the engineering field, and can help engineers and researchers better understand and optimize the behavior of particle systems. The software version used in this work is EDEM 2021.2. Multiple small squares were generated in the working area according to the tiger nut planting pattern parameters. Supposing each small square is a hole of a tiger nut plant, the location of the tiger nut–root–sand complexes was determined. Then, the tiger nut–root–sand complex and sand particle models established earlier were introduced so that sand particles could fill up the working area and bury and cover the complex. After the settlement of sand particles was complete, the soil tank model was finally established, as shown in Figure 10a. Solidworks three-dimensional software was used to simplify the conveying and separating device. The simplified model was saved in igs format and imported into EDEM software. The total simulation time was 12 s and the step length was 0.02 s. A simulation model was established, as shown in Figure 10b.
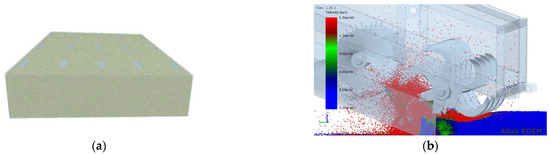
Figure 10.
Simulation model. (a) Discrete element model of soil tank. (b) The process of simulation.
3.2. Analysis of Sand Particle Movements and Displacement Variation
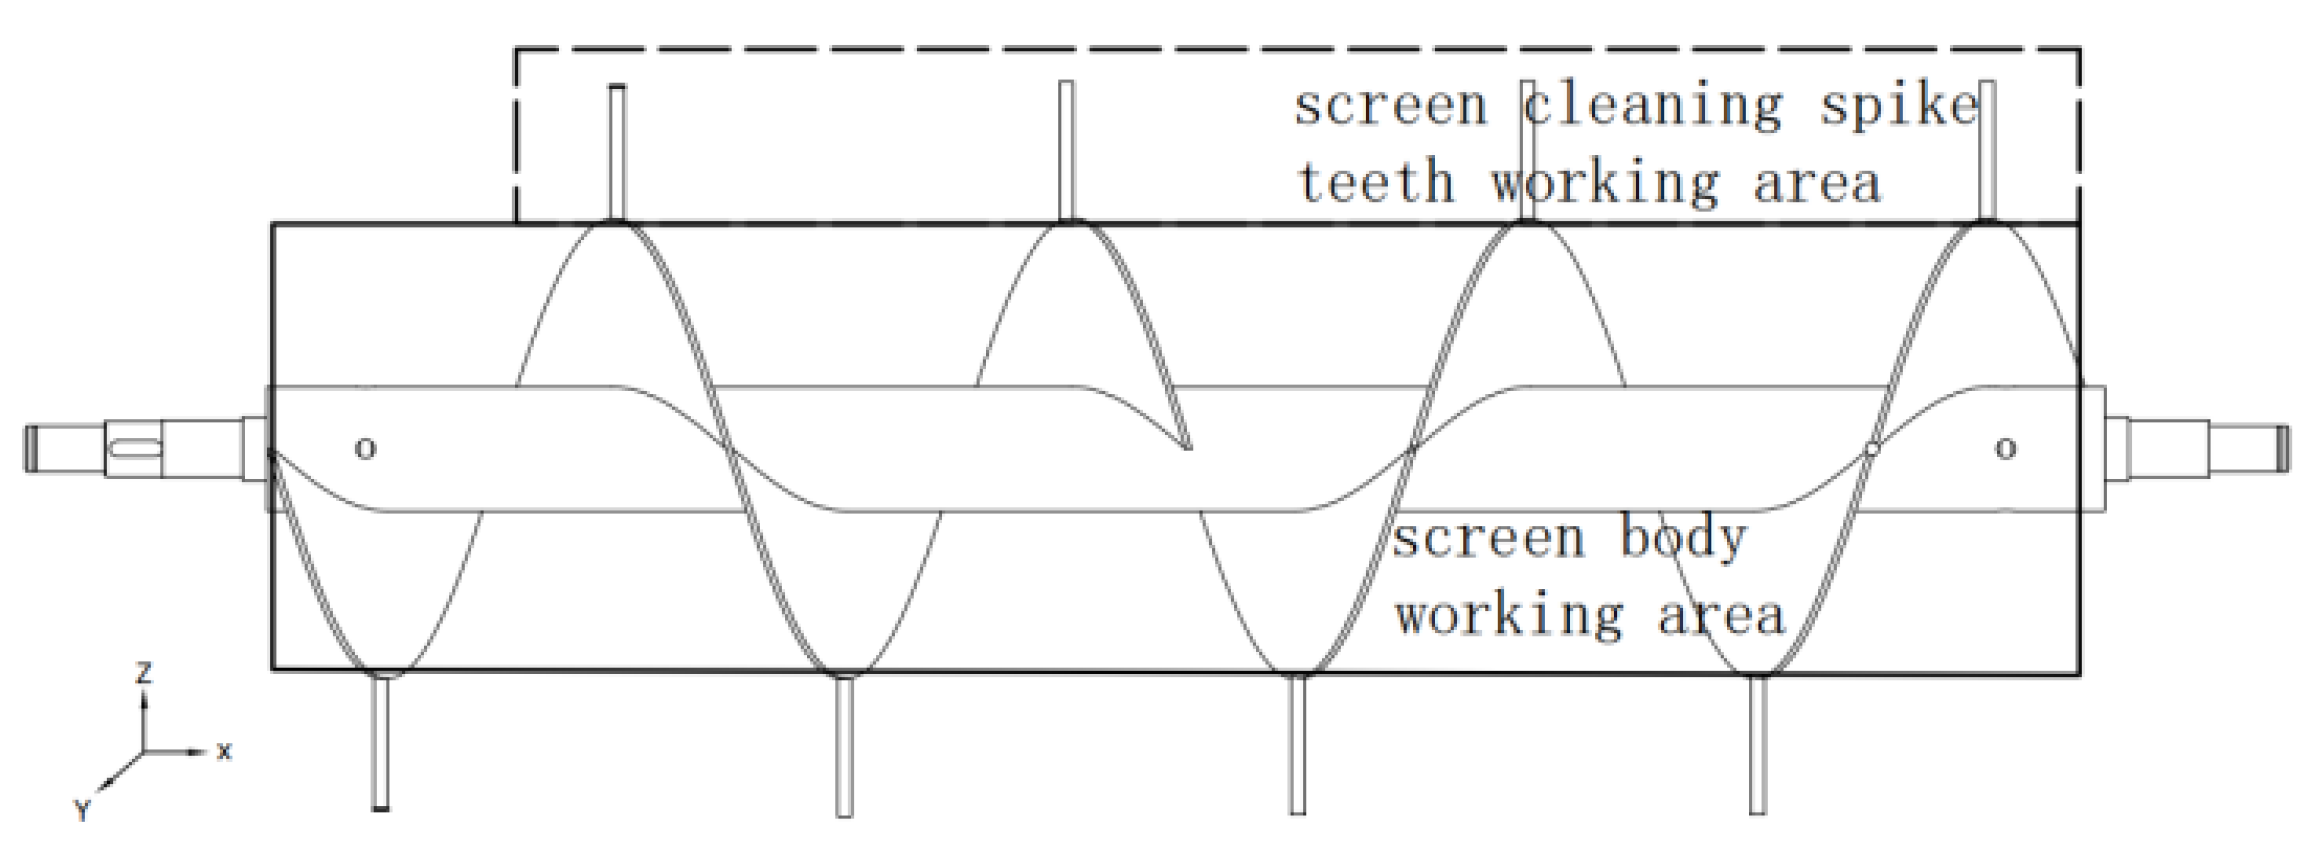
The motion process of the sand particles under the double actions of screw conveying and screen body vibration was analyzed. The mixture is under the actions of the screw blade and screen-cleaning spike teeth in the process of screw conveying and is spread on the surface of the screen body. At the same time, the structural state of the mixture changed under the vibratory action of the screen body, accelerating the separation between tiger nuts and sand in the mixture, and the sand was discharged from the gaps between the screen bars so as to realize the effect of separating sand and discharging it out of the machine while conveying and migrating tiger nuts, as shown in Figure 11. In order to gain a more intuitive understanding of the movement state of sand during the mixture conveying process, sand particles were randomly selected in the action area of the screen-cleaning spike teeth and the screw blade conveying area, respectively, and the variations in the displacement parameters in the X-axis, Y-axis, and Z-axis over time were extracted.
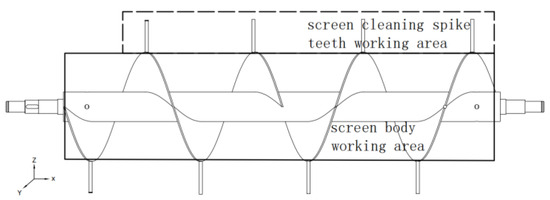
Figure 11.
Working area of the screw conveying device.
3.2.1. Analysis of the Displacement Variation of Sand Particles along the X-axis
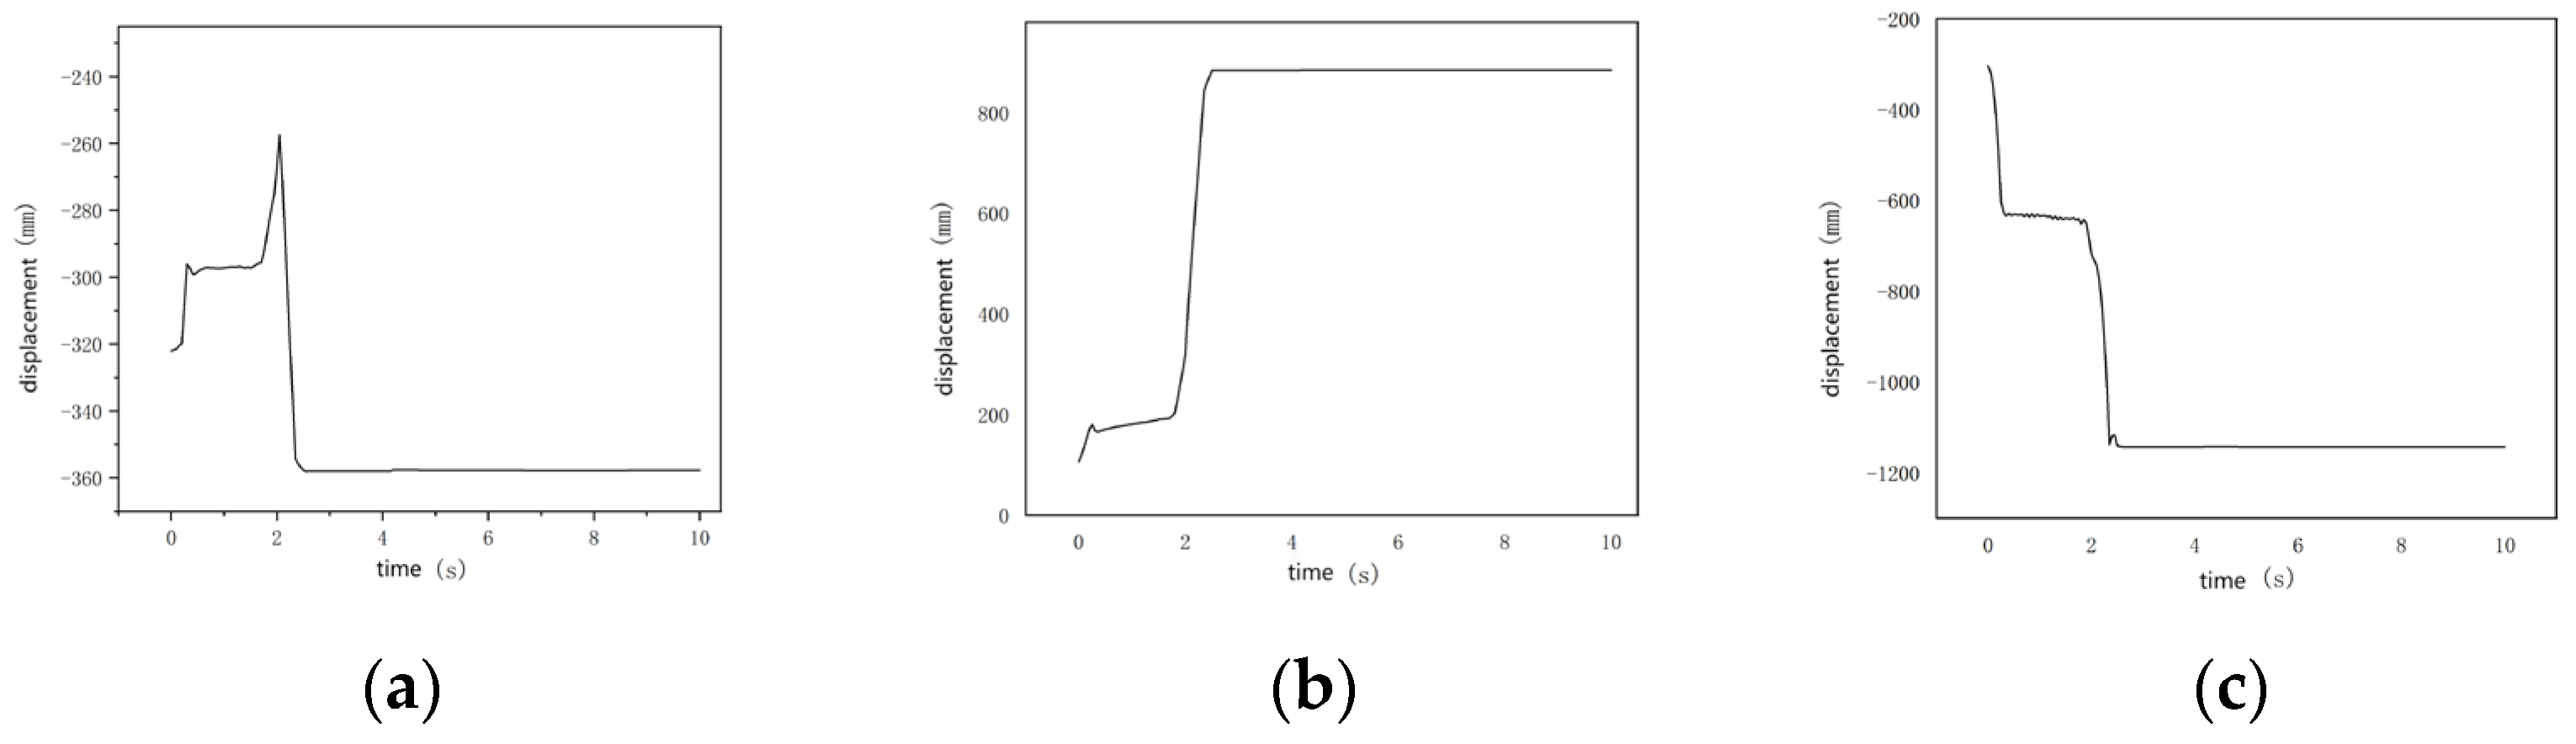
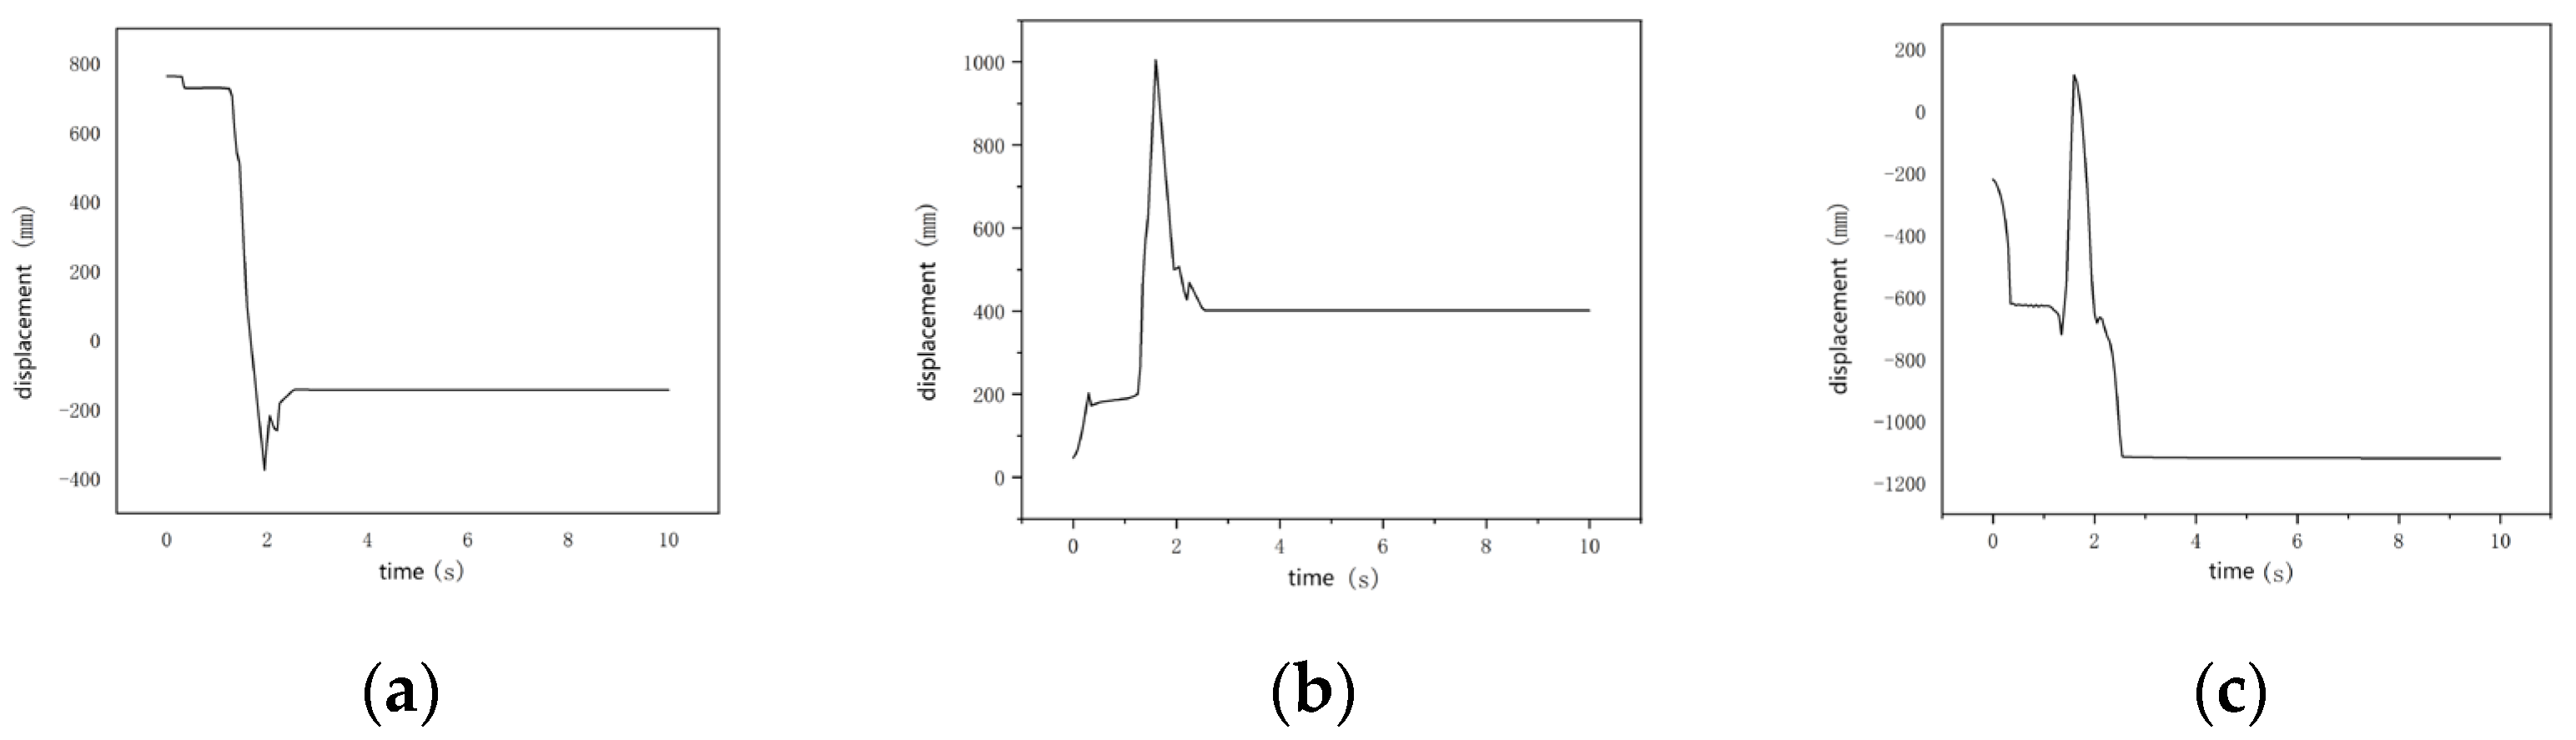
The X-axis direction is the direction of advancement along the screw shaft. As can be seen from Figure 12a and Figure 13a, during the movement of sand particles in the action area of the screen-cleaning spike teeth in the reverse direction of the X-axis, the displacement variation amplitude was small at within 0.25~1.70 s and increased between 1.70 s and 2.05 s probably because of the indirect contact between the screen-cleaning spike teeth and the sand particles. With the disturbance of the screen-cleaning spike teeth, the displacement of the sand particles under the applied force changed and the sand particles were discharged from the screen body gaps. After 2.55 s, the displacement in the X-axis direction no longer changed.
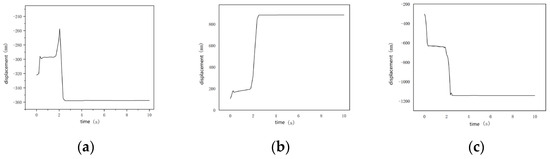
Figure 12.
Displacement of the sand particles in the action area of the screen-cleaning spike teeth. (a) X displacement. (b) Y displacement. (c) Z displacement.
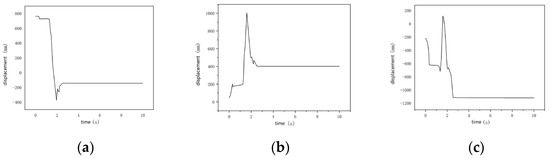
Figure 13.
Displacement of the sand particles in the action area of screw blade. (a) X displacement. (b) Y displacement. (c) Z displacement.
The displacement variation of sand particles in the screw action area over time was caused by the movement change trends in the forward direction and reverse direction of the X-axis. The displacement of sand particles showed variation in the forward direction of the X-axis within 0~1.65 s, and showed variation in the reverse direction of the X-axis after 1.65 s probably because the sand particles were tossed from the conveyor auger on one side to the conveyor auger on the opposite side and then were conveyed to the ground in the opposite auger, while the displacement in the X-axis direction no longer changed.
3.2.2. Analysis of Displacement Variation of Sand Particles along the Y-axis
The Y-axis direction is along the advancing direction of the machine. It can be seen from Figure 12b and Figure 13b that the sand particles in the action area of the screen-cleaning spike teeth and the screw action area all moved in the forward direction of the Y-axis with the change in time. The displacement variation amplitude of the sand particles in the action area of the screen-cleaning spike teeth first increased gently within 0~1.80 s, then increased sharply from 1.80 s to 2.50 s, and finally became stable and no longer changed after 2.50 s.
Within 0~1.60 s, the displacement of sand particles in the screw action area was consistent with the displacement in the action area of the screen-cleaning spike teeth; that is, there was first a gentle increase and then sharp increase probably because the sand particles were first transferred from the bottom end of the screw blade to the lateral end under the drive of the screw blade, and then were transferred from the lateral end of the blade and to the auger in the next stage under the action of centrifugal force, passing through the gaps of the screen body and finally falling to the ground. However, the displacement decreased after 1.60 s probably because the sand particles rebounded after they collided with and contacted the auger blades, rack, and other components.
3.2.3. Analysis of Displacement Variation of Sand Particles along the Z-axis
In the figure, the Z-axis is perpendicular to the ground, where the forward direction of the Z-axis is away from the ground and the reverse direction of the Z-axis approaches the ground. From Figure 12c and Figure 13c, it can be seen that the sand particles in the action area of the screen-cleaning spike teeth moved in the reverse direction of the Z-axis with the change in time, and the displacement variation gently decreased within 0.25~1.90 s, probably because there was still a sand layer between the sand particles and the surface of the screen body or the gaps of the screen body were blocked. With the movement of the screen-cleaning spike teeth, the structure of the sand layer was destroyed or the sand in the gaps of the screen body was cleared, and the sand particles were discharged to the ground through the gaps in the screen body. After 2.60 s, the displacement in the Z-axis direction no longer changed.
The displacement of the sand particles in the screw action area showed change trends of movement in the reverse direction of the Z-axis, forward direction of the Z-axis, and reverse direction of the Z-axis over time. To be specific, the displacement of the sand particles changed in the forward direction of the Z-axis within 1.45~1.60 s, probably because the sand particles moved towards the forward direction of the Z-axis under the vibration of the screen body. When they reached a certain position, under the action of gravity, the sand fell back to the screen surface in the reverse direction of the Z-axis and was discharged to the ground through the gaps in the screen body. After 2.60 s, the displacement in the Z-axis direction no longer changed.
In summary, it can be seen that the displacement of the sand particles in the action area of the screen-cleaning spike teeth and the screw action area in the Y-axis direction changed more significantly than in the X-axis direction and the Z-axis direction; that is, the sand could be conveyed stage by stage and out of the machine, finally falling to the ground. At the same time, it can be seen from the displacement variation in the X-axis direction that the sand particles could also be conveyed axially in the augers of the same stage, thus realizing the removal of the sand.
3.3. Bench Test
3.3.1. Test Materials and Equipment
In April 2023, experimental research on conveying and separating devices was carried out in the Soil Tank Performance Laboratory, the School of Mechanical and Electrical Engineering, Shihezi University. The tiger nut–root–sand complex material was spread in the soil tank test area according to the planting pattern. The test instruments and equipment included a soil tank test vehicle (TCC-3.0), an electronic scale (500 g, 100 kg), a three-phrase motor (type: YE3-132S-4, power: 5.5 KW, revolution speed: 1469 r/min), an HCNJ-101 dynamic torque sensor (range: 0~500 KN× m, accuracy: ±0.25%, Supplier: Beijing Haibohua Technology Co., Ltd., Beijing, China), a tape measure, a spade, a woven bag, and a Ziplock bag and marker. The device for the test was a self-built tiger nut harvest conveying and separating device. This device was equipped with a control system with the functions of single-stage auger speed adjustment and single-stage auger conveyance torque acquisition and was fitted with a sand collection tank, which can collect the sand discharged by the augers at all stages. The test site is shown in Figure 14.
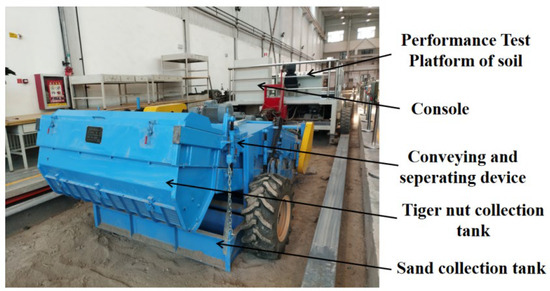
Figure 14.
The conveying and separating device for tiger nuts.
3.3.2. Test Scheme
Considering that the function of the conveyor augers in the first three stages is mainly to remove sand and that the mass of the corresponding mixture shows a decreasing trend, the speed of the screw conveyor in the first three stages was designed to decrease; that is, the speed of the screw conveyor in the first stage is the highest, followed by the speed in the second stage, and it is smallest in the third stage. At the same time, the speeds of the screw conveyor in the third, fourth, and fifth stages were set to be consistent. The speed ratio among the screw conveyor in the first, second, and third stages was set to be 1, 0.95, 0.9, 0.85, and 0.8, as shown in Table 5.
Table 5.
The proportioning of the speed ratio.
With key parameters such as the screw velocity ratio, amplitude, vibration frequency, and machine operation velocity as test factors, and the sand removal rate, crushing rate, and power consumption as test evaluation indicators, an orthogonal test was performed. The test factor levels and coding values are shown in Table 6.
Table 6.
Test factor levels and coding values.
3.3.3. Evaluation Indicators
(1) Sand removal rate
The sand removal performance was described based on paper [43] with the sand removal rate as an evaluation indicator. Supposing that the working width of the conveying and separating device is 1.6 m and the working depth is 0.15 m, the sand feed amount was theoretically calculated in m2, which is the target sand removal amount. The total mass m1 of sand discharged by the augers at all stages in the collection tank was weighed, which is the actual sand removal amount. The sand removal rate [44] was calculated according to the formula:
In Formula (19), R1 is the sand removal rate, %; m1 is the actual sand removal amount, kg; and m2 is the target sand removal amount, kg.
(2) Crushing rate
We referred to the national standard GB/T 21962−2020 and the literature [45] and used the tiger nut crushing rate as an evaluation indicator to describe the conveying performance. The nuts at the discharge port were collected and weighed (m3), crushed nuts were removed and their mass was weighed (m4), and the crushing rate was calculated according to the formula:
In Formula (20), R2 is the crushing rate, %; m3 is the mass of all nuts at the discharge port, g; and m2 is the mass of crushed nuts at the discharge port, g.
(3) Power consumption
With power consumption as an evaluation indicator, the conveying and sand removal performance was described. The torque values of the augers from torque sensors were obtained and the power consumption was calculated according to the following formula in combination with the set rotation speed of the screw shaft.
In Formula (21), R3 is the power consumption of the device in the working process, kW; T is the torque of all conveyor augers, Nm; and n is the speed of the screw shaft, r/min.
3.4. Test Results and Analysis
3.4.1. Test Design
According to the test factors and evaluation indicators set in the early stage, a four-factor five-level orthogonal test design was used in the Central Composite Design (CCD) module in the experimental design and analysis software Design Expert [46]. A total of 30 groups of tests were conducted, including 24 groups of analysis factor tests and 6 groups of center zero estimation error tests. Each group of tests was repeated three times, and the average value was calculated. During the test, the conveying and separating device was dragged by the soil tank test bench and the operating speed was adjusted by the soil tank test bench. The screw auger rotation speed and vibration frequency parameters were adjusted by the test device control system. The amplitude was adjusted by using vibration exciters of different sizes. The test arrangement and results are shown in Table 7.
Table 7.
Test arrangement and results.
3.4.2. Regression Variance Analysis of Conveying and Sand Removal Quality and Construction of Response Models
The results of the regression variance analysis of conveying and sand removal quality are shown in Table 8. It can be seen from the table that in the regression variance analysis of evaluation indicator R1, the p values of single factor X2 and interaction terms X3X4, X12, X22, and X42 are 0.0061, 0.0014, <0.0001, <0.0001, and 0.0014, respectively, much less than 0.01, and are highly significant influence factors of R1. The p values of single factors X3 and X4 and interaction terms X2X4 and X32 are 0.0171, 0.0338, 0.0375, and 0.0489, respectively, all within the range of 0.01~0.05, and are significant influence factors of R1. The p values of interaction terms X1X2, X1X3, X1X4, and X2X3 are all greater than 0.05, and are insignificant influence factors of R1. After ignoring the insignificant influence factors of R1, the highly significant and significant influence factors of R1 were sorted according to their p values as: X12 = X22 > X3X4 = X42 > X2 > X3 > X4 > X2X4 > X32.
Table 8.
Analysis of variance of measurement indexes.
As can be seen from Table 8, in the regression variance analysis of evaluation indicator R2, the p values of single factors X1, X3, and X4 and interaction terms X1X2, X12, and X22 are 0.0096, 0.0002, 0.0021, 0.0063, 0.0019, and 0.0094, respectively, all much less than 0.01, and are highly significant influence factors of R2. The p value of the interaction term X1X4 is 0.0139, within the range of 0.01~0.05, and is a significant influence factor of R2. The p values of the single factor X2 and interaction terms X1X3, X2X3, X2X4, X3X4, X32, and X42 are all greater than 0.05, and are insignificant influence factors of R2. After ignoring the insignificant influence factors of R2, the highly significant and significant influence factors of R2 were sorted according to p values as: X3 > X12 > X4 > X1X2 > X22 > X1 > X1X4.
As can be seen from Table 8, in the regression variance analysis of evaluation indicator R3, the p values of single factors X3 and X4 and interaction terms X1X2 and X1X4 are < 0.0001, <0.0001, 0.0004, and <0.00010, respectively, all much less than 0.01, and are highly significant influence factors. The p values of interaction terms X3X4, X12, and X22 are 0.0419, 0.0273, and 0.045, respectively, within the range of 0.01~0.05, and are significant influence factors of R3. The p values of single factors X1 and X2 and interaction terms X1X3, X2X3, X2X4, X32, and X42 are all greater than 0.05, and are insignificant influence factors of R3. After ignoring the insignificant influence factors of R3, the highly significant and significant influence factors of R1 were sorted according to p values as: X1 = X2 = X1X4 > X1X2 > X12 > X3X4 > X22.
Based on the results of the regression variance analysis, a regression model equation of conveying and sand removal evaluation indicators was established using the sand removal rate R1, crushing rate R2, and total power consumption R3 against test independent variables such as the screw velocity ratio X1, amplitude X2, vibration frequency X3, and machine operation velocity X4.
R1 = 90.71 + 1.15X1 + 1.48X2 + 1.24X3 + 1.08X4 − 0.26X1X2 − 0.021X1X3 − 0.49X1X4 + 0.093X2X3 − 1.30X2X4 − 2.22X3X4 − 2.38X12 − 2.65X22 − 0.93X32 − 1.69X42
R2 = 1.42 + 0.26X1 − 0.073X2 + 0.41X3 − 0.32X4 − 0.33X1X2 + 0.054X1X3 − 0.29X1X4 + 0.087X2X3 − 0.14X2X4 + 0.22X3X4 + 0.30X12 + 0.24X22 + 0.039X32 + 0.11X42
R3 = 2.51 + 0.024X1 − 5 × 10-3 X2 − 0.25X3 + 0.28X4 + 0.26X1X2 − 0.025X1X3 − 0.39X1X4 + 5 × 10-3X2X3 + 0.041X2X4 − 0.13X3X4 + 0.11X12 + 0.095X22 − 0.024X32 + 0.051X42
The significance of the influence of each variable in the regression equation on the indicators was determined by the F-test, and the smaller the probability p, the higher the significance of the corresponding variable. The p values of regression models R1, R2, and R3 are 0.0001, 0.0004, and <0.0001, respectively, all less than 0.01, indicating that the constructed regression models are highly significant, and the p values of lack-of-fit terms in the models are 0.0636, 0.3355, and 0.0944, respectively, all greater than 0.05; that is, the lack-of-fit terms are not significant. This indicates that the predicted values of the regression models have a good fit with the actual values within the test range. At the same time, the coefficients of determination of the models are 0.8852, 0.8596, and 0.911, respectively, and the coefficients of variation are 2.69%, 21.37%, and 8.44%, respectively, indicating that the regression models can explain the test data well, the predicted values are highly correlated with the actual values, and the constructed regression models can be used to analyze and predict the test evaluation indicators of conveying and sand removal quality.
3.5. Analysis of the Influence of the Interaction of Key Parameters of the Conveying Device on Conveying and Sand Removal Quality
As can be seen from Table 8: Results of regression variance analysis, the interaction factors with a highly significant or significant influence on evaluation indicator R1 are X2X4 and X3X4, respectively; the factors with a highly significant or significant influence on evaluation indicator R2 are X1X2 and X1 X4, respectively; and the factors with a highly significant or significant influence on evaluation indicator R3 are X1X2, X1X4, and X3X4, respectively. In the process of analyzing the influence of the interaction of key parameters of the device on the test evaluation indicators, the insignificant interaction factors were not considered. Only the influence law between the interaction factors with a highly significant or significant influence and the evaluation indicators of conveying and sand removal quality was analyzed, and the response surface diagram of each interaction term was extracted.
3.5.1. Analysis of the Influence Law of Significant Interaction Terms on the Sand Removal Rate Evaluation Indicator, R1
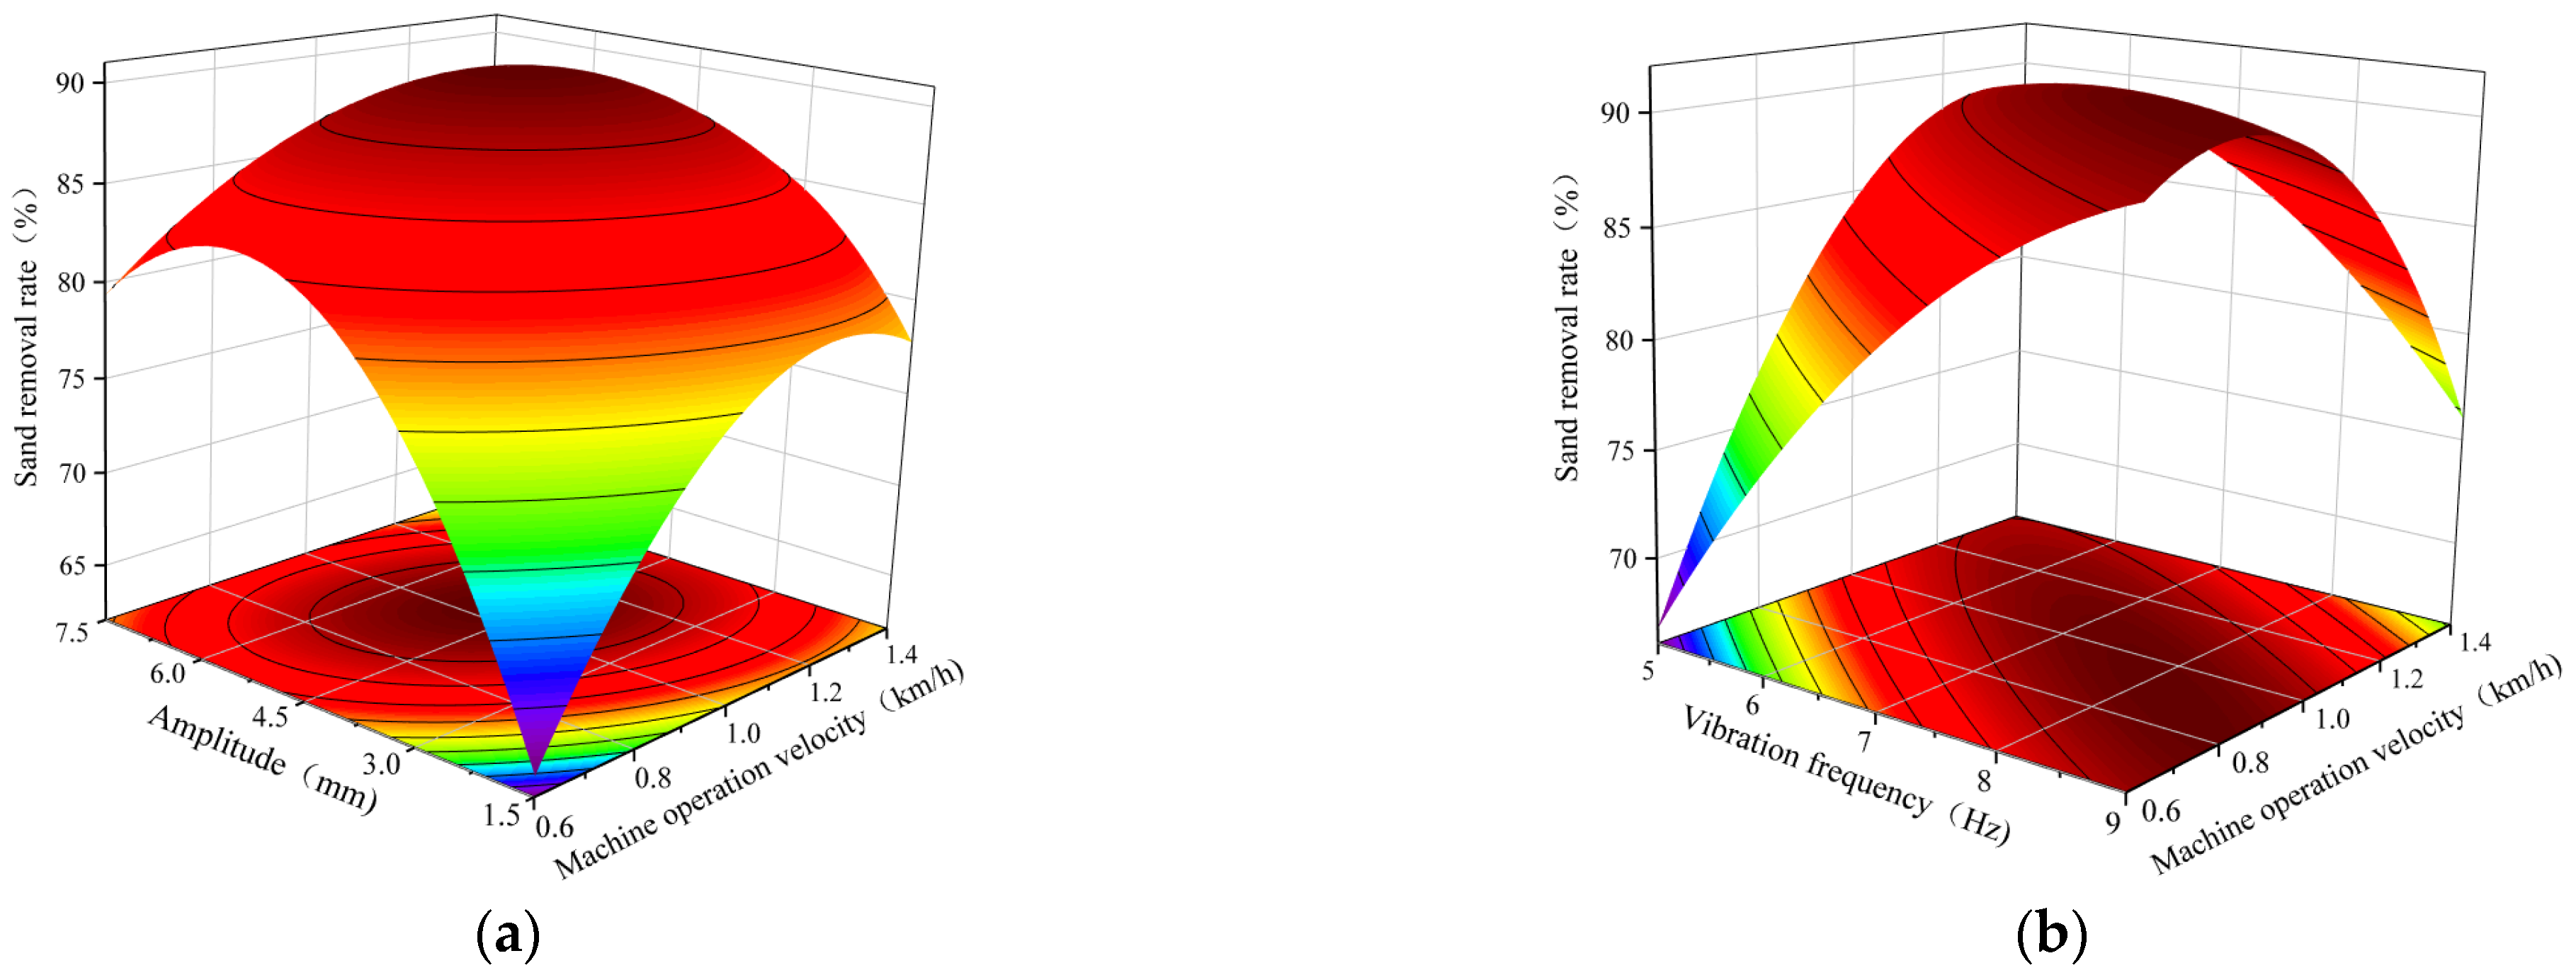
The analysis of the influence law of interaction term X2X4 on the evaluation indicator of the sand removal rate R1 is shown in Figure 15a. When amplitude X2 is 1.5 mm and the machine operation velocity increases from 0.6 km/h to 1.4 km/h, the sand removal rate shows a trend of a gradual increase. When the amplitude is 7.5 mm and the machine operation velocity increases from 0.6 km/h to 1.4 km/h, the sand removal rate shows a trend of first increasing then decreasing. It can be seen that when the amplitude is the largest, the sand removal rate can be increased by increasing the machine operation velocity.

Figure 15.
The influence of the interaction term on sand removal rate. (a) The influence law of interaction term X2X4 on the sand removal rate evaluation indicator, R1. (b) The influence law of interaction term X3X4 on the sand removal rate evaluation indicator, R1.
When the machine operation velocity X4 is 0.6 km/h and the amplitude increases from 1.5 mm to 7.5 mm, the sand removal rate shows a trend of first increasing and then decreasing. When the machine operation velocity X4 is 1.4 km/h and the amplitude increases from 1.5 mm to 7.5 mm, the sand removal rate also shows a trend of first increasing and then decreasing, indicating that when the machine operation velocity is the smallest or largest, its influence of the amplitude on the sand removal rate is significant.
The analysis of the influence law of interaction term X3X4 on the evaluation indicator of the sand removal rate R1 is shown in Figure 15b. When the vibration frequency X3 is 5 Hz and the machine operation velocity X4 increases from 0.6 km/h to 1.4 km/h, the sand removal rate shows a trend of a gradual increase. When the vibration frequency is 9 Hz and the machine operation velocity X4 increases from 0.6 km/h to 1.4 km/h, the sand removal rate shows a trend of a gradual decrease. To sum up, when the vibration frequency is small, the sand removal rate can be increased by increasing the machine operation velocity. When the vibration frequency is large, the sand removal rate can be increased by reducing the machine operation velocity.
When the machine operation velocity is 0.6 km/h and the vibration frequency increases from 5 Hz to 9 Hz, the sand removal rate shows a trend of a gradual increase. When the machine operation velocity is 1.4 km/h and the vibration frequency increases from 5 Hz to 9 Hz, the sand removal rate shows a trend of a gradual decrease. Thus, it can be seen that when the machine operation velocity is the largest, the sand removal rate can be increased by reducing the vibration frequency.
3.5.2. Analysis of the Influence Law of Significant Interaction Terms on the Evaluation Indicator Crushing Rate R2
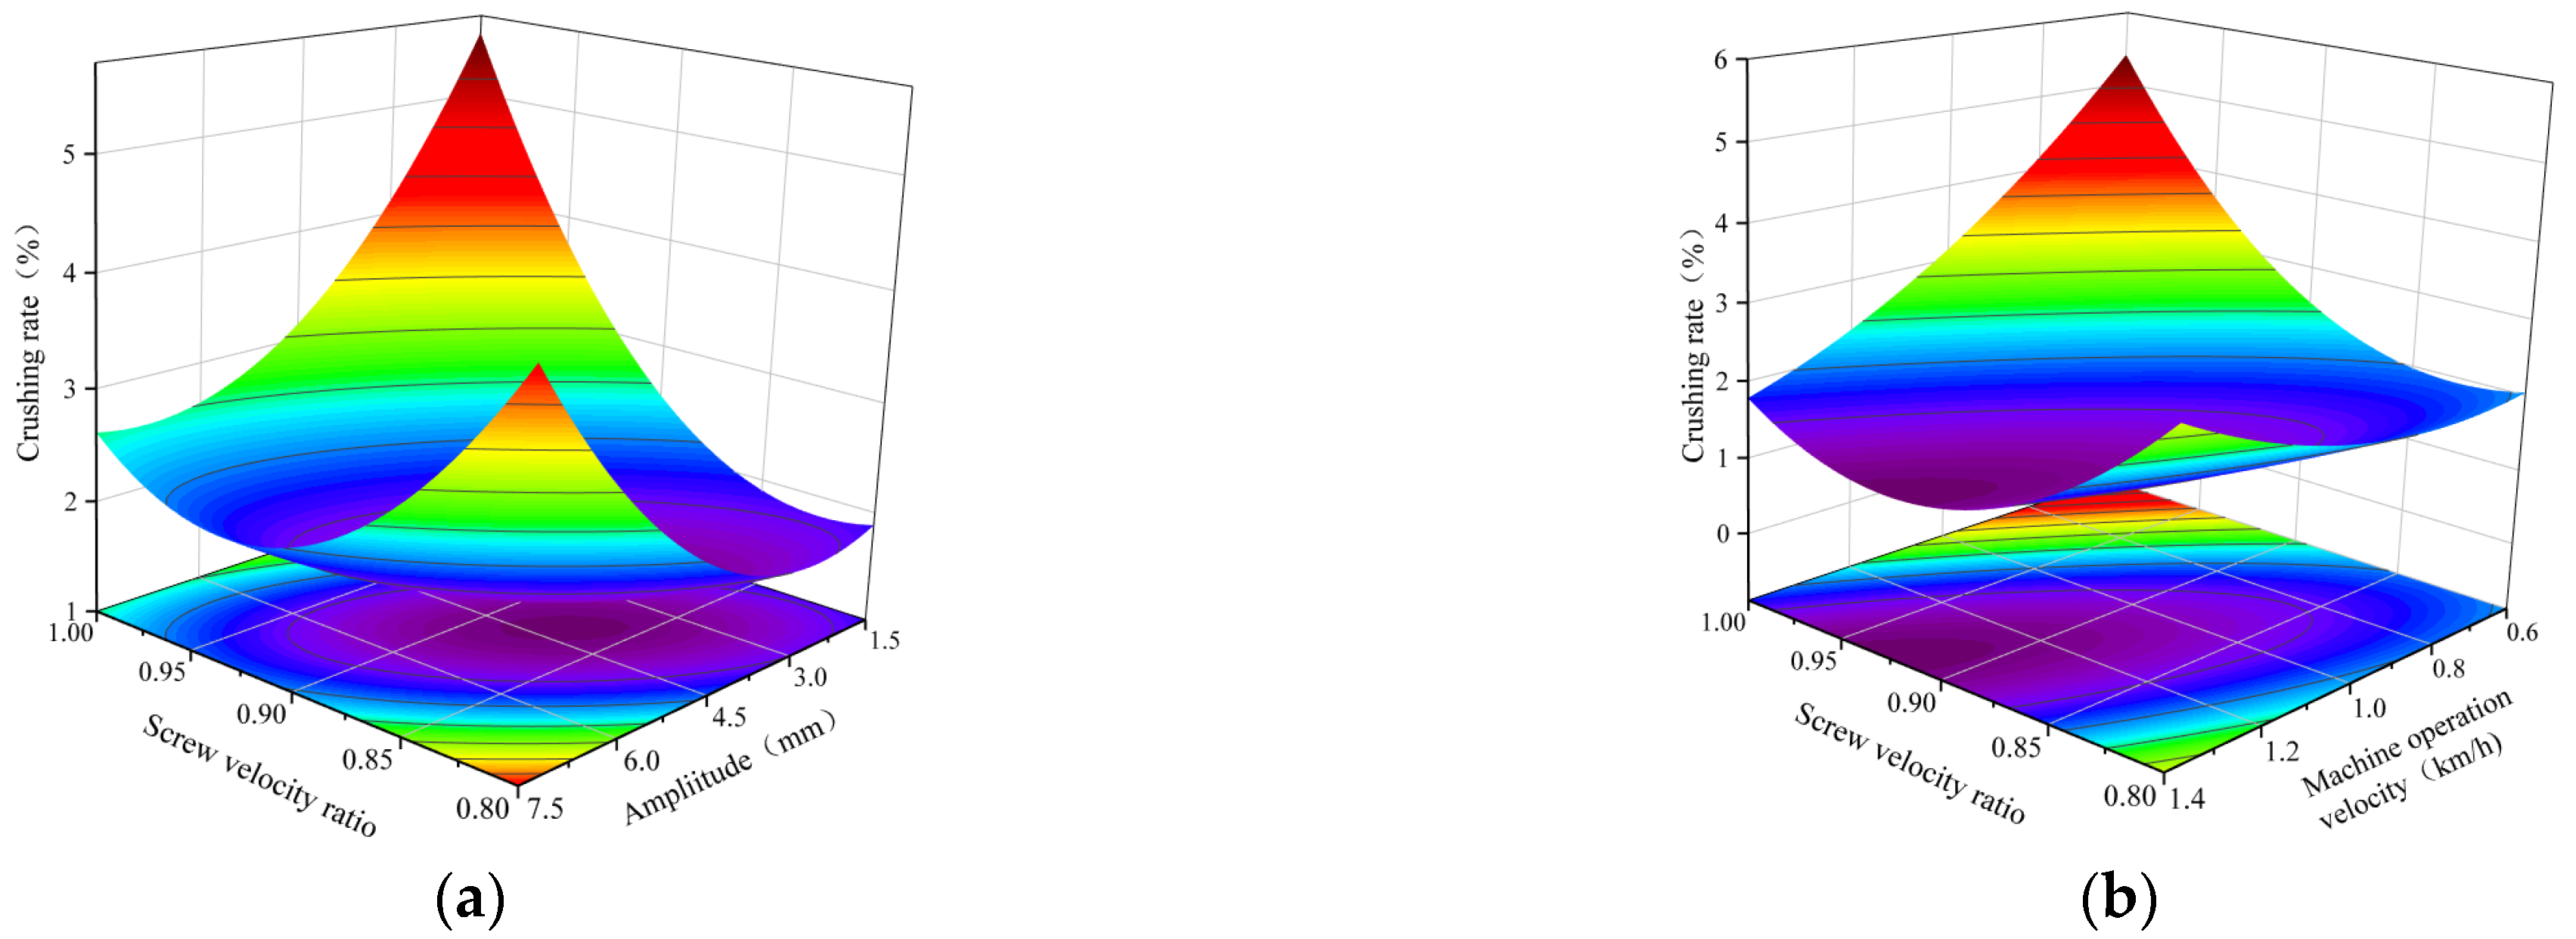
The analysis of the influence law of interaction term X1X2 on the sand removal rate evaluation indicator R2 is shown in Figure 16a. When the screw velocity ratio X1 is 0.8 and the amplitude X2 increases from 1.5 mm to 7.5 mm, the crushing rate shows a trend of a gradual increase. When the screw velocity ratio is 1 and the amplitude increases from 1.5 mm to 7.5 mm, the crushing rate shows a trend of a gradual decrease. To sum up, when the screw velocity ratio is small, the crushing rate can be reduced by reducing the amplitude. When the screw velocity ratio is large, the crushing rate can be reduced by increasing the amplitude.

Figure 16.
The influence of interaction terms on the crushing rate. (a) The influence of interaction term X1X2 on sand removal rate evaluation indicator, R2. (b) The influence of interaction term X1X4 on the sand removal rate evaluation indicator, R2.
When the amplitude is 1.5 mm and the screw velocity ratio increases from 0.8 to 1, the crushing rate shows a trend of a gradual increase. Thus, it can be seen that when the amplitude is small, the crushing rate can be reduced by reducing the amplitude and screw velocity ratio. When the amplitude is 7.5 mm and the screw velocity ratio increases from 0.8 to 1, the crushing rate shows a trend of first decreasing and then increasing.
The analysis of the influence law of interaction term X1X4 on the evaluation indicator of the sand removal rate R2 is shown in Figure 16b. When the screw velocity ratio X1 is 0.8 and the machine operation velocity X4 increases from 0.6 km/h to 1.4 km/h, the crushing rate shows a trend of a gradual increase. Thus, it can be seen that when the screw velocity ratio is small, the crushing rate can be reduced by reducing the machine operation velocity. When the screw velocity ratio is 1 and the machine operation velocity increases from 0.6 km/h to 1.4 km/h, the crushing rate shows a trend of a gradual decrease, indicating that when the screw velocity ratio is large, the crushing rate can be reduced by increasing the machine operation velocity.
When the machine operation velocity is 0.6 km/h and the screw velocity ratio increases from 0.8 to 1, the crushing rate shows a trend of a gradual increase. When the machine operation velocity is 1.4 km/h and the screw velocity ratio increases from 0.8 to 1, the crushing rate shows a trend of first decreasing and then increasing.
3.5.3. Analysis of the Influence Law of Significant Interaction Terms on the Total Power Consumption Evaluation Indicator, R3
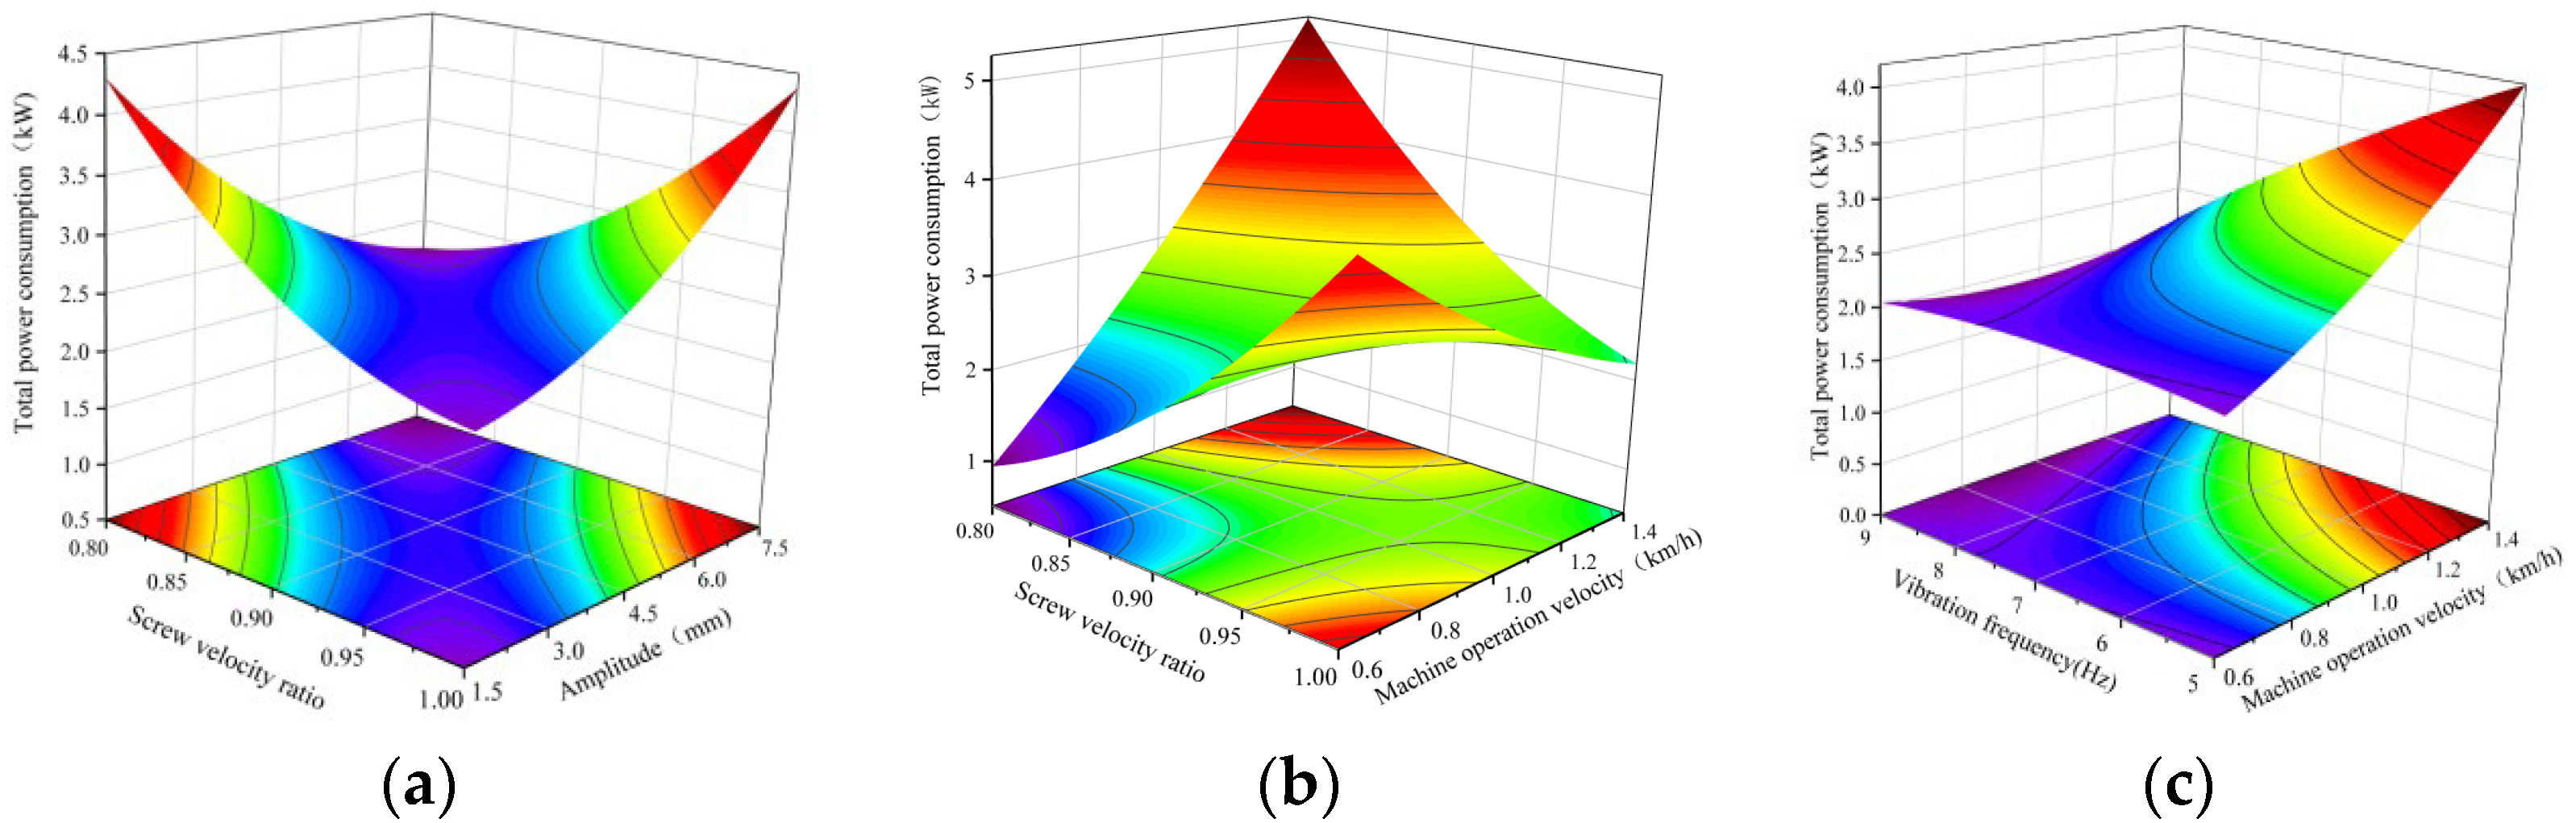
The analysis of the influence law of interaction term X1X2 on the total power consumption evaluation indicator R3 is shown in Figure 17a. When the screw velocity ratio X1 is 0.8 and the amplitude X2 increases from 1.5 mm to 7.5 mm, the total power consumption shows a trend of a gradual decrease. When the screw velocity ratio is 1 and the amplitude increases from 1.5 mm to 7.5 mm, the total power consumption shows a trend of a gradual increase. To sum up, when the screw velocity ratio is small, the total power consumption can be reduced by increasing the amplitude. When the screw velocity ratio is large, the total power consumption can be reduced by reducing the amplitude.

Figure 17.
The influence of interaction terms on the total power consumption. (a) The influence of interaction term X1 X2 on the total power consumption evaluation indicator, R3. (b) The influence of interaction term X1X4 on the total power consumption evaluation indicator, R3. (c) The influence of interaction term X3X4 on the total power consumption evaluation indicator, R3.
When the amplitude is 1.5 mm and the screw velocity ratio increases from 0.8 to 1, the total power consumption shows a trend of a gradual decrease. When the amplitude is 7.5 mm and the screw velocity ratio increases from 0.8 to 1, the total power consumption shows a trend of a gradual increase. To sum up, when the amplitude is small, the total power consumption can be reduced by increasing the screw velocity ratio. When the amplitude is large, the total power consumption can be reduced by reducing the screw velocity ratio.
In short, when the screw velocity ratio is small and the amplitude is large, another factor in the interaction term needs to be increased or reduced to obtain a lower power consumption. When the screw velocity ratio increases from 0.8 to 1 and the amplitude increases from 1.5 mm to 7.5 mm, the total power consumption shows a trend of first decreasing and then increasing.
The analysis of the influence law of interaction term X1X4 on the total power consumption evaluation indicator, R3, is shown in Figure 17b. When the screw velocity ratio X1 is 0.8 and the machine operation velocity X4 increases from 0.6 km/h to 1.4 km/h, the total power consumption shows a trend of a gradual increase. When the screw velocity ratio is 1 and the machine operation velocity increases from 0.6 km/h to 1.4 km/h, the total power consumption shows a trend of a gradual decrease. To sum up, when the screw velocity ratio is small, the operating power consumption can be reduced by reducing the machine operation velocity. When the screw velocity ratio is large, the operating power consumption can be reduced by increasing the machine operation velocity.
When the machine operation velocity is 0.6 km/h and the screw velocity ratio increases from 0.8 to 1, the total power consumption shows a trend of a gradual increase. When the machine operation velocity is 1.4 km/h and the screw velocity ratio increases from 0.8 to 1, the total power consumption shows a trend of a gradual decrease. To sum up, when the machine operation velocity is small, the total power consumption can be reduced by reducing the screw velocity ratio. When the machine operation velocity is large, the total power consumption can be reduced by increasing the screw velocity ratio.
In short, when the screw velocity ratio is small and the machine operation velocity is large, another factor in the interaction term needs to be reduced or increased to obtain a lower power consumption value. When the screw velocity ratio increases from 0.8 to 1 and the machine operation velocity increases from 0.6 km/h to 1.4 km/h, the total power consumption shows a trend of first increasing and then decreasing.
The analysis of the influence law of interaction term X3X4 on the total power consumption evaluation indicator R3 is shown in Figure 17c. When the vibration frequency X3 is 5 Hz and the machine operation velocity X4 increases from 0.6 km/h to 1.4 km/h, the total power consumption shows a trend of a gradual increase. This shows that when the vibration frequency is small, the power consumption can be reduced by reducing the machine operation velocity. When the vibration frequency is 9 Hz and the machine operation velocity increases from 0.6 km/h to 1.4 km/h, the total power consumption shows a trend of first decreasing and then increasing gently.
When the machine operation velocity is 0.6 km/h and the vibration frequency increases from 5 Hz to 9 Hz, the total power consumption shows a trend of a gradual decrease. When the machine operation velocity is 1.4 km/h and the vibration frequency increases from 5 Hz to 9 Hz, the total power consumption shows a trend of a gradual decrease. To sum up, when the machine operation velocity is small or large, the total power consumption can be reduced by increasing the vibration frequency.
3.6. Optimization and Test Verification of Target Parameters
3.6.1. Optimization of Target Parameters
By using the optimization function provided in the Design Expert software and taking the value ranges of the screw velocity ratio, amplitude, vibration frequency, and machine operation velocity as constraint conditions, the objective function was set based on the following evaluation indicators: maximum sand removal rate, minimum crushing rate and minimum total power consumption. The optimum combination of key parameters in the conveying and separating device was thus determined. The set objective function and constraint function are as follows.
Objective function
Constraint function
The optimum combination of influence factor parameters is as follows: screw velocity ratio of 0.88, amplitude of 4.7 mm, vibration frequency of 7.5 Hz, and machine operation velocity of 0.92 km/h. Under these combined conditions, the sand removal rate is 90.40%, the crushing rate is 1.66%, and the power consumption is 2.24 kW in theory.
3.6.2. Test Verification
In order to verify the reliability of the optimization results, the performance indicators of conveying and sand removal were verified in a test, and the optimum combination of operating parameters of the device was adjusted for a soil tank test. The test was repeated three times, and the average value of the test results was taken. The sand removal rate obtained from the test was 88.92%, the crushing rate was 1.71%, and the total power consumption was 2.29 kW. The errors from the predicted values were 1.6%, 3.0%, and 2.2%, respectively. The test verification results show that the regression model has good reliability, and the conveying and separating device can meet the sand removal requirements in the tiger nut harvesting process.
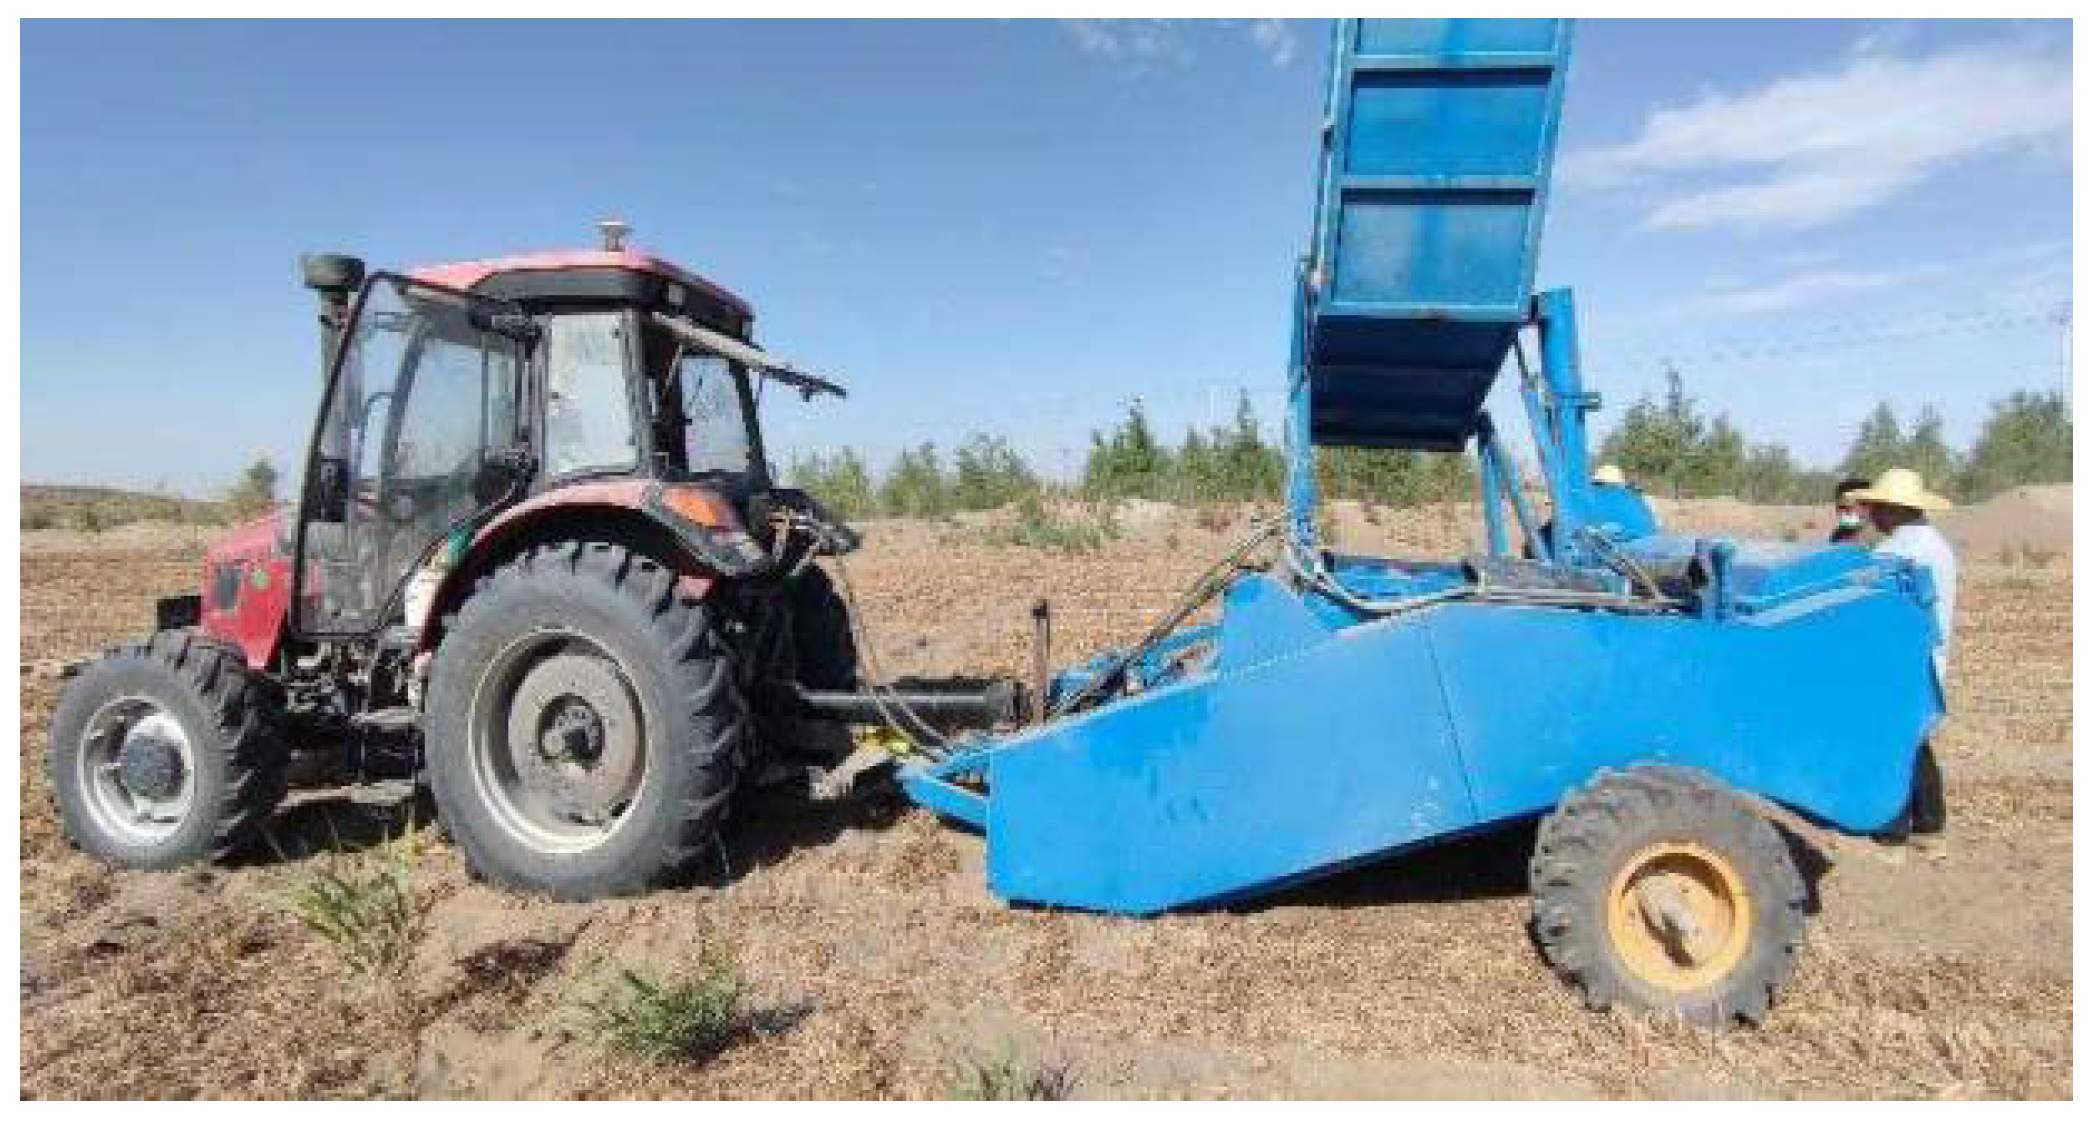
On this basis, with reference to the national standard GB/T5262-2008 [47] Measuring Methods for Agricultural Machinery Testing Conditions—General Rules and DB34/T 534-2022 [48] Technical Specification for Peanut Harvesting Mechanization, a field performance test was carried out in the 54th Regiment, the Third Division of Xinjiang Production and Construction Corps, as shown in Figure 18. The results showed that the conveying and separating device worked normally, and the average total loss rate was 1.8% and the crushing rate was 4.9%, meeting the design requirements.

Figure 18.
Test prototype.
4. Conclusions
- A conveying and separating device combining screw conveying and a vibrating screen was designed for tiger nut harvesting. The conditions of axial and radial migration under the screw action and of the separation under vibratory action were analyzed. By simulating the separating process, the conveying and separating law of materials was clarified, and the rationality of the design was verified.
- A four-factor, five-level orthogonal central composite test was conducted. The test results were analyzed via the regression variance analysis method, and relation models between variable factors and evaluation indicators were constructed. The verification test results show that under the combined conditions of a screw velocity ratio of 0.88, an amplitude of 4.7 mm, a vibration frequency of 7.5 Hz, and a machine operation velocity of 0.92 km/h, the theoretical sand removal rate was 90.40%, the crushing rate was 1.66%, and the power consumption was 2.24 kW.
- The optimized results were verified via testing. The sand removal rate was 88.92%, the crushing rate was 1.71%, and the total power consumption was 2.29 kW. The errors from the predicted values were 1.6%, 3.0%, and 2.2%, respectively. A field performance test was carried out, and the conveying and separating device worked normally, meeting the requirements of conveying and separation for tiger nut harvesting.
Author Contributions
Conceptualization, J.Q., S.C. and L.Y.; methodology, J.Q., L.Y., J.G. and W.C.; investigation, J.Q. and S.C.; data curation, J.Q., J.G. and S.C.; formal analysis, software, J.Q., L.Y., W.C. and J.G.; writing—review and editing, J.Q., J.G., S.C., W.C., L.Y., H.M. and Z.K.; project administration, J.Q.; funding acquisition, J.Q., H.M. and Z.K.; All authors have read and agreed to the published version of the manuscript.
Funding
This research was funded by the local science and technology development under the guidance of the central government (kc005102) and the project of Engineering Research Center for Production Mechanization of Oasis Special Economic Crop, Ministry of Education (PMOC2021A03) and the Third Division City Financial Science and Technology Plan Project (KJ2023CG01).
Data Availability Statement
The data presented in this study are available on request from the corresponding author.
Acknowledgments
The authors would like to thank the Engineering Research Center for Production Mechanization of Oasis Special Economic Crop, Ministry of Education, for its support.
Conflicts of Interest
The authors declare no conflicts of interest.
References
- Zhao, X.Q.; Liu, H.; Lu, Z.Y.; Cheng, Y.C.; Zhang, D.J.; Bai, F.F.; Fang, J.; Ren, Y.F. Cultivation technology of windbreak and sand fixation of Tiger nut L. on desertified and degraded land. Mod. Agric. 2019, 6, 12–13. [Google Scholar] [CrossRef]
- Wang, R.Y.; Wang, X.S.; Xiang, H. A multi–purpose novel oil crop—Cyperus nuts. China Oils Fats 2019, 44, 1–4. [Google Scholar] [CrossRef]
- Sun, R.; Zhong, P.; Liu, Z.D.; Gao, H.J.; Wang, R.D.; Li, W.; You, H.Y.; Song, X.Y.; Wang, X.L. Research Progress on Stress Resistance of Tiger nut under Abiotic Stress. Feed. Feed. 2023, 5, 32–35. [Google Scholar] [CrossRef]
- Ding, L.; Guo, H.Q.; Wang, W.Z.; Lv, Z.J.; Lv, Y.L.; Zhang, R.K. Design and Test of Tiger nut Cell–wheel Seed–metering Device with Low–position Seeding and Cavitation Function. Trans. Chin. Soc. Agric. Mach. 2022, 53, 86–97. [Google Scholar]
- Yang, X.D.; Li, Z.Y. Tigernut industry in China: Current status of development, potential and adaptive suggestions. Chin. J. Oil Crop Sci. 2022, 44, 712–717. [Google Scholar] [CrossRef]
- Di, Z.F.; Li, Q.L.; Jiang, W.; Zhang, Z.Q.; Zhang, H.; Li, N.; Cui, D.K.; Zhou, J. Research advance and perspective of Tiger nut planting and harvesting machinery technology and equipment. J. Shanxi Agric. Univ. Nat. Sci. Ed. 2022, 42, 96–106. [Google Scholar] [CrossRef]
- Zhao, Z.; He, X.N.; Wang, D.W.; Shang, S.Q.; Xu, N.; Zhu, H.; Zheng, X.S. Design and Test of the Anti–rotation Throwing Device of the Cyperus Edulis Combine Harvester. J. Agric. Mech. Res. 2023, 45, 172–176+182. [Google Scholar] [CrossRef]
- He, X.; Lv, Y.; Qu, Z.; Wang, W.; Zhou, Z.; He, H. Parameters optimization and test of caterpillar self–Propelled Tiger nut harvester hoisting device. Agriculture 2022, 12, 1060. [Google Scholar] [CrossRef]
- Liu, X.M.; Liu, Z.H.; Liang, Y.; Xiao, S.P. Development of multifunctional harvesting machine based on modular theory. Chin. Agric. Mech. 2012, 47–50. [Google Scholar] [CrossRef]
- Wanfangdata. Available online: https://d.wanfangdata.com.cn/patent/ChJQYXRlbnROZXdTMjAyMzA5MDESEENOMjAxODIxMTUxMDUwLlgaCDc2OW16bnR1 (accessed on 30 April 2019).
- Wanfangdata. Available online: https://d.wanfangdata.com.cn/patent/ChJQYXRlbnROZXdTMjAyMzA5MDESEENOMjAyMDEwNzczMDI5LjkaCHpzeTJvZzNl (accessed on 9 October 2020).
- Wanfangdata. Available online: https://d.wanfangdata.com.cn/patent/ChJQYXRlbnROZXdTMjAyMzA5MDESEENOMjAxNzEwMTIyMTc0LjkaCDdhNTVpZjU0 (accessed on 31 May 2017).
- Zhang, Z.G.; Wang, F.A.; Zhang, Y.C.; Zhang, D.; Tian, R. Design and Experiment of Self–propelled Panax notoginseng Harvester. Trans. Chin. Soc. Agric. Mach. 2016, 47, 234–240. [Google Scholar]
- Zhang, Z.G.; Du, Z.L.; Cui, Z.M.; Liu, W.J.; Pan, R. Motion Analysis and Simulation Test of Digging and Soil Separating Device of Panax notoginseng Harvester. J. Kunming Univ. Sci. Technol. Nat. Sci. 2019, 44, 41–51. [Google Scholar] [CrossRef]
- Wei, Z.C.; Li, H.W.; Su, G.L.; Sun, C.Z.; Liu, W.Z.; Li, X.Q. Development of potato harvester with buffer type potato–impurity separation sieve. Trans. Chin. Soc. Agric. Eng. Trans. CSAE 2019, 35, 1–11. [Google Scholar] [CrossRef]
- Lv, J.Q.; Tian, Z.E.; Wu, J.E. Design and experiment on 4U1Z vibrating potato digger. Trans. Chin. Soc. Agric. Eng. Trans. CSAE 2015, 31, 39–47. [Google Scholar] [CrossRef]
- Wei, H.A.; Zhang, J.L.; Yang, X.P.; Huang, X.L.; Dai, L.X.; Sun, G.H.; Liu, X. Improved design and test of 4UFD–1400 type potato combine harvester. Trans. Chin. Soc. Agric. Eng. Trans. CSAE 2014, 30, 12–17. [Google Scholar] [CrossRef]
- Hu, Z.C.; Chen, Y.Q.; Wang, H.O. Design and experimental research on vibrating type peanut harvester. Trans. CSAE 2008, 24, 14–117. [Google Scholar]
- Wang, D.W.; Shang, S.Q.; Li, X.; Gao, D.X. Type–L Cleaning Separation Mechanism of Peanut Combine Harvester. Trans. Chin. Soc. Agric. Mach. 2013, 44, 68–74+51. [Google Scholar] [CrossRef]
- Liao, X.T.; Xiao, F.Z.; Wang, K.P.; Cai, Y.; LI, D.D. Technical features and useing adjustment of 4HZJ–2500 type self–propelled peanut picking harvester. Agric. Henan 2023, 2, 56–58. [Google Scholar] [CrossRef]
- Lian, G.D.; Zong, W.Y.; Feng, W.; Ma, L.N.; Cheng, Y.F.; Wei, X.X. Design and Experiment of Cutting Threshing Integrated Type Header for Harvesting of Edible Sunflower. Trans. Chin. Soc. Agric. Mach. 2023, 54, 122–131+154. [Google Scholar]
- Jiang, E.C.; Su, X.L.; Wang, M.F.; Xiong, L.M.; Zhao, C.; Xu, X.W. Design of Variable Pitch Spiral Conveyor for Biomass Continual Pyrolysis Reactor. Trans. Chin. Soc. Agric. Mach. 2013, 44, 121–124. [Google Scholar] [CrossRef]
- Huang, X.Q. Transport Machinery Selection and Design Manual; Chemical Industry Press: Beijing, China, 2011. [Google Scholar]
- Hou, S.Y.; Chen, H.T. Parameters optimization of vertical axial flow thresher for soybean breeding. Trans. Chin. Soc. Agric. Eng. (Trans. CSAE) 2012, 28, 19–25. [Google Scholar] [CrossRef]
- Mei, X.; Zheng, Y.; Liu, H.Y.; Dong, D.S. Kinematic Analysis of Particles in the Vertical Screw Conveyor. Mach. Des. Manuf. 2017, 7, 26–29. [Google Scholar] [CrossRef]
- Lian, G.D.; Wei, X.X.; Ma, L.N.; Zhou, G.H.; Zong, W.Y. Design and experiments of the axial–flow spiral drum threshing device for the edible sunflower. Trans. Chin. Soc. Agric. Eng. Trans. CSAE 2022, 38, 42–51. [Google Scholar] [CrossRef]
- Huang, J.Y. Design and Analysis of Spiral Fruit and Vegetable Waste Compressor. Master’s Thesis, Xi’an University of Technology, Xi’an, China, 2021. [Google Scholar] [CrossRef]
- Jin, C.H.; Zhang, Z.; Liu, S.; Zhou, W.J.; Fu, J. Design of a Delayed Tumbling Device for Screening Inferior Cigarette Paper Flowers and Tobacco Shreds. Plant Maint. Eng. 2023, 4, 133–135. [Google Scholar] [CrossRef]
- Feng, X. Study on Working Mechanism and Structural Optimization Design of Cleaning Device in Maize Grain Combine Harvester. Ph.D. Thesis, Northeast Agricultural University, Harbin, China, 2020. [Google Scholar] [CrossRef]
- Sun, H. Principle of Mechanics; Higher Education Publishing House: Beijing, China, 2013. [Google Scholar]
- Cheng, Y.F. Structural Optimization Design and Modal Analysis of Linear Vibrating Screen. Master’s Thesis, Taiyuan University of Technology, Taiyuan, China, 2015. [Google Scholar]
- Zeng, J. Research on Vibrating Screen Driven by Eccentric Cam Mechanism. Master’s Thesis, Southwest Petroleum University, Chengdu, China, 2019. [Google Scholar] [CrossRef]
- Xu, T.H. A comparative study on the efficiency of vibration screening parameters based on EDEM. China South Agric. Mach. 2024, 55, 166–168. [Google Scholar] [CrossRef]
- Hou, J.M.; Ren, Z.T.; Zhu, H.J. Design and Test of double–layer inclined vibrating Air–screen Castor cleaning device. Trans. Chin. Soc. Agric. Mach. 2022, 53, 39–51. [Google Scholar] [CrossRef]
- Zheng, X.S.; Shang, S.Q.; Wang, D.W.; Li, C.P.; Li, M.H.; Shen, S.L.; Zhao, Z.L.; He, X.N. Design analysis and test of air–screen type oil sedge cleaning device. J. Agric. Mech. Res. 2024, 46, 146–153+159. [Google Scholar] [CrossRef]
- Jin, T.C. Development of a Potato Soil Vibration Separation Test Platform for Mechanized Harvesting of Potatoes. Master’s Thesis, Shenyang Agricultural University, Shenyang, China, 2023. [Google Scholar] [CrossRef]
- Qi, J.T.; An, S.G.; Kan, Z.; Meng, H.W.; Li, Y.P.; Zhao, X.Y. Discrete element–based calibration of simulation parameters of Cyperus esculentus L. (Tiger nut) planted in sandy soil. J. Food Process. Preserv. 2021, 45, e15631. [Google Scholar] [CrossRef]
- Ucgul, M.; Fielke, J.M.; Saunders, C. Three–dimensional discrete element modeling of tillage: Determination of a suitable contact model and parameters for a cohesionless soil. Biosyst. Eng. 2014, 121, 105–117. [Google Scholar] [CrossRef]
- Ucgul, M.; Fielke, J.M.; Saunders, C. Defining the effect of sweep tillage tool cutting edge geometry on tillage forces using 3D discrete element modeling. Inf. Process. Agric. 2015, 2, 130–141. [Google Scholar] [CrossRef]
- Zhang, R.; Han, D.L.; Ji, Q.L.; He, Y.; Li, J.Q. Calibration Methods of Sandy Soil Parameters in Simulation of Discrete Element Method. Trans. Chin. Soc. Agric. Mach. 2017, 48, 49–56. [Google Scholar] [CrossRef]
- Dun, G.Q.; Yu, C.L.; Yang, Y.Z.; Ye, J.; Du, J.X.; Zhang, J.T. Parameter simulation optimization and experiment of seed plate type hole for soybean breeding. Trans. Chin. Soc. Agric. Eng. 2019, 35, 62–73. [Google Scholar] [CrossRef]
- Hao, J.J.; Nie, Q.L.; Ma, L.P.; Li, J.C.; Song, Y.H.; Long, S.F. Development of cone disc type shelling mechanism for pcanut seeds. Trans. Chin. Soc. Agric. Eng. 2020, 36, 27–34. [Google Scholar] [CrossRef]
- Wang, F.A.; Wen, B.; Xie, X.D.; Xie, K.T.; Guo, S.W.; Zhang, Z.G. Operation Mechanism Analysis and Parameter Optimization of Conveying and Separating Device of Panax notoginseng Harvester. Trans. Chin. Soc. Agric. Mach. 2023, 54, 201–211+259. [Google Scholar] [CrossRef]
- Jin, Z. Simulation and Experiment of the Conveying and Removing Device on Corn Stalk Granulator. Master’s Thesis, Shenyang Agricultural University, Shenyang, China, 2021. [Google Scholar] [CrossRef]
- Lv, J.Q.; Sun, H.; Dui, H.; Peng, M.M.; Yu, J.Y. Design and Experiment on Conveyor Separation Device of Potato Digger under Heavy Soil Condition. Trans. Chin. Soc. Agric. Mach. 2017, 48, 146–155. [Google Scholar] [CrossRef]
- Zhang, S.W.; Zhang, R.Y.; Cao, Q.Q.; Zhang, Y.; Fu, J.; Yuan, H.F. Design and Experiment of Double–deck Roller Sieve Type Fruit Impurity Separation Device for Tiger nut Harvester. Trans. Chin. Soc. Agric. Mach. 2023, 54, 148–157. [Google Scholar]
- GB/T 5262-2008; Agricultural Machinery Testing Conditions-General Rules for Measuring Methods. Standards Press of China: Beijing, China, 2008. Available online: https://openstd.samr.gov.cn/bzgk/gb/newGbInfo?hcno=24242BA41C6C88B16F72B808459C3A4F (accessed on 10 February 2024).
- DB34/T 534-2022; Technical Specification for Peanut Harvesting Mechanization. Anhui Market Supervision Administration Bureau: Anhui, China, 2022. Available online: http://down.foodmate.net/standard/sort/15/118034.html (accessed on 10 February 2024).


Disclaimer/Publisher’s Note: The statements, opinions and data contained in all publications are solely those of the individual author(s) and contributor(s) and not of MDPI and/or the editor(s). MDPI and/or the editor(s) disclaim responsibility for any injury to people or property resulting from any ideas, methods, instructions or products referred to in the content. |
© 2024 by the authors. Licensee MDPI, Basel, Switzerland. This article is an open access article distributed under the terms and conditions of the Creative Commons Attribution (CC BY) license (https://creativecommons.org/licenses/by/4.0/).