Article

Examining the Percent Canopy Cover and Health of Winter Wheat in No-Till and Conventional Tillage Plots Using a Drone

Department of Agricultural Science and Engineering, College of Agriculture, Tennessee State University, Nashville, TN 37209, USA
*
Author to whom correspondence should be addressed.
Agriculture 2024, 14(5), 760; https://doi.org/10.3390/agriculture14050760
Submission received: 28 February 2024 / Revised: 1 May 2024 / Accepted: 9 May 2024 / Published: 14 May 2024
(This article belongs to the Section Digital Agriculture)

Abstract

:
The percent canopy cover and health of winter wheat are important crop performance indicators. Thus, understanding how tillage management practices affect these indicators is beneficial for improving crop performance and consequently yield. The availability of high-resolution drone data with spectral characteristics provides an opportunity to examine the percent canopy cover and health of winter wheat in different tillage systems. This is because the use of drones provides real-time high spatial resolution and temporal images to effectively monitor winter wheat conditions throughout the growing season. Nonetheless, very limited studies have utilized drone data for assessing the percent canopy cover and health conditions of winter wheat for different tillage practices. This study aimed to examine the percent canopy cover and health of winter wheat in no-till and conventional tillage plots using a drone. We used the mean Normalized Difference Vegetation Index (NDVI) ± Standard Deviation (SD) (0.89 ± 0.04) of winter wheat for the growth stages of tillering, jointing, and boot/heading to generate the percent wheat canopy cover. The Normalized Difference Red-Edge (NDRE) produced for winter wheat at the middle and late growth stages was used as a proxy for wheat health condition. We found that the mean percentage canopy cover of winter wheat was about 4% higher in no-till compared to conventional tillage plots in most of the growing season. The mean NDRE ± standard error (SE) of winter wheat was about 0.44 ± 0.01 and 0.43 ± 0.01 for no-till and conventional tillage plots, respectively, during the mid- and late growth stages. There was no significant difference in either the percent canopy cover or health of winter wheat between no-till and conventional tillage plots. The results generated in this study could be used to support farmers’ decision-making process regarding tillage practices and wheat crop performance.

1. Introduction

Winter wheat is an important small grain crop that is generally used worldwide to enhance food security [1,2]. For example, in the United States (US), wheat is ranked third among field crops in production, planted acreage, and gross farm receipts after corn and soybeans. Farmers supplied about 1.8 billion bushels of wheat from 37.3 million acres of harvested area in the year 2023/2024 [3].
The percent canopy cover and health of winter wheat are essential performance characteristics for understanding crop physiological condition, biomass, and yield potential [4,5,6]. Drone multispectral images could be easily used to infer the percent canopy cover and health of winter wheat. This is because wheat responds differently to spectral reflectance information from drones [7]. Based on wheat reflectance data, the percent canopy cover and health could be easily determined and monitored in agricultural fields. Vegetation indices derived from spectral bands such as the Normalized Difference Vegetation Index (NDVI) and Normalized Difference Red-Edge (NDRE) are generally used as proxies for crop condition and structure that include but are not limited to canopy cover and crop health [8,9,10]. The NDVI is a ratio of red (640–670 nm) and near-infrared (850–880 nm) spectral bands [11,12], whereas the NDRE is a ratio of red-edge (670–780 nm) and near-infrared (850–880 nm) spectral bands [13,14]. Although the NDVI and NDRE are generally correlated, leaves are more translucent to red-edge light than red light. When the NDVI becomes saturated at the middle and late crop growth stages due to the presence of dense vegetation, the NDRE is less prone to saturation at these growth stages. This is because the red-edge wavelength in the NDRE goes through crop leaves much more deeply than the red wavelength in the NDVI at the middle and late growth stages of crops [15,16,17]. Hence, the NDRE is more appropriate for the middle and late growth stages of crops. At these stages, crops must have accumulated excessive amounts of chlorophyll in leaves, resulting in a low penetration of the red light. If there is plant stress due to poor irrigation, disease, nitrogen deficiency, and pests, the NDRE is a better proxy to detect these changes relative to the NDVI. For example, Boiarskii and Hasegawa [15] compared differences in crop vegetation activities for the NDVI and NDRE. They found a uniform distribution of the NDVI with a visible green color wherever vegetation was present. They also found no reduced greenery with NDVI values wherever vegetation was present. In contrast, the NDRE showed lower values in crop vegetation with low chlorophyll content and in areas where less nitrogen was applied.
The NDVI provides a good indicator of crop health (chlorophyl content in leaves) in the early and middle crop growth stages, whereas the NDRE provides a sensitive indicator of crop health in the middle and late crop growth stages that includes but is not limited to the concentration of chlorophyll in leaves, the density of leaves, and soil background effects [15]. High NDRE values imply the crop is healthier with high chlorophyll content in leaves, a high density of leaves, and an abundance of nitrogen in the leaves. In contrast, low NDRE values indicate the crop is less healthy with low chlorophyll content in leaves, a low density of leaves, and a deficiency of nitrogen in the leaves [15].
Soil tillage is a farm management practice that involves the mechanical alteration of soil for crop growth and production [18]. No-till generally refers to conservation tillage that allows for a minimum of 30% of the surface of the soil covered with crop residue after planting to minimize soil erosion [18,19]. In contrast, conventional tillage involves the flipping of the topsoil layer and breaking up the soil into tiny bits [20]. This results in a significant soil disturbance issue whereby the top layer of the field’s plants decays and degrades thereby releasing carbon dioxide and methane in the process [20]. The benefits of no-till over conventional tillage include but are not limited to (1) the low cost of cultivation, (2) reducing the soil temperature because of crop residues acting as insulators, (3) the sequestration of carbon, and (4) soil moisture conservation [19,21,22].
Both no-till and conventional tillage management procedures can create changes in soil physical characteristics [23,24]. Soil tillage could affect bulk density, and this can directly affect crop establishment, seedling emergence, root growth, porosity, water infiltration, and crop production. Furthermore, no-till has been found to create more stable aggregates in the soil upper horizon thereby leading to high total porosity [25].
Soil tillage procedures such as no-till and conventional tillage have also been found to affect the productivity of wheat. For example, Latifmanesh et al. [26] examined wheat biomass production and yield in different soil tillage systems. They found through field experiments that no-till and subsoiling with rotary tillage stimulated wheat biomass production. Furthermore, they also found that wheat yield was the highest in no-till and subsoiling with rotary tillage relative to strip rotary tillage and rotary tillage [26].
In contrast, Yan et al. [27] evaluated the effects of no-till, subsoil tillage, and deep tillage on the productivity of wheat. Their results indicated that subsoil tillage and deep tillage improved wheat grain yield relative to no-till [27]. Similarly, Kraska et al. [28] conducted experiments to understand the effects of tillage practices on wheat yield and health (diseases). They found that plough tillage increased wheat ear density, grain number per ear, and consequently yield relative to conservation tillage. However, their findings showed that the health of winter wheat was not altered by plough and conservation tillage practices [28].
Soil tillage systems have also been found not to significantly affect the yield of winter wheat [29,30]. For example, De Carcer et al. [29] combined the effects of crop succession and soil tillage systems, i.e., lowest tillage vs. highest tillage on wheat yield, and soil properties at three soil depths (0–10, 10–20, and 20–50 cm). They found that soil tillage systems had no significant effect on wheat yield for the periods from 1977 to 2016.
Other recent studies have explored how tillage systems alter crops’ spectral response such as the NDVI [31,32]. For example, Martins et al. [31] examined the effect of three tillage procedures (no-tillage, smallest tillage, and regular tillage) on the spectral response of the bean crop. They found no significant influence of tillage systems on NDVI values.
Although several recent studies have explored the effect of tillage practices on crop yield and spectral response, very limited studies have examined percent wheat canopy cover in no-till and conventional tillage practices using drones. Furthermore, examining wheat health condition with tillage systems using drones has also been very limited. The goal of this study is to examine the percent canopy cover and health of winter wheat in no-till and conventional tillage plots using a drone. Central to this goal is to understand if no-till and conventional tillage practices influence the percent wheat canopy cover and health (the chlorophyll content, density of leaves, and nitrogen deficiency in leaves).

2. Materials and Methods

2.1. Study Area

We conducted the study in about a 4047 m2 plot situated at Tennessee State University’s (TSU) campus farm site in Davidson County, Tennessee. The location is situated from around latitude 36°10′33″ to 36°10′35″ N and from longitude 86°49′35″ to 86°49′38″ W (Figure 1).

2.1.1. Climate

The study location generally experiences cool winters and warm summers. The mean annual temperature in the summer is around 78 °F (26 °C), whereas the mean annual temperature in the winter is about 41 °F (5 °C) [33]. The mean yearly precipitation is approximately 51 inches (1300 mm), and it is usually distributed evenly throughout the seasons [33]. The month of May usually experiences the largest amount of precipitation, while October receives the smallest amount of precipitation [34].

2.1.2. Soil and landscape

The soil class for the plot location is predominantly Byler silt loam that is moderately acidic. The soil is extremely deep and moderately well drained. Byler silt loam soil consists of a friable, moderately medium, and subangular blocky structure, with fine roots and little brown clay films that are distinct on surfaces of peds. It is established in silty alluvium and underlying clayey residues of limestone. The depth of bedrock is more than 60 inches. The texture of the silty mantle over clayey limestone residue varies from around 3 to 6 feet [35]. The plot is situated on a very gentle landscape with a less than 5 percent slope [33].

2.2. Methodology

The methodology mainly involved the growing of winter wheat in no-till and conventional tillage plots. Multispectral and temporal drone data were acquired for the winter wheat plots. The drone data acquired were used to generate NDVI and NDRE images for the growth stages of winter wheat. The NDVI images were overlaid with pure winter wheat polygons to obtain wheat NDVI values. The NDVI images were then reclassified based on the wheat NDVI values to generate wheat canopy cover maps. The wheat canopy cover maps were overlaid with no-till and conventional tillage subplot polygons to estimate the percentage of wheat canopy cover. The drone NDRE images were overlaid with wheat canopy cover maps to generate the NDRE values for the middle and late stages of winter wheat (Figure 2). A non-parametric (Mann–Whitney U test) test was used to test for a significant difference in the percent canopy cover and health of winter wheat in no-till versus conventional tillage plots. The test was performed with a total sample size of one hundred and twenty (n = 120) for the mean wheat percent canopy cover and eighty (n = 80) for the mean wheat NDRE. The test was performed with power ≥ 80%.

2.2.1. Growing of Winter Wheat

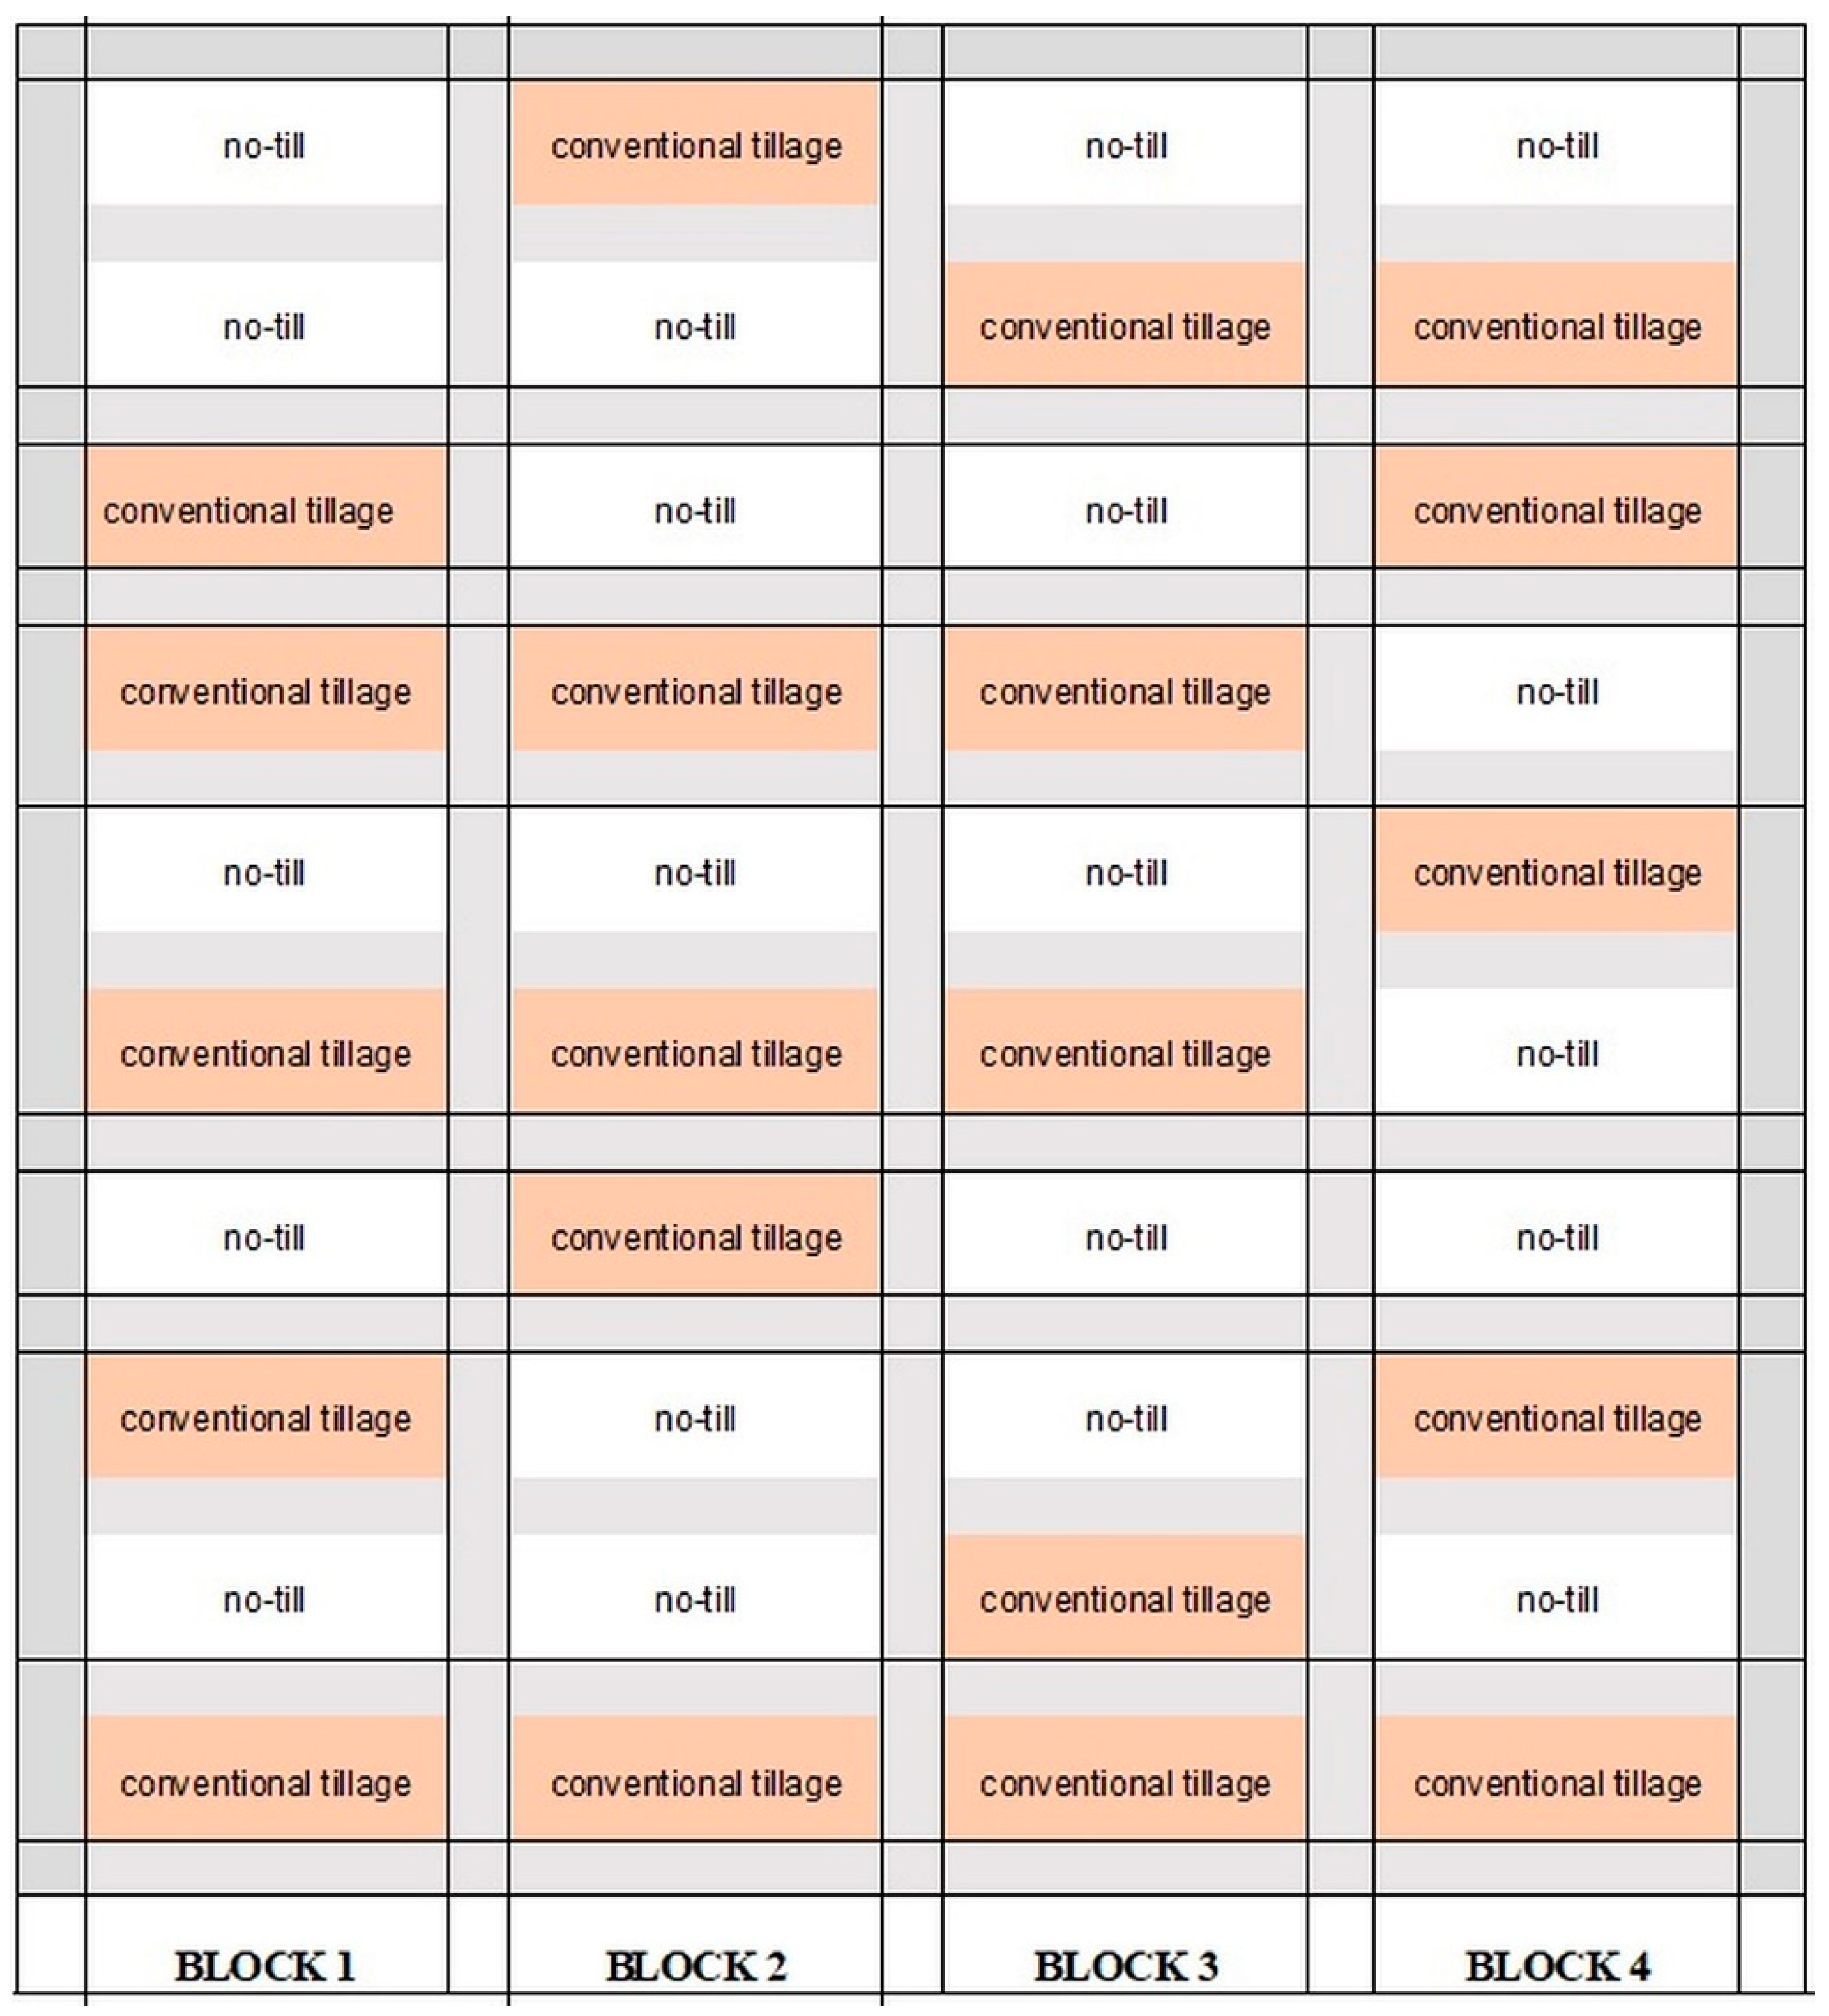
We established no-till and conventional tillage plots for the growing of winter wheat. Each plot size was 6 m by 6 m, and the plots were randomly assigned for each block. There were four blocks in total, and each block had a no-till and conventional tillage plot replicated four times (Figure 3). The plots and the blocks were separated by a 1.5 m alleyway.
A total of 20 no-till plots (n = 20) and 20 conventional tillage plots (n = 20) were used in the experiment. Based on a power analysis (assuming α = 0.05, 2-tailed) with preliminary mean wheat percent canopy cover data for no-till and conventional tillage plots, we found that at least 18 plots per treatment were needed to achieve power ≥ 0.8.
The no-till and conventional tillage plots were identified and prepared for the planting of winter wheat. A rotary cutter mower was used to cut down existing plots’ vegetation. Samples of soil were gathered from the plot location to analyze soil moisture (gravimetric method), particle size, pH, and nutrient recommendations for winter wheat. The initial weeds on the plots were controlled by applying a non-selective herbicide (2 percent Roundup®) (Monsanto, Creve Coeur, MO, USA) a few weeks before wheat planting. The conventional tillage plots were tilled by using a bush hog tiller. The wheat variety “VNS” was planted in the no-till and conventional tillage plots on 19 October 2022, using a no-till planter/drill. The winter wheat seeds were planted in an east-to-west direction. About 45 kg of nitrogen was added to the wheat plots during the tillering growth stage as per recommendations from the soil tests. The killing of the winter wheat was conducted on 10 June 2023. This was conducted by cutting the winter wheat with a rotary cutter mower.

2.2.2. Estimation of Percent Wheat Canopy Cover

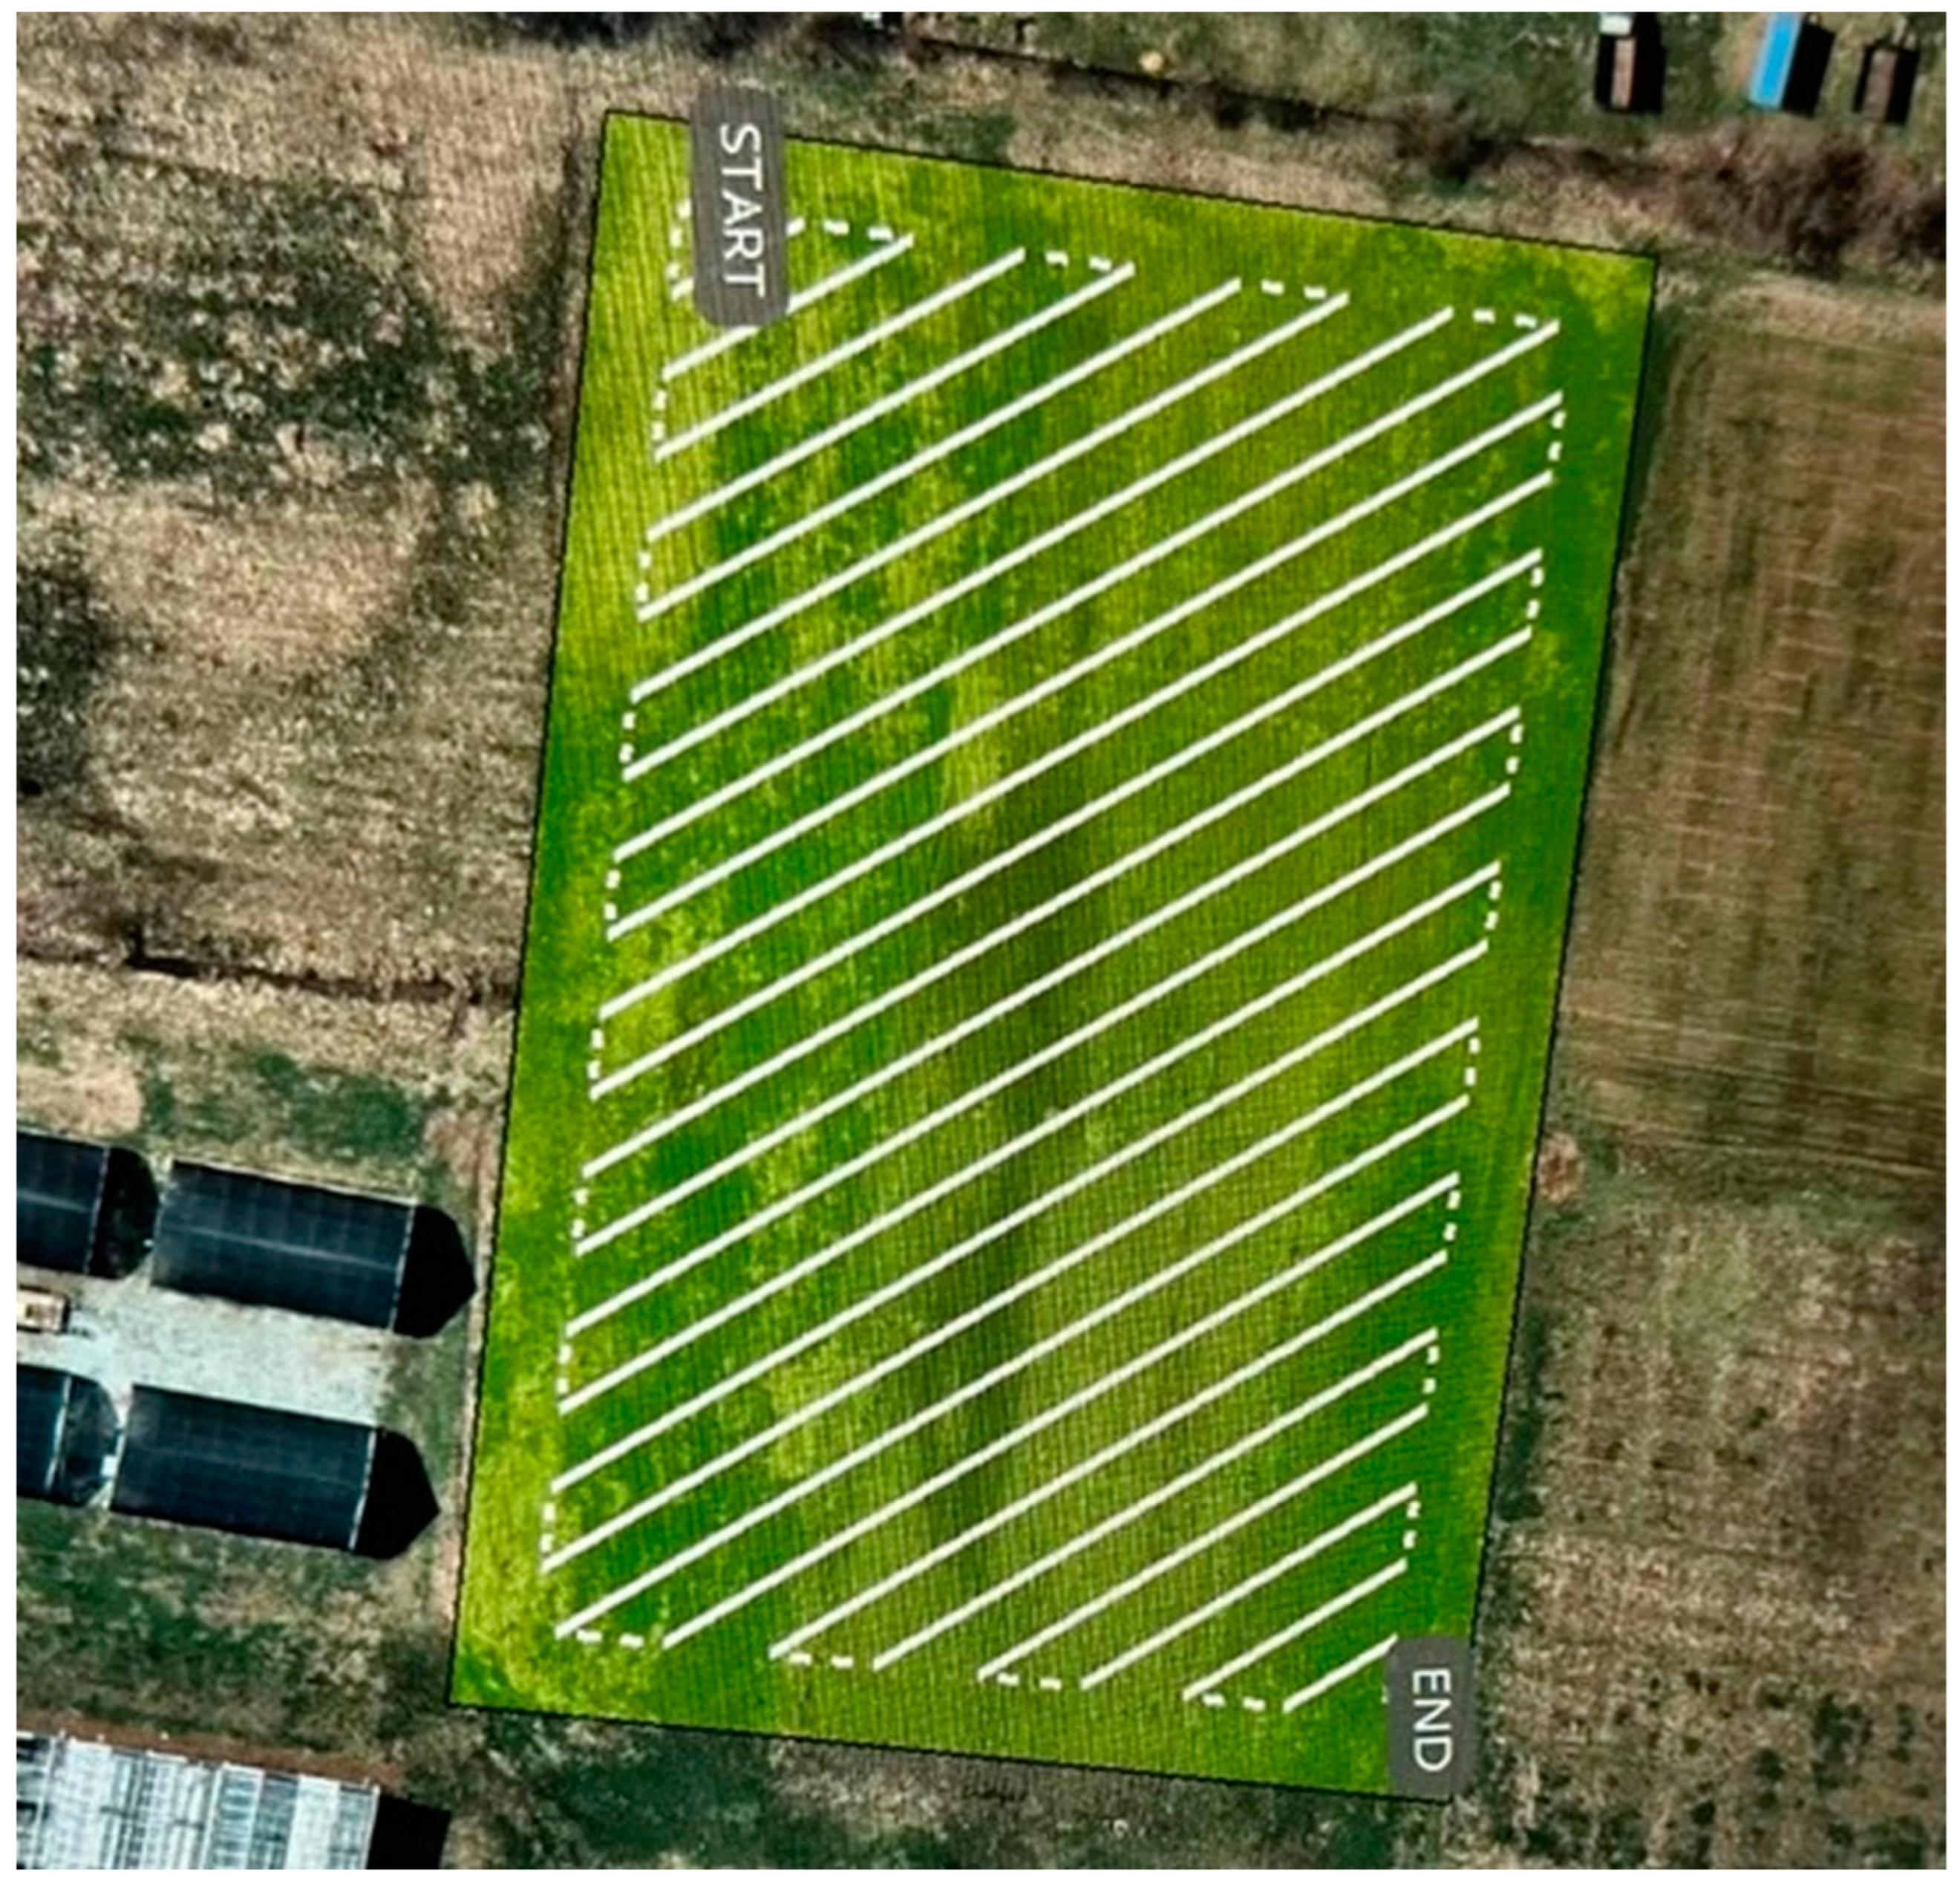
The percent wheat canopy cover was generated from NDVI values derived from drone data. We flew an Inspire 2 drone that had an Altum multispectral camera (AgEagle Aerial Systems Inc., Wichita, KS, USA) during the growth stages (tillering, jointing, boot, heading, and flowering) of winter wheat. The flight was set at 15 m altitude, 87% overlap, and a speed of 3 m/s using Pix4D capture version 4.13.1 auto-pilot mode (Figure 4).
The multispectral Altum camera takes images in the spectral bands blue (450 to 520 nm), green (520 to 590 nm), red (630 to 690 nm), red-edge (690 to 730 nm), near-infrared (IR) (770–890 nm), and longwave infrared thermal (LWIR) (10,600 to 11,200 nm) [36,37]. Multispectral images were captured every 2 s. More than five thousand drone images were acquired, and the images had a spatial resolution of around 1 cm. The Altum camera was linked to a Global Positioning System (GPS) and a Downwelling Light Sensor (DLS) integration module. The GPS information was used to allow the Altum multispectral camera system to appropriately geotag images. The DLS connected to the drone Altum multispectral camera is a five-band incident light sensor that assesses the ambient light during drone flight for the spectral bands blue (450 to 520 nm), green (520 to 590 nm), red (630 to 690 nm), red-edge (690 to 730 nm), and near-infrared (770–890 nm). It records the information to the metadata of the drone TIFF images. These data can be used to rectify global lighting variations during flights such as clouds covering the sun. The images acquired by the drone were pre-processed by mosaicking and subsetting. Radiometric and geometric correction was also conducted on the images. The acquired images were geotagged and routinely mosaicked in Pix4D mapper version 4.5. The camera and sun irradiance method were used to carry out the radiometric correction using calibrated reflectance panel images that were taken before and after each flight. Additionally, even though the mosaicked drone image acquired was geotagged with geographic coordinates, geometric correction was still carried out on the mosaicked image. This was conducted using ground control points to adequately match the drone images to features on the ground especially plot boundaries. The geometric correction was conducted using more than 50 ground control points that were taken from field data of plot boundaries and ranging poles. The geometric correction was carried out with a root mean square (RMS) value of less than 1 pixel. The georeferenced drone imagery was later clipped to the 4047 m2 winter wheat field plot area.
The NDVI for the growth stages of winter wheat was generated from drone spectral and multitemporal data using Equation (1) [38].
N D V I = N e a r I n f r a r e d R e d N e a r I n f r a r e d + R e d
The mean wheat NDVI ± Standard Deviation (SD) for growth stages (tillering, jointing, boot/heading) was used as a measure to classify and delineate the canopy cover of winter wheat. The late flowering stage of winter wheat was not considered because the wheat turned golden yellow at this stage, and the NDVI values were not easily differentiated from non-wheat features such as background soil. We digitized pure wheat stands in the drone multitemporal images using polygons. The polygons were overlaid to NDVI images in order to extract wheat NDVI values. The wheat NDVI values were analyzed for the growth stages of tillering, jointing, and boot/heading. The mean wheat NDVI ± SD (0.89 ± 0.04) was used to classify and generate winter wheat canopy cover throughout the planting plot field. The 6 m by 6 m no-till and conventional tillage plots were subsetted to 4 m by 4 m subplots in order to minimize plot edge effects in wheat canopy cover extractions. The wheat canopy cover maps derived from NDVI classification were overlaid to 4 m by 4 m subplots. The area of wheat within each subplot was divided by the area of the subplot (16 m2) times 100 to generate the percent canopy cover of winter wheat. The percent canopy cover of winter wheat in no-till and conventional tillage plots was analyzed and tested.

2.2.3. Wheat NDRE

The NDRE produced for winter wheat was used as a proxy for wheat health condition (the chlorophyll content in leaves, density of leaves, and nitrogen limitation in leaves). We generated the NDRE using Equation (2) [39].
N D R E = N e a r I n f r a r e d R e d E d g e N e a r I n f r a r e d + R e d E d g e
The NDRE was created for the middle and late stages (jointing, boot/heading) of winter wheat. These are growth stages when the crop has built up large amounts of chlorophyll in the leaves, and the red light poorly passes through [15]. We overlaid the winter wheat canopy cover map generated using the NDVI values to the NDRE map to extract wheat NDRE values for the no-till and conventional tillage plots.

2.2.4. Statistical Analysis

We carried out a non-parametric (Mann–Whitney U test) test equivalent to the independent sample t-test for the mean wheat percent canopy cover and NDRE in no-till versus conventional tillage plots. This is because the Mann–Whitney U test does not make assumptions about the homogeneity of variances. A total of 60 mean wheat percent canopy cover samples in no-till plots (n = 60) and 60 mean percent wheat canopy cover samples in conventional tillage plots (n = 60) were used in the statistical analysis. These represented the combined percent wheat canopy cover data for the tillering, jointing, and boot/heading growth stages of winter wheat. Similarly, a total of 40 mean wheat NDRE samples in no-till plots (n = 40) and 40 mean wheat NDRE samples in conventional tillage plots (n = 40) were used in statistical analysis. These samples represented combined NDRE plot data for the jointing and boot/heading growth stages of winter wheat. The Mann–Whitney U test was carried out with a significant level of 0.05 and confidence interval of 95%. The power (1-β error probability) of the test for the mean wheat percent canopy cover samples was about 88% with a medium effect size and an α error probability of 0.05. In contrast, the power (1-β error probability) of the Mann–Whitney U test for the mean wheat NDRE samples was about 80% with a medium effect size and an α error probability of 0.05.

3. Results

3.1. Percent Wheat Canopy Cover

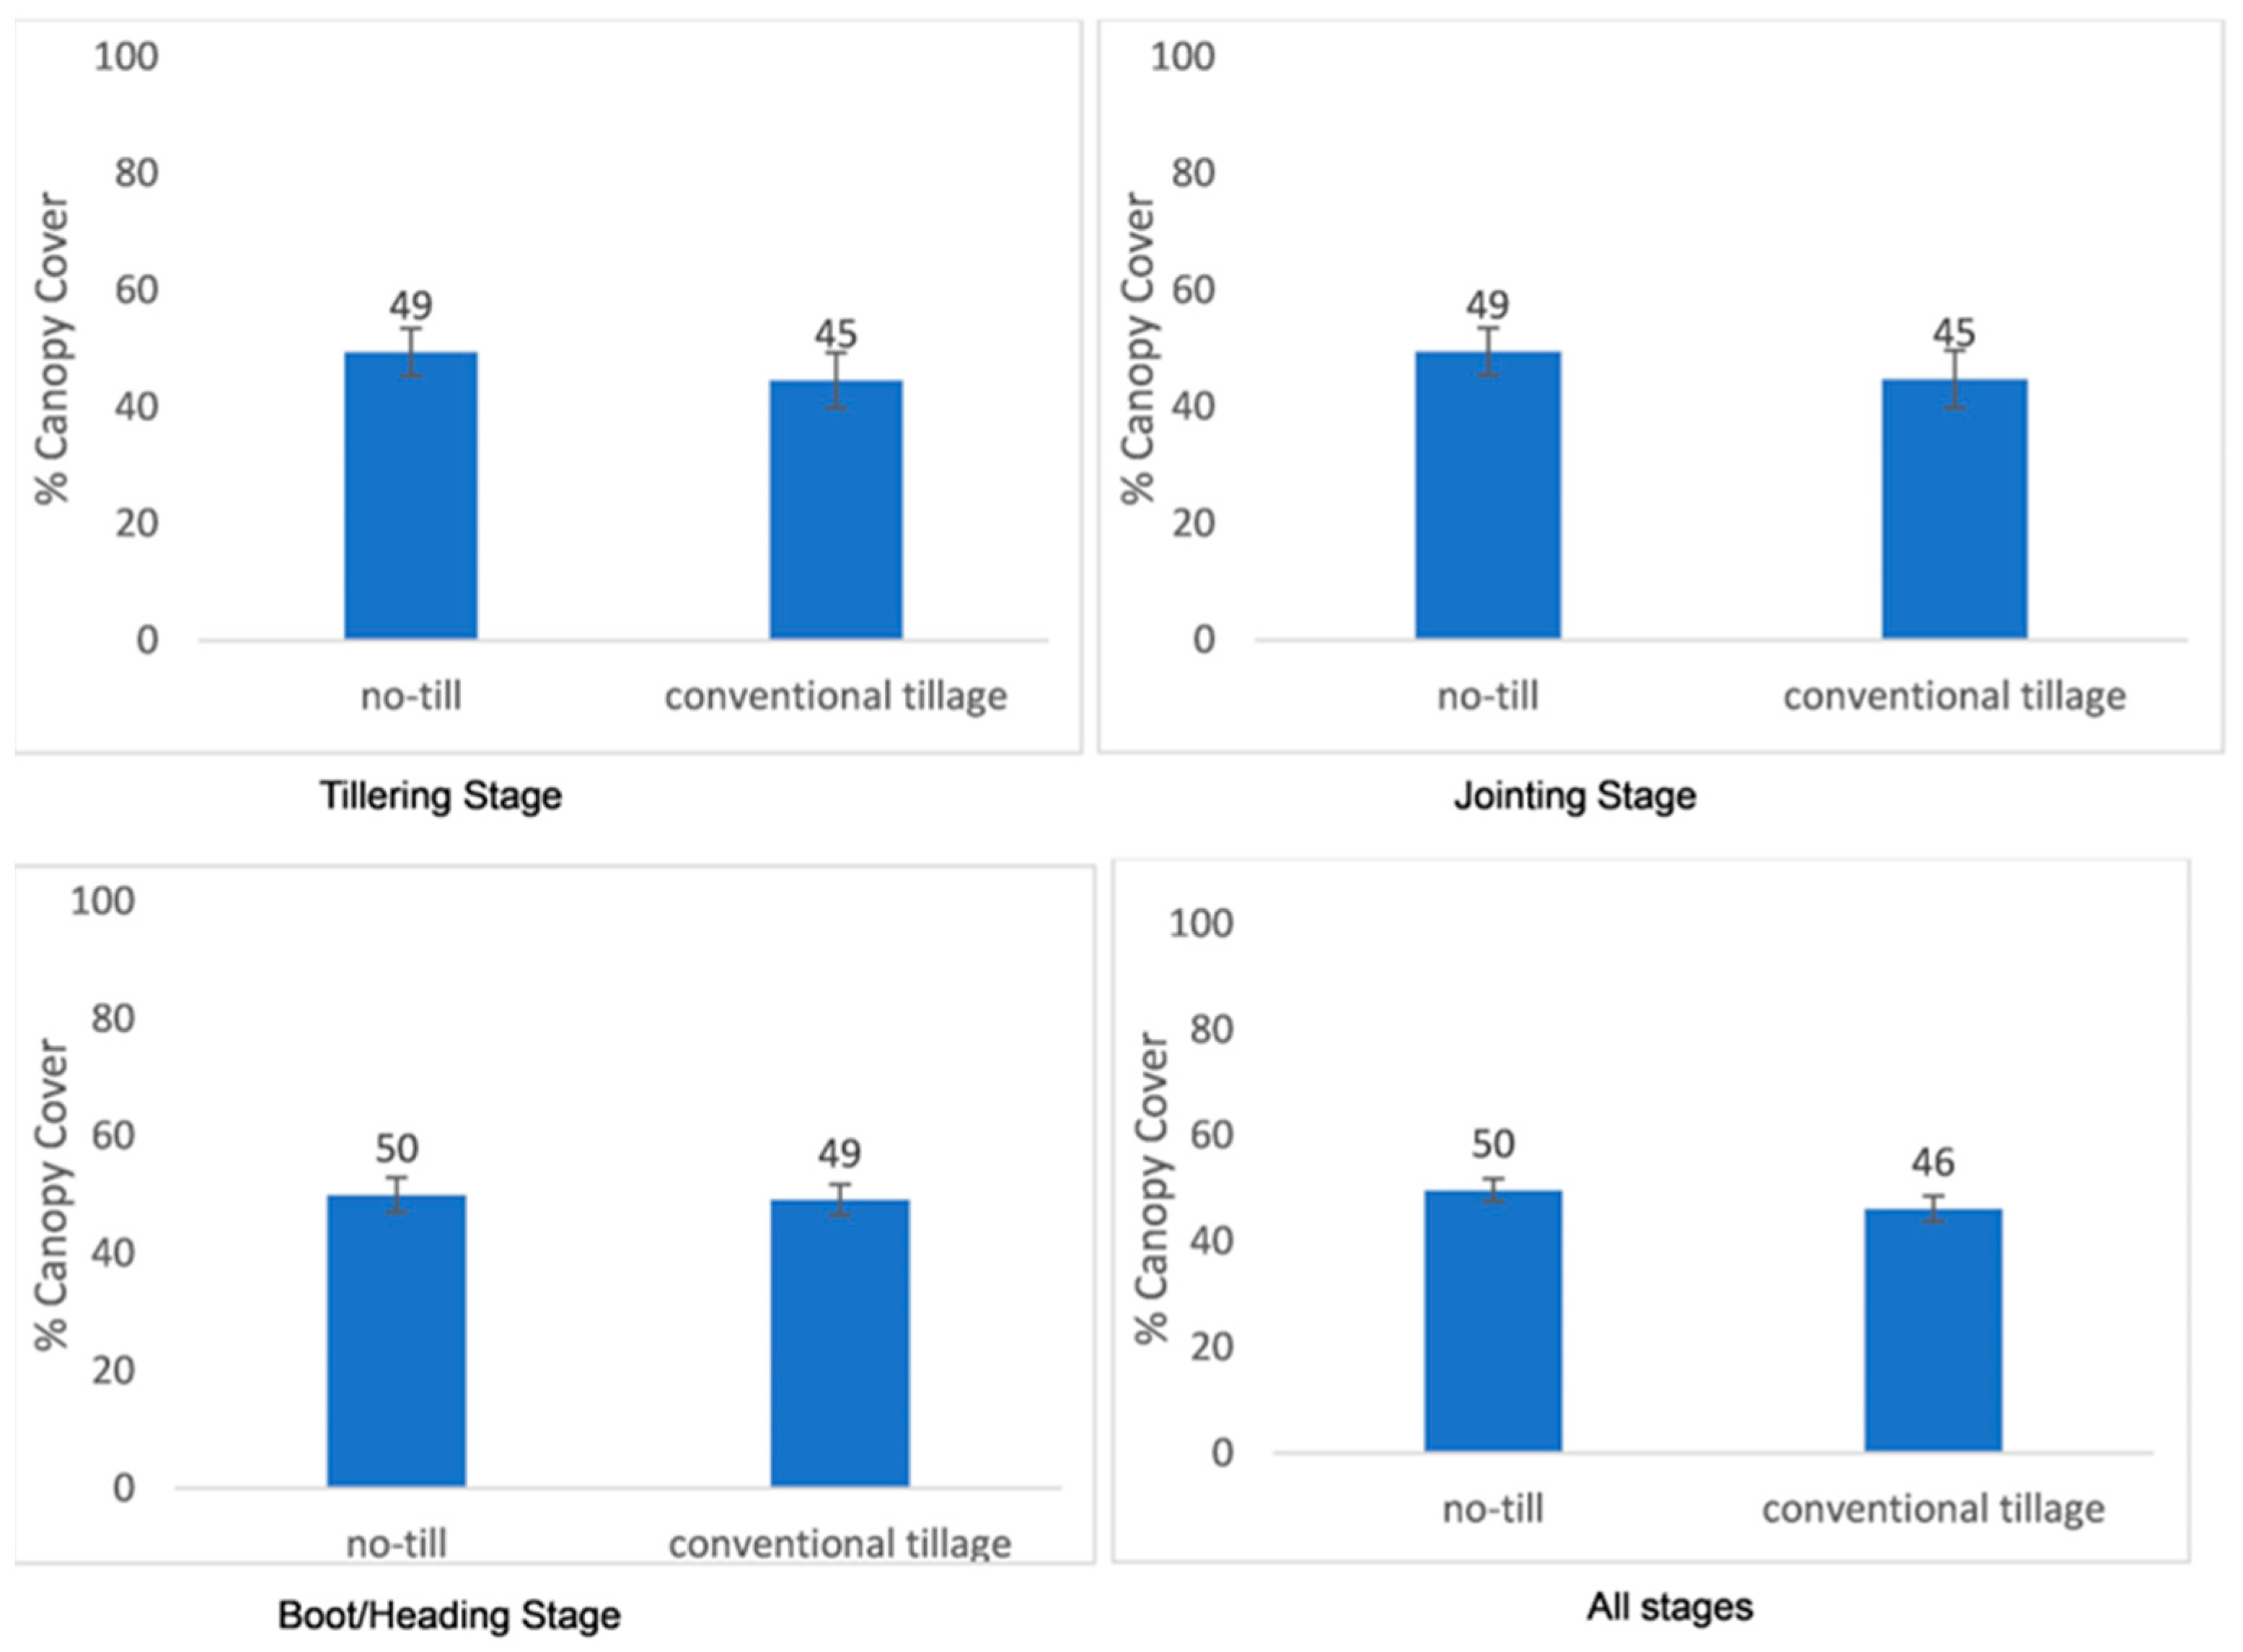
The mean percent canopy cover of winter wheat in no-till and conventional tillage plots was about 49% and 45%, respectively, in the tillering and jointing stages (Figure 5). In the boot/heading stage, the mean percent canopy cover of winter wheat was around 50% and 49% for no-till and conventional tillage, respectively. (Figure 5). No-till plots had the highest (50%) mean percent wheat canopy cover, whereas conventional tillage plots had the lowest (46%) mean percent wheat canopy cover throughout the growth season (Figure 5).

3.2. Wheat Health

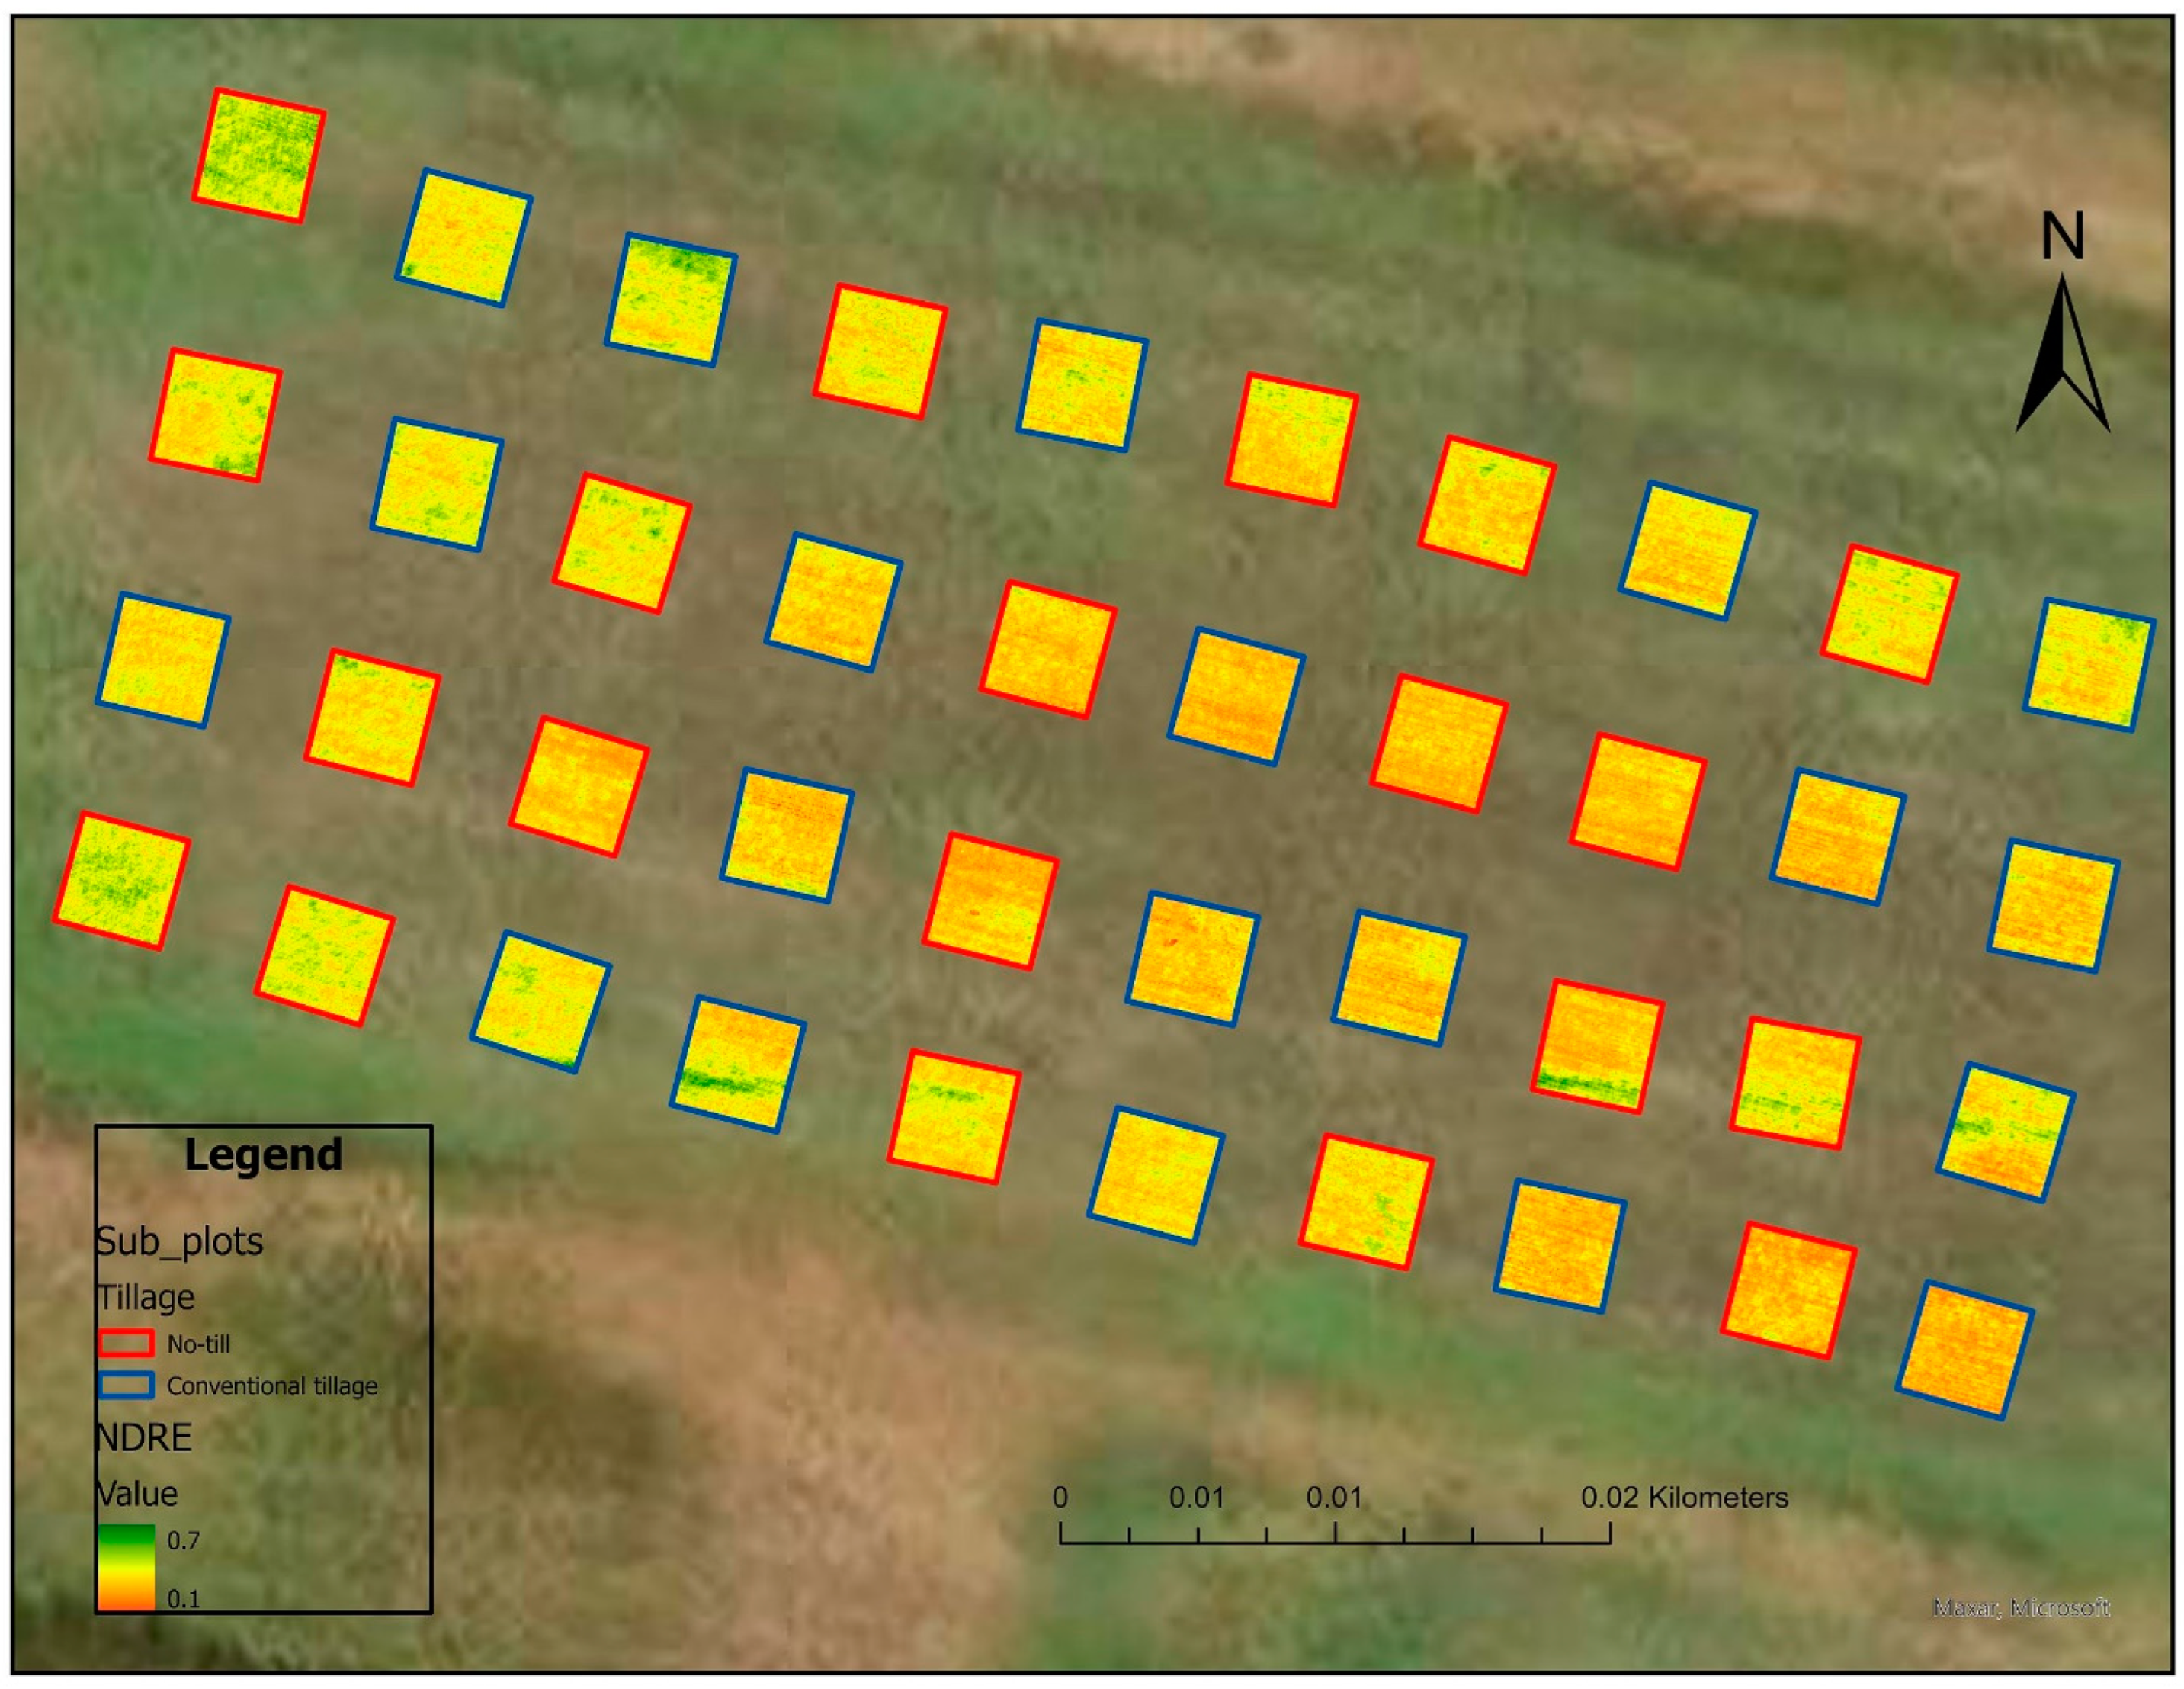
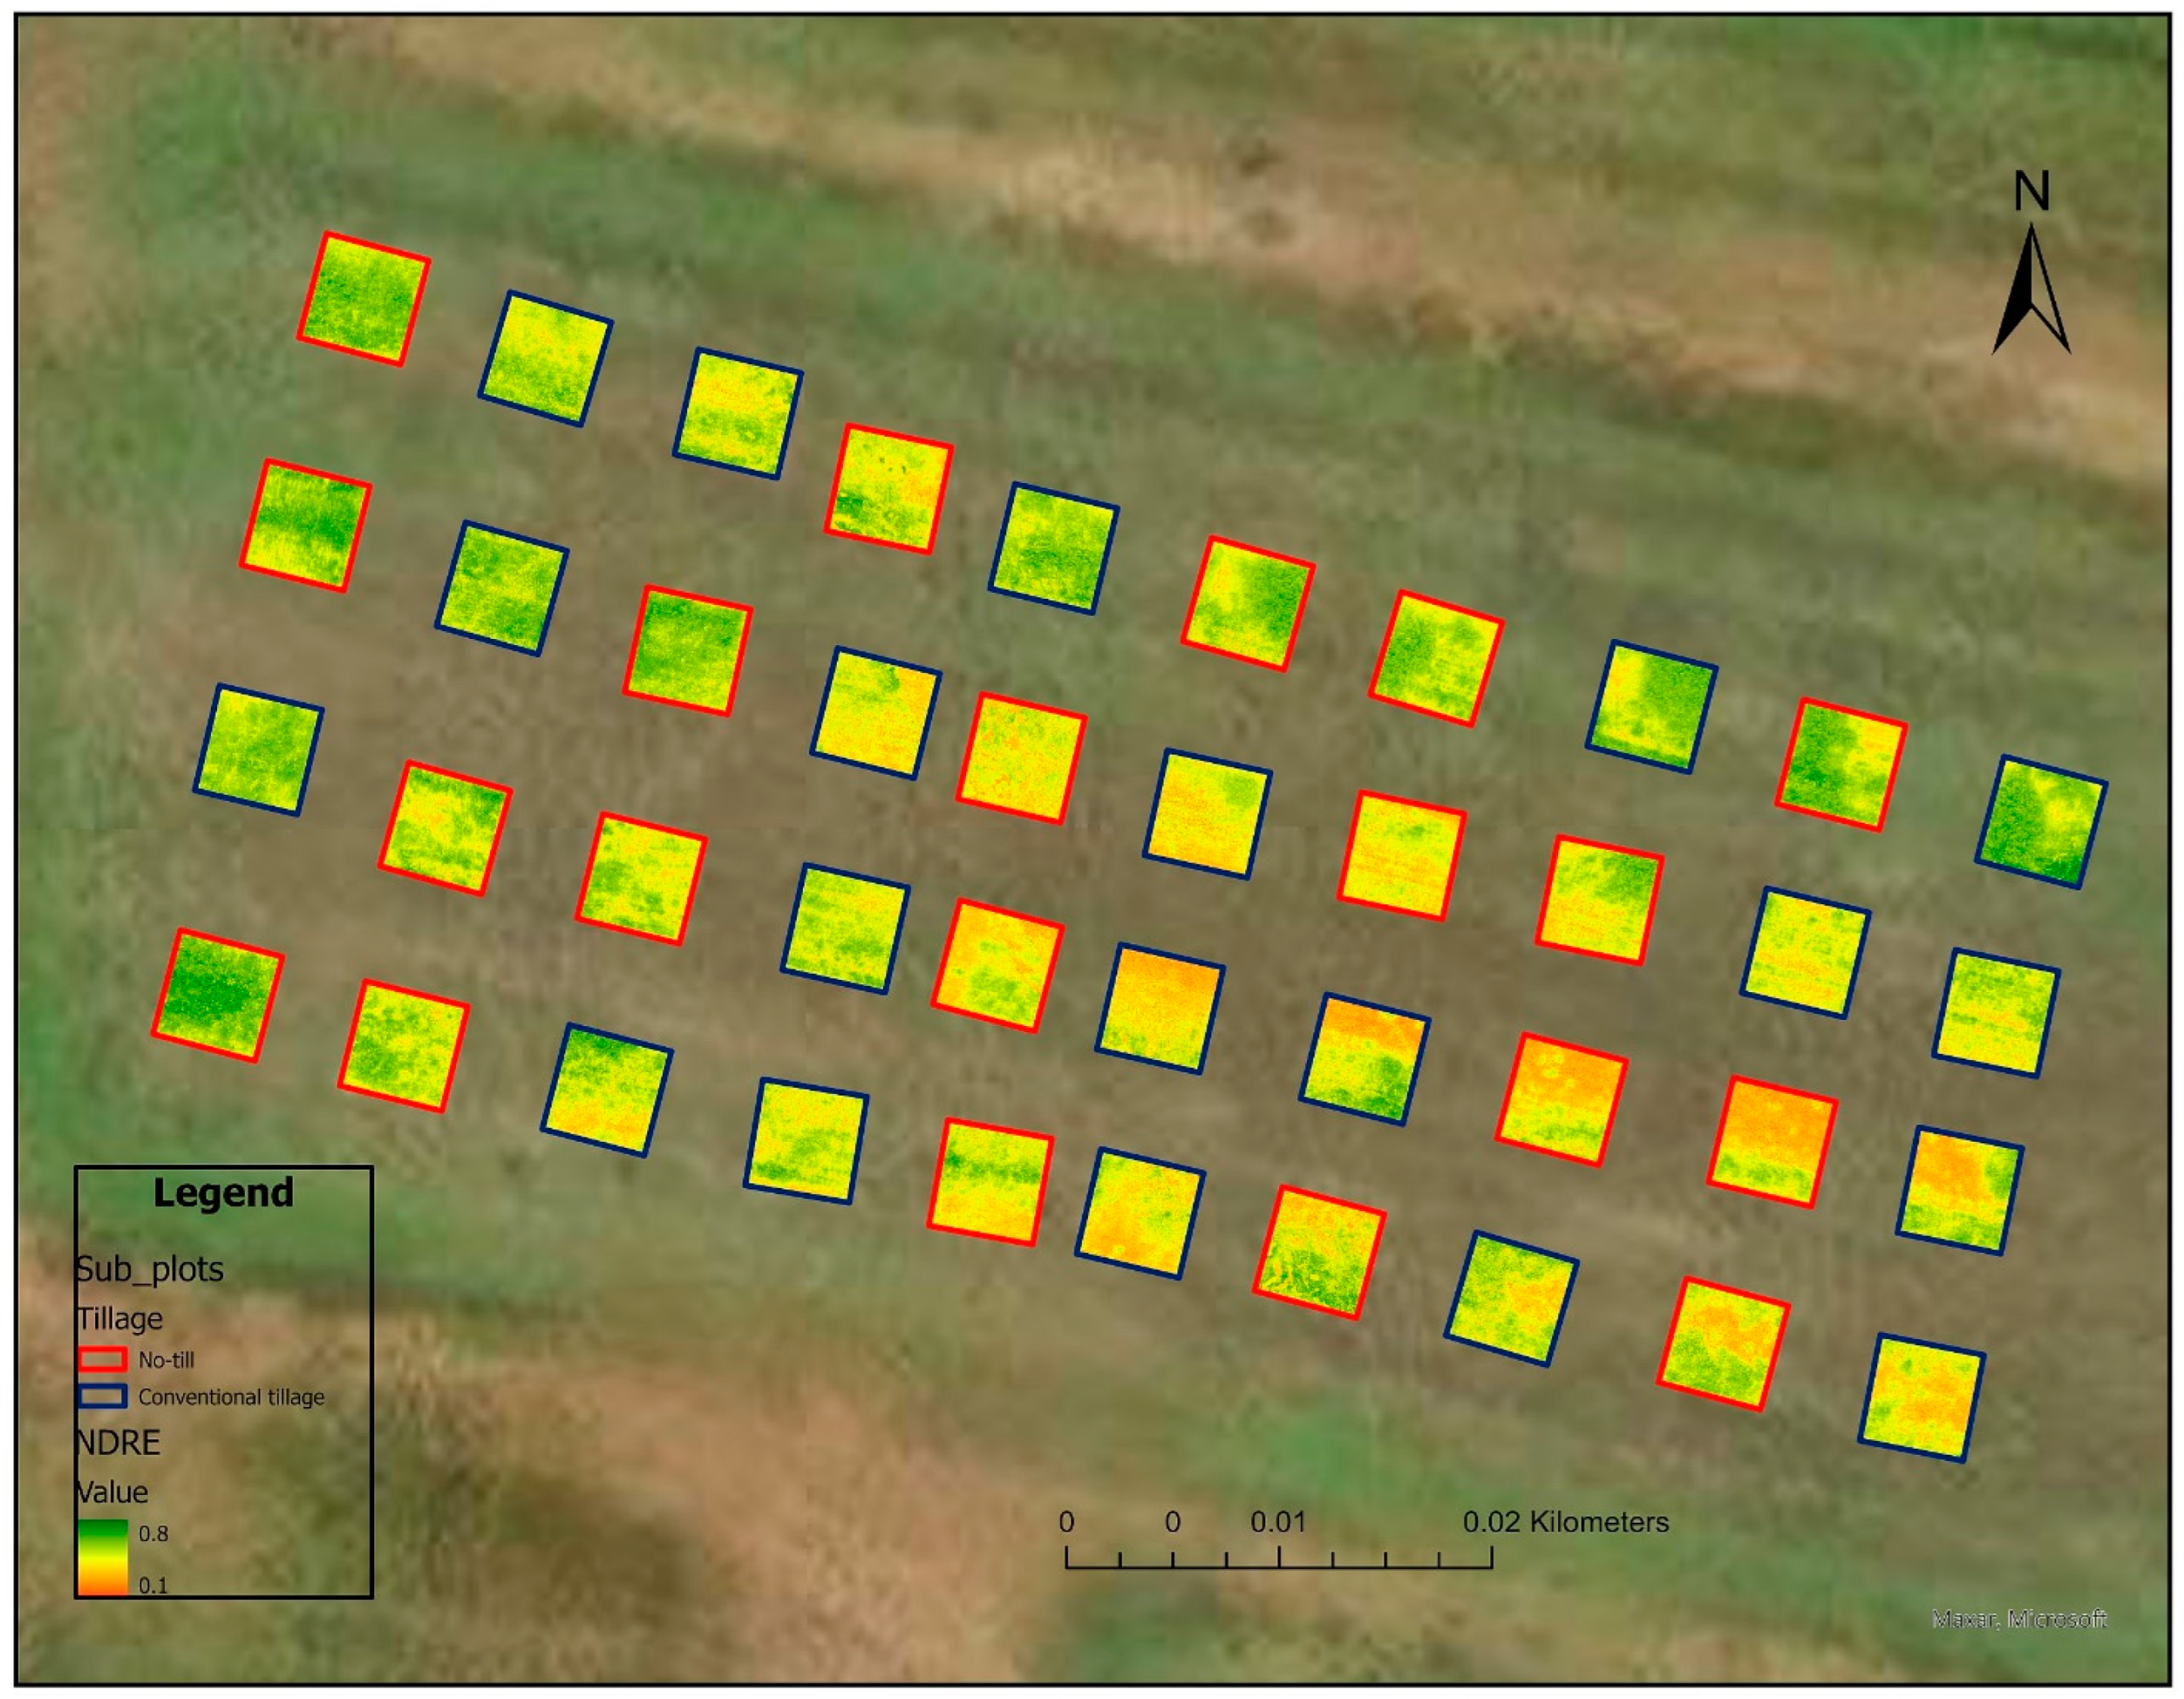
The NDRE that indicated wheat health ranged from 0 to 0.7 in the no-till and conventional tillage plots of the jointing growth stage of winter wheat (Figure 6). In contrast, the NDRE ranged from 0 to 0.8 in the no-till and conventional tillage plots of the boot/heading growth stage of winter wheat (Figure 7).
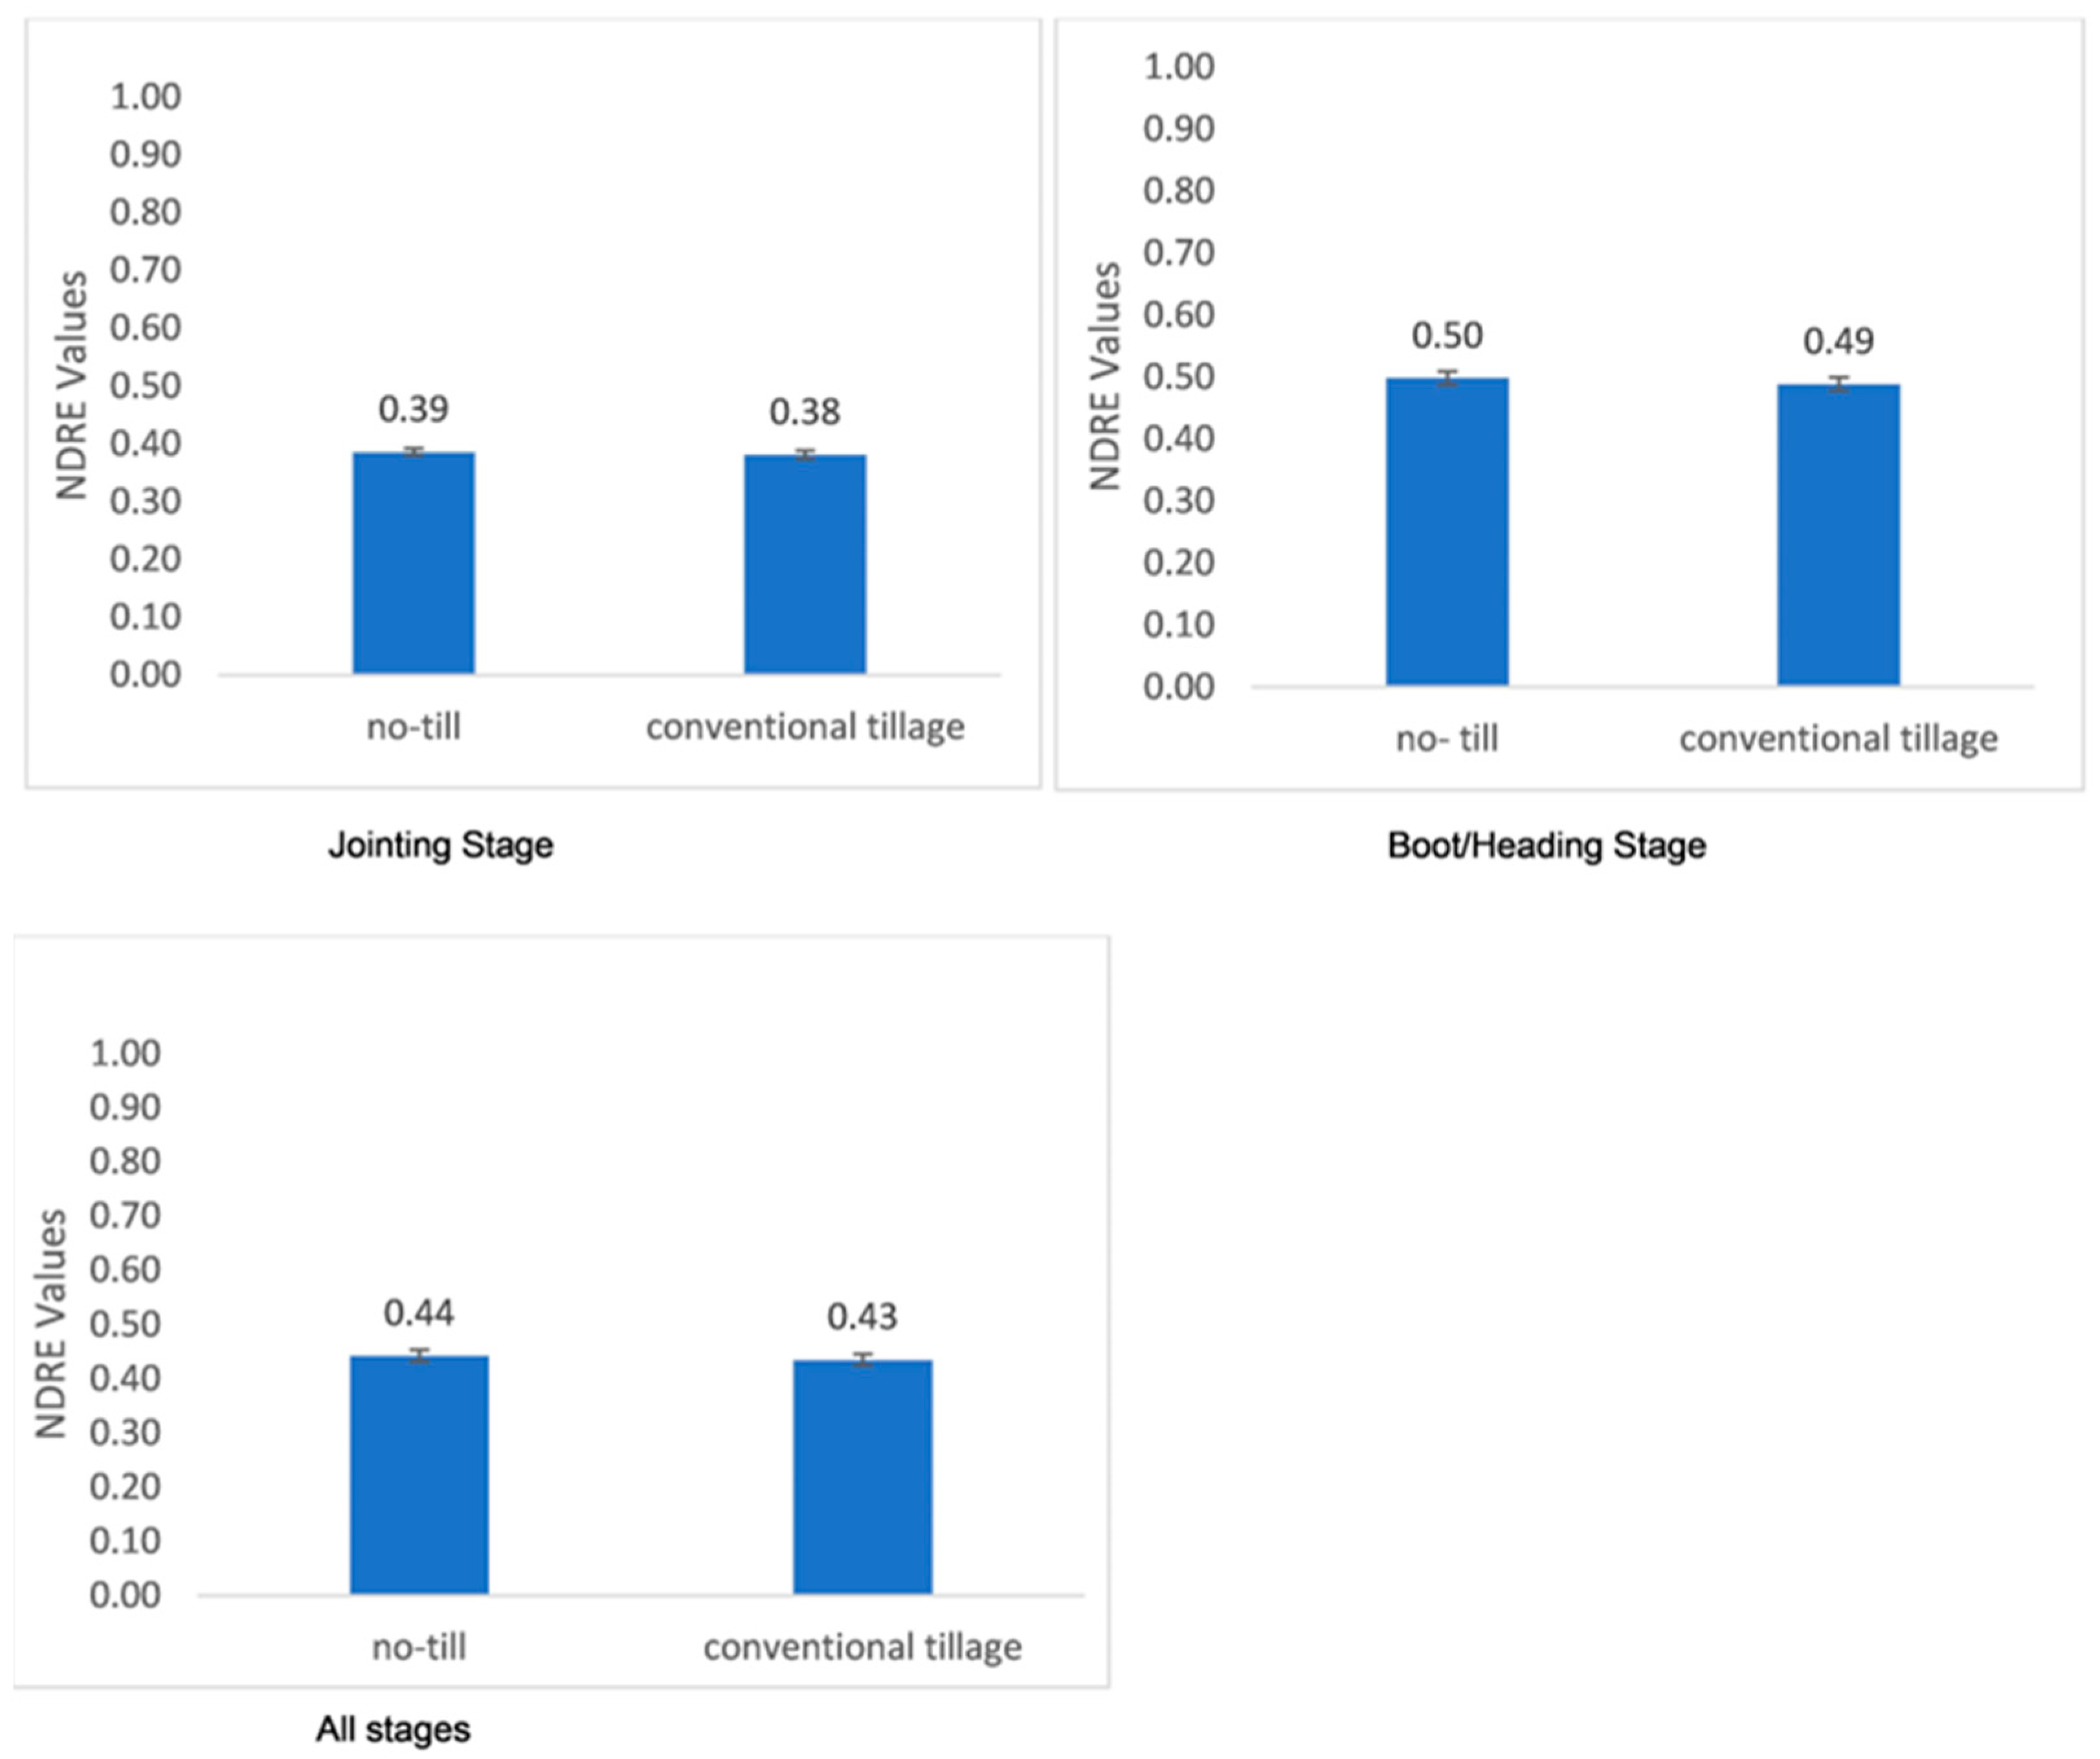
During the jointing stage, the mean NDRE ± SE for winter wheat was about 0.39 ± 0.006 for no-till and 0.38 ± 0.007 for conventional tillage plots (Figure 8). In contrast, the mean NDRE ± SE for winter wheat was approximately 0.5 ± 0.01 for both no-till and conventional tillage plots during the boot/heading stage of the growing season (Figure 8). On average, during the jointing and boot/heading growth stages, no-till plots had the maximum NDRE (0.44), while conventional tillage plots had the minimum NDRE (0.43) for winter wheat (Figure 8).

4. Discussion

During the growing season, from tillering to heading growth stages, the mean percent canopy cover of winter wheat increased by 1% in no-till plots and 4% in conventional tillage plots. However, on average, the percent canopy cover of winter wheat was about 4% higher in no-till plots relative to conventional tillage in most of the growing season. The variability in the percent canopy cover of winter wheat is likely due to weed infestation and suppression during the growing season [40,41]. The 4% increase in the percent canopy cover of winter wheat in no-till plots relative to conventional tillage suggests a likelihood of an increasing wheat biomass and yield with no-till crop production. Other studies have found an increase in wheat yield from no-till crop production [42,43,44]. However, other studies have found a higher yield in winter wheat from conventional tillage systems [30,45]. The inconsistency in findings suggests a need to further explore the effect of tillage management practices on wheat yield. Our future study will investigate the effect of tillage practices on aboveground wheat biomass and yield.
Even though no-till wheat cultivation plots had a 4% increase in percent wheat canopy cover, we found no significant difference in percent wheat canopy cover between the no-till and conventional tillage plots with p-value > 0.05 based on the Mann–Whitney U test. This implies no-till and conventional tillage management practices did not significantly influence the percent wheat canopy cover. Therefore, farmers who choose either the conservation no-till or conventional tillage management practice for growing winter wheat will likely attain similar percent wheat canopy cover. Hence, the goal for choosing no-till or conventional tillage practices by farmers should probably not rely on substantially increasing the percent canopy cover of winter wheat.
The mean NDRE of winter wheat increased by about 28% in the boot/heading growth stage relative to the jointing. This implies the health of the winter wheat crop was better in the boot/heading growth stage relative to the jointing. This is likely because during the boot/heading stage, the winter wheat crop is more mature with a higher chlorophyll content and density of leaves. Although the wheat crop health improved in the boot/heading stage, there was no significant difference in crop health between the no-till and conventional tillage plots with p-value > 0.05 based on the Mann–Whitney U test. The mean NDRE ± SE for winter wheat was around 0.44 ± 0.01 and 0.43 ± 0.01 for no-till and conventional tillage plots, respectively, throughout the jointing and boot/heading growth stages. This implies that the no-till and conventional tillage management practices did not have a significant effect on the chlorophyll content, density of leaves, or nitrogen concentration in the leaves of winter wheat. The gentle slope in the area likely contributed to no significant difference in winter wheat’s health in the no-till and conventional tillage plots. The relatively flat study area likely produced less water flow, minimal soil erosion, and little losses in nutrients. Therefore, the soil nutrient levels were likely similar in both the no-till and conventional tillage plots. Consequently, the leaves of winter crop were likely not deficient in nitrogen content, as demonstrated by the NDRE values between the no-till and conventional tillage plots. However, our findings were limited to one growing season of winter wheat. Repeating the experiment will be beneficial to support our results. Nonetheless, other studies have found similar outcomes relating to tillage management practices not significantly influencing wheat health [28,46]. This implies repeating our experiment will likely generate similar findings. Consequently, farmers should likely not make tillage management decisions based on improving crop health especially in relatively gentle terrains. Furthermore, the fact that no-till management practice is generally low-cost in cultivation, helps sequester carbon, and conserves soil moisture [19,21,22], it is likely the better option for winter wheat growers. This is because farmers will likely achieve a better wheat canopy cover, crop health, and soil condition in the no-till system relative to conventional tillage. In contrast, engaging in the conventional tillage practice is usually more costly, less beneficial to the soil, and growers will likely not achieve an improvement in wheat canopy cover and health.

5. Conclusions

We have successfully examined the percent canopy cover and health of winter wheat in no-till and conventional tillage plots using drone data. The mean percent canopy cover of winter wheat in no-till and conventional tillage plots was around 49% and 45%, respectively, in the tillering and jointing stages. The mean percent canopy cover of winter wheat increased to about 50% and 49% in no-till and conventional tillage plots, respectively, during the boot/heading stage. On average, the percentage canopy cover of winter wheat was approximately 50% and 46% in no-till and conventional tillage plots, respectively, in most of the growing season. Furthermore, the mean wheat NDRE that represented winter wheat health was around 0.44 ± 0.01 and 0.43 ± 0.01 for no-till and conventional tillage plots, respectively, throughout the jointing and boot/heading growth stages. We found no significant difference in either the percent canopy cover or health of winter wheat between the no-till and conventional tillage plots. Although conventional tillage fractures the soil, disrupts soil structure, and consequently accelerates soil erosion and the loss of nutrients, our findings suggested that it had no significant effect on wheat canopy cover and health. We anticipated a significant decrease in wheat canopy cover and health in conventional tillage plots relative to no-till due to the potential of losing soil nutrients from soil erosion. The fact that our results proved otherwise is likely due to the flat terrain of the study area. The gentle terrain of the study area with very little percent slopes likely reduced water flow and soil erosion thereby minimizing the loss in organic matter and minerals containing nutrients. This likely resulted in a comparable level of soil nutrients in both the conventional tillage and no-till plots. Furthermore, the similar level of soil nutrients in the plots likely contributed to the comparable canopy cover and health of winter wheat achieved in the no-till and conventional tillage plots. However, our findings were limited to one growing season of winter wheat. A future study will explore other winter wheat performance indicators such as canopy height and volume in no-till and conventional tillage plots using drone data. Furthermore, examining the canopy cover and health of other small grain crops such as winter rye in no-till and conventional tillage plots is also an area for further study. In addition, examining winter wheat crop performance in other farm management practices such as rotation and fertilizer applications will further enhance our understanding of wheat conditions and productivity.

Author Contributions

Conceptualization, C.E.A.; Methodology, C.E.A.; Validation, J.N.O.; Formal analysis, C.E.A. and J.N.O.; Data curation, J.N.O.; Writing—original draft, C.E.A.; Writing—review & editing, S.D.; Visualization, C.E.A.; Supervision, C.E.A.; Project administration, C.E.A. and S.D.; Funding acquisition, C.E.A. All authors have read and agreed to the published version of the manuscript.

Funding

This research was funded by United States Department of Agriculture (USDA)-National Institute of Food and Agriculture (NIFA) through the Agriculture and Food Research Initiative (AFRI) Small and Medium-Sized Farms program, grant number 2021-69006-33875.

Institutional Review Board Statement

Not Applicable.

Data Availability Statement

The data presented in this study are available on request from the corresponding author. The data are not publicly available due to privacy or ethical.

Conflicts of Interest

The authors declare no conflict of interest.

References

  1. Bentley, A.R.; Donovan, J.; Sonder, K.; Bentley, A.R.; Donovan, J.; Sonder, K.; Baudron, F.; Lewis, J.M.; Voss, R.; Rutsaert, P.; et al. Near- to long-term measures to stabilize global wheat supplies and food security. Nature Food 2022, 3, 483–486. [Google Scholar] [CrossRef]
  2. Kettlewell, P.; Byrne, R.; Jeffery, S. Wheat area expansion into northern higher latitudes and global food security. Agric. Ecosyst. Environ. 2023, 351, 108499. [Google Scholar] [CrossRef]
  3. ERS-USDA. Wheat-Overview; Economic Research Service (ERS)-United States Department of Agriculture (USDA): Washington, DC, USA, 2024. [Google Scholar]
  4. Goodwin, A.W.; Lindsey, L.E.; Harrison, S.K.; Paul, P.A. Estimating wheat yield with normalized difference vegetation index and fractional green canopy cover. Crop. Forage Turfgrass Manag. 2018, 4, 1–6. [Google Scholar] [CrossRef]
  5. Srivastava, A.; Roy, S.; Kimothi, M.M.; Kumar, P.; Sehgal, S.; Mamatha, S.; Ray, S.S. Detection of bacterial wilt disease (Pseudomonas solancearum) in Brinjal using hyperspectral remote sensing. Int. Arch. Photogramm. Remote Sens. Spat. Inf. Sci. 2019, 42, 515–520. [Google Scholar] [CrossRef]
  6. Prabhakara, K.; Hively, W.D.; McCarty, G.W. Evaluating the relationship between biomass, percent groundcover and remote sensing indices across six winter cover crop fields in Maryland, United States. Int. J. Appl. Earth Obs. Geoinf. 2015, 39, 88–102. [Google Scholar] [CrossRef]
  7. Akumu, C.E.; Dennis, S. Effect of the Red-Edge Band from Drone Altum Multispectral Camera in Mapping the Canopy Cover of Winter Wheat, Chickweed, and Hairy Buttercup. Drones 2023, 7, 277. [Google Scholar] [CrossRef]
  8. De la Casa, A.; Ovando, G.; Bressanini, L.; Martínez, J.; Díaz, G.; Miranda, C. Soybean crop coverage estimation from NDVI images with different spatial resolution to evaluate yield variability in a plot. ISPRS J. Photogramm. Remote Sens. 2018, 146, 531–547. [Google Scholar] [CrossRef]
  9. Stamford, J.D.; Vialet-Chabrand, S.; Cameron, I.; Lawson, T. Development of an accurate low cost NDVI imaging system for assessing plant health. Plant Methods 2023, 19, 9. [Google Scholar] [CrossRef]
  10. Kanke, Y.; Raun, W.; Solie, J.; Stone, M.; Taylor, R. Red edge as a potential index for detecting differences in plant nitrogen status in winter wheat. J. Plant Nutr. 2012, 35, 1526–1541. [Google Scholar] [CrossRef]
  11. Huang, S.; Tang, L.; Hupy, J.P.; Wang, Y.; Shao, G. A commentary review on the use of normalized difference vegetation index (NDVI) in the era of popular remote sensing. J. For. Res. 2021, 32, 1–6. [Google Scholar] [CrossRef]
  12. Eisfelder, C.; Asam, S.; Hirner, A.; Reiners, P.; Holzwarth, S.; Bachmann, M.; Gessner, U.; Dietz, A.; Huth, J.; Bachofer, F.; et al. Seasonal Vegetation Trends for Europe over 30 Years from a Novel Normalised Difference Vegetation Index (NDVI) Time-Series—The TIMELINE NDVI Product. Remote Sens. 2023, 15, 3616. [Google Scholar] [CrossRef]
  13. Sharifi, A.; Felegari, S. Remotely sensed normalized difference red-edge index for rangeland biomass estimation. Aircr. Eng. Aerosp. Technol. 2023, 95, 1128–1136. [Google Scholar] [CrossRef]
  14. Guo, Y.; Ren, H. Remote sensing monitoring of maize and paddy rice planting area using GF-6 WFV red edge features. Comput. Electron. Agric. 2023, 207, 107714. [Google Scholar] [CrossRef]
  15. Boiarskii, B.; Hasegawa, H. Comparison of NDVI and NDRE indices to detect differences in vegetation and chlorophyll content. J. Mech. Contin. Math. Sci. 2019, 4, 20–29. [Google Scholar] [CrossRef]
  16. Magney, T.; Eitel, J.; Vierling, L. Mapping wheat nitrogen uptake from RapidEye vegetation indices. Precis. Agric. 2017, 18, 429–451. [Google Scholar] [CrossRef]
  17. Carneiro, F.M.; Furlani, C.E.A.; Zerbato, C.; de Menezes, P.C.; Gírio, L.A.S.; de Oliveira, M.F. Comparison between vegetation indices for detecting spatial and temporal variabilities in soybean crop using canopy sensors. Precis. Agric. 2020, 21, 979–1007. [Google Scholar] [CrossRef]
  18. Busari, M.A.; Kukal, S.S.; Kaur, A.; Bhatt, R.; Dulazi, A.A. Conservation tillage impacts on soil, crop and the environment. Int. Soil Water Conserv. Res. 2015, 3, 119–129. [Google Scholar] [CrossRef]
  19. Mathew, R.P.; Feng, Y.; Githinji, L.; Ankumah, R.; Balkcom, K.S. Impact of no-tillage and conventional tillage systems on soil microbial communities. Appl. Environ. Soil Sci. 2012, 2012, 548620. [Google Scholar] [CrossRef]
  20. Bertolino, A. Effects of the Periodic Plowing on Soil Physical Properties. Agrotechnology 2023, 12, 299. [Google Scholar]
  21. Schwab, E.B.; Reeves, D.W.; Burmester, C.H.; Raper, R.L. Conservation tillage systems for cotton in the Tennessee Valley. Soil Sci. Soc. Am. J. 2002, 66, 569–577. [Google Scholar] [CrossRef]
  22. West, T.O.; Post, W.M. Soil organic carbon sequestration rates by tillage and crop rotation: A global data analysis. Soil Sci. Soc. Am. J. 2002, 66, 1930–1946. [Google Scholar] [CrossRef]
  23. Blanco-Canqui, H.; Ruis, S.J. No-tillage and soil physical environment. Geoderma 2018, 326, 164–200. [Google Scholar] [CrossRef]
  24. Aziz, I.; Mahmood, T.; Islam, K.R. Effect of long term no-till and conventional tillage practices on soil quality. Soil Tillage Res. 2013, 131, 28–35. [Google Scholar] [CrossRef]
  25. Lal, R.; Reicosky, D.C.; Hanson, J.D. Evolution of the plow over 10,000 years and the rationale for no-till farming. Soil Tillage Res. 2007, 93, 1–12. [Google Scholar] [CrossRef]
  26. Latifmanesh, H.; Deng, A.; Nawaz, M.M.; Li, L.; Chen, Z.; Zheng, Y.; Wang, P.; Song, Z.; Zhang, J.; Zheng, C.; et al. Integrative impacts of rotational tillage on wheat yield and dry matter accumulation under corn-wheat cropping system. Soil Tillage Res. 2018, 184, 100–108. [Google Scholar] [CrossRef]
  27. Yan, Q.; Wu, L.; Dong, F.; Yan, S.; Li, F.; Jia, Y.; Zhang, J.; Zhang, R.; Huang, X. Subsoil tillage enhances wheat productivity, soil organic carbon and available nutrient status in dryland fields. J. Integr. Agric. 2024, 23, 251–266. [Google Scholar] [CrossRef]
  28. Kraska, P.; Andruszczak, S.; Kwiecinska-Poppe, E.; Palys, E. The effect of tillage systems and catch crops on the yield, grain quality and health of spring wheat. Acta Sci. Pol. Agric. 2014, 13, 21–38. [Google Scholar]
  29. de Cárcer, P.S.; Sinaj, S.; Santonja, M.; Fossati, D.; Jeangros, B. Long-term effects of crop succession, soil tillage and climate on wheat yield and soil properties. Soil Tillage Res. 2019, 190, 209–219. [Google Scholar] [CrossRef]
  30. Jug, I.; Jug, D.; Sabo, M.; Stipesevic, B.; Stosic, M. Winter wheat yield and yield components as affected by soil tillage systems. Turk. J. Agric. For. 2011, 35, 1–7. [Google Scholar] [CrossRef]
  31. Martins, R.N.; Portes, M.F.; Moraes, H.M.F.; Junior, M.R.F.; Rosas, J.T.F.; Junior, W.A.O. Influence of tillage systems on soil physical properties, spectral response and yield of the bean crop. Remote Sens. Appl. Soc. Environ. 2021, 22, 100517. [Google Scholar] [CrossRef]
  32. Verhulst, N.; Govaerts, B.; Nelissen, V.; Sayre, K.D.; Crossa, J.; Raes, D.; Deckers, J. The effect of tillage, crop rotation and residue management on maize and wheat growth and development evaluated with an optical sensor. Field Crops Res. 2011, 120, 58–67. [Google Scholar] [CrossRef]
  33. Hodges, J.A.; Norrell, R.J.; Sarah, M.H. Tennessee. Available online: https://www.britannica.com/place/Tennessee (accessed on 10 January 2024).
  34. Data, U.S.C. Climate Nashville-Tennessee. Available online: https://www.usclimatedata.com/climate/nashville/tennessee/united-states/ustn0357 (accessed on 15 January 2024).
  35. USDA-NRCS. Byler Series; National Cooperative Soil Survey, United States Department of Agriculture-Natural Resources Conservation Service: Nashville, TN, USA, 2001.
  36. MicaSense. MicaSense Altum™ and DLS 2 Integration Guide; MicaSense, Inc.: Seattle, WA, USA, 2020. [Google Scholar]
  37. Agilandeeswari, L.; Prabukumar, M.; Radhesyam, V.; Phaneendra, K.L.N.B.; Farhan, A. Crop Classification for Agricultural Applications in Hyperspectral Remote Sensing Images. Appl. Sci. 2022, 12, 1670. [Google Scholar] [CrossRef]
  38. Lichtenthaler, H.K.; Lang, M.; Sowinska, M.; Heisel, F.; Miehé, J.A. Detection of vegetation stress via a new high resolution fluorescence imaging system. J. Plant Physiol. 1996, 148, 599–612. [Google Scholar] [CrossRef]
  39. Li, F.; Miao, Y.; Feng, G.; Yuan, F.; Yue, S.; Gao, X.; Liu, Y.; Liu, B.; Ustin, S.L.; Chen, X. Improving estimation of summer maize nitrogen status with red edge-based spectral vegetation indices. Field Crops Res. 2014, 157, 111–123. [Google Scholar] [CrossRef]
  40. Andrade, J.F.; Satorre, E.H.; Ermácora, C.M.; Poggio, S.L. Weed communities respond to changes in the diversity of crop sequence composition and double cropping. Weed Res. 2017, 57, 148–158. [Google Scholar] [CrossRef]
  41. Nichols, V.; English, L.; Carlson, S.; Gailans, S.; Liebman, M. Effects of long-term cover cropping on weed seedbanks. Front. Agron. 2020, 2, 591091. [Google Scholar] [CrossRef]
  42. De Vita, P.; Di Paolo, E.; Fecondo, G.; Di Fonzo, N.; Pisante, M. No-tillage and conventional tillage effects on durum wheat yield, grain quality and soil moisture content in southern Italy. Soil Tillage Res. 2007, 92, 69–78. [Google Scholar] [CrossRef]
  43. Sharefee, Z.; Eslami, S.V.; Jami Al-Ahmadi, M.; Mahmoodi, S. Effect of different tillage methods and cover crop types on yield and yield components of wheat. Iran. J. Field Crops Res. 2018, 16, 217–228. [Google Scholar]
  44. Jin, H.; Qingjie, W.; Hongwen, L.; Lijin, L.; Huanwen, G. Effect of alternative tillage and residue cover on yield and water use efficiency in annual double cropping system in North China Plain. Soil Tillage Res. 2009, 104, 198–205. [Google Scholar] [CrossRef]
  45. Munkholm, L.J.; Hansen, E.M.; Olesen, J.E. The effect of tillage intensity on soil structure and winter wheat root/shoot growth. Soil Use Manag. 2008, 24, 392–400. [Google Scholar] [CrossRef]
  46. Majchrzak, L.; Sawinska, Z.; Natywa, M.; Skrzypczak, G.; Głowicka-Wołoszyn, R. Impact of different tillage systems on soil dehydrogenase activity and spring wheat infection. J. Agric. Sci. Technol. 2016, 18, 1871–1881. [Google Scholar]
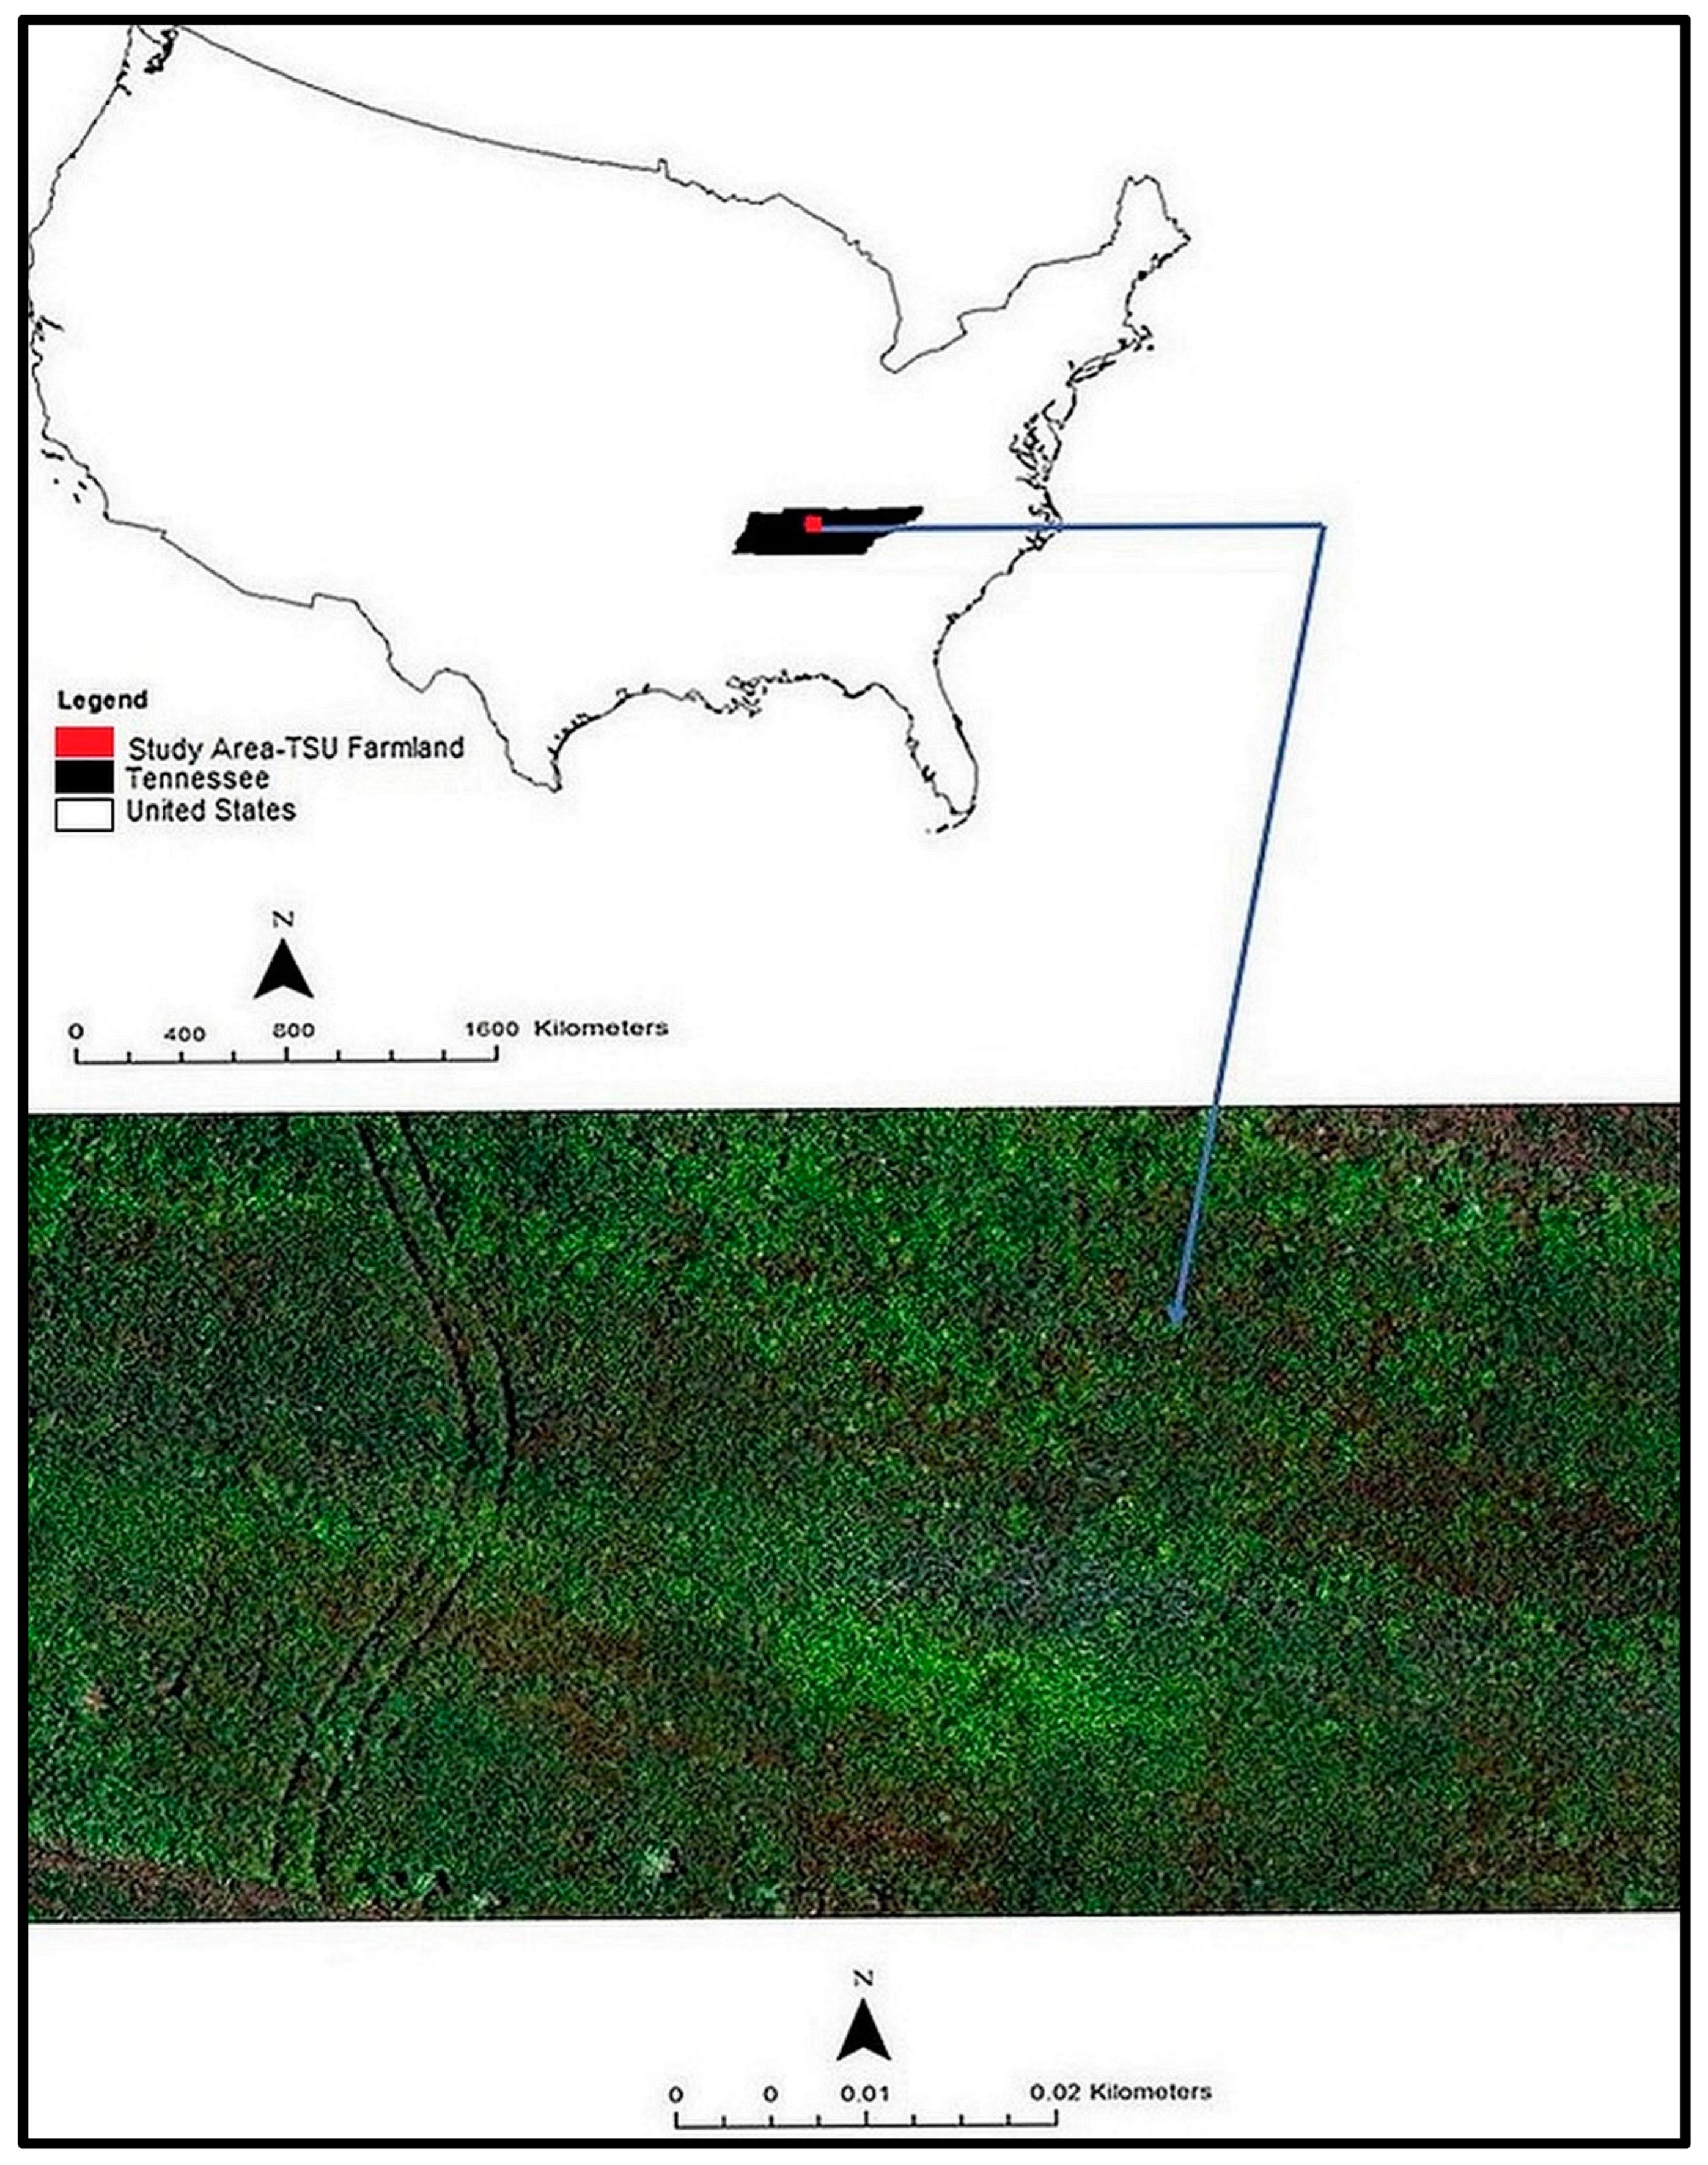
Figure 1. Study area at TSU campus farmland where winter wheat was planted.
Agriculture 14 00760 g001
Figure 2. Approach used to examine percent canopy cover and health of winter wheat in no-till and conventional tillage plots using drone.
Agriculture 14 00760 g002
Figure 3. The no-till and conventional tillage plot layout for the growing of winter wheat.
Agriculture 14 00760 g003
Figure 4. The drone path for the acquisition of field sampling pictures.
Agriculture 14 00760 g004
Figure 5. The mean percent canopy cover of winter wheat in no-till and conventional tillage plots. Error bars represent the standard error (SE) of the mean.
Agriculture 14 00760 g005
Figure 6. The NDRE generated during the jointing growth stage of winter wheat in no-till and conventional tillage plots.
Agriculture 14 00760 g006
Figure 7. The NDRE generated throughout the boot/heading growth stage of winter wheat in no-till and conventional tillage plots.
Agriculture 14 00760 g007
Figure 8. The mean NDRE of winter wheat in no-till and conventional tillage plots. Error bars represent the SE of the mean.
Agriculture 14 00760 g008
Disclaimer/Publisher’s Note: The statements, opinions and data contained in all publications are solely those of the individual author(s) and contributor(s) and not of MDPI and/or the editor(s). MDPI and/or the editor(s) disclaim responsibility for any injury to people or property resulting from any ideas, methods, instructions or products referred to in the content.