Article

Effects of Soil Quality Decline on Soil-Dwelling Mesofaunal Communities in Agricultural Lands of the Mollisols Region, China

School of Public Administration and Law, Northeast Agricultural University, Harbin 150030, China
*
Author to whom correspondence should be addressed.
Agriculture 2024, 14(5), 766; https://doi.org/10.3390/agriculture14050766
Submission received: 26 March 2024 / Revised: 11 May 2024 / Accepted: 14 May 2024 / Published: 16 May 2024
(This article belongs to the Special Issue Soil Management for Sustainable Agriculture)

Abstract

:
Soil quality decline can adversely affect ecosystem health and land productivity, with soil-dwelling mesofauna considered to potentially fulfill vital functions in accurately predicting these outcomes. However, the current state of research reveals a gap concerning the relationships between soil quality decline and soil-dwelling mesofauna in the Mollisols Region. For a more profound understanding of this issue, we conducted a comprehensive investigation of soil-dwelling mesofaunal communities in the different agricultural lands of the Mollisols Region. In this study, soil-dwelling mesofauna were collected, and 11 soil properties were determined following standard procedures, with soil quality levels quantified by utilizing soil quality index (SQI). Our results revealed that there was a gradient of soil quality across the different agricultural lands, which were divided into five levels, including very strong, strong, medium, weak, and very weak. Subsequently, this investigation provided empirical evidence that the decline in soil quality had implications for soil-dwelling mesofaunal communities in agricultural lands of the Mollisols region. A consistent decrease in the density of soil-dwelling mesofauna was observed with the decline of soil quality. In contrast, a greater richness was observed in areas with relatively weaker soil quality, suggesting that the consequences of soil quality decline on soil-dwelling mesofauna were not exclusively negative. Various taxa of soil-dwelling mesofauna exhibited varying degrees of response to the decline in soil quality. Oribatida was overwhelmingly dominant in the sampling fields with medium soil quality, and most Entomobryidae were found in agricultural lands with very weak soil quality. During soil quality decline, soil nutrients were observed to correlate positively with the density of soil-dwelling mesofauna. Overall, the outcomes of this investigation carry significance for comprehending how soil quality decline relates to soil-dwelling mesofauna, and can provide valuable ecological insights for formulating biodiversity guidelines targeted at preserving soil resources in the Mollisols region.

1. Introduction

Soil quality decline is attributed to a synergistic effect of both natural forces and human activities [1]. It can cause reductions in agricultural productivity, decreases in land use efficiency, and the deterioration of belowground ecosystems [2]. Mollisols, a soil order in the United States Soil Taxonomy, forms beneath temperate and cold–temperate grassland or steppe vegetation and is characterized by a surface layer containing dark humified organic material [3]. Although Mollisols cover only 7% of the global land area, their richness in organic content and exceptional fertility contribute significantly to global agricultural production [4]. Nevertheless, Mollisols worldwide have been experiencing different levels of quality decline after cultivation [5]. Soil quality decline in Mollisols regions seems certain to drive changes in belowground ecosystems, ultimately altering soil environments [6]. As a result, these declines have been recognized as a serious issue closely correlated with sustainable agriculture worldwide and the balance of belowground ecosystems [7].
The adverse effects of soil quality decline on ecosystem health and land productivity are considered to be pervasive and systemic. Accordingly, numerous research endeavors have focused on how soil quality decline impacts belowground systems, especially regarding the relationships between soil physical properties, nutrients, or microbial communities, and the decline in soil quality, yielding definitive findings [8,9,10]. All things considered, soil quality decline results in soil becoming thinner, less fertile, and more compacted, thereby restricting ecological functions in belowground systems [11]. Consequently, the impacts of soil quality decline on belowground systems have recently gained increased attention. Among these, the links between soil quality decline and soil faunal communities have been increasingly explored. For instance, Yan et al. illustrated that the abundance and functional traits of soil fauna, based on the mixed taxonomic resolution, could be used to assess soil quality [12]. Analysis of Megascolecidae and Lumbricidae could exhaustively describe the physical and chemical features as well as the biological properties associated with changes in soil quality [13,14]. Following decline in soil quality, communities of spiders, beetles and ants underwent significant simplification, but they demonstrated potential for recovery within only four years of land restoration in Northeast Brazil [15]. In addition to the studies on soil macrofauna communities mentioned above, Martin et al. employed factor analysis strategies to integrate the community structure and function of soil nematodes into the current framework of soil health indicators [16]. Du Preez et al. demonstrated that the metabolic footprints of soil nematodes could serve as indirect measures of soil quality [15]. Thus, these studies have provided valuable insights into the intricate connections between soil faunal communities and soil quality decline, building upon earlier observations. Soil-dwelling mesofauna constitute integral components of soil biological communities, and thus the implications of declining soil quality for them cannot be underestimated.
Soil-dwelling mesofauna are invertebrates with body sizes ranging from 0.1 mm to 2 mm, typically extracted by the Tullgren funnel extraction method [17]. Soil-dwelling mesofauna, constituting the bulk of soil organisms, are instrumental in various processes essential for soil formation, development, and improvement [16]. Most soil-dwelling mesofauna, such as mites and springtails, possess minuscule body sizes, fragile body structures, and limited migratory abilities, making them extremely sensitive to changes in environmental conditions [18]. In environmental gradient processes in particular, soil-dwelling mesofauna appear to directly indicate variations in ecosystem deterioration [19]. In this regard, soil-dwelling mesofauna are considered to potentially fulfill vital functions in the accurate prediction of soil health, and some previous studies have focused on this issue. From the perspective of mesofaunal community statistical analysis, simple counting of soil-dwelling mesofauna could effectively reflect changes in soil environment, surpassing the analysis of soil microbial properties [20]; mesofaunal community characteristics (abundance, richness, diversity) were closely associated with soil properties, but the additional nitrogen might have a general negative impact on the community [21]. Considering various taxonomic groups of mesofauna, epedaphic and euedaphic Collembolans played relatively important roles in assessment of land degradation [22]; abundance, richness and diversity of mesostigmatid mite communities could increase with declining nitrate-nitrogen levels in European ash stands [23]. Nevertheless, studies examining the relationships between soil-dwelling mesofauna and soil quality, particularly compared to physical, chemical, and other biological features, have been relatively lacking [24].
Considering this background, soil quality levels were quantified by utilizing soil quality index (SQI). Soil-dwelling mesofauna were collected from the agricultural lands under investigation. Here, we hypothesize (H1) that the community characteristics of medium-sized soil invertebrates are negatively affected by soil quality decline in the Mollisols region and (H2) that soil quality decline impacts different taxa of soil-dwelling mesofauna to varying extents.

2. Materials and Methods

2.1. Study Area and Sampling Design

To gain deeper insights into this knowledge gap, we set up an investigation in agricultural lands of the Mollisols Region, which is located on the Songnen Plain of Northeast China. This investigation was carried out in the southeast region of the Songnen Plain, Harbin, Heilongjiang Province, China (45°43′–45°46′ N, 126°53′–126°58′ S), and this region is situated on the south bank of the Songhua River, at the intersection of an alluvial plain and low hills (Figure 1). It features a temperate continental monsoonal climate and experiences an average annual temperature of 5.6 °C and an average annual rainfall of 550 mm. Mollisols are the dominant soil type in the study area, with pH levels that are slightly acidic to neutral and a rich organic material content. The predominant crop cultivated in the area is maize (Zea mays).
The most conspicuous sign of soil quality decline is decrease in crop yield [25]. Consequently, we searched for continuously cropping fields with different levels of average annual maize yields in this study area. The average annual maize yield over three years in these fields was estimated by consulting local farmers after the final harvest in 2021, and five levels of average annual yields were selected for this study (Table 1). Then, we roughly estimated soil nutrients using an IN-HT300 rapid soil nutrient tester (Comecause, China) to select fields within a gradient of soil quality decline. Finally, five sampling fields were selected in this study (Figure 1). In this study, we requested that the field administrators maintain agricultural management methods at the same level for maize cultivation. The maize variety was Hongxu 78. Conventional fertilizer application and tillage practices commonly used in Northeast China were applied. Encapsulated urea, triple superphosphate and potassium sulphate were used as fertilizer, with application rates of N 180 kg/hm2, P2O5 120 kg/hm2, K2SO4 100 kg/hm2, respectively. To avoid impacting soil-dwelling mesofauna, insecticides were not used in this study. Soil samples were collected in August 2022 (R3 stage of maize), corresponding to the active period of soil-dwelling mesofauna, while minimizing the disturbance from tillage. Three separate sampling stands (200 m × 200 m) were selected from each sampling field in the study area. Randomly, five replicate sampling plots (1 m × 1 m) were set up, one in each sampling field. In each sampling plot, a soil sample (cross-section: 100 cm2; depth: 20 cm) was taken to extract soil-dwelling mesofauna. In this investigation, we collected 75 fresh samples (5 levels × 3 replicated stands × 5 replicated plots) from different fields. Concomitantly, we obtained other soil samples from each plot (depth: 20 cm) using soil augers to determine soil properties. The weather during the collection of these samples was sunny and rain-free.

2.2. Processing of Samples

The soil samples (used for extracting soil-dwelling mesofauna) were brought back to the laboratory and then placed in Tullgren funnel extractors. Standard bulbs of 25 W output provided both light and heat. The mesh size of Tullgren funnel extractors was 10 mesh sieves (2 mm). The soil samples were extracted for 48 h at 40 °C. After extraction, soil-dwelling mesofaunal specimens were all stored in 75% ethanol. Counting of specimens and identification of their taxonomic ranks up to the familial (subordinal) levels were conducted under a Nikon SMZ745T stereoscopic microscope [26].
The soil samples (used for determining soil properties) were naturally air-dried, with the removal of litter, roots, and gravels. Determination of soil properties was carried out following standard procedures [27,28,29,30]. Briefly, the Walkley-Black method was employed for measuring soil organic matter (SOM); a Seal AA3 continuous flow auto-analyzer was applied to determine soil total nitrogen (TN), phosphorus (TP), available nitrogen (AN), phosphorus (AP); a Thermo atomic absorption spectrophotometer was applied to determine soil total potassium (TK), available potassium (AK), exchangeable calcium (ExCa), magnesium (ExMg), and manganese (ExMn); and a cylinder method was utilized for quantifying soil bulk density (SBD).

2.3. Assessment of Soil Quality

Soil quality levels were quantified by utilizing soil quality index (SQI) in different sampling fields. Firstly, the minimum dataset (MDS) was performed to select soil properties indicators for calculating SQI [31]. The MDS was established by combining normalized values based on the method of data reduction using principal component analysis (PCA). All soil properties from the entire sample set were included in the PCA as descriptor indicators. In PCA, the variability was examined by eigenvalues of different principal components (PCs), and the PC with an eigenvalue of 1 or more was considered [32]. To prevent some important indicators from being left out, the norm values of soil properties indicators’ weight loadings were calculated [33]. Subsequently, the soil properties indicators were chosen for the MDS if their norm values were at least 90% of the maximum value. The following equations were utilized to calculate the norm value:
N i k = 1 k u i k 2 λ k
where Nik represents the norm value of soil properties indicators i on first k-th PCs, uik is loading of soil properties indicators i on PC k, and λk is the eigenvalue of the PC k.
After that, soil properties indicators were normalized to combinable scores within the range of 0 to 1 using the linear scoring (LS) and non-linear scoring (NLS) systems [34]. Two categories of indicators’ scoring functions were assigned to soil properties indicators based on their impact on soil productivity [35]. Briefly, the SBD was classified as “the lower, the better”, whereas other indicators were categorized as “the more, the better” [36]. The following two equations were utilized to calculate the combinable scores in the LS system [37]:
L S = X H
L S = L X
where LS represents the score of a soil properties indicator based on linear scoring (LS) systems, Equation (1) is the scoring function which follows “the lower, the better” category, Equation (2) is the scoring function which follows “the more, the better” category, X represents the original value of an indicator, and L and H represent the lowest and highest values of an indicator among all the samples, respectively.
In the NLS system, a sigmoidal curve was applied using the following equation to calculate the combinable scores [38]:
N L S = 1 1 + X X 0 b
where NLS represents the score of a soil properties indicator based on non-linear scoring (NLS) systems, X represents the value of an indicator, X0 represents average value of an indicator among all the samples, b indicates slopes assumed as 2.5 for the category of “the lower, the better” and −2.5 for the category of “the more, the better” [38].
Next, the weight value of a soil properties indicator was calculated based on its communality in PCA. The weight value (Wi) was calculated as the proportion of the communality of a soil properties indicator to the summation of all indicators’ communalities evaluated in the PCA [39]. Upon scoring and weighing the indicators, the soil quality index (SQI) was carried out based on the following equation [40]. Finally, the SQIs were divided into several levels based on statistical differences of SQI values between each sampling field [41].
S Q I = i = 1 n W i N i
where SQI represents the value of soil quality index, Ni represents the combinable score of soil properties of the i-th indicator, Wi represents weight value of the i-th indicator, and n represents the number of indicators chosen based on the MDS.

2.4. Statistical Analysis

Principal component analysis (PCA) was executed to choose the most appropriate indicators for establishing MDS and calculating SQI. The normality of the soil-dwelling mesofauna and soil property data were examined by a Shapiro–Wilk test in each sampling field. Tukey’s HSD test was applied to compare the differences in soil-dwelling mesofaunal density (individuals/m2), soil properties, and SQIs among each sampling field. The “stats” R 4.3.2 package was used to perform the aforementioned statistical analyses [42].
For the identification of unique and shared taxa across the different levels of soil quality, endemic taxa underwent manual screening. Then, the “VennDiagram” R 4.3.2 package was used to illustrate a Venn diagram [43]. To demonstrate the richness of the soil-dwelling mesofaunal communities, rarefaction curves were created to compare the differences in richness using the “vegan” R 4.3.2 package [44]. The richness of the soil-dwelling mesofaunal communities was quantitatively represented by the taxon number. An unweighted pair group method with arithmetical averages (UPGMA) was implemented to demonstrate community structure of soil-dwelling mesofauna within different levels of soil quality via the “stats” R 4.3.2 package [42]. Then, the result of hierarchical clustering was visualized via a heatmap using the “pheatmap” R 4.3.2 package [45].
Data matrices of the soil-dwelling mesofauna (density, richness), soil physical properties (SBD), total nutrients (SOM, TN, TP, and TK), available nutrients (AN, AP, and AK), and mineral nutrients (ExCa, ExMg, and ExMn) were set up to explore the effects of soil quality decline on soil-dwelling mesofaunal communities. Then, a Mantel test was conducted to examine relationships between different taxa of soil-dwelling mesofauna and each soil property via the “vegan” R 4.3.2 package [44]. Subsequently, to assess the correlations within different data matrices and to estimate the links of soil-dwelling mesofauna to soil quality decline, multiple-factor analysis (MFA) was implemented via the “FactoMineR” R 4.3.2 package [18,46].

3. Results

3.1. Soil Quality

In this investigation, 11 soil properties across the different sampling fields are presented in Table 2. Soil bulk density (SBD) ranged from 1.20 to 1.37 g/cm3, peaking in Sampling Field V (SF V) and bottoming out in SF I. In contrast, all the remaining 10 soil properties reached their minimum values in SF V. These soil properties in SF V, with the exception of soil total nitrogen (TN), potassium (TK), and exchangeable magnesium (ExMg), were significantly lower compared to other sampling fields (p < 0.05). At the same time, the difference in TK among different sampling fields was not significant (p > 0.05).
Soil quality levels were quantified based on a statistical method utilizing soil quality index (SQI), and a minimum dataset (MDS) was performed to select soil properties indicators for calculation of SQI using principal component analysis (PCA). Results derived from PCA indicated that only the eigenvalue of the first principal component (PC1) was higher than 1, accounting for 81.74% of the cumulative percentage of total variation (Supplementary Table S1). Subsequently, the norm value was calculated to select soil properties indicators if the value was at least 90% of the maximum value. The norm values showed that TK (Norm: 1.52), ExMg (Norm: 2.43), and ExMn (Norm: 2.66) were less than 90% of the maximum norm value, and thus they were excluded from the MDS (Supplementary Table S1). Consequently, SBD, SOM, TN, TP, AN, AP, AK, and ExCa were included in MDS to estimate the SQI.
The SQIs from the different sampling fields were illustrated in Figure 2. Whether the linear transformation (LS) or the non-linear transformation (NLS) was performed, the SQIs exhibited the same trend in this investigation. Briefly, the SQIs from SF I were greater than those from other sampling fields; it was obvious that SF V had the lowest value; the rest of the sampling fields were in intermediate positions, respectively. Additionally, the difference in SQI among different sampling fields was significant (p < 0.05), and these SOIs were classified into five levels following Zeraatpisheh’s method [36], including very strong, strong, medium, weak, and very weak. Therefore, to more clearly demonstrate how soil quality decline affects soil-dwelling mesofaunal communities, we designated “SF I” as “very strong soil quality” (VSSQ); “SF II” as “strong soil quality” (SSQ); “SF III” as “medium soil quality” (MSQ); “SF IV” as “weak soil quality” (WSQ); and “SF V” as “very weak soil quality” (VWSQ) in the following text.

3.2. Soil-Dwelling Mesofauna

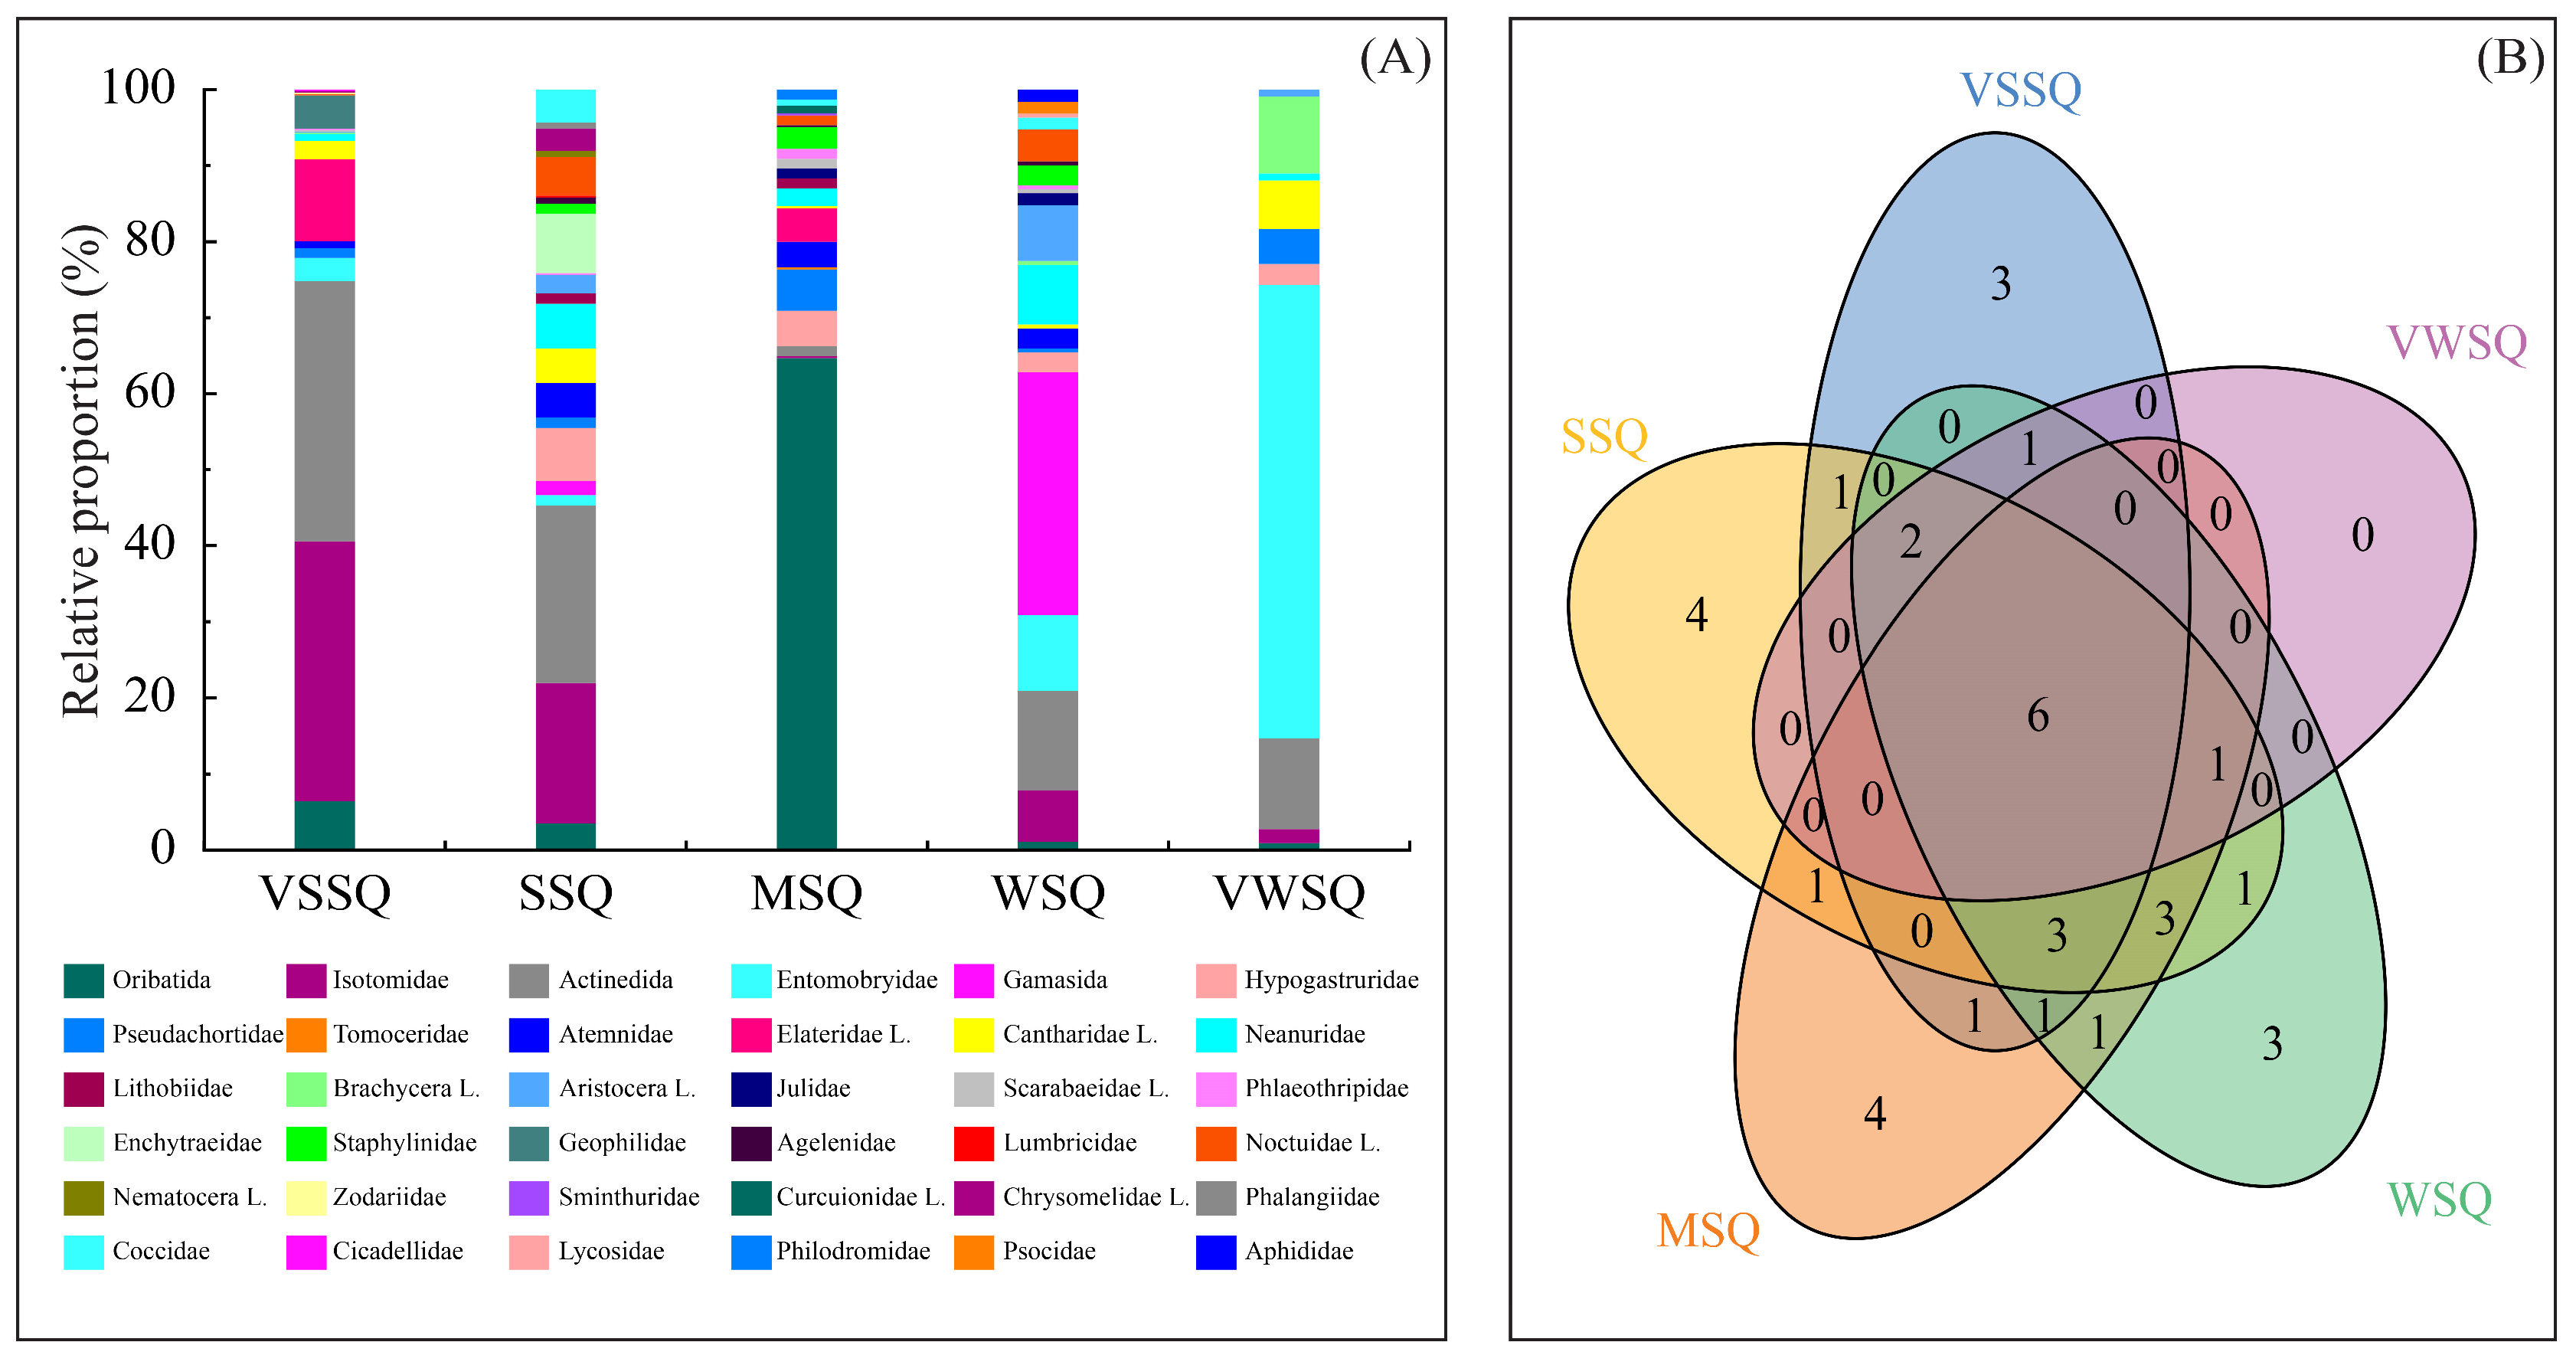
We collected 4815 individuals from all sampling fields, and these soil-dwelling mesofauna belonged to 36 taxa (families/suborders), 20 orders, 6 classes, and 2 phyla. The taxonomic composition of soil-dwelling mesofauna in the different levels of soil quality are displayed in Figure 3. We found that soil quality declines resulted in variations in the taxonomic compositions of the soil-dwelling mesofauna (Figure 3A). In the sampling fields with very strong soil quality (VSSQ), Isotomidae (34.17%), Actinedida (34.17%), and Elateridae (10.79%) were the dominant taxa. Actinedida (23.32%) and Isotomidae (18.50%) occupied dominant positions in the sampling fields with strong soil quality (SSQ). Oribatida (64.68%) was only absolutely dominant in the sampling fields with medium soil quality (MSQ). Gamasida (31.94%) and Actinedida (13.09%) were the dominant taxa in the sampling fields with weak soil quality (WSQ). Entomobryidae (59.63%) and Actinedida (11.93%) were the dominant taxa in the sampling fields with very weak soil quality (VWSQ), in which Entomobryidae accounted for more than half of the individuals.
The unique and shared taxa of soil-dwelling mesofaunal communities are summarized in Figure 3B. Oribatida, Isotomidae, Actinedida, Pseudachortidae, Cantharidae, and Neanuridae were found in all of the sampling fields and contributed 27.27–60.00% of the soil-dwelling mesofaunal taxa. Geophilidae, Zodariidae, and Cicadellidae were unique taxa in the VSSQ fields; Enchytraeidae, Lumbricidae, Nematocera, and Phalangiidae were unique taxa in the SSQ fields; Tomoceridae, Sminthuridae, Curcuionidae, and Philodromidae were the only unique taxa in the MSQ fields; and Lycosidae, Psocidae, and Aphididae were unique taxa in the WSQ fields. However, the VWSQ fields exhibited no unique taxa.
The density of soil-dwelling mesofauna varied across different levels of soil quality (Figure 4A). Regarding the box and whisker plot, specifically, VSSQ fields exhibited significantly higher density in these agricultural lands (p < 0.05); both SSQ and MSQ fields showed significantly greater density than WSQ and VWSQ fields (p < 0.05), with no significant distinction in this respect between SSQ and MSQ fields (p > 0.05); the density in WSQ fields significantly surpassed that in VWSQ fields (p < 0.05); and the minimum value of density was recorded in the VWSQ fields.
The rarefaction curves revealed variations in the richness among these plots (Figure 4B). Plateau formations were observed in the curves for all locations, indicating the comprehensive detection of the majority of the soil-dwelling mesofaunal taxa in these agricultural lands. Among these curves, the richness of soil-dwelling mesofauna was consistently at the lowest level in the VWSQ fields, whereas it was consistently higher in WSQ fields than those in other levels of soil quality. However, the richness in the VSSQ fields was relatively low compared to the other levels of soil quality.
A heatmap demonstrated that the five sampling fields were clustered into four clusters (Figure 5). It revealed that substantial similarity in the community structure of soil-dwelling mesofauna could be found in the WSQ and VWSQ fields, and there were some differences among the other sampling fields. At the same time, a high level of similarity could be observed among the remaining sampling fields. The soil-dwelling mesofaunal communities were also clustered into three clusters. Briefly, Oribatida exclusively constituted the first cluster; Isotomidae and Actinedida were the second cluster; and other species constituted another cluster. The VSSQ fields exhibited a higher density of Isotomidae and Actinedida, and a large count of Oribatida was also observed in the MSQ fields. Additionally, a large portion of soil-dwelling mesofauna was evenly distributed throughout these agricultural lands.

3.3. Relationship between Soil-Dwelling Mesofauna and Soil Quality

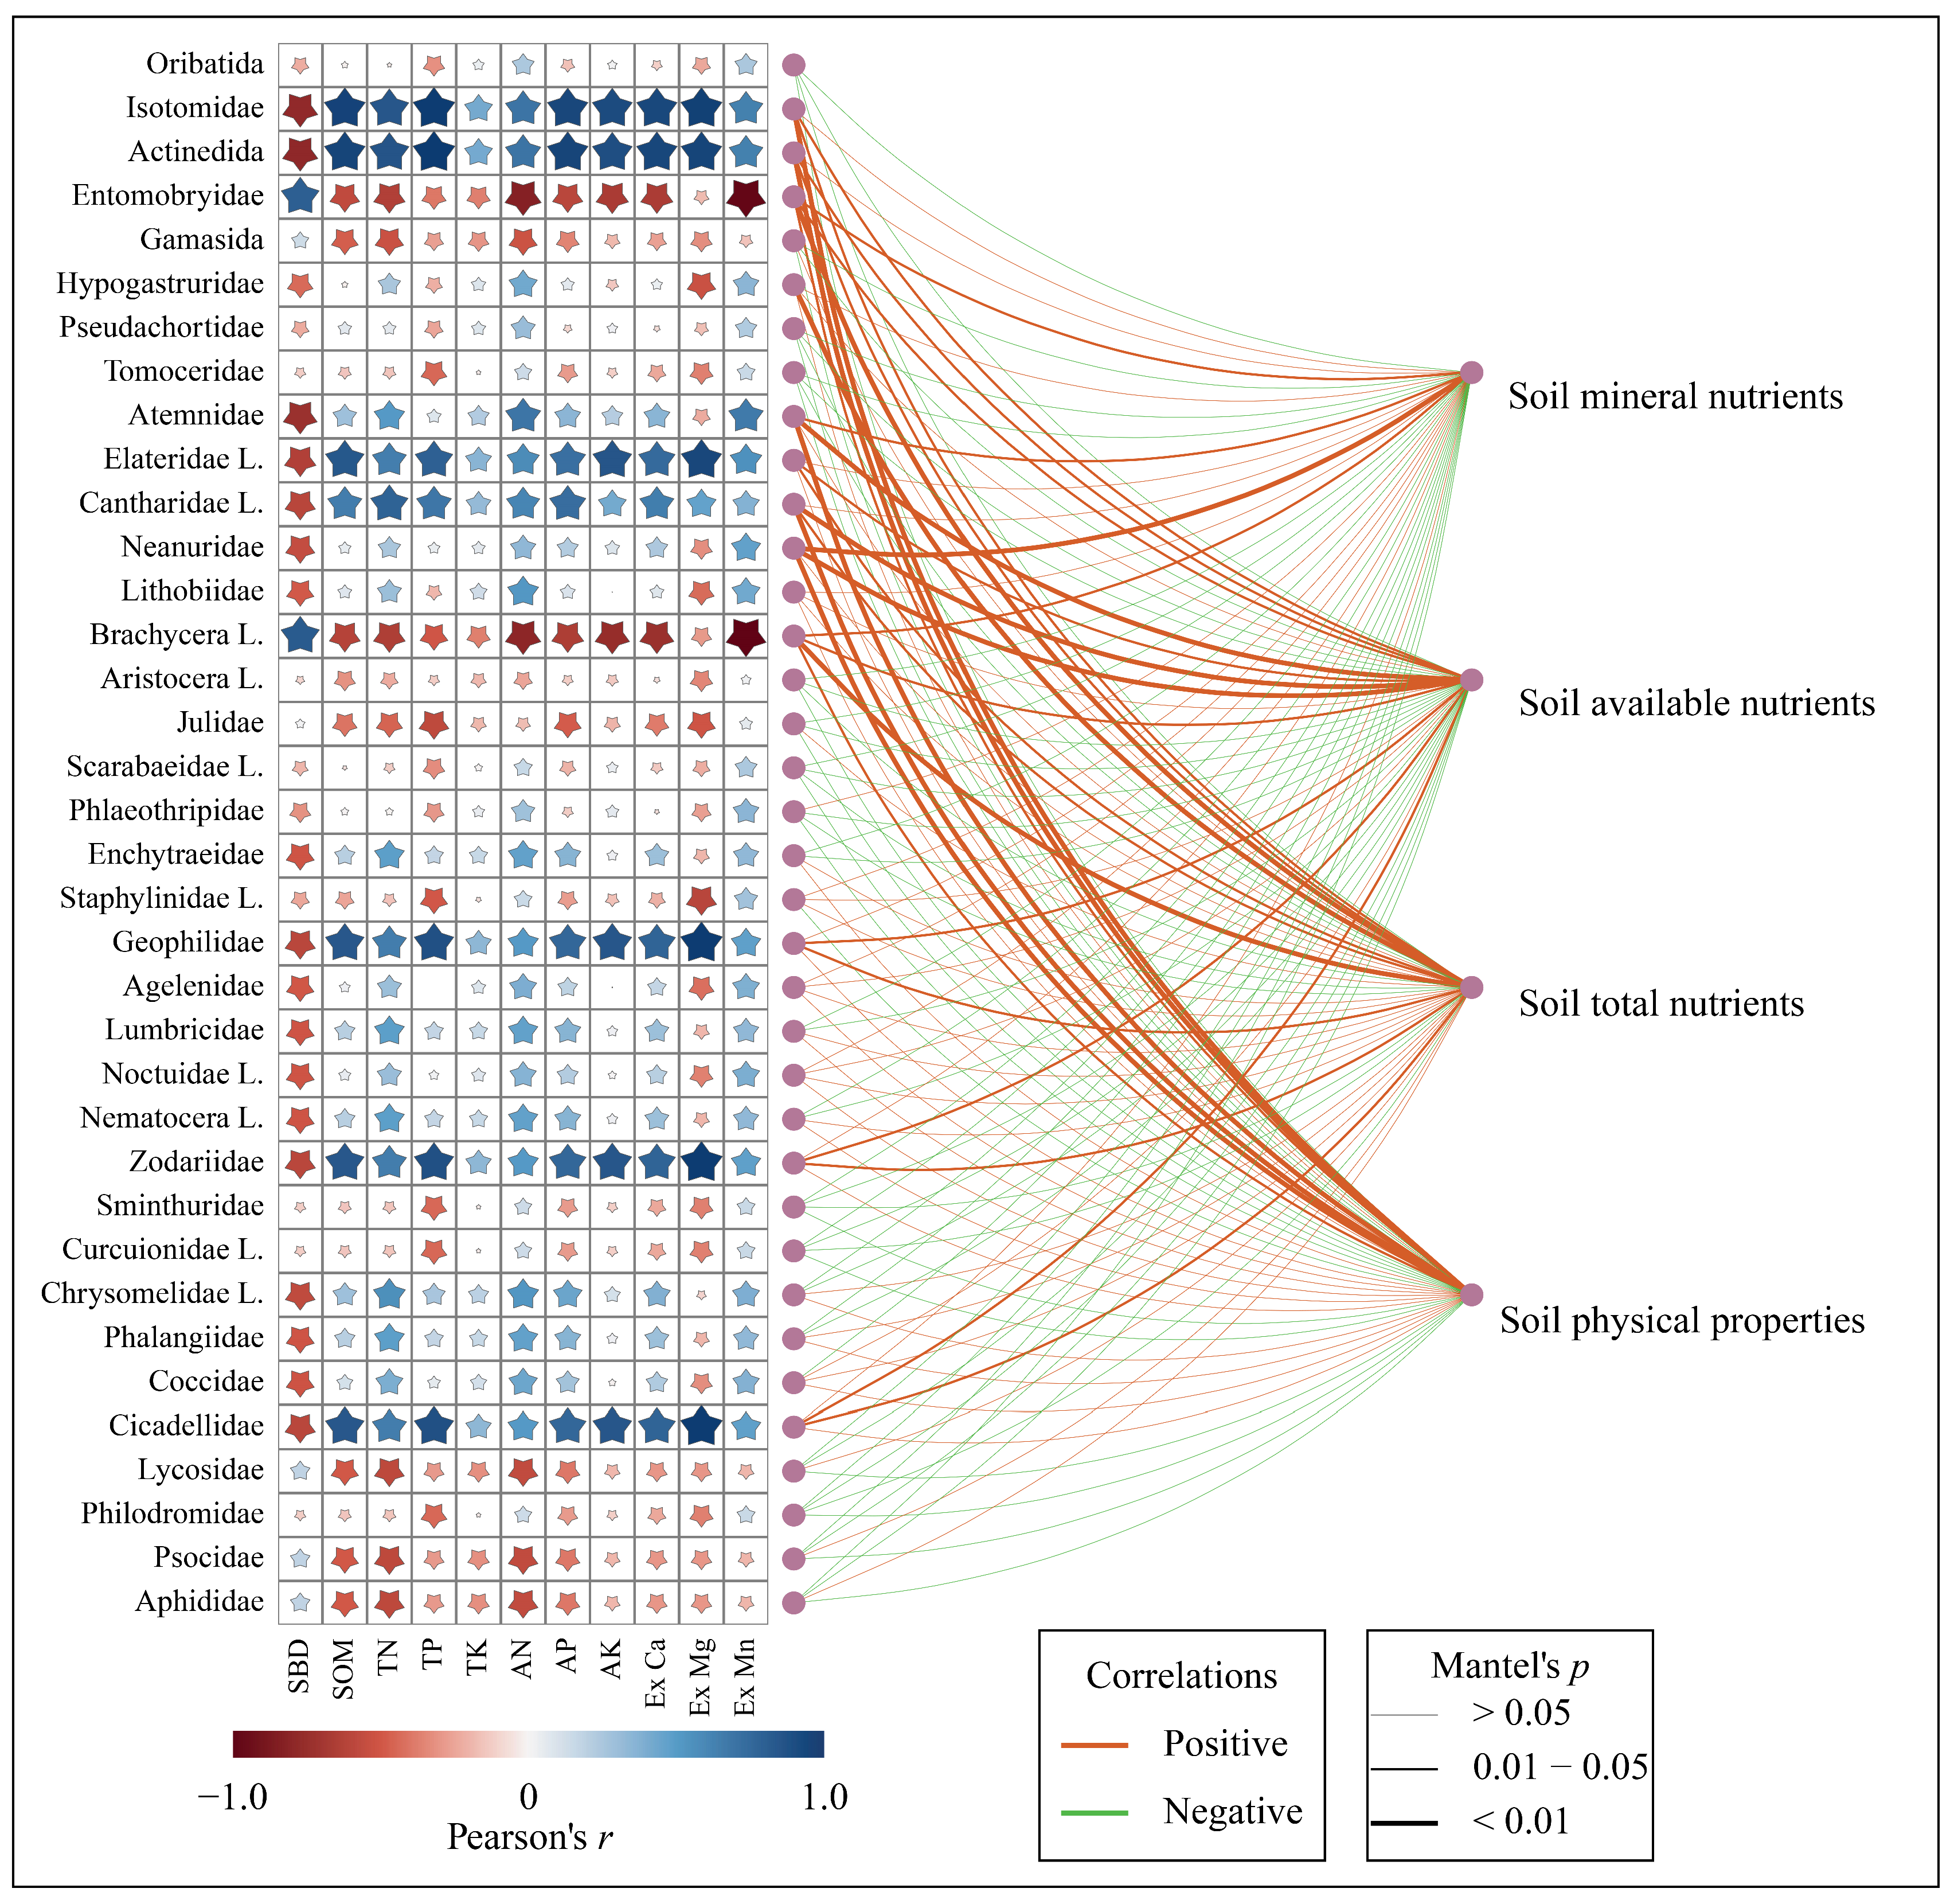
To effectively evaluate the effects of soil quality decline on soil-dwelling mesofaunal communities, a comprehensive evaluation was meticulously conducted to delineate the relationship between soil-dwelling mesofaunal communities and soil quality decline utilizing a Mantel test and an MFA (Figure 6 and Figure 7). We found that the effects of soil physical properties, soil total nutrients, soil available nutrients, and soil mineral nutrients on soil-dwelling mesofaunal communities were primarily characterized by positive influences, and none of the negative influences were significant (p > 0.05). Among these soil properties, the effects of soil mineral nutrients were lower compared to the other factors. At the same time, different soil properties correlated with each taxon of soil-dwelling mesofauna in various ways. For instance, inconspicuous correlations were observed between Oribatida and all of the soil properties; Isotomidae, Actinedida, Elateridae, Cantharidae, Brachycera, Zodariidae, and Cicadellidae were susceptible to the influence of soil properties; and TK exhibited an effect that did not reach statistical significance on the majority of soil-dwelling mesofauna (p > 0.05).
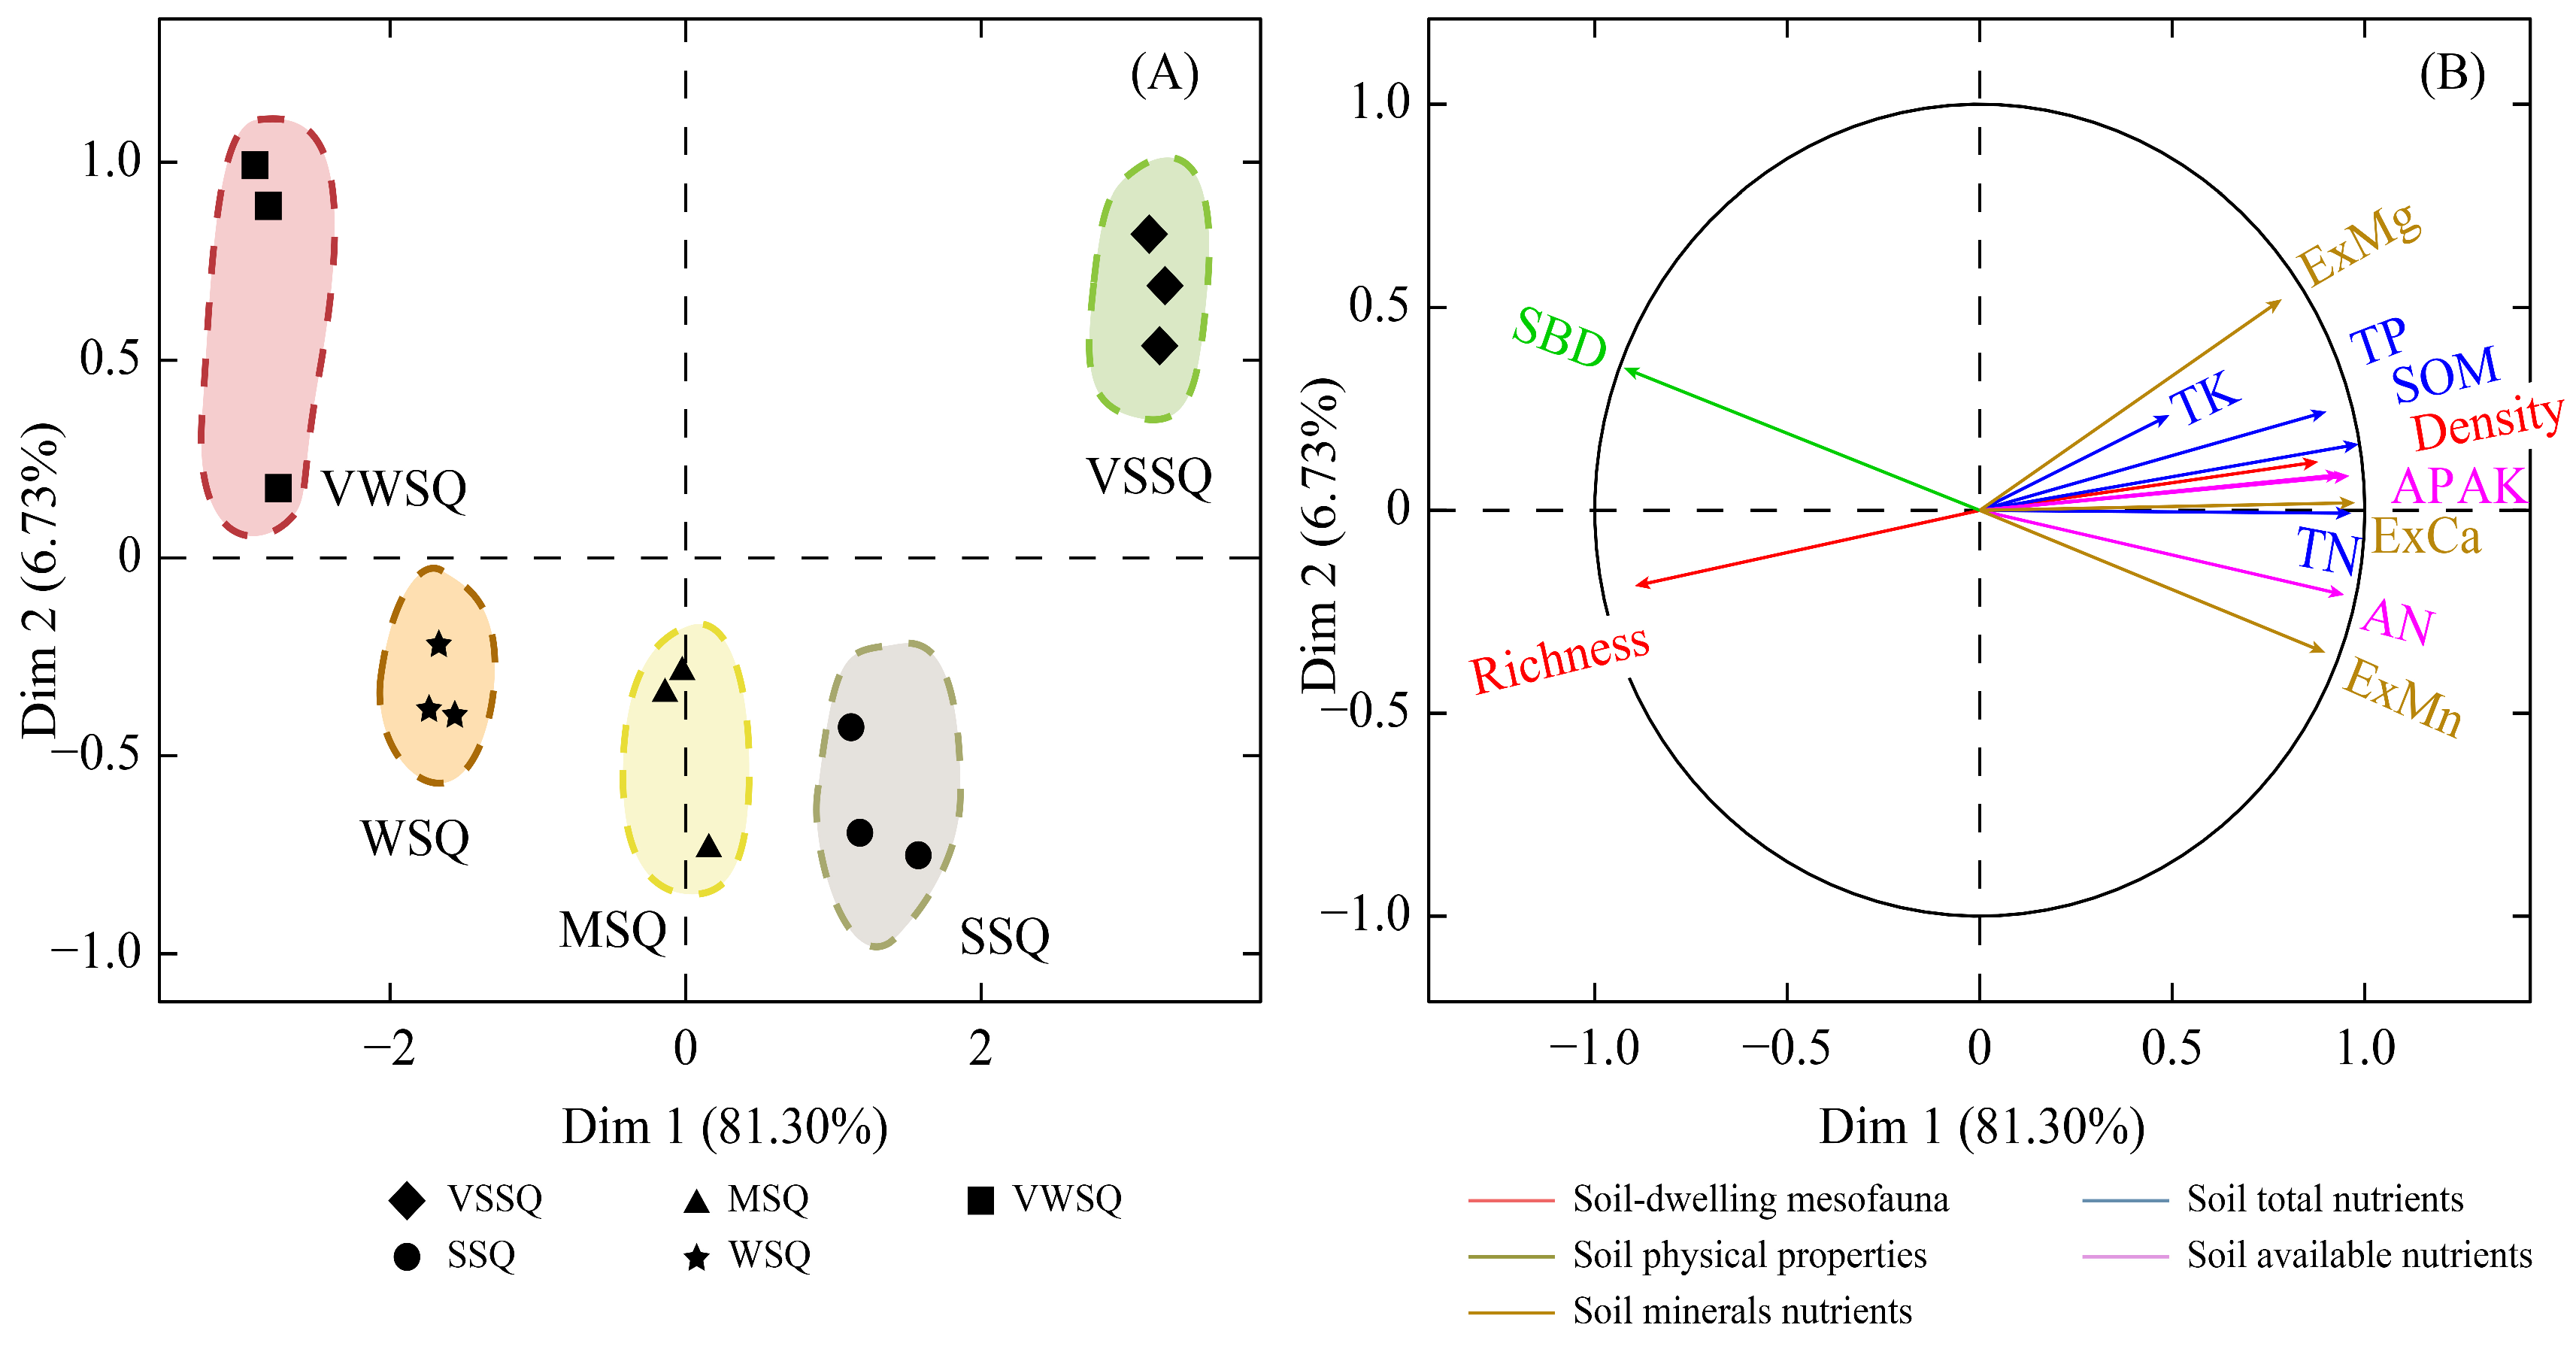
Multiple-factor analysis (MFA) was implemented for estimating the links between soil-dwelling mesofauna and soil quality decline. The results of MFA were demonstrated by a two-dimensional diagram (Figure 7). The two-dimensional space defined by the MFA explained 88.03% of the total variability. Specifically, the axis of dimension 1 (Dim 1) explained 81.30% of the variance. Due to the fact that the VWSQ, WSQ, MSQ, SSQ, and VSSQ fields were positioned along Dim 1 from the negative to the positive direction, we deemed that Dim 1 indicated the gradient of soil quality decline (Figure 7A). This concretely showed that the positive direction indicated a greater level of soil quality, whereas the negative direction indicated a lower level of soil quality.
In the two-dimensional ordination diagram (Figure 7B), the vector representing the density of soil-dwelling mesofauna exhibited an evident positive correlation with Dim 1’s positive orientation. This indicated that soil quality decline decreased the density of soil-dwelling mesofauna. At the same time, the two-dimensional ordination diagram displayed that the vectors representing richness pointed towards WSQ fields and showed negative correlations with density. In addition, the density of soil-dwelling mesofauna was negatively related to soil temperature and soil bulk density.

4. Discussion

4.1. Community Characteristics of Soil-Dwelling Mesofauna under Soil Quality Decline

Soil quality levels in this study were quantified by utilizing soil quality index (SQI), and a gradient of soil quality decline existed among the different sampling fields (Figure 2). In practice, frequent plowing and cultivation during reclamation and planting are primary contributors to soil quality decline in the Mollisols region [47]. The sampling fields in the study area were managed by different local farmers, resulting in varying cultivation histories and levels of land-use intensity, which contributed to a gradient of soil quality decline in this study.
In this study, it was evident that community structures and distribution characteristics of soil-dwelling mesofauna varied across five levels of soil quality. Firstly, we found variations in the taxonomic compositions of soil-dwelling mesofauna across different levels of soil quality (Figure 3A). Compared to other fields with different soil quality levels, Oribatida experienced absolute dominance in the fields with medium soil quality (MSQ), accounting for 64.68% of the total. Oribatida is among the most abundant taxa of soil mites, which live in a variety of habitats where they feed as scavengers on bacteria and fungi [48]. A previous study has revealed that enhanced species diversity and more intricate co-occurrence networks of bacterial communities emerged during the mid-term of soil quality decline [49]. Consequently, this phenomenon might have led to Oribatida being absolutely predominant in the MSQ fields. Meanwhile, Entomobryidae accounted for 59.63% of the total taxa, emerging as the absolute dominant taxa in the sampling fields with very weak soil quality (VWSQ). Entomobryidae, a family of Entomobryomorpha within the Collembola, is commonly consumed by various predators of soil macrofauna, such as Reduviidae and Coccinellidae [50]. Rousseau et al. revealed that soil quality decline could negatively affect soil macrofauna in agroecosystems [51]. Consequently, the very weak soil quality led to the absence of natural predators for Entomobryidae, thereby contributing to their higher proportion in the taxonomic compositions. Subsequently, we observed that the VWSQ fields exhibited no unique taxa; rather, all observed taxa were common within this study area (Figure 3B). This indicated that soil quality decline could reduce the probability of soil-dwelling rare mesofaunal taxa appearing. As substantiated by previous studies, rare taxa of soil fauna were vulnerable to the effects of soil environmental deterioration [52,53].
In the context of soil quality decline, a consistent decrease in the density of soil-dwelling mesofauna was noted (Figure 4A). This finding partially confirms our hypothesis (H1) that the community characteristics of soil-dwelling mesofauna were negatively affected by soil quality decline in the Mollisols region. In general, substantial input of organic matter is an essential element in the maintenance of soil quality in the Mollisols region [54]. Some studies revealed that one of the primary factors contributing to decline in soil quality was decrease in soil organic matter content [55,56], and our investigation also agreed with these findings, as depicted in Table 2. Guidi et al. revealed that a substantial quantity of organic matter can promote good living conditions and food resources for soil-dwelling mesofauna [57]. Therefore, the lack of organic matter led to a shortage of food resources for soil-dwelling mesofauna, resulting in a decrease in their density in areas with weaker soil quality. Concurrently, it was observed that in the sampling fields categorized as weak soil quality (WSQ), medium soil quality (MSQ), and strong soil quality (SSQ), the richness of the soil-dwelling mesofauna was higher than those in the sampling fields with very strong soil quality (VSSQ) (Figure 4B). This was not consistent with our hypothesis (H1). In the VSSQ sampling fields, soil-dwelling mesofaunal density was significantly higher than that in the other sampling fields (p < 0.05) (Figure 4A). A greater number of dominant individuals suggests that the majority of ecological niches have been filled, posing challenges for subordinate individuals in locating suitable habitats and resources, thus limiting their richness [58]. Consequently, a relatively lower richness was found in the VSSQ sampling fields.
Additionally, the heatmap in this study demonstrated that substantial similarity in the community structure of soil-dwelling mesofauna could be found in the WSQ and VWSQ fields, and there were some differences among the other sampling fields (Figure 5). It indicated that the effects of soil quality decline might be more pronounced on the community structure of soil-dwelling mesofauna in environments with relatively stronger soil quality. The competitive exclusion principle implies that when resources are limited, competition will lead to the exclusion or reduction in numbers of organisms with weaker competitive abilities [59]. There is relatively greater resource availability in environments with higher soil quality, leading to relatively less competition among soil organisms [60]. Moreover, we observed notable density variations of Isotomidae from VSSQ to MSQ, with no discernible differences noted in the WSQ (Figure 5). Isotomidae, a family of long-bodied springtails within the Collembola order, is characterized by its minuscule body size, weak physical constitution, and limited capacity for migration [61]. These characteristics might render them particularly vulnerable to competition. Consequently, as soil quality declined in this study, resources became more limited, intensifying competition, pronouncedly altering the community structure of soil-dwelling mesofauna in environments with relatively stronger soil quality. Conversely, a reduction in resources might result in relatively reduced competition among soil-dwelling mesofauna. Therefore, despite a decrease in soil quality, a drastic competitive exclusion effect might not occur, allowing for a relatively similar community structure in the WSQ and VWSQ fields.

4.2. Exploring the Relationship between Soil-Dwelling Mesofaunal Communities and Soil Quality Decline

Our results revealed that 11 soil properties exhibited varied correlations with different taxa of soil-dwelling mesofauna during soil quality decline (Figure 6). This finding confirmed our hypothesis (H2) that soil quality decline impacts different taxa of soil-dwelling mesofauna to varying extents. It is known that significant differences in diets, nutritional requirements, life histories, and life forms are evident among the majority of soil-dwelling mesofaunal taxa [62,63]. In this study, a total of 94.41% of the individuals isolated belonged to the following taxa: Actinedida (19.75%), Oribatida (18.69%), Isotomidae (16.64%), Entomobryidae (6.60%), Elateridae (4.74%), Gamasida (4.24%), Hypogastruridae (3.24%), Neanuridae (3.24%), Atemnidae (2.49%), Pseudachortidae (2.43%), Cantharidae (2.43%), Noctuidae (2.06%), Enchytraeidae (1.81%), Aristocera (1.56%), Geophilidae (1.50%), Coccidae (1.37%), and Staphylinidae (1.31%), and the majority of them were saprophagous or phytophagous soil-dwelling mesofauna, while a minority belonged to predatory fauna. In general, saprophagous and phytophagous soil-dwelling mesofauna depend more on organic matter and inorganic nutrients in the soil for their survival and reproduction [64]. This results in soil properties exerting positive influences on saprophagous and phytophagous fauna. Subsequently, an increase in phytophagous and saprophagous fauna might draw in more predatory fauna to form colonies [65]. Consequently, the effects of soil properties on soil-dwelling mesofauna were primarily characterized by positive influences in this study. At the same time, we observed negative impacts on certain taxa of soil-dwelling mesofauna. However, Mantel’s test indicated that the negative influences of soil properties on soil-dwelling mesofaunal communities were not predominant. While soil properties had negative impacts on partial taxa of soil-dwelling mesofauna, other factors such as food resource availability, competition relationships, and migration patterns, might play more significant roles in the formation and maintenance of mesofaunal communities [66,67]. In this study, these negatively correlated taxa (e.g., Entomobryidae, Brachycera larvae) were mainly distributed in the VWSQ fields. Therefore, contents of soil nutrients might not be the primary factor influencing community composition in environments with very low soil quality.
In addition, our results were congruent with prior research, indicating that monitoring the characteristics of soil-dwelling mesofaunal communities could provide crucial information about soil environmental changes, aiding in maintaining ecosystem health [68]. The two-dimensional ordination plot constructed based on the MFA provided further support for our hypothesis (H2), and it revealed that the density of soil-dwelling mesofauna could signal soil quality decline in agricultural lands of the Mollisols region (Figure 7). A reduction in density could be considered an ecosystem response to degradation, reflecting challenges for soil-dwelling mesofauna in terms of adaptation and survival [69]. Concurrently, soil total nitrogen (TN), phosphorus (TP), and potassium (TK); available nitrogen (AN), phosphorus (AP), and potassium (AK); and exchangeable calcium (ExCa), magnesium (ExMg), and manganese (ExMn) were positively related to the density of soil-dwelling mesofauna. These soil nutrients can promote plant growth, thereby improving the contents of organic matter entering the belowground environment as root exudates and finally increasing the abundance of soil-dwelling mesofauna [70]. Therefore, this finding could suggest that the community characteristics of soil-dwelling mesofauna could reflect soil quality decline to some extent in Mollisols regions.

5. Conclusions

To summarize, changes occurred in the communities of soil-dwelling mesofauna as soil quality declined in agricultural lands of the Mollisols region. The investigation results demonstrated a consistent decrease in the density of soil-dwelling mesofauna with declining soil quality, indicating that density might signal soil quality decline in agricultural lands of the Mollisols region. Amidst soil quality decline, the effects on soil-dwelling mesofaunal communities were not exclusively negative, as greater richness was observed in areas with relatively weaker soil quality. Soil quality decline impacted different taxa of soil-dwelling mesofauna to varying extents. Oribatida was absolutely predominant in agricultural lands with medium soil quality, and most Entomobryidae were found in agricultural lands with very weak soil quality. Additionally, the changes in soil properties during soil quality decline had various effects on the communities of soil-dwelling mesofauna. Soil nutrients, in particular, exhibited a positive correlation with the abundance of soil-dwelling mesofauna in agricultural lands of the Mollisols region, but they might not constitute the primary factor influencing community composition in environments with very weak soil quality. The outcomes of this study carry significance for comprehending how soil quality decline relates to soil-dwelling mesofauna, and can provide valuable ecological insights for formulating biodiversity guidelines targeted at preserving soil resources in the Mollisols region.

Supplementary Materials

The following supporting information can be downloaded at: https://www.mdpi.com/article/10.3390/agriculture14050766/s1, Table S1: Results of principal component analysis (PCA) of 11 soil properties and their norm values for constructing evaluation indicators for the minimum data set (MSD).

Author Contributions

Conceptualization, C.M. and G.D.; methodology, C.M.; software, X.Y.; validation, C.M., X.Y. and G.D.; formal analysis, X.Y.; investigation, X.Y.; resources, C.M.; data curation, C.M.; writing—original draft preparation, C.M.; writing—review and editing, X.Y.; visualization, C.M.; supervision, C.M.; project administration, C.M.; funding acquisition, C.M. and G.D. All authors have read and agreed to the published version of the manuscript.

Funding

This research was funded by the National Key R&D Program of China, grant No.2021YFD1500101; National Natural Science Foundation of China, grant No. 42307413; Heilongjiang Provincial Natural Science Foundation of China, grant No. LH2023D002, and the Youth Talent Project of the Northeast Agricultural University of China, grant No. 19QC35.

Institutional Review Board Statement

Not applicable.

Data Availability Statement

Data will be made available upon request.

Conflicts of Interest

The authors declare no conflicts of interest.

References

  1. Lehmann, J.; Bossio, D.A.; Kögel-Knabner, I.; Rillig, M.C. The concept and future prospects of soil health. Nat. Rev. Earth Environ. 2020, 1, 544–553. [Google Scholar] [CrossRef] [PubMed]
  2. IPCC. IPCC Special Report: Climate Change and Land; IPCC: Geneva, Switzerland, 2019.
  3. Simonson, R.W. Soil Classification in the United States. Science 1962, 137, 1027–1034. [Google Scholar] [CrossRef] [PubMed]
  4. Kassam, A.; Friedrich, T.; Derpsch, R. Global spread of conservation agriculture. Int. J. Environ. Stud. 2019, 76, 29–51. [Google Scholar] [CrossRef]
  5. Kravchenko, Y.S.; Chen, Q.; Liu, X.; Herbert, S.J.; Zhang, X. Conservation practices and management in Ukrainian mollisols. J. Agric. Sci. Technol. 2016, 18, 845–854. [Google Scholar]
  6. Ouyang, W.; Wu, Y.; Hao, Z.; Zhang, Q.; Bu, Q.; Gao, X. Combined impacts of land use and soil property changes on soil erosion in a mollisol area under long-term agricultural development. Sci. Total Environ. 2018, 613–614, 798–809. [Google Scholar] [CrossRef] [PubMed]
  7. Wang, S.; Wang, Z.; Heinonsalo, J.; Zhang, Y.; Liu, G. Soil organic carbon stocks and dynamics in a mollisol region: A 1980s–2010s study. Sci. Total Environ. 2022, 807, 150910. [Google Scholar] [CrossRef] [PubMed]
  8. Adetunji, A.T.; Ncube, B.; Mulidzi, R.; Lewu, F.B. Management impact and benefit of cover crops on soil quality: A review. Soil Till. Res. 2020, 204, 104717. [Google Scholar] [CrossRef]
  9. Zhan, T.; Zhang, Z.; Sun, J.; Liu, M.; Zhang, X.; Peng, F.; Tsunekawa, A.; Zhou, H.; Gou, X.; Fu, S. Meta-Analysis demonstrating that moderate grazing can improve the soil quality across China’s grassland ecosystems. Appl. Soil Ecol. 2020, 147, 103438. [Google Scholar] [CrossRef]
  10. Hermans, S.M.; Buckley, H.L.; Case, B.S.; Curran-Cournane, F.; Taylor, M.; Lear, G. Using soil bacterial communities to predict physico-chemical variables and soil quality. Microbiome 2020, 8, 79. [Google Scholar] [CrossRef]
  11. Leul, Y.; Assen, M.; Damene, S.; Legass, A. Effects of land use types on soil quality dynamics in a tropical sub-humid ecosystem, Western Ethiopia. Ecol. Indic. 2023, 147, 110024. [Google Scholar] [CrossRef]
  12. Yan, S.; Singh, A.N.; Fu, S.; Liao, C.; Wang, S.; Li, Y.; Cui, Y.; Hu, L. A soil fauna index for assessing soil quality. Soil Biol. Biochem. 2012, 47, 158–165. [Google Scholar] [CrossRef]
  13. Li, Y.; Wang, J.; Shao, M. Assessment of earthworms as an indicator of soil degradation: A case-study on Loess Soils. Land Degrad. Dev. 2021, 32, 2606–2617. [Google Scholar] [CrossRef]
  14. Kamau, S.; Barrios, E.; Karanja, N.K.; Ayuke, F.O.; Lehmann, J. Dominant tree species and earthworms affect soil aggregation and carbon content along a soil degradation gradient in an agricultural landscape. Geoderma 2020, 359, 113983. [Google Scholar] [CrossRef]
  15. De Araújo, A.S.F.; Eisenhauer, N.; Nunes, L.A.P.L.; Leite, L.F.C.; Cesarz, S. Soil surface-active fauna in degraded and restored lands of Northeast Brazil. Land Degrad. Dev. 2013, 26, 1–8. [Google Scholar] [CrossRef]
  16. Martin, T.; Wade, J.; Singh, P.; Sprunger, C.D. The integration of nematode communities into the soil biological health framework by factor analysis. Ecol. Indic. 2022, 136, 108676. [Google Scholar] [CrossRef]
  17. Bradford, M.A.; Jones, T.H.; Bardgett, R.D.; Black, H.I.J.; Boag, B.; Bonkowski, M.; Cook, R.; Eggers, T.; Gange, A.C.; Grayston, S.J.; et al. Impacts of soil faunal community composition on model grassland ecosystems. Science 2002, 298, 615–618. [Google Scholar] [CrossRef] [PubMed]
  18. Ma, C.; Yin, X.; Xu, H.; Tao, Y. Responses of soil Collembolans to vegetation restoration in temperate coniferous and broad-leaved mixed forests. J. For. Res. 2020, 31, 2333–2345. [Google Scholar] [CrossRef]
  19. Beaumelle, L.; Thouvenot, L.; Hines, J.; Jochum, M.; Eisenhauer, N.; Phillips, H.R.P. Soil fauna diversity and chemical stressors: A review of knowledge gaps and roadmap for future research. Ecography 2021, 44, 845–859. [Google Scholar] [CrossRef]
  20. Arboláez, H.P.H.; Hu, J.; Orozco, Y.N.; Gebremikael, M.T.; Alcantara, E.A.; Sleutel, S.; Höfte, M.; De Neve, S. Mesofauna as effective indicators of soil quality differences in the agricultural systems of Central Cuba. Appl. Soil Ecol. 2023, 182, 104688. [Google Scholar] [CrossRef]
  21. Ren, H.; Lv, H.; Xu, Q.; Yao, Z.; Yao, P.; Zhao, N.; Wang, Z.; Huang, D.; Cao, W.; Gao, Y.; et al. Green manure provides growth benefits for soil mesofauna by promoting soil fertility in agroecosystems. Soil Tillage Res. 2024, 238, 106006. [Google Scholar] [CrossRef]
  22. Ma, C.; Nie, R.; Du, G. Responses of soil collembolans to land degradation in a black soil region in China. Int. J. Environ. Res. Public Health 2023, 20, 4820. [Google Scholar] [CrossRef] [PubMed]
  23. Urbanowski, C.K.; Turczański, K.; Andrzejewska, A.; Kamczyc, J.; Jagodziński, A.M. Which soil properties affect soil mite (Acari, Mesostigmata) communities in stands with various shares of European ash (Fraxinus Excelsior L.)? Appl. Soil Ecol. 2022, 180, 104633. [Google Scholar] [CrossRef]
  24. Mantoni, C.; Pellegrini, M.; Dapporto, L.; Del Gallo, M.; Pace, L.; Silveri, D.; Fattorini, S. Comparison of soil biology quality in organically and conventionally managed agro-ecosystems using microarthropods. Agriculture 2021, 11, 1022. [Google Scholar] [CrossRef]
  25. D’Hose, T.; Cougnon, M.; De Vliegher, A.; Vandecasteele, B.; Viaene, N.; Cornelis, W.; Van Bockstaele, E.; Reheul, D. The positive relationship between soil quality and crop production: A case study on the effect of farm compost application. Appl. Soil Ecol. 2014, 75, 189–198. [Google Scholar] [CrossRef]
  26. Yin, W.Y. Soil Animals of China; Science Press: Beijing, China, 2000. [Google Scholar]
  27. Walkley, A.; Black, I.A. An examination of the degtjareff method for determining soil organic matter, and a proposed modification of the chromic acid titration method. Soil Sci. 1934, 37, 29–38. [Google Scholar] [CrossRef]
  28. Bao, S. Soil Agro-Chemistrical Analysis; China Agricultural Press: Beijing, China, 2000. [Google Scholar]
  29. Klute, A. Methods of Soil Analysis: Physical and Mineralogical Methods; American Society of Agronomy: Madison, WI, USA, 1986. [Google Scholar]
  30. Page, A.L. Methods of Soil Analysis: Chemical and Microbiological Properties; American Society of Agronomy: Madison, WI, USA, 1982. [Google Scholar]
  31. Nakajima, T.; Lal, R.; Jiang, S. Soil quality index of a Crosby silt loam in Central Ohio. Soil Till. Res. 2015, 146, 323–328. [Google Scholar] [CrossRef]
  32. Brejda, J.J.; Moorman, T.B.; Karlen, D.L.; Dao, T.H. Identification of regional soil quality factors and indicators I. Central and Southern High Plains. Soil Sci. Soc. Am. J. 2000, 64, 2115–2124. [Google Scholar] [CrossRef]
  33. Zhang, G.; Bai, J.; Xi, M.; Zhao, Q.; Lu, Q.; Jia, J. Soil quality assessment of coastal wetlands in the Yellow River Delta of China Based on the minimum data set. Ecol. Indic. 2016, 66, 458–466. [Google Scholar] [CrossRef]
  34. Nabiollahi, K.; Golmohamadi, F.; Taghizadeh-Mehrjardi, R.; Kerry, R.; Davari, M. Assessing the effects of slope gradient and land use change on soil quality degradation through digital mapping of soil quality indices and soil loss rate. Geoderma 2018, 318, 16–28. [Google Scholar] [CrossRef]
  35. Andrews, S.S.; Karlen, D.L.; Cambardella, C.A. The soil management assessment framework. Soil Sci. Soc. Am. J. 2004, 68, 1945–1962. [Google Scholar] [CrossRef]
  36. Zeraatpisheh, M.; Bakhshandeh, E.; Hosseini, M.; Alavi, S.M. Assessing the effects of deforestation and intensive agriculture on the soil quality through digital soil mapping. Geoderma 2020, 363, 114139. [Google Scholar] [CrossRef]
  37. Raiesi, F. A minimum data set and soil quality index to quantify the effect of land use conversion on soil quality and degradation in native rangelands of upland arid and semiarid regions. Ecol. Indic. 2017, 75, 307–320. [Google Scholar] [CrossRef]
  38. Bastida, F.; Luis Moreno, J.; Hernández, T.; García, C. Microbiological degradation index of soils in a semiarid climate. Soil Biol. Biochem. 2006, 38, 3463–3473. [Google Scholar] [CrossRef]
  39. Sheidai Karkaj, E.; Sepehry, A.; Barani, H.; Motamedi, J.; Shahbazi, F. Establishing a suitable soil quality index for semi-arid rangeland ecosystems in Northwest of Iran. J. Soil Sci. Plant Nut. 2019, 19, 648–658. [Google Scholar] [CrossRef]
  40. Andrews, S.S.; Karlen, D.L.; Mitchell, J.P. A Comparison of soil quality indexing methods for vegetable production systems in Northern California. Agr. Ecosyst. Environ. 2002, 90, 25–45. [Google Scholar] [CrossRef]
  41. Qi, Y.; Darilek, J.L.; Huang, B.; Zhao, Y.; Sun, W.; Gu, Z. Evaluating soil quality indices in an agricultural region of Jiangsu Province, China. Geoderma 2009, 149, 325–334. [Google Scholar] [CrossRef]
  42. R Core Team. R: A Language and Environment for Statistical Computing. Available online: https://www.R-project.org/ (accessed on 31 October 2023).
  43. Chen, H. VennDiagram: Generate High-Resolution Venn and Euler Plots. R Package Version 1.7.3. Available online: https://CRAN.R-project.org/package=VennDiagram (accessed on 12 April 2022).
  44. Oksanen, J.; Simpson, G.; Blanchet, F.; Kindt, R.; Legendre, P.; Minchin, P.R.; O’Hara, R.B.; Solymos, P.; Stevens, M.H.H.; Szoecs, E.; et al. Vegan: Community Ecology Package_R Package Version 2.6-4. 2022. Available online: https://CRAN.R-project.org/package=vegan (accessed on 11 October 2022).
  45. Kolde, R. Pheatmap: Pretty Heatmaps. R Package, Version 1.0.12. Available online: https://CRAN.R-project.org/package=pheatmap (accessed on 4 January 2019).
  46. Le, S.; Josse, J.; Husson, F. FactoMineR: An R package for multivariate analysis. J. Stat. Softw. 2008, 25, 1–18. [Google Scholar] [CrossRef]
  47. Peng, J.; Yang, Q.; Zhang, C.; Ni, S.; Wang, J.; Cai, C. Aggregate pore structure, stability characteristics, and biochemical properties induced by different cultivation durations in the Mollisol region of Northeast China. Soil Tillage Res. 2023, 233, 105797. [Google Scholar] [CrossRef]
  48. Oszust, M.; Klimaszyk, P. Soil conditions under cormorant colonies favor for mites excepting Oribatida. Acarologia 2022, 62, 974–988. [Google Scholar] [CrossRef]
  49. Xiao, H.; Xu, M.; Wang, Z.; Wang, L.; Wang, J.; Xiao, Y.; Shi, Z. Role of autotrophic microbes in organic matter accumulation in soils degraded by erosion. Land Degrad. Dev. 2022, 33, 2092–2102. [Google Scholar] [CrossRef]
  50. Bernard, E.C. Soil Arthropods: Underfoot and all around. In Encyclopedia of Soils in the Environment; Goss, M.J., Oliver, M., Eds.; Academic Press: Cambridge, MA, USA, 2023. [Google Scholar]
  51. Rousseau, L.; Fonte, S.J.; Téllez, O.; van der Hoek, R.; Lavelle, P. Soil macrofauna as indicators of soil quality and land use impacts in smallholder agroecosystems of Western Nicaragua. Ecol. Indic. 2013, 27, 71–82. [Google Scholar] [CrossRef]
  52. Li, Y.; Ma, L.; Wang, J.; Shao, M.; Zhang, J. Soil faunal community composition alters nitrogen distribution in different land use types in the Loess Plateau, China. Appl. Soil Ecol. 2021, 163, 103910. [Google Scholar] [CrossRef]
  53. Xu, G.; Zhang, Y.; Zhang, S.; Ma, K. Biodiversity associations of soil fauna and plants depend on plant life form and are accounted for by rare taxa along an elevational gradient. Soil Biol. Biochem. 2020, 140, 107640. [Google Scholar] [CrossRef]
  54. Wen, Y.; Kasielke, T.; Li, H.; Zhang, B.; Zepp, H. May agricultural terraces induce gully erosion? A case study from the Black Soil Region of Northeast China. Sci. Total Environ. 2021, 750, 141715. [Google Scholar] [CrossRef]
  55. Li, H.; Zhu, H.; Qiu, L.; Wei, X.; Liu, B.; Shao, M. Response of soil OC, N and P to land-use change and erosion in the black soil region of the Northeast China. Agric. Ecosyst. Environ. 2020, 302, 107081. [Google Scholar] [CrossRef]
  56. Jensen, J.L.; Schjønning, P.; Watts, C.W.; Christensen, B.T.; Obour, P.B.; Munkholm, L.J. Soil degradation and recovery–Changes in organic matter fractions and structural stability. Geoderma 2020, 364, 114181. [Google Scholar] [CrossRef]
  57. Guidi, C.; Frey, B.; Brunner, I.; Meusburger, K.; Vogel, M.E.; Chen, X.; Stucky, T.; Gwiazdowicz, D.J.; Skubała, P.; Bose, A.K.; et al. Soil fauna drives vertical redistribution of soil organic carbon in a long-term irrigated dry pine forest. Glob. Change Biol. 2022, 28, 3145–3160. [Google Scholar] [CrossRef] [PubMed]
  58. Wiens, J.J.; Ackerly, D.D.; Allen, A.P.; Anacker, B.L.; Buckley, L.B.; Cornell, H.V.; Damschen, E.I.; Jonathan Davies, T.; Grytnes, J.; Harrison, S.P.; et al. Niche Conservatism as an Emerging Principle in Ecology and Conservation Biology. Ecol. Lett. 2010, 13, 1310–1324. [Google Scholar] [CrossRef]
  59. Hardin, G. The competitive exclusion principle: An idea that took a century to be born has implications in ecology, economics, and genetics. Science 1960, 131, 1292–1297. [Google Scholar] [CrossRef]
  60. Wardle, D.A.; Bardgett, R.D.; Klironomos, J.N.; Setälä, H.; van der Putten, W.H.; Wall, D.H. Ecological linkages between aboveground and belowground biota. Science 2004, 304, 1629–1633. [Google Scholar] [CrossRef]
  61. Rusek, J. Biodiversity of Collembola and their functional role in the ecosystem. Biodivers. Conserv. 1998, 7, 1207–1219. [Google Scholar] [CrossRef]
  62. Betancur-Corredor, B.; Lang, B.; Russell, D.J. Organic nitrogen fertilization benefits selected soil fauna in global agroecosystems. Biol. Fertil. Soils 2023, 59, 1–16. [Google Scholar] [CrossRef]
  63. Hedde, M.; Blight, O.; Briones, M.J.; Bonfanti, J.; Brauman, A.; Brondani, M.; Sanou, I.C.; Clause, J.; Conti, E.; Cortet, J.; et al. A common framework for developing robust soil fauna classifications. Geoderma 2022, 426, 116073. [Google Scholar] [CrossRef]
  64. Maraun, M.; Martens, H.; Migge, S.; Theenhaus, A.; Scheu, S. Adding to ‘the enigma of soil animal diversity’: Fungal feeders and saprophagous soil invertebrates prefer similar food substrates. Eur. J. Soil Biol. 2003, 39, 85–95. [Google Scholar] [CrossRef]
  65. Woodcock, B.A.; Potts, S.G.; Westbury, D.B.; Ramsay, A.J.; Lambert, M.; Harris, S.J.; Brown, V.K. The importance of sward architectural complexity in structuring predatory and phytophagous invertebrate assemblages. Ecol. Entomol. 2007, 32, 302–311. [Google Scholar] [CrossRef]
  66. Lindo, Z.; Winchester, N.N. Spatial and Environmental Factors Contributing to Patterns in Arboreal and Terrestrial Oribatid Mite Diversity across Spatial Scales. Oecologia 2009, 160, 817–825. [Google Scholar] [CrossRef] [PubMed]
  67. Kardol, P.; Reynolds, W.N.; Norby, R.J.; Classen, A.T. Climate Change Effects on Soil Microarthropod Abundance and Community Structure. Appl. Soil Ecol. 2011, 47, 37–44. [Google Scholar] [CrossRef]
  68. Malheiro, C.; Cardoso, D.N.; Loureiro, S.; González-Alcaraz, M.N. Effects of climate conditions on the avoidance behavior of Folsomia candida and Enchytraeus crypticus towards metal (loid)-contaminated soils. Sci. Total Environ. 2020, 741, 140368. [Google Scholar] [CrossRef]
  69. Kou, X.; Tao, Y.; Wang, S.; Wu, Z.; Wu, H. Soil meso-fauna community composition predicts ecosystem multifunctionality along a coastal-inland gradient of the Bohai Bay. Land Degrad. Dev. 2021, 32, 4574–4582. [Google Scholar] [CrossRef]
  70. Zhang, Y.; Peng, S.; Chen, X.; Chen, H.Y. Plant diversity increases the abundance and diversity of soil fauna: A meta-analysis. Geoderma 2022, 411, 115694. [Google Scholar] [CrossRef]
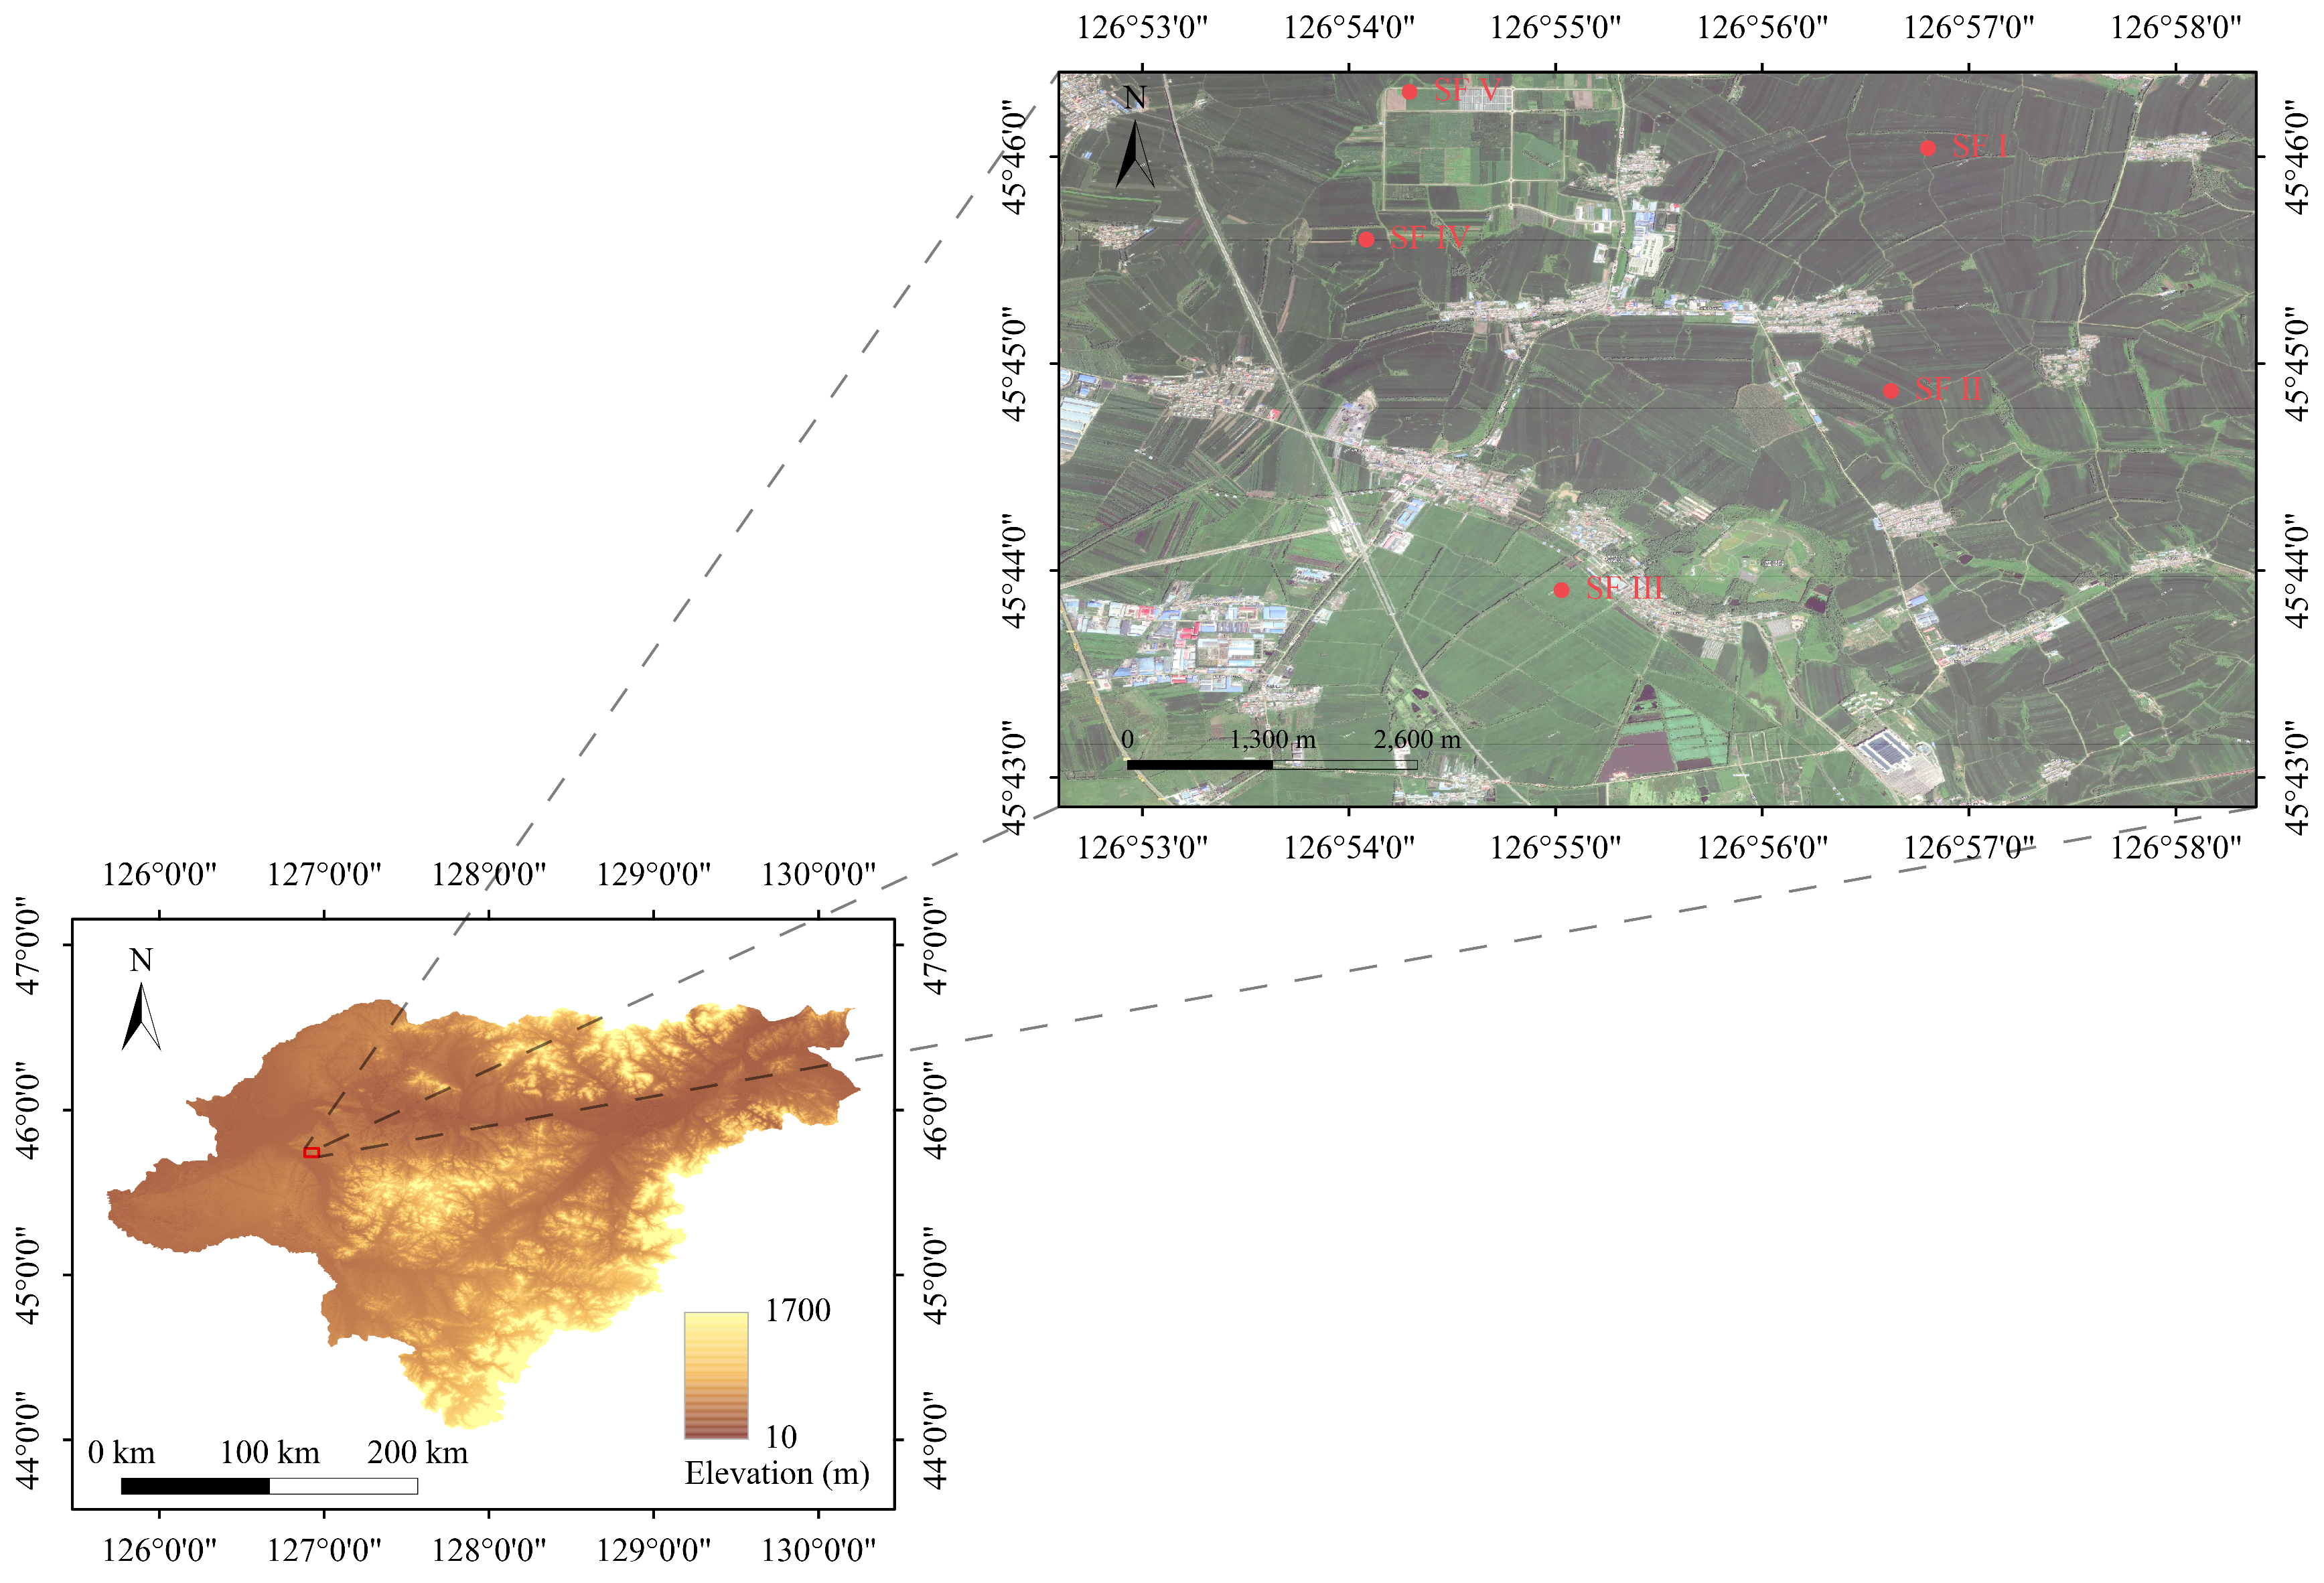
Figure 1. Location of the sampling fields.
Agriculture 14 00766 g001
Figure 2. Soil quality indexes (SQIs) in agricultural lands of the Mollisols region. (A) Soil properties indicators were normalized to combinable scores using linear scoring (LS). (B) Soil properties indicators were normalized to combinable scores using non-linear scoring (NLS) systems. Different letters indicate a significant difference between each sampling field at p < 0.05 based on the statistical method of Tukey’s HSD test. VSSQ, very strong soil quality; SSQ, strong soil quality; MSQ, medium soil quality; WSQ, weak soil quality; VWSQ, very weak soil quality.
Agriculture 14 00766 g002
Figure 3. Soil-dwelling mesofaunal community structures in agricultural lands of the Mollisols region. (A) Taxonomic composition (%) of soil-dwelling mesofauna in the different soil quality levels. (B) The overlap and distinctiveness of soil-dwelling mesofaunal taxa in the different soil quality levels. VSSQ, very strong soil quality; SSQ, strong soil quality; MSQ, medium soil quality; WSQ, weak soil quality; VWSQ, very weak soil quality.
Agriculture 14 00766 g003
Figure 4. Density and richness of soil-dwelling mesofauna in agricultural lands of the Mollisols region. (A) Box and whisker plots depicting density (Ind/m2) of soil-dwelling mesofauna across different soil quality levels, with line in the box indicating mean values of density. (B) Rarefaction curves illustrating richness (taxon number) for density (Ind/m2) of soil-dwelling mesofauna across different soil quality levels. Matching letters indicate no significant difference between each level of soil quality level at p < 0.05. VSSQ, very strong soil quality; SSQ, strong soil quality; MSQ, medium soil quality; WSQ, weak soil quality; VWSQ, very weak soil quality.
Agriculture 14 00766 g004
Figure 5. Distribution characteristics of soil-dwelling mesofauna in agricultural lands of the Mollisols region. Colors symbolize soil-dwelling mesofaunal density (Ind/m2). The right dendrogram represents the clustering of different soil quality levels, while the upper dendrogram shows the clustering of different soil-dwelling mesofauna. These clusters are formed using an unweighted pair group method with arithmetical averages (UPGMA). VSSQ, very strong soil quality; SSQ, strong soil quality; MSQ, medium soil quality; WSQ, weak soil quality; VWSQ, very weak soil quality.
Agriculture 14 00766 g005
Figure 6. Correlations between different taxa of soil-dwelling mesofauna and soil properties. Stars correspond to correlation coefficients between different soil-dwelling mesofauna and each soil property via a Pearson correlation method. Star sizes represent the correlation coefficient’s absolute value. Star color indicates the correlation coefficient. Pairwise comparisons of predictors (soil physical properties, total nutrients, available nutrients, and mineral nutrients) are shown on the right. Edge colors denote correlations via a Mantel test. Edge width represents the correlation coefficient’s absolute value via the Mantel test.
Agriculture 14 00766 g006
Figure 7. Relationships between soil-dwelling mesofauna and soil quality decline. (A) Two-dimensional scatter graph illustrating the variation among the different sampling fields. (B) Two-dimensional ordination diagram representing the relationships based on the entire dataset, including soil-dwelling mesofauna, soil physical properties, total nutrients, available nutrients, and mineral nutrient data. The two-dimensional plots are generated using a multiple-factor analysis (MFA). VSSQ, very strong soil quality; SSQ, strong soil quality; MSQ, medium soil quality; WSQ, weak soil quality; VWSQ, very weak soil quality. SBD, soil bulk density; SOM, soil organic matter; TN, total N; TP, total P; TK, total K; AN, available N; AP, available P; AK, available K; ExCa, exchangeable Ca; ExMg, exchangeable Mg; ExMn, exchangeable Mn.
Agriculture 14 00766 g007
Table 1. Maize yield levels and average annual yields in different sampling fields.
Sampling FieldsYield LevelsAverage Annual Yields (kg/hm2)
SF I Very high yields12,000
SF II High yields10,000
SF IIIModerate yields8000
SF IVLow yields6000
SF VVery low yields4000
Table 2. Summary of descriptive statistics of the 11 soil properties across the different sampling fields (mean ± SE).
Soil PropertiesSampling Fields
SF ISF IISF IIISF IVSF V
Soil bulk density (g/cm3)1.20 ± 0.01 c1.21 ± 0.02 c1.26 ± 0.01 b1.29 ± 0.01 b1.37 ± 0.02 a
Soil organic matter (g/kg)18.45 ± 0.01 a13.60 ± 0.14 b10.92 ± 0.08 c8.29 ± 0.04 d7.24 ± 0.07 e
TN (g/kg)2.23 ± 0.01 a2.11 ± 0.03 b1.65 ± 0.01 c1.35 ± 0.01 d1.3 ± 0.01 d
TP (g/kg)0.63 ± 0.01 a0.54 ± 0.01 b0.46 ± 0.01 cd0.47 ± 0.01 c0.44 ± 0.01 d
TK (g/kg)14.54 ± 0.27 a14.40 ± 0.27 a14.26 ± 0.01 a14.04 ± 0.08 a14.00 ± 0.38 a
AN (mg/kg)225.37 ± 1.12 a223.84 ± 2.15 a210.36 ± 1.44 b181.90 ± 1.12 c173.75 ± 1.09 d
AP (mg/kg)17.03 ± 0.24 a15.38 ± 0.32 b12.69 ± 0.08 c12.24 ± 0.04 c11.1 ± 0.26 d
AK (mg/kg)181.73 ± 2.35 a143.97 ± 1.78 b137.26 ± 1.47 c133.79 ± 2.04 c106.28 ± 1.94 d
ExCa (g/kg)2.52 ± 0.03 a2.08 ± 0.04 b1.59 ± 0.01 c1.53 ± 0.01 c1.12 ± 0.01 d
ExMg (g/kg)0.82 ± 0.01 a0.59 ± 0.02 b0.56 ± 0.01 b0.57 ± 0.01 b0.56 ± 0.01 b
ExMn (mg/kg)63.29 ± 2.00 a60.9 ± 1.03 ab57.74 ± 0.36 b51.77 ± 0.36 c38.20 ± 0.25 d
Note: different letters indicate a significant difference between each sampling field at p < 0.05 based on the statistical method of Tukey’s HSD test.
Disclaimer/Publisher’s Note: The statements, opinions and data contained in all publications are solely those of the individual author(s) and contributor(s) and not of MDPI and/or the editor(s). MDPI and/or the editor(s) disclaim responsibility for any injury to people or property resulting from any ideas, methods, instructions or products referred to in the content.