Abstract
Japan’s susceptibility to and severity of floods have necessitated flood control policies by the government. “Overflowing flood control”, in which the floods due to torrential rains are systematically diverted to agricultural lands in the upper to middle reaches, is one of them. More information is needed on the public assessment of the overflowing flood control policy, and this research seeks to bridge this gap. Data evaluating rice affected by the policy were collected from a random nth-price auction using a developed online system. The sample consisted of 47 consumers living in the downstream areas of the Edogawa River, one of Japan’s first-class, or prime, rivers. Data on their attitudes toward the policy were collected with a questionnaire. Multiple ordered probit models are used for regression analysis. The results show that the sample respondents were willing to pay an average of JPY 1578 for 5 kg of rice, slightly higher than the national average rice production cost, and that 36% of the sample agreed with the flood control policy, which is positively associated with large families or owning many assets.
1. Introduction
In Japan, the annual rainfall of 1718 mm (annual average for 1971–2000), which is twice the world average, is heavily concentrated in the spring rainy season and the typhoon season (National Astronomical Observatory of Japan, 2004) [1]. Many rivers in Japan have a steep gradient. At the same time, one-half of the population is concentrated in alluvial plains, which are susceptive to flooding, so flooding damage, whenever it occurs, can be quite serious. In response, improvement of the physical infrastructure has been undertaken in the past, including dam construction in the upper reaches, construction of retarding basins and diversion channels in the middle and lower reaches, as well as the construction of embankments and dredging of riverbeds.
However, due to the climatic changes accompanying global warming, the frequency of precipitation due to heavy rainfalls and intensive rain bursts has increased in recent years, causing extensive river flooding yearly. Since the rainfall is predicted to further increase by 10–20 percent in the future, it is necessary to discuss disaster reduction and mitigation premised on the occurrence of floods due to rainfall that exceed the capacities of existing flood control facilities.
In response, the Japanese government promulgated “The Law to Partially Amend the Act on Countermeasures against Flood Damage of Specified Rivers Running Across Cities and Other Acts (Act related to River Basin Flood Control)” on 10 May 2021. This amended law was enacted to promote “River Basin Flood Control”, which takes into view entire river basins from the upper to the lower reaches, and in which all concerned parties, including the national government, and local governments which have jurisdiction of the river basins, and residents, work together to carry out flood control.
Among such undertakings for river basin flood control, the present study focuses on the disaster risk mitigation functions of agricultural lands adjacent to urban areas. Specifically, we consider the so-called “overflowing flood control” (Kishi, 2021) [2], in which agricultural lands adjacent to rivers are intentionally flooded following torrential rainfalls via open levees and other mechanisms based on discontinuous levees (Figure 1), rather than relying solely on river embankments to contain the flooding, to reduce the risks of sudden inundation in downstream residential areas.
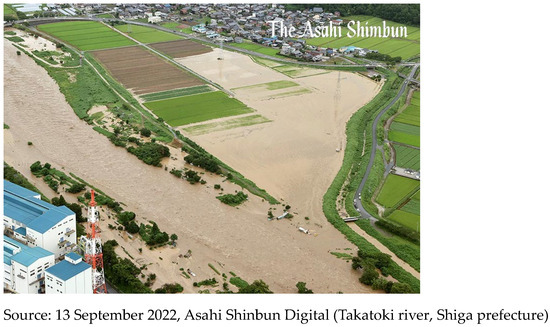
Figure 1.
Case in which wet paddies located in river basin were flooded by open levees.
Flood control based on such retarding functions of agricultural land has been shown to have significant disaster mitigation effects by Terayama and Shimatani (2021) [3] and Osawa et al. (2022) [4]. However, since there is no institutional mechanism established to compensate for the damage caused by the deliberate flooding of agricultural land, this flood control measure is premised on the sacrifice on the part of the farmers (Yamada et al., 2022) [5].
Furthermore, agricultural products that have been inundated are in most cases discarded because, once harvested, they are no longer eligible to receive agricultural insurance (voluntary) payments or because of fear of the consumers’ negative rumors or misinformation (Kishi, 2021 [6]). However, many agricultural products subjected to inundation should have no quality or safety issues if the inundation was temporary and relatively free of sediments, and even if slightly damaged, they can still be used in processing. Therefore, such products could be sold with added value as “agricultural products that were inundated to prevent flooding of the downstream areas”. Even if such “added value” is not feasible, if their marketability or selling price can be established, this could provide a basis for the national or local government to calculate the compensation amount to farmers who received damage. Most of all, this would allow the farmers to avoid discarding crops that they had spent considerable time and energy raising, and thus losing their motivation to farm (Gunji, 2021 [7]).
In this study, therefore, we examine the marketability and economic value of agricultural products that were subjected to inundation as a means to compensate those farmers who received economic damage due to their cooperation with flood control measures. To investigate this subject, we target residents living in downstream areas, who are the potential beneficiaries, and employ an experimental economics approach, which has been gathering attention in recent years in the research to identify market mechanisms. In addition, in the process, we analyze the residents’ awareness of river basin flood control policies and identify the underlying factors descriptively and quantitatively, which should contribute to consensus building among the Japanese.
In addition, there are many international studies related to this issue that have evaluated the damage to farmland and agricultural products caused by floods (Saptutyningsih and Suryanto, 2011 [8]; Chau et al., 2015 [9]; Silva-Aguila et al., 2011 [10]; Chung et al., 2019 [11]). However, all of these studies were based on farmers’ opinions or technical methods and did not ask downstream residents (consumers), who are the beneficiaries of flood control, to evaluate them. Therefore, the findings of this study will be important not only for future flood control policies but also for academic purposes.
2. Methodology
2.1. Random nth-Price Auction
In this study, we employ a random nth-price auction, which involves repeated bids, to assess the damaged agricultural products economically. This auction is a relatively new mechanism and is an improved version of the “second-price auction” described by Vickrey (1961) [12], which was frequently used in the 1990s in the field of experimental economics to identify people’s preferences for goods.
In a second-price auction, the highest bidder makes the purchase but pays the price bid of the second-highest bidder, thus separating the bid from the payment; this has the desirable property (incentive compatibility) of giving bidders an incentive to bid their true values (i.e., the amount they are willing to pay based on their preferences). However, Knetsch et al. (1998) [13] pointed out that bidders who believe they will never win may bid lower than their true preferences. Thus, Shogren et al. (2001) [14] showed that, by combining the Vickrey second-price auction and the Becker–DeGroot–Marschak mechanism, all bidders will be engaged to bid sincerely. This is the random nth-price auction. Initially, the random nth-price auction was used in studies that dealt with purely private goods, such as coffee mugs and beef chuck muscles, Kukowski et al., (2005) [15]. In recent years, however, it has been used to economically assess goods with public environment-related attributes, such as traditional agricultural landscape certification, Borrello et al. (2021) [16], where its validity has been confirmed.
While an auction experiment does not require repeated bidding rounds, it is common to repeat the rounds because of the difficulty of making the participants aware in a single round that the best strategy is to bid honestly, or to observe the effects of the feedback of various information.
2.2. Experiment Procedure
After being approved by the research ethical review committee of the organization to which the authors belong, the auction experiment was carried out in November, 2022. As the good targeted for assessment, we chose rice, which is the product of paddies which among agricultural land possess a large retarding effect.
The experiment procedure is shown in Figure 2. First, to the subjects who were asked to gather online at a given time, we carefully explained the concept of river basin flood control and the mechanism of the random nth-price auction using a video and text with illustrations. To prevent the subjects from exiting during the session, they were divided into groups consisting of five to eight people within the Zoom meeting and instructed to simultaneously access the auction system developed for this experiment from their smartphones or other terminal devices.
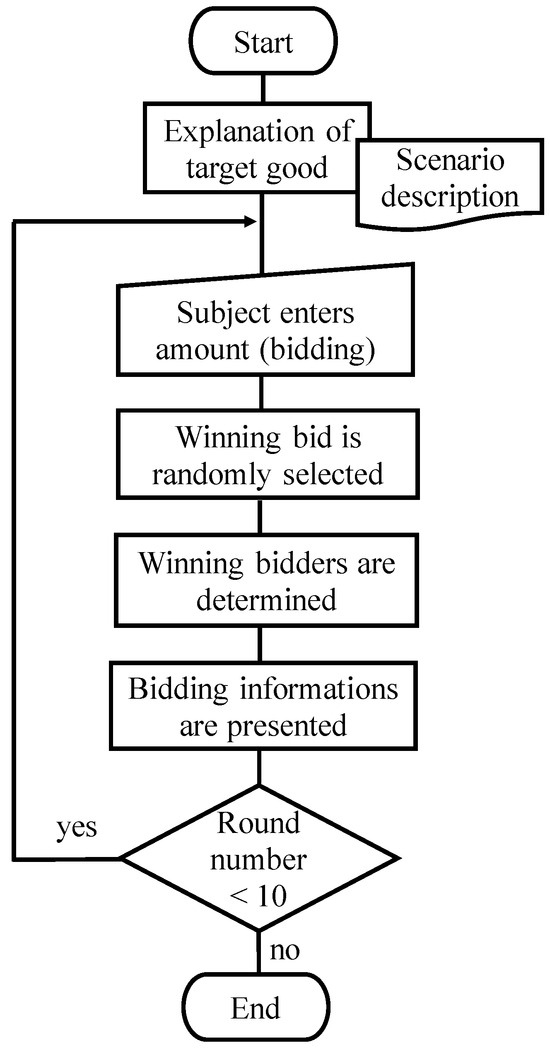
Figure 2.
Procedure of auction experiment.
We then presented the scenario description, shown in Figure 3, and had the subjects place a bid of the maximum amount they were willing to pay for rice that had contributed to flood control. Any subject who did not wish to purchase was asked to enter a check mark for the item “do not wish to purchase”, which had been separately prepared, instead of entering a bid of JPY zero.
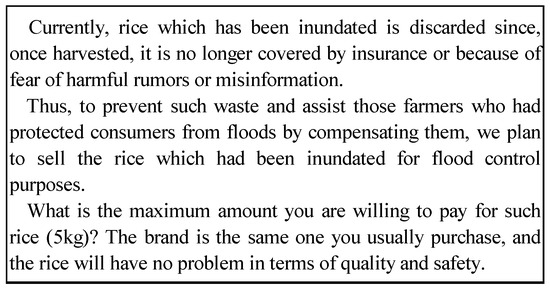
Figure 3.
Scenario description presented to subjects.
When all subjects had placed their bids, an amount was randomly selected from among the entered bids as the winning bid (selling price), and all bidders who had bid higher than this (nth price) were selected as the winning bidders (purchasers).
For each of the second and subsequent biddings, the bidding result (whether the subject was successful in the purchase or not) and the winning bid (purchase price) of the previous trial were fed back to the subjects. However, there is an academic debate on whether the information about the winning bid should be presented to the participants or not when carrying out auctions with repeated rounds (Corrigan et al., 2012 [17]). Therefore, we placed some subjects into a group to which the winning bid was not fed back so as to investigate this issue, and compared the results with the other group to which the winning bid was fed back (the bidding results were fed back to all subjects).
This process was repeated a total of ten times. Although there are no clear guidelines for setting the number of rounds, it is common practice to repeat for about ten rounds under the same condition, as seen in the experiment by Shogren et al. (2001) [14], so we followed this practice.
Furthermore, after the experiment, we had the subjects answer questions regarding their awareness of basin flood control policies and attributes that may affect their preferences for inundated rice (individual, household, living arrangement, inundation experience, disaster awareness, etc.).
To achieve the objectives of this study, the two types of data thus collected (willingness to pay for rice, awareness of basin flood control policies) are regressed on the attributes of consumers and residents.
3. Outline of Subjects
As the participants in the experiment, we sampled 60 residents living in downstream areas of Edogawa River (within the red borders in Figure 4). Based on the assumption that disaster awareness is likely to be different depending on whether the subject lived in an assumed inundation area or not, the sample was divided into two groups of equal size: one consisting of those living in areas where the assumed inundation was 0.5 m or greater (yellow, pink, and red areas in Figure 4) and the other consisting of those living in areas where the inundation is assumed to be less than 0.5 m. Similarly, the sample was selected to represent an equal number of the sexes.
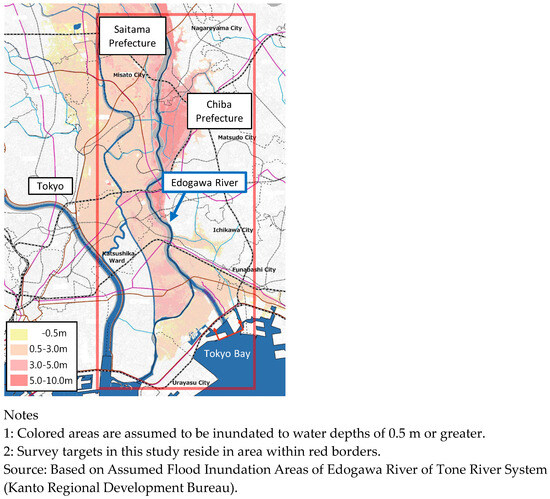
Figure 4.
Assumed flood inundation area in downstream areas of Edogawa River.
Since the subjects were unfamiliar with the auction system developed for the present experiment, 10 of them failed to access the system due to trouble operating their terminal devices, so 50 participated in the experiment. Of these, one was unable to take part in the post-experiment survey due to other engagements, while two were removed because their responses were found to diverge significantly from the general pattern, in terms of indices such as the residuals and Cook’s distances, and thus considered to have an undesirable effect on the analysis results. Thus, this study’s final sample targeted for analysis consisted of 47 subjects.
The major attributes of the 47 subjects are presented in Table 1. In terms of the areas of residence, Chiba and Saitama prefectures make up 85 percent, while the remaining 15 percent resided in Tokyo (Katsushika Ward). Occupationally, office workers made up about half, followed by 15 percent consisting of housewives, and 13 percent of part-time workers, with no farmers. Regarding academic background, 64 percent were graduates of universities or graduate schools, which is higher than the 27 percent share of university graduates in Tokyo prefecture (2020, Ministry of Internal Affairs and Communications). The average age was 48, and those in their 50s made up 34 percent.

Table 1.
Subject attributes (n = 47).
The average yearly household income, computed from the frequency distribution, was JPY 7,550,000, which is somewhat higher than the average of the Tokyo Prefecture of JPY 6,290,000 (2019, Ministry of Internal Affairs and Communications). The average number of household members was 2.5, which is higher than the average for Tokyo: 1.9 (2020, Ministry of Internal Affairs and Communications). Regarding residence status, 49 percent lived in stand-alone houses, and 66 percent owned their residence. According to the Ministry of Internal Affairs and Communications, the percentage of stand-alone houses in 2018 was 24 percent in Tokyo and 54 percent in Chiba, while the percentages of house ownership were 46 percent in Tokyo and 66 percent in Chiba, indicating that the residence status of the sample group is representative of the average in the corresponding areas.
As to the experience and awareness of disasters, 17 percent had experienced inundation, including that at their parents’ houses, while 75 percent had checked the flood hazard map (same as Figure 4). In a survey by Mizuki (2012) [18] targeting residents of Kita ward in Tokyo, 32 percent had checked the local hazard map, which seems to indicate a drastic increase in disaster risk mitigation awareness over the past ten years. Furthermore, as measures of preparedness against flooding, one-half had taken out flood insurance, while 87 percent kept stores of food and beverages. Fifty-seven percent kept emergency carry bags on hand or had confirmed evacuation sites or routes, which indicates that, in recent years, the residents not only have had an awareness of disasters but have further taken action in this direction.
Finally, when asked their views on whether they agree or not with river basin flood control policies, on a five-point scale, 36 percent responded favorably, and 45 percent somewhat agreed, showing an overall approval. The types of residents who agree are quantitatively examined in the final section.
4. Experiment Results
4.1. Validity of Auction and Publicness of Goods
Figure 5 shows the variation in the average bid over ten rounds, and Table 2 presents a summary. We first examine whether the mechanism of a repeated round auction functioned adequately.
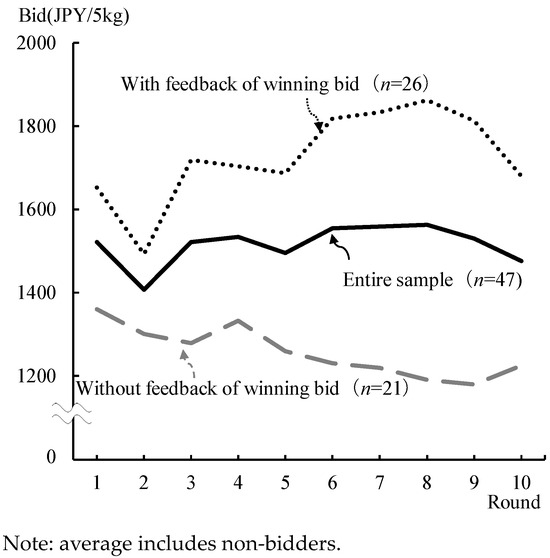
Figure 5.
Trend of average bid.
Table 2.
Overview of bids.
Let us look at the average standard deviations according to subject group, presented at the bottom section of Table 2. We see that the standard deviation of the second half (rounds 6–10) is lower than that of the first half (rounds 1–5) regardless of whether feedback of the winning bid was given or not. This indicates that, as the bidder placed bids over several rounds, the awareness grew that the best strategy is to bid the amount he or she feels to be the most appropriate, resulting in the individual assessments converging. This, then, can be interpreted to mean that the mechanism of incentive compatibility worked as expected.
Looking next at the trend of average bids in Figure 5, we see that the average bid does not vary greatly over the ten rounds, although the plots differ depending on whether feedback of the winning bid was given or not. In the case of public goods, due to the incentive to get a “free ride” in which “one hopes to receive the benefit of a public good while paying as little as possible”, the average payment tends to fall further the later the round, as verified by Andreoni (1988) [19] and Isaac and Walker (1991) [20]. Meanwhile, in the present experiment, even though the publicness of “inundated for the sake of flood control” was imparted to the target good (inundated rice), no statistically significant difference was found (p = 0.49) between the first-round bid (JPY 1590) and the final-round bid (JPY 1477). This suggests that the “free rider problem” is unlikely for rice, which is essentially a private good, even when given a degree of publicness.
4.2. Presence or Absence of Market and Economic Value of Damaged Agricultural Products
Returning to Table 2, the auction participation status given in the top section shows that 44 (94 percent) of the 47 subjects placed bids in the final round (10). In other words, only three participants expressed their preference to “not make a purchase”, which verifies that a market exists (i.e., they can be sold) for disaster-damaged agricultural products which are currently being discarded. Asked to state their reasons for “prefer to not purchase”, one subject stated that “it may have some remnant smell” (the reasons for the other two are unknown).
The average final-round bids (second section of Table 2) were JPY 1578 when only bidders are considered, and JPY 1477 when non-bidders are included. When asked about the price of rice they usually purchase (same brand as the experiment target good), the overall average was JPY 1890, which indicates that the subjects assessed the inundated rice JPY 312–413 (17–22 percent) lower. Considering that the average production cost of rice in Japan is JPY 1273, as announced by the Ministry of Agriculture, Forestry and Fisheries, it can be said that there will be little profit for farmers.
A detailed comparison of this is presented in Table 3. Eleven (25 percent) of the forty-four subjects assessed the inundated rice higher than the rice they usually purchase, which indicates that they placed an added value for the reason that the rice “protected the downstream areas in which they live from floods”, and thus placed bids with an average premium of JPY 384. The remaining 33 subjects (75 percent) did not place such an added value based on flood control, instead regarding the rice as merely inundated rice. Of these, 30 subjects (68 percent) placed bids that were on average JPY 651 lower than the currently purchased rice, while 3 (7 percent) placed bids that were the same as their usual purchase prices. Although they were not asked why they placed lower bids, they may have placed bids from the standpoint of reducing food losses, thinking that “it was wasteful” since we had explained beforehand that inundated rice is presently discarded.
Table 3.
Comparison of price of rice usually purchased and placed bid.
The above findings indicate that an agricultural product (rice) which has been inundated in the context of “overflowing flood control” can be shipped and sold. However, either the national or local government should compensate the discounted value, or alternatively, it should be sold only to those consumers who are willing to pay the same (market) or premium prices. In the latter case, however, the market size (number of purchasers) will be reduced to one-quarter so careful marketing will be needed. The quantitative analysis presented in the following section should provide material for such an undertaking.
4.3. Feedback of Winning Bid
In conventional repeated round auctions, the usual practice has been to feed back the winning bid along with the bidding results, based on the traditional concept that providing market information is essential to allow the market to function correctly. However, based on an experiment that compared two kinds of second-price auctions, Corrigan et al. (2012) [17] pointed out that providing feedback of the winning bid made bidders place bids that departed from the induced values, or true preferences.
In this study, therefore, we examine whether feedback about the winning bid also affects performance in random nth-price auctions.
Comparing first the standard deviations in the first and second halves according to the subject group, presented in the bottom section of Table 2, we see that the group without feedback about the winning bid converges better, indicating that the auction is functioning correctly. Moreover, Figure 5 shows that the average bid of the group with feedback is higher throughout the ten rounds, and in particular increases from the earlier rounds to the middle ones. This suggests the possibility that the subjects’ competitiveness was aroused by providing feedback of the winning bid (particularly from the earlier to the middle rounds, when their assessments were not yet settled). In the later rounds, it appears that this competitiveness has settled down and corrections kick in, although the final average bid is still JPY 455 higher than the group without feedback.
In the following section, we statistically examine the effect that the winning bid has on the bid.
5. Quantitative Analysis
5.1. Assessment Factors of Inundated Rice
First, we estimated a multiple linear regression model to examine the determinants of willingness to pay (WTP) for the inundated rice expressed by residents/consumers (Table 4, full model). However, heterogeneity was observed.
Table 4.
Multiple regression models for bids placed on inundated rice.
The maximum likelihood method is used to deal with the heterogeneous problem. The specification of the model is:
where is the dependent variable measuring the WTP of the ith consumer; is a (k × 1) vector of observed explanatory variables; are the m variables that model the variance function; β and α are (k × 1) and (m × 1) vectors of unknown parameters, respectively; and is the random error term, which is assumed to be normally distributed with mean 0 and variance .
The final-round (10) bid is selected as the dependent variable. In model I (full model), the explanatory variables consist of two pieces of information on the round 9 bid and the subjects’ basic attributes. Crop characteristics (color, grain size, shape, etc.) could also be considered factors in WTP, but since inundated rice has never been shipped before, we did not have that data available. Model II consists of explanatory variables selected from model I on a trial-and-error basis based on p-values, the condition number, and the Akaike information criterion (AIC).
In model I, the adjusted R-squared is 0.73, indicating a relatively good fit, but the condition number exceeds 51, which suggests serious multicollinearity. Furthermore, the AIC, lower values of which indicate a good estimation model, is larger in model I. Therefore, we adopt model II in the present study.
We examine the estimation results in reference to model II. The “winning bid feedback dummy”, with “1” indicating the group which was given feedback of the winning bid in round 9 and “0” the group without feedback, has a positive value and is significant at the 0.01 level (hereafter simply referred to as “significant”). Specifically, it can be interpreted that providing feedback of the winning bid to the subjects raised the bid by JPY 301 ceteris paribus. As the slope dummy for the winning bid, the coefficient of the variable of the difference between the winning bid and the placed bid is a negative value (−1.0) and is significant at the 0.01 level. The slope dummy has a negative sign because of the adjustment to “lower the bid since it has become too high”, as noted in the previous section. During the earlier rounds, when competitiveness was aroused, it would probably have taken on a positive value.
These findings provide statistical confirmation that the information regarding the winning bid affected the bid. The objective of having the bidders repeat the rounds is to make them realize that “the best strategy is to place an honest bid.” Therefore, it is better to not provide feedback on the winning bid, which internally affects the bid, to the auction participants.
Meanwhile, the “price of rice usually purchased”, which was expected to affect the bid, is not present in model II. One possible reason for this is that, even though it was explained to the subjects that the inundated rice was the same brand as the one usually purchased, they perceived it as a separate good. This would imply that a careful explanation to convince the subjects that the “inundated rice is a good which is an extension of the rice usually purchased” may result in actual demand.
Furthermore, the “assumed inundation area dummy”, which was a condition for sample extraction, is also absent in model II. Possible reasons for failing to display a significant difference are that the sample size was too small to produce a noticeable effect and perhaps that the inundation depth criteria of 0.5 m was inappropriate (too small).
Among the subjects’ individual, household, and residence attributes, the “self-employed or business owner dummy”, and “owned house dummy”, remain in model II, all coefficients of which are significantly positive. Since these variables indicate having spare financial resources (financial resources that can be disposed of relatively freely) or the asset size, it is understandable that they can raise the bid. Moreover, the absence of household annual income (its correlation coefficient to the bid was 0.41), which is generally related to willingness to pay, from model II may be because it was replaced by these dummy variables.
Regarding disaster awareness, the coefficient of “preparedness against floods” is significantly positive. This result, that consumers with a higher awareness of disaster mitigation give a higher assessment of inundated rice, is quite understandable. The reason why the “inundation experience dummy” or “hazard map check dummy” is absent from the model may be because they were replaced by this variable.
5.2. Assessment Factors of River Basin Flood Control
Finally, we quantitatively examine the attributes of residents who agree with the concept of river basin flood control being promoted by the national government.
Table 5 shows the estimation results of the ordered probit model, where the dependent variable is the extent to which one agrees with river basin flood control policies. Although the degree of agreement was categorized into five ranks in the given questionnaire, the frequencies of “undecided”, “moderately disagree”, and “disagree” were low, and so were combined to make up three ranks in total (see Table 1 for frequencies).
Table 5.
Ordered Probit models for agreement to river basin flood control.
The specification is:
where is a latent variable (i.e., unobserved) measuring the degree of agreement of the ith resident; is a (k × 1) vector of observed explanatory variables; β is a (k × 1) vector of unknown parameters; and is the random error term, which is assumed to be normally distributed with mean 0 and unit variance 1.
The observed and coded discrete agreement variable, , is determined from the model as follows:
where the threshold values μ1 (cut 1) and μ2 (cut 2) are unknown parameters to be estimated by the maximum likelihood method.
Similar to the multiple regression model for inundated rice, model I employs all of the subjects’ basic attributes as the explanatory variables, while model II employs those variables that were selected by trial and error. Although the Pseudo R-squared is somewhat lower, we apply model II since it has a smaller condition number and a lower AIC, and a lower Akaike information criterion.
We examine the estimation results in reference to model II. First, the “Tokyo (Katsushika) dummy” is significantly positive. This is because Nakagawa River, which runs through Katsushika Ward, has repeatedly flooded in the past (for instance, the 1947 Typhoon Kathleen) so the residents are well aware that flood control efforts based on conventional infrastructure building are not adequate.
Meanwhile, the “assumed inundation area dummy” coefficient is significant but negative, contrary to expectations. The low assessment in high-risk inundation areas may be because the residents facing risk in assumed inundation areas, other than Katsushika Ward, are doubtful of the effectiveness of the river basin flood control measures. Or they may feel that there is no need for interested parties in the basin to engage in flood control jointly, because the Chiba side of Edogawa River has not experienced flooding for a long time.
Among the individual and household attributes, the “male dummy” and “household annual income” are significantly positive. Since households with higher incomes are likely to possess greater assets, this can be interpreted to mean that those with assets that need to be protected from floods tend to recognize the importance of flood control. The reason why “owned house dummy” is not significant is perhaps because it was replaced by the “household annual income”.
Among the attributes related to disaster experience or disaster mitigation awareness, the “farmer relative or acquaintance dummy” is significantly positive, while “preparedness against floods” is significantly negative. The reason for the former may be that, if one personally knows a farmer, it is easier for that person to imagine the large effect of “overflowing flood control”, in which the basin farmers cooperate. The latter displays a reverse effect (sign of coefficient) to that found in the quantitative analysis of inundated rice, which could be because the resident feels that one’s own preparedness against floods is sufficient. Although recognizing the need to protect oneself is important, there are a few scattered areas downstream of the Edogawa River with assumed inundation levels of 10–20 m. It may be necessary for the local governments to alarm such consumers who are overconfident of their preparedness.
6. Conclusions
Although “overflowing flood control”, in which agricultural land lying in river basins is intentionally flooded, is attracting attention as an approach for river basin flood control, there is no mechanism to compensate for the loss of cooperating farmers. In this study, therefore, we examined the marketability and economic value of the inundated agricultural product as a measure to compensate such farmers.
Specifically, we used a random nth-price auction, an experimental economic approach, to measure the amount people are willing to pay for inundated rice targeting 47 residents (consumers) living in the downstream areas of Edogawa River.
The results showed that many consumers were willing to pay an “average of JPY 1578 for 5 kg” of inundated rice, indicating clearly the possibility that it can be sold without having to discard it. However, only one-quarter assessed an added value (average JPY 384) as “rice that protected us from floods” while two-thirds expected an average discount of JPY 651. This suggests, as the marketing strategy for inundated rice, selling at a discounted price to the general public, while the national or local government compensates the difference, or alternatively, targeting only those consumers who are willing to pay a price equivalent to rice they usually purchase or more.
In the latter case, the market will be smaller, so careful marketing will be necessary. In order to obtain information useful for targeting potential buyers, we used a regression model in which the willingness to pay is the explained variable, and found that being economically well-off, house ownership, and being prepared for floods are factors that increase the assessment.
Since inundated rice is currently discarded, it was assumed in this study that its quality would remain constant. In addition, since there is no information on how much productivity of agricultural land is lost due to flooding, it was not possible to calculate the cost-effectiveness of watershed flood control in this study. Therefore, identifying such information and its application to the analysis will await further research.
Furthermore, to contribute to consensus building among residents, we estimated an ordered probit model in which the dependent variable is the “degree of agreement with river basin flood control policies”. Results indicated that being a resident of Katsushika Ward, which has been subjected to frequent floodings in the past, a male with high annual income, and having a farmer relative or acquaintance, were factors of agreement. Meanwhile, being a resident of an assumed inundation area and being prepared for floods were found to be negative factors. This shows that residents who face flood risks or have a high awareness of disaster mitigation are skeptical of the effectiveness of the policies.
In the process of the repeated round auction conducted in this study, it was observed that the subjects’ individual assessments (bids) gradually converged. This indicates that the random nth-price auction possesses the mechanism to facilitate the participants’ learning of incentive compatibility, and is thus valid for economically assessing agricultural products damaged by disasters. Furthermore, providing feedback of the winning bid resulted in a drastically increased bid, and the correlation was found to have statistical significance, so that it is better not to provide feedback of the winning bid in a random nth-price auction.
Author Contributions
Conceptualization, S.K. and A.M.; methodology, A.M.; software, Y.Y.; validation, S.K., Y.Y. and A.M.; formal analysis, Y.Y.; investigation, S.K.; resources, S.K.; data curation, Y.Y.; writing—original draft preparation, S.K.; writing—review and editing, A.M.; visualization, Y.Y.; supervision, A.M.; project administration, S.K.; funding acquisition, S.K. All authors have read and agreed to the published version of the manuscript.
Funding
This work was supported by JSPS KAKENHI Grant Number 23K23709.
Institutional Review Board Statement
The study was conducted in accordance with the Declaration of Helsinki, and approved by the Institutional Review Board of Graduate School of Horticulture, Chiba University (protocol code: 22-07).
Data Availability Statement
The datasets used (or analyzed) during the current study are available from the corresponding author on reasonable request.
Conflicts of Interest
The authors declare no conflicts of interest.
References
- National Astronomical Observatory of Japan. Chronological Scientific Tables 2005; Maruzen Publishing: Tokyo, Japan, 2004. (In Japanese) [Google Scholar]
- Kishi, Y. Watershed-Oriented for Survival; Chikuma Primer Shinsho: Tokyo, Japan, 2021. (In Japanese) [Google Scholar]
- Teramura, J.; Shimatani, Y. Advantages of the Open Levee (Kasumi-Tei), a Traditional Japanese River Technology on the Matsuura River, from an Ecosystem-Based Disaster Risk Reduction Perspective. Water 2021, 13, 480. [Google Scholar] [CrossRef]
- Osawa, T.; Taki, K.; Mitsuhashi, H. Ecosystem-Based Disaster Risk Reduction around River Confluences: A Case Study of Paddy Fields along the Nakagawa River. Jpn. J. Conserv. Ecol. 2022, 26, 2030. [Google Scholar]
- Yamada, Y.; Taki, K.; Yoshida, T.; Ichinose, T. An Economic Value for Ecosystem-Based Disaster Risk Reduction Using Paddy Fields in the Kasumitei Open Levee System. Paddy Water Environ. 2022, 20, 215–226. [Google Scholar] [CrossRef]
- Kishi, Y. Interview: Landslides Where There Are No Rivers, It Is the “Watershed” That Floods. Weekly Toyo Keizai, 21 August 2021; 82–83. (In Japanese) [Google Scholar]
- Gunji, Y. Matching Disaster-Damaged Agricultural Products to Create a New Form of 6th Industrialization: Preparation for Reducing Agricultural Product Losses. J. Agric. Soc. Jpn. 2021, 1679, 38–44. (In Japanese) [Google Scholar]
- Saptutyningsih, E.; Suryanto, S. Hedonic Price Approach of Flood Effect on Agricultural Land. Econ. J. Emerg. Mark. 2011, 3, 87–96. [Google Scholar]
- Chau, V.N.; Cassells, S.; Holland, J. Economic Impact upon Agricultural Production from Extreme Flood Events in Quang Nam, Central Vietnam. Nat. Hazards 2015, 75, 1747–1765. [Google Scholar] [CrossRef]
- Silva-Aguila, N.D.; López-Caloca, A.; Silván-Cárdenas, J.L. Damage Estimation on Agricultural Crops by a Flood. Remote Sens. Agric. Ecosyst. Hydrol. XIII 2011, 8174, 126–140. [Google Scholar]
- Chung, S.; Takeuchi, J.; Fujihara, M.; Oeurng, C. Flood Damage Assessment on Rice Crop in the Stung Sen River Basin of Cambodia. Paddy Water Environ. 2019, 17, 255–263. [Google Scholar] [CrossRef]
- Vickrey, W. Counterspeculation, Auctions, and Competitive Sealed Tenders. J. Financ. 1961, 16, 8–37. [Google Scholar] [CrossRef]
- Knetsch, J.L.; Tang, F.-F.; Thaler, R.H. The Endowment Effect and Repeated Market Trials: Is the Vickrey, Auction Demand Revealing? Exp. Econ. 2001, 4, 257–269. [Google Scholar] [CrossRef]
- Shogren, J.F.; Margolis, M.; Koo, C.; List, J.A. A Random nth-price Auction. J. Econ. Behav. Organ. 2001, 46, 409–421. [Google Scholar] [CrossRef]
- Kukowski, A.C.; Maddock, R.J.; Wulf, D.M.; Fausti, S.W.; Taylor, G.L. Evaluating Consumer Acceptability and Willingness to Pay for Various Beef Chuck Muscles. J. Anim. Sci. 2005, 83, 2605–2610. [Google Scholar] [CrossRef] [PubMed][Green Version]
- Borrello, M.; Cecchini, L.; Vecchio, R.; Caracciolo, F.; Cembalo, L.; Torquati, B. Agricultural Landscape Certification as A Market-Driven Tool to Reward the Provisioning of Cultural Ecosystem Services. Ecol. Econ. 2022, 193, 107286. [Google Scholar] [CrossRef]
- Corrigan, J.R.; Drichoutis, A.C.; Lusk, J.L.; Nayga, R.M., Jr.; Rousu, M.C. Repeated Rounds with Price Feedback in Experimental Auction Valuation: An Adversarial Collaboration. Am. J. Agric. Econ. 2012, 9, 97–115. [Google Scholar] [CrossRef]
- Mizuki, C. Flood Risk Communication from the Viewpoint of Disaster Prevention Awareness in an Urban Area of Tokyo, Kita Ward. J. Disaster Res. 2012, 7, 595–603. [Google Scholar] [CrossRef]
- Andreoni, J. Why Free Ride? Strategy and Learning in Public Goods Experiments. J. Public Econ. 1988, 37, 291–304. [Google Scholar] [CrossRef]
- Isaac, M.; Walker, J. On the suboptimality of voluntary public goods provision: Further experimental evidence. Res. Exp. Econ. 1991, 4, 211–221. [Google Scholar]
Disclaimer/Publisher’s Note: The statements, opinions and data contained in all publications are solely those of the individual author(s) and contributor(s) and not of MDPI and/or the editor(s). MDPI and/or the editor(s) disclaim responsibility for any injury to people or property resulting from any ideas, methods, instructions or products referred to in the content. |
© 2024 by the authors. Licensee MDPI, Basel, Switzerland. This article is an open access article distributed under the terms and conditions of the Creative Commons Attribution (CC BY) license (https://creativecommons.org/licenses/by/4.0/).