Article

Green Manuring with Oilseed Rape (Brassica napus L.) Mitigates Methane (CH4) and Nitrous Oxide (N2O) Emissions in a Rice-Ratooning System in Central China

1
Hubei Collaborative Innovation Centre for Grain Industry, College of Agriculture, Yangtze University, Jingzhou 434025, China
2
Xiangyang Academy of Agricultural Sciences, Xiangyang 441057, China
3
Horticulture Workstation of Yongping County, Dali 672600, China
4
College of Life Science and Technology, Hubei Engineering University, Xiaogan 432000, China
*
Author to whom correspondence should be addressed.
Agriculture 2024, 14(6), 839; https://doi.org/10.3390/agriculture14060839
Submission received: 16 April 2024 / Revised: 21 May 2024 / Accepted: 23 May 2024 / Published: 27 May 2024
(This article belongs to the Special Issue Soil-Improving Cropping Systems for Sustainable Crop Production)

Abstract

:
The use of oilseed rape (OS, Brassica napus L.) as a winter green manure is crucial for enhancing soil fertility and reducing chemical N application in paddy fields. However, the impacts of replacing varying amounts of chemical N with OS on CH4 and N2O emissions in paddy soils have not been well evaluated. In this study, GHG emissions, soil properties and OS decomposition in a rice-ratooning system with different OS-urea N replacement rates (0%, 25%, 50%, 75% and 100%) were investigated. Our results indicate that 84.7–90.7% of the initial C and 97.5–98.4% of the N were released during the 192-day decomposition process, and that the mineralization patterns of net C and net N in the OS residue were consistent with a single exponential decay model. The lowest CH4 emissions (9.97 g m−2) were observed at 0% OS, while the highest N2O emissions (0.40 g m−2) were observed at this level of substitution. Conversely, the highest CH4 emissions (20.71 g m−2) and lowest N2O emissions (0.07 g m−2) were observed at 100% OS. Compared to 0% substitution, 25% substitution significantly decreased GWP and GHGI without reducing rice grain yield. Environmental parameters such as soil redox, NH4+-N and residual N and C were shown to be significantly associated with CH4 emissions, whereas soil redox, NH4+-N and residual C were the main drivers of N2O emissions. In conclusion, 25% substitution of OS was the most cost-effective measure for balancing greenhouse gas emission and rice yield.

Graphical Abstract

1. Introduction

With less than 9% of the world’s arable land, China provides food for 20% of the world’s population [1]. Its rice cultivation spans 30 million hectares, representing 18% of the world’s total area [2]. However, rice fields are acknowledged as a substantial contributor to atmospheric greenhouse gas (GHG) emissions [3], specifically methane (CH4) and nitrous oxide (N2O). Annual global methane emissions from rice production account for 8%(30 Tg CH4) of total global anthropogenic methane emissions [4], while yearly N2O emissions from cropland soils treated with fertiliser account for 16% of the world’s total anthropogenic N2O emissions (1.6 Tg N2O-N) [5]. China’s high crop production levels have been achieved through the increased use of fertilizers, which has led to concerns about its sustainability. According to reports, China’s total nitrogen fertilizer consumption accounts for around 24.5% of global consumption, with rice cultivation alone consuming 3899 kt, equivalent to 15.5% of domestic N fertilizer usage [6]. However, irrational use of nitrogen fertilizers may actually trigger an increase in GHG emissions, like nitrous oxide (N2O) [7,8]. Consequently, it is very important to obtain stable, high yield and low carbon paddy field by optimizing fertilization management.
There are a variety of factors that affect CH4 and N2O production and emissions, such as rice varieties, soil characteristics and field management practices [9,10], especially fertilizer use [11,12,13]. For instance, using inorganic N fertilizer in rice fields led to a rise in CH4 emissions [14], resulting in greater C substrate availability for methanogenic bacteria and more rice biomass [15]. In addition, inorganic N fertilizer also promoted N transformation processes like nitrification and denitrification, which are responsible for N2O production [16]. By contrast, the application of inorganic fertilizers along with organic fertilizers has been shown to augment soil carbon, mitigate N2O emissions, and improve crop yields [17]. However, a study discovered that the decay of organic fertilizers resulted in elevated levels of soil organic acids and CH4 emissions [18]. As a result, the outcomes regarding the impact of organic fertilizer compared to chemical fertilizer on greenhouse gases are inconclusive. Hence, a comprehensive investigation of nutrient management procedures is imperative.
Generally, the substitution rate of organic fertilizer is likely to influence the competition between crops and microbes for nutrients, particularly N and carbon (C). The rhizobial microorganisms’ utilization of organic matter is stimulated as a result, and this ultimately determines soil C and N dynamics [19,20,21]. The breakdown of substrates, including green manure and rice straw, results in the production of acetate, a crucial component for the development of methanogenic bacteria, which helps methanogens to grow [22]. Plus, organic fertilizers improve N uptake during rice growth and increase residual N content in the soil compared to chemical fertilizers, thereby reducing N losses [23]. Notably, the elevated ratio of C to N found in green manure and straw results in slow N decomposition, which in turn has the potential to decrease the production of N2O [24]. Therefore, it is imperative to comprehend how substituting chemical N fertilizers with organic matter affects soil-climate ecosystems via the quantification of substitution rates for carbon and N balance and cycling. However, much of the focus of previous research has been on a single substitution ratio for organic chemical nitrogen, and whether or not other substitution ratios have different effects has largely been left unexplored in greater depth.
The rice-ratooning system has gained recognition as an advantageous substitute for middle- and double-season rice in central China in recent years, owing to its reduced demand for additional labor in transplanting the second rice crop [25]. Oilseed rape (OS, Brassica napus L.) is widely used as a green manure for rice fields in southern China and has the potential to partially replace chemical nitrogen fertilizer. Therefore, experimenting with different ratios, the optimal OS substitution ratio was determined to achieve the greatest abatement effect and potential. This study focused on (1) monitoring changes in CH4 and N2O emissions at different organic matter-urea substitution rates, and (2) after OS addition, key factors affecting GHG emissions were identified by analyzing soil physicochemical properties and monitoring carbon and nitrogen release from OS straw.

2. Materials and Methods
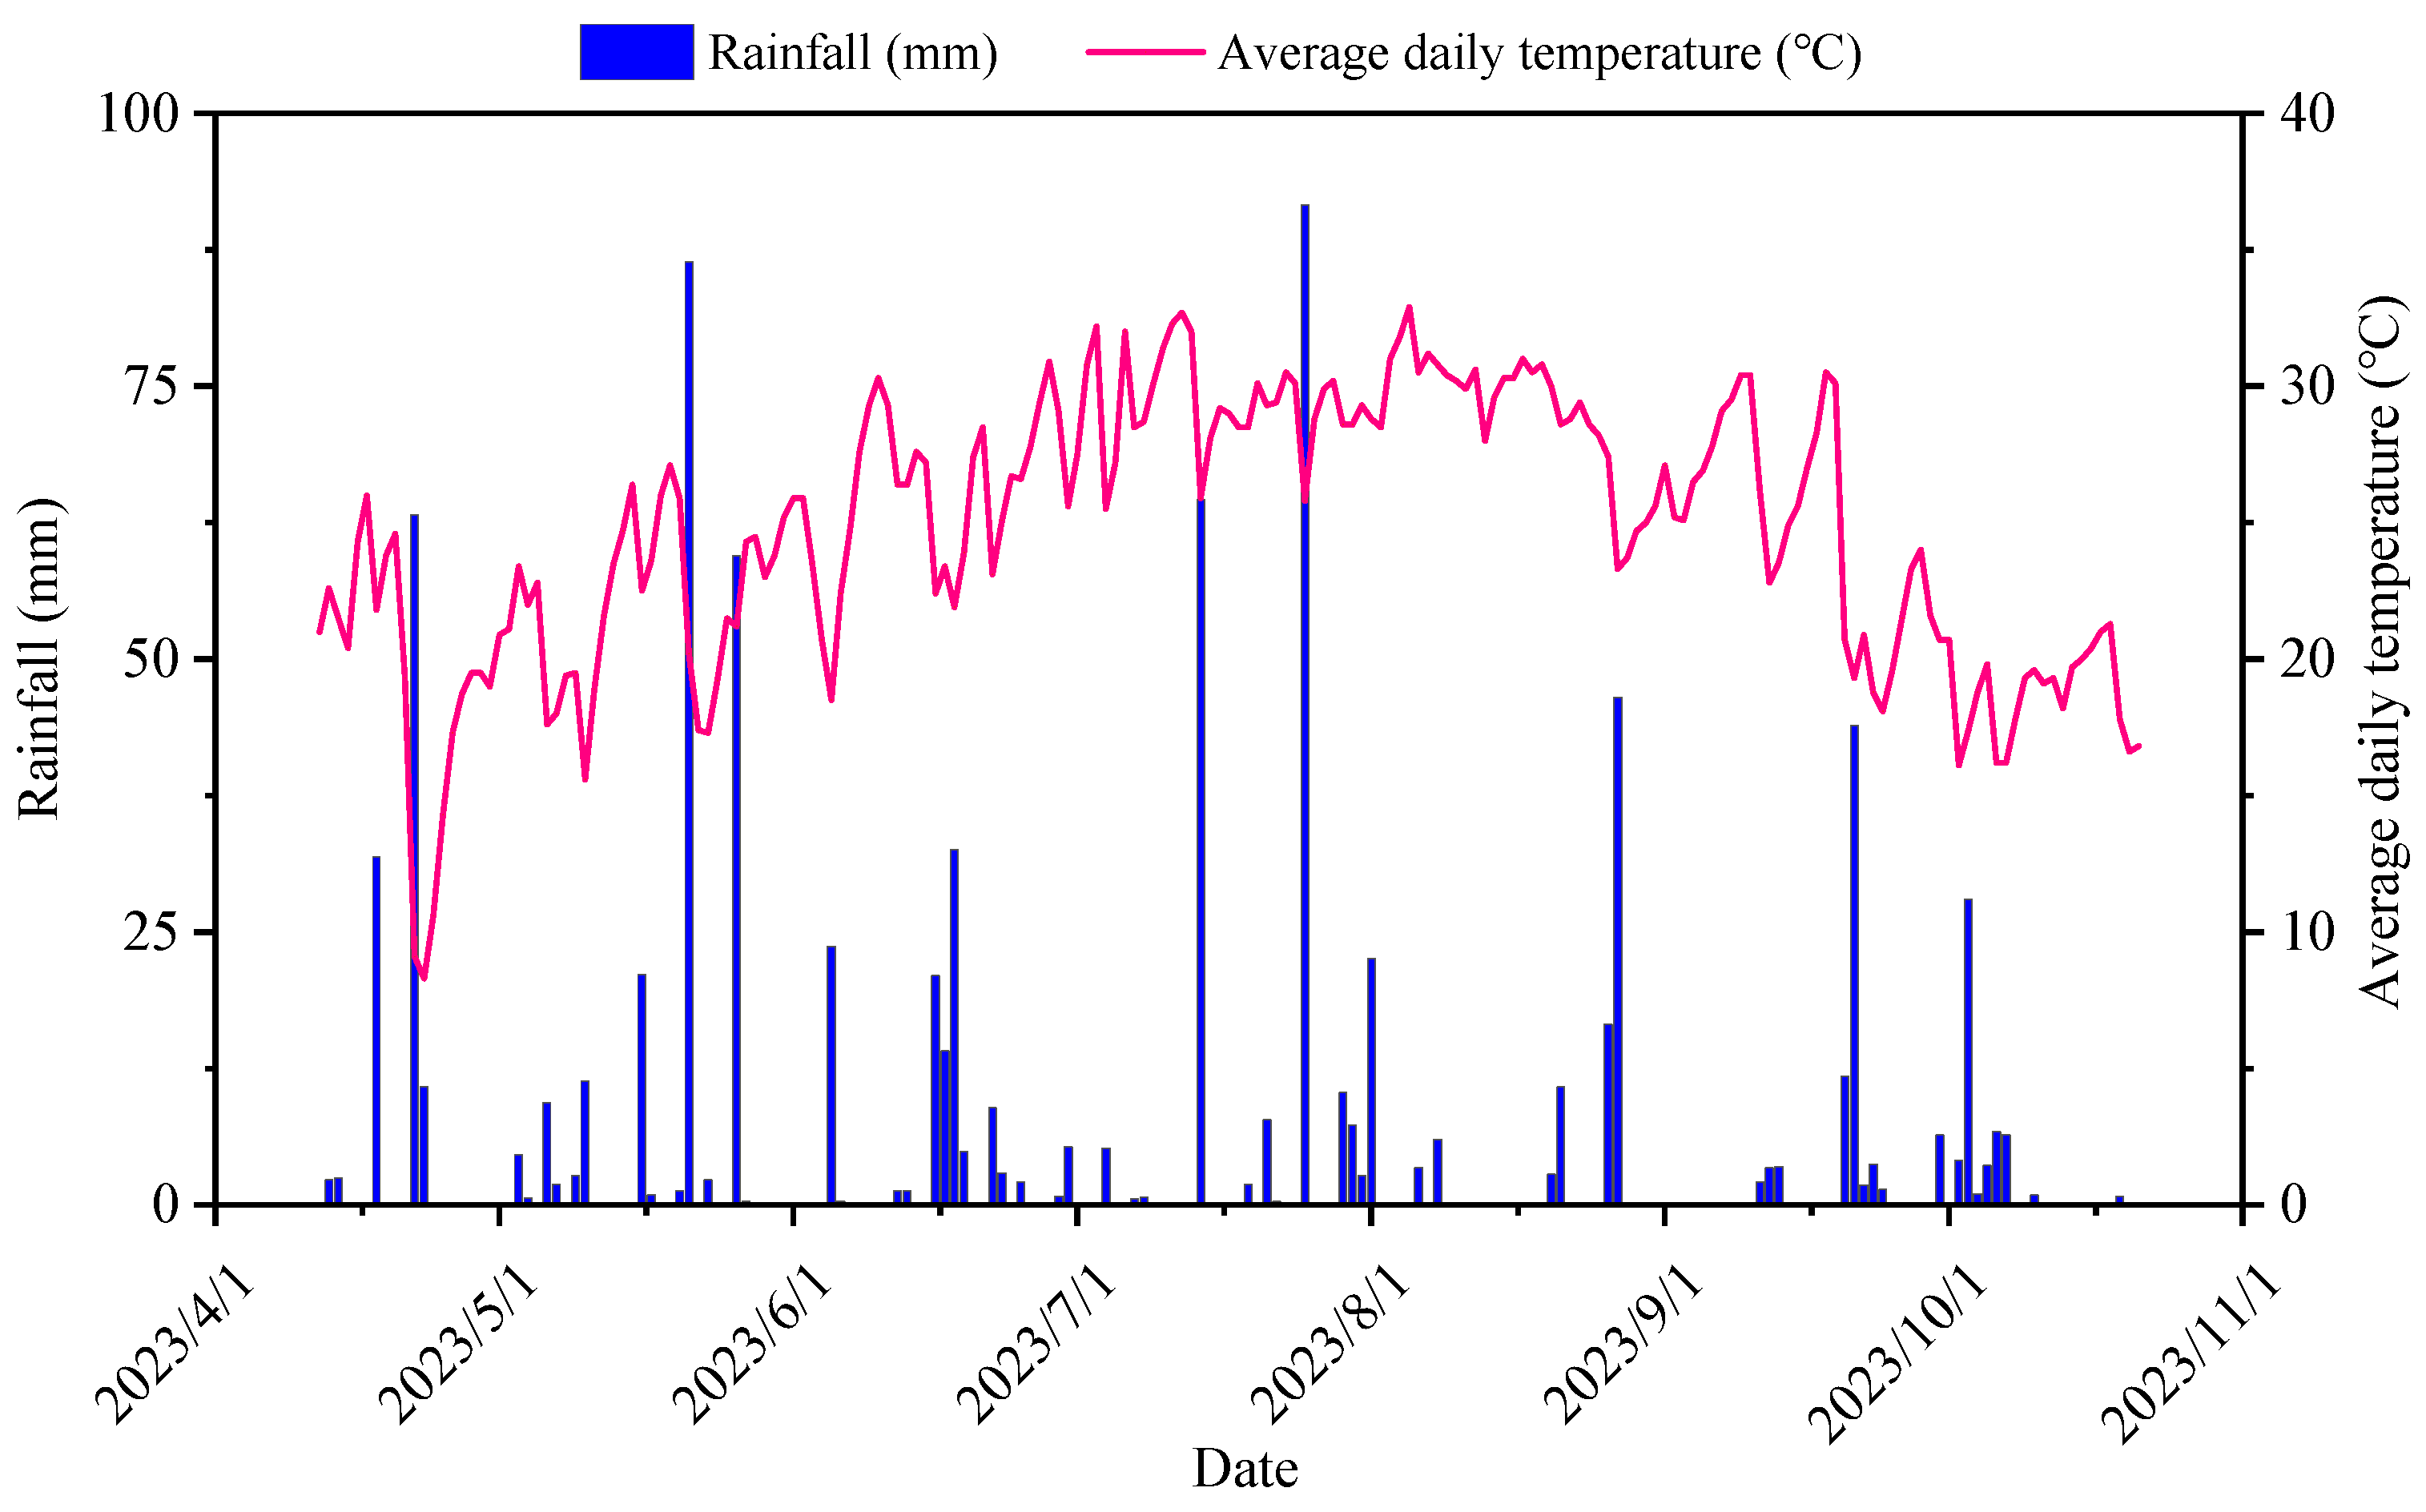
2.1. Study Area

Two simultaneous potting trials (Experiment 1 and 2) were conducted in 2023 in an open-air greenhouse (Open on all sides with a closed roof) at the Yangtze University Experimental Station in Jingzhou City, Hubei Province, China (30°20′ N, 112°12′ E, subtropical monsoon climate), the average temperature for the year was 16.5 °C and the rainfall was 1200 mm. The average daily temperature and rainfall during this experiment are shown in Figure 1. The soil utilized in the experiment was extracted from local paddy fields (0–15 cm) and allowed to naturally air-dry and sieve (2 cm). The soil has the following characteristics: sand 258 g kg−1, clay 113 g kg−1, silt 598 g kg−1, pH 6.3, available phosphorus 14.6 mg kg−1, available potassium 86.6 mg kg−1, total nitrogen 1.6 g kg−1 and organic carbon 13.2 g kg−1. The applied fresh aboveground OS (cv. Huayouza 50) had an 82.3% moisture content, 49.4 g N kg−1 and 445 g C kg−1 dry matter.

2.2. Experiment 1: CH4 and N2O Emissions with OS-Urea Substitution

Five OS-urea substitution ratios treatments: 0%, 25%, 50%, 75% and 100%, with three replications per treatment. The total N application rates in all the treatments were 100 mg N kg−1 air-dried soil. The specific amounts of OS and urea in each treatment are detailed in Table 1. Aboveground parts of OS (in full bloom) were weighed on 12 April, cut into 1–2 cm segments and carefully mixed with soil. Potassium chloride and calcium superphosphate were applied at a rate of 0.63 g and 1.83 g, respectively, per pot of air-dried soil. During the experiment period, chemical fertilizer and fresh OS were applied on 25 April and 12 April, respectively. Each plastic pot was filled with 3 kg of air-dried soil and manually transplanted on 27 April with 3 rice seedlings per pot (30 d old, variety Tianliangyou 616). The rice was watered with tap water throughout the growing season, submerged to 2 cm above the soil surface, and no additional fertilizer was applied. The trial was conducted from 12 April until the end of the regrowth season harvest on 21 October, lasting for a total of 192 days.

2.3. Experiment 2: Release of C and N during OS Humification

In this experiment, the dynamics of C and N release during OS decomposition were monitored using the buried bag method and elemental analyzer [23]. The collected above-ground parts were put into nylon mesh bags (length and width) of 10 cm × 10 cm in size and 0.5 mm mesh size, and then buried in pots, and the fertilization method and management were the same as that in Experiment 1. There was a total of 39 nylon mesh bags for each treatment, and 3 bags were taken each time as 3 replications.

2.4. Sample Collection and Measurement

In Experiment 1, static box gas chromatography was used for the collection and analysis of CH4 and N2O emissions [26]. The static gas collection tank consists of a sealed PVP tube chamber (height 110 cm, outer diameter 25 cm) with a hose for the inlet and outlet of the gas, an electric fan on top of the inside of the chamber for mixing the internal air, a three-way valve fitted to the hose connection outside of the PVP tube, and a base made of PVP (height 10 cm, outer diameter 30 cm). Each time the gas is collected, the potted plant growing rice is first placed on the base, then the gas collection box is covered and water is injected into the base to a height of 5 cm to act as a seal; after the collection is completed, the box is taken out and set aside. Gas collection is typically performed between 9:00–11:00 a.m. at intervals of 4 to 12 days, with most cases occurring at 7-day intervals. Before each sample, the air within the chambers was thoroughly mixed with a syringe, and a sample of the headspace gas in each chamber was collected (0, 10, 20, 30 min after sealing). Using a syringe (100 mL) connected to a three-way valve, draw a gas sample from the gas collection tank into a 0.5 L vacuum bag. A gas chromatograph (Agilent 7890 B, Agilent Technologies Inc., Santa Clara, CA, USA) was used to set the flame ionization detector (FID) temperature at 200 °C to analyze the concentration of CH4 and the electron capture detector (ECD) temperature at 330 °C to determine the concentration of N2O [27]. Meanwhile, redox state (Eh), pH and soil temperature were measured using an ORP meter (Leici TR-901, INESA Scientific Instrument Co., Ltd., Shanghai, China), a pH meter (Leici PHS-25, INESA Scientific Instrument Co., Ltd., Shanghai, China) and a digital thermometer model 2455, respectively, measured on the same day as the gas collection. Rice grains in three pots per treatment were collected at the maturity of the first season (15 August) and at the maturity of the regeneration season (21 October) to calculate yields, and yields per pot were converted to yields per square meter per unit area. Rice grain moisture was maintained at about 14%.
In Experiment 2, three nylon mesh bags (3 replicates) for each treatment were retrieved after 14, 24, 29, 34, 42, 48, 55, 69, 83, 111, 139, 167 and 192 days to determine the C and N release dynamic in OS residues. On the day of sampling, the nylon mesh bags were removed to wash the soil with tap water, retaining only the OS residue, and placed in an oven at 80 °C for 72 h. Dried samples were weighed, ground, and sieved (100 μm). Thereafter, 5 mg of the sample was weighed and wrapped in aluminum foil cups for the determination of C and N content by elemental analysis (Costech ECS4010, Coster Tecnologie Speciali S.p.A. Calceranica al Lago (TN), Italy). The soil was collected as samples from three randomly selected points in the pot and mixed well with each other. Samples were taken with a small-diameter potting soil auger made of stainless steel (19 mm in diameter and 300 mm in length) to a depth of the soil surface to the bottom of the pot. After extraction of nitrate (NO3-N) and ammonium (NH4+-N) from the soil with 2 mol L−1 KCl, the concentrations were measured with a continuous flow analyzer (SEAL AA500, SEAL Analytical GmbH, Werkstrasse 5, D-22844, Norderstedt, Germany).

2.5. Data Calculation Formula

The emission fluxes of CH4 and N2O are calculated in the following way: (1).
F = p × h × d c / d t × 273 / ( 273 + T )
In the above equation, F represents CH4 flux (mg m−2 h−1) or N2O flux (μg m−2 h−1); p is CH4/N2O density at standard pressure and temperature (CH4 0.714 kg m−3, N2O 1.964 kg m−3); h is the height of the inside of the gas collection tank (cm); dc/dt is the rate of change in the CH4 or N2O concentration (mg m−3 h−1); T is the temperature (°C) inside the static collection box.
The formula for calculating seasonal C or N cumulative emissions is as follows Equation (2).
S e a s o n a l   C H 4   o r   N 2 O   c u m u l a t i v e   e m i s s i o n s = i = 1 n F i + F i 1 2 × ( D i + 1 D i ) × 24
where F is the CH4 (N2O) emission flux in milligrams mg m−2 h−1 (μg m−2 h−1), i is the consecutive sampling interval, Di+1Di is the number of days between two consecutive samples (d), n is the total number of sampling intervals and 24 is a conversion factor for a 24-h day.
The global warming potential (GWP) of CH4 and N2O was calculated in CO2 equivalent (CO2-eq) over a time horizon of 100 years as in Equation (3) [28].
G W P   ( g   C O 2 e q   m 2 ) = 29.8 × C H 4 ( g   m 2 )   +   273 × N 2 O ( g   m 2 )
The greenhouse gas intensity (GHGI) was quantified from Equation (4)
G H G I   ( g   G W P   p e r   g   o f   y i e l d ) = G W P ( g   C O 2 e q   m 2 ) / r i c e   y i e l d   ( g   m 2 )
The formula from Zhu et al. [23] was used to calculate the percentage of residual C and N in OS residues.
Y ( % ) = Y t Y i × 100
where Y is the amount of C or N remaining in the OS residue (in percent), Yt is the amount of C or N in the OS residue at different points in time, and Yi represents the initial amount of C or N when the OS was not applied to the soil.
To further explore the release of C and N from OS residues, changes in C and N over time scales were described by exponential decay models.
Y E = e x p k t × 100
YE is the C or N remaining after the decomposition of the operating system at time t, and k denotes the release rate of C (kC) or N (kN).

2.6. Statistical Analysis

Least significant difference analyses, correlation analyses, and analyses of variance (ANOVA) were conducted using IBM SPSS Statistics 26 (New York, NY, USA) on the effects of OS substitution rates on CH4 and N2O emissions, GWP, yields, GHG indices, and soil properties, and SigmaPlot 12.0 (Systat Software Inc., San Jose, CA, USA) was used to fit an exponential recession model to fit exponential recession models. The differences between the treatments were found to be statistically significant at the p < 0.05 level. In order to ascertain the relationship between various soil properties and CH4 and N2O emissions, a structural equation model (SEM) was constructed using Stata/SE 15.1 (Stata Corp LLC Inc., College Station, TX, USA).

3. Results

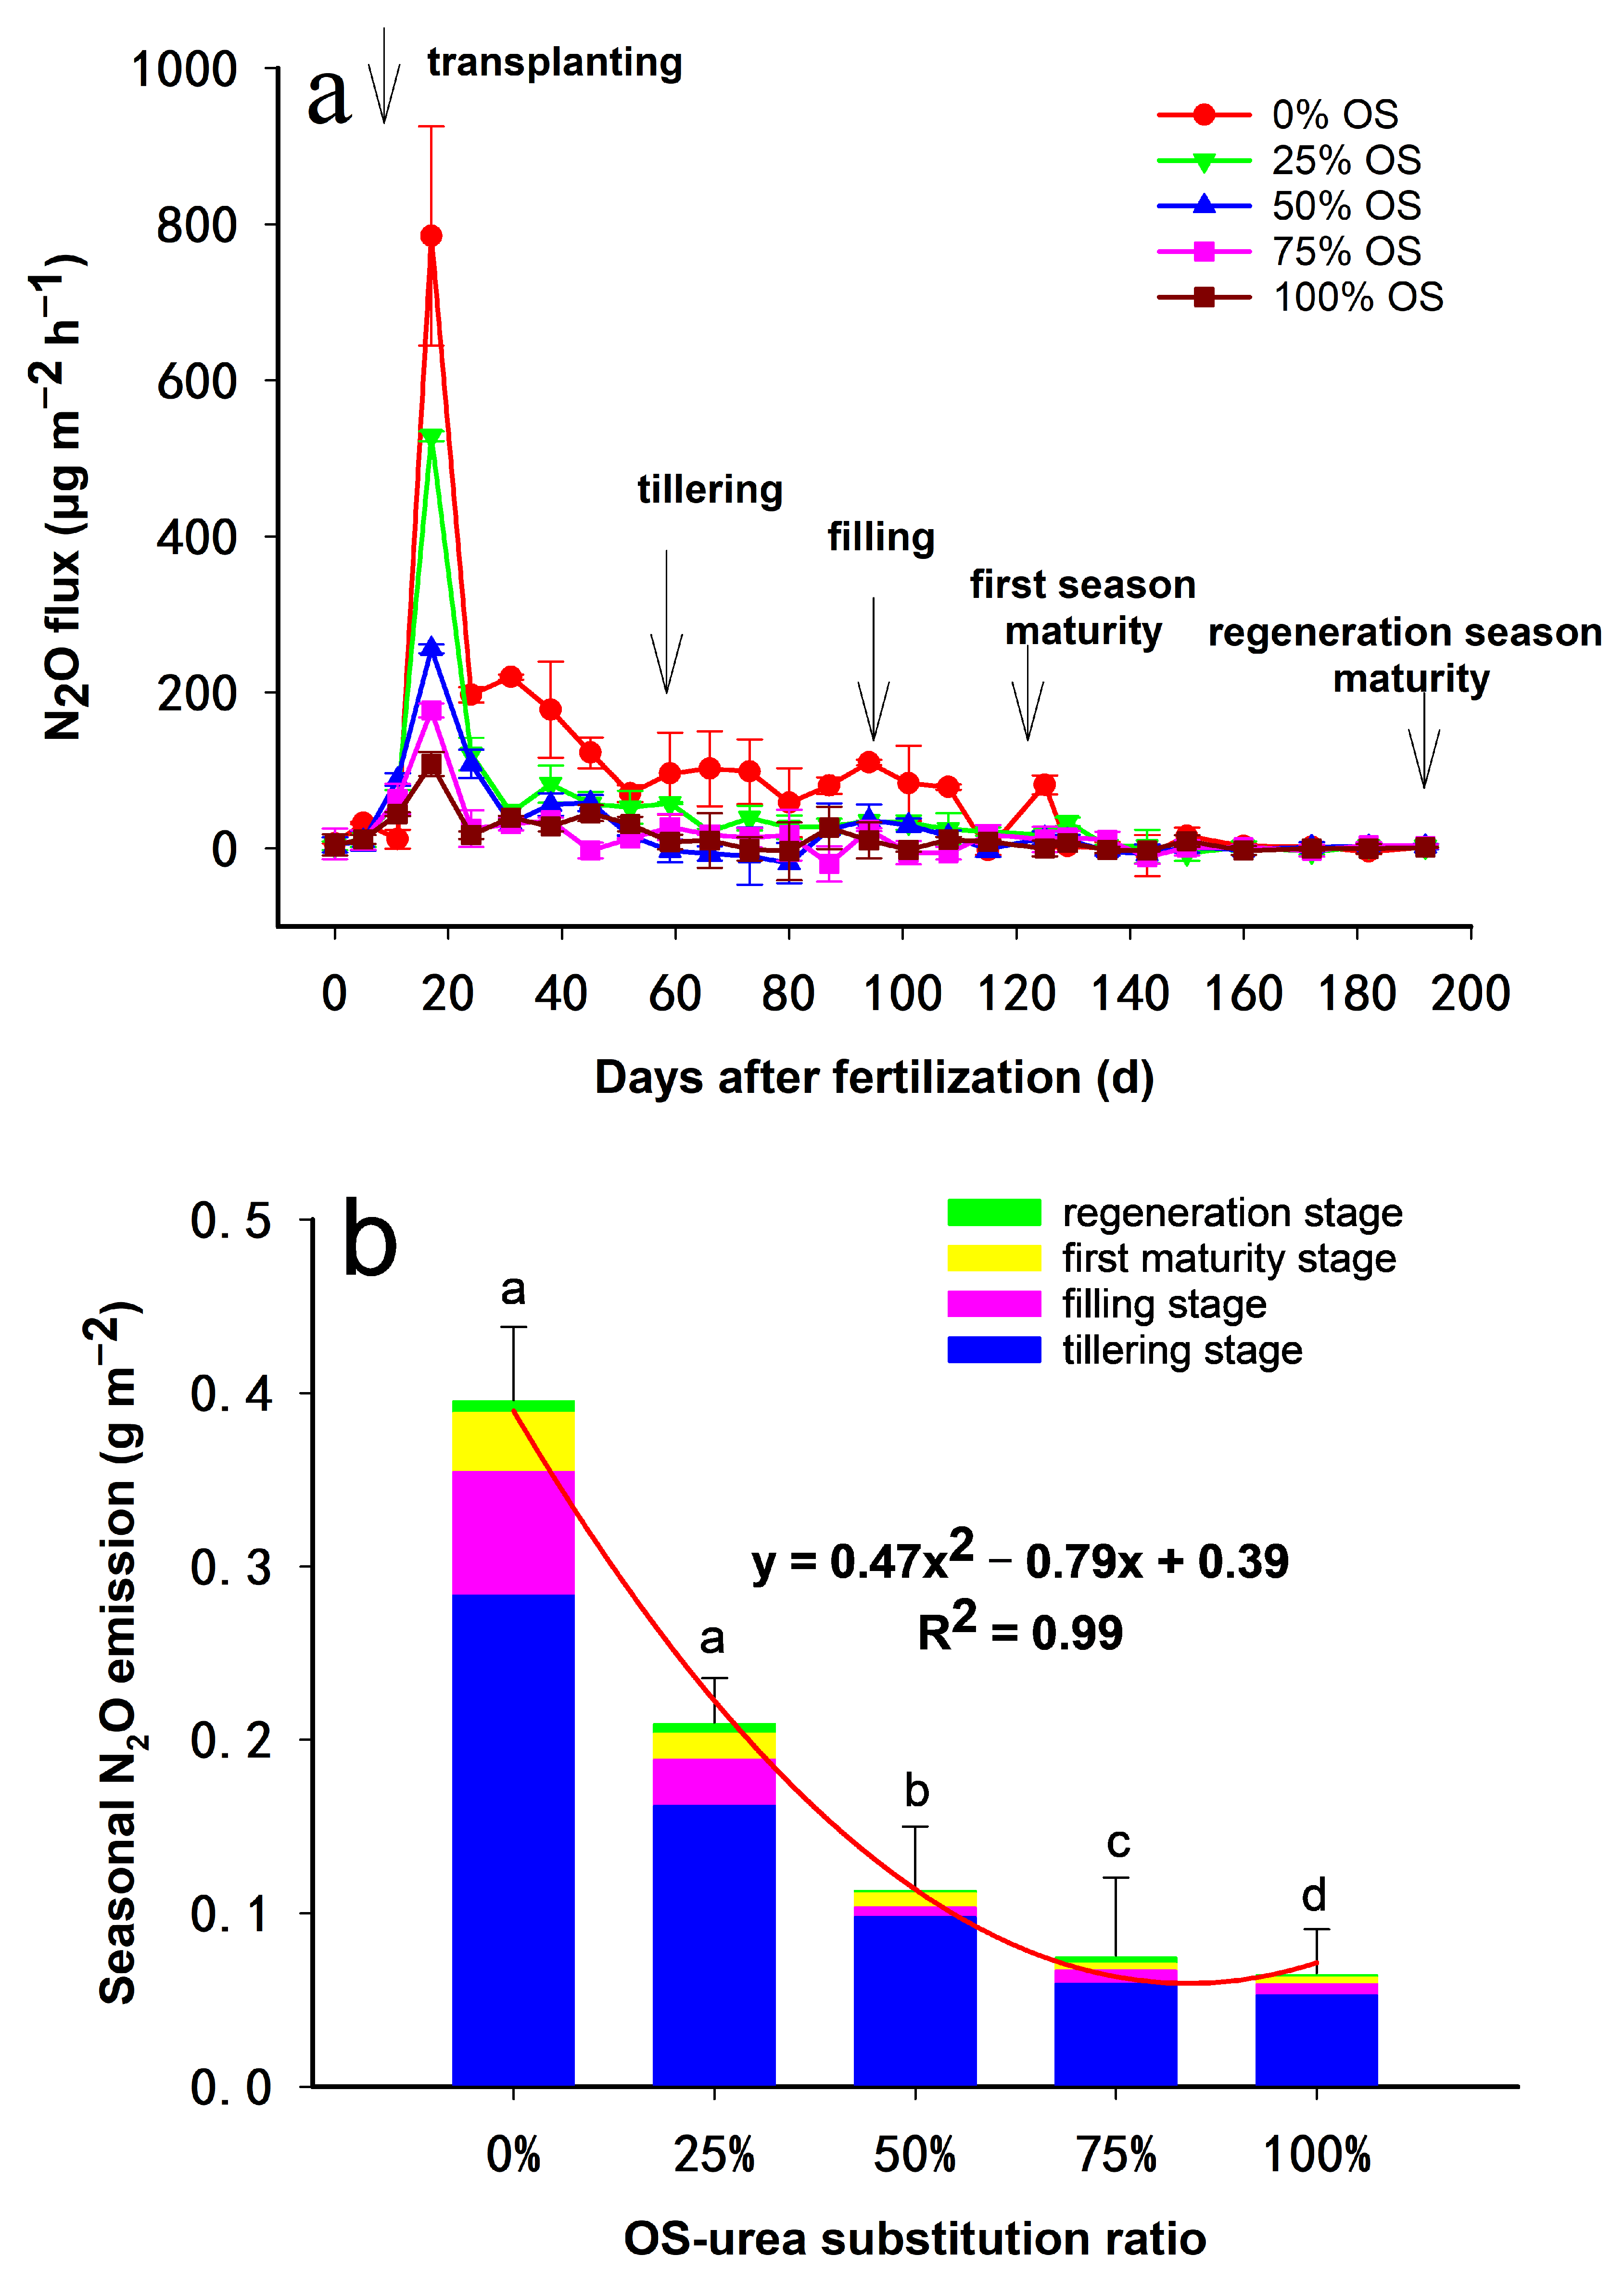
3.1. Fluxes of CH4 and N2O

The CH4 and N2O fluxes with different OS-urea substitution ratios showed the largest peaks at 31 and 17 days after OS incorporation, respectively (Figure 2a and Figure 3a). A minor peak was also detected in the regeneration season. The highest monitored CH4 emissions (45.9 mg m−2 h−1) occurred in 100% of the OS treatments and increased with increasing OS urea replacement rates (Figure 2a). By contrast, the 0% OS (784.9 μg m−2 h−1) and 100% OS (108.2 μg m−2 h−1) had the largest and the smallest N2O peaks, respectively. And the increasing OS-urea, the substitution ratio was reduced by the N2O peaks (Figure 3a).
Seasonal emissions of CH4 and N2O throughout the experiment were categorized into five stages according to the growth stage of rice: before transplanting (0–17 d), tillering stage (18–63 d), filling stage (64–98 d), first season maturity stage (99–125 d) and regeneration season maturity stage (125–192 d). The CH4 emission before the tillering stage and before the first season maturity stage accounted for 59.6–73.5% and 74.2–82.7%, respectively. There is a quadratic and significant relationship between OS urea substitution rate and CH4 emissions with the equation y = 12.66x2 − 2.06x + 10.08 (R2 = 0.99, p < 0.01; Figure 2b). The N2O emissions from the experiment start to the tillering stage accounted for 70.9–86.7% of the total N2O emissions, and the N2O emissions from the experiment start to the first mature stage accounted for 95.5–98.7% of total N2O emissions. The regression analysis shows a significant quadratic correlation between the rate of substitution of OS-urea and the total emissions of N2O (R2 = 0.99, p < 0.01; Figure 3b). Overall, CH4 emissions increased progressively as oilseed rape substitution increased, while N2O emissions decreased progressively as oilseed rape substitution increased.

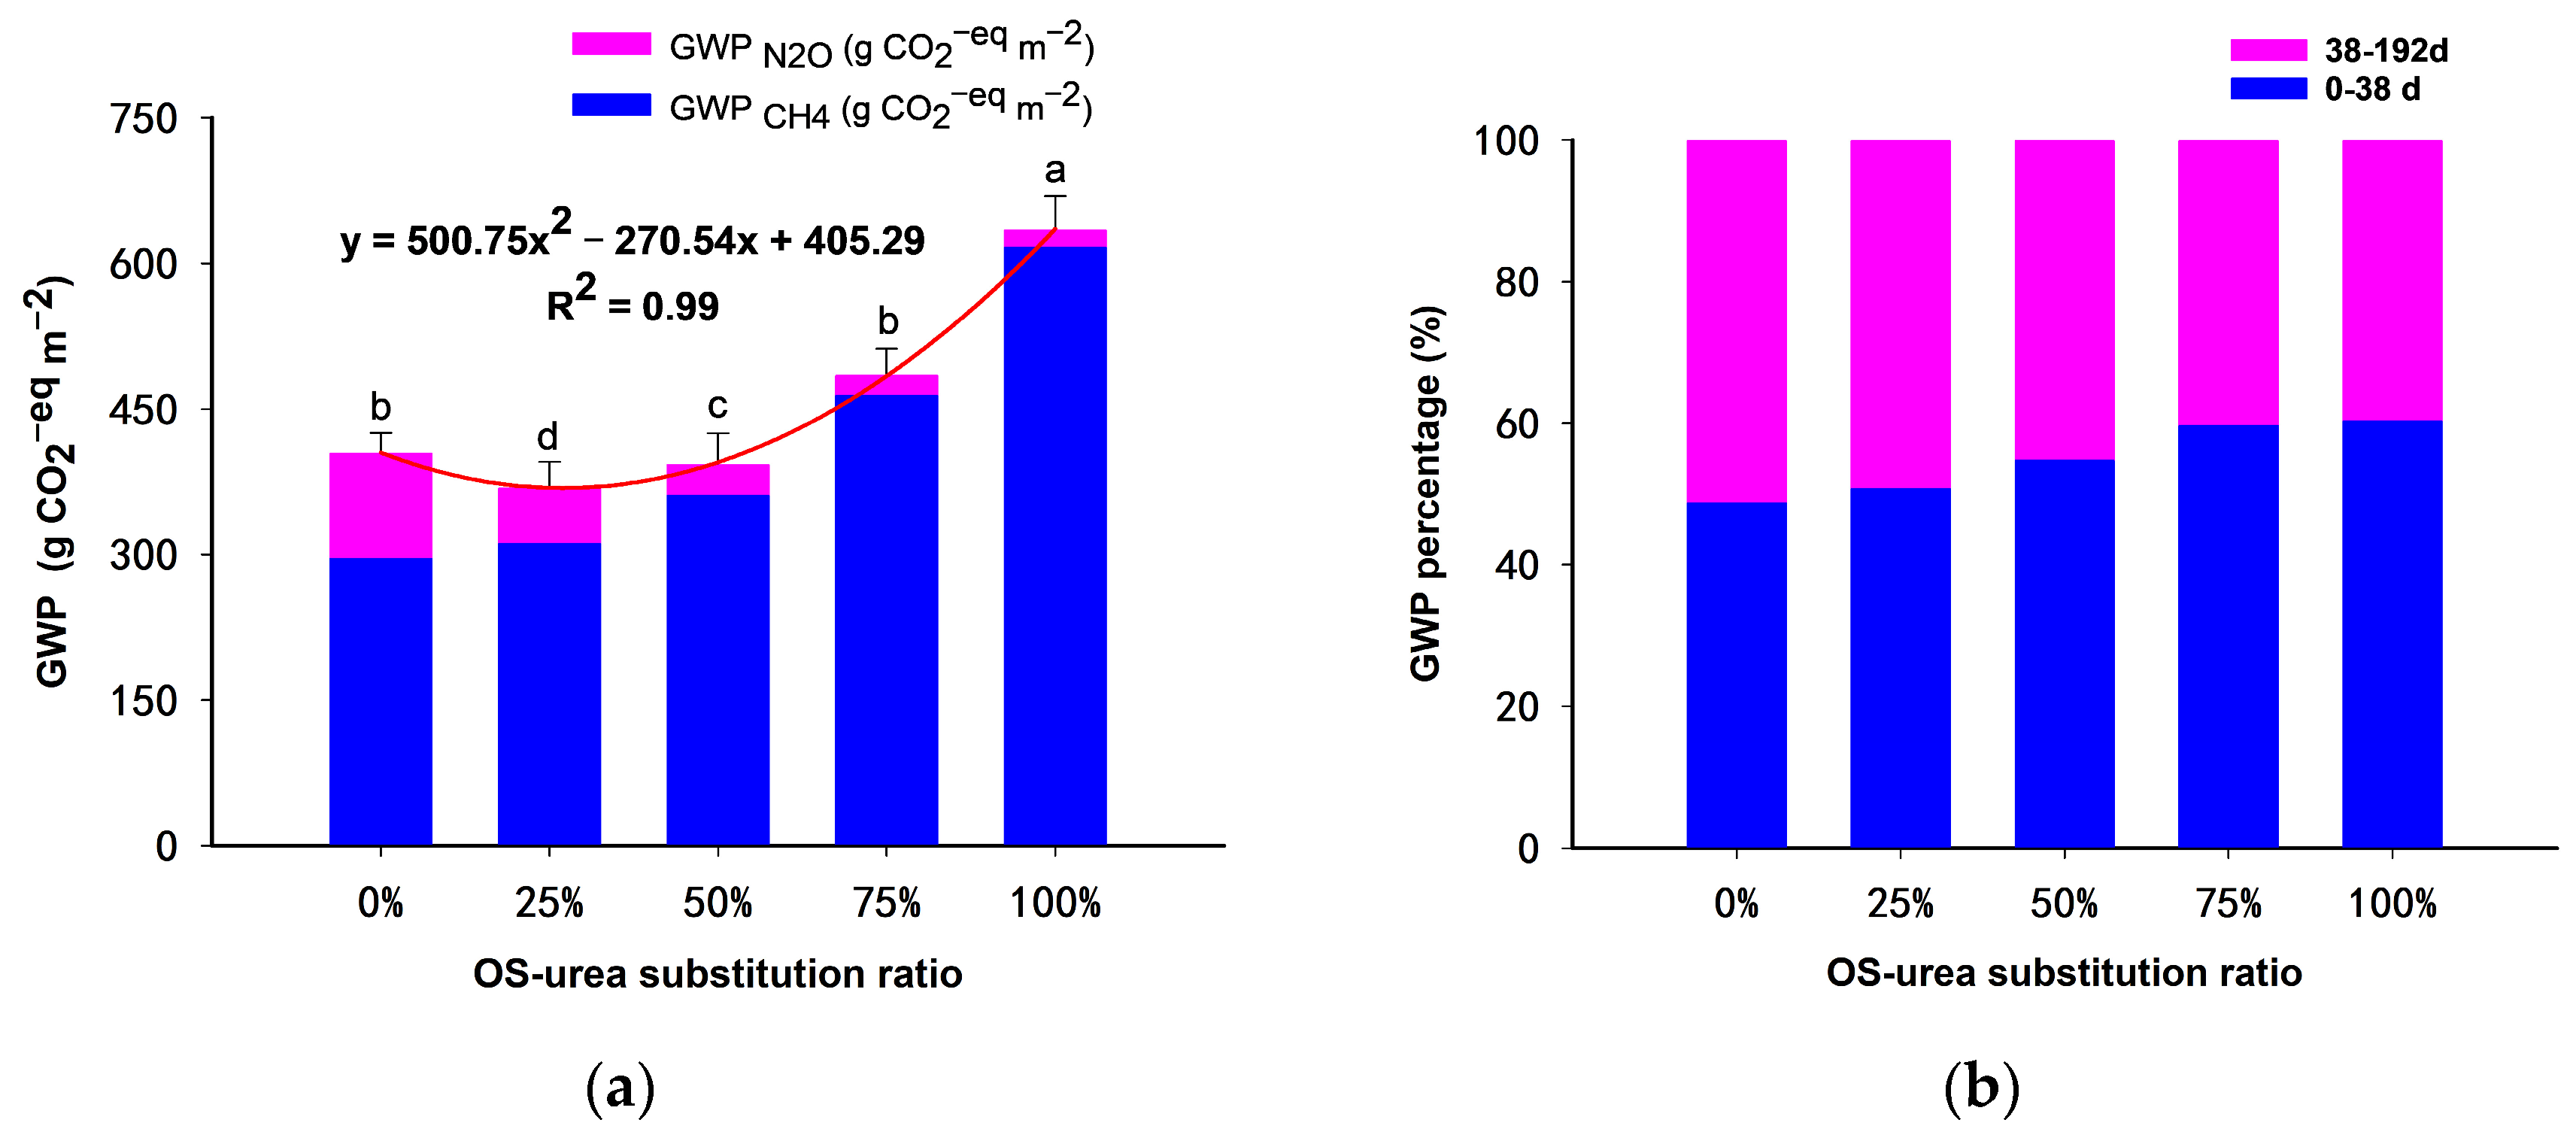
3.2. Yield, GWP and GHGI

As shown in Table 2, the GWP due to CH4 were significantly higher than those due to 0% OS in all treatments with OS addition, but the GWP due to N2O were highest in the 0% OS treatment and significantly higher than those in the 50% OS, 75% OS and 100% OS treatments (p < 0.05). The results of the GWP totals showed that total GWP was significantly lower (p < 0.05) for the 25% OS and 50% OS treatments than for the 0% OS treatment, but 75% OS and 100% OS had significantly more. The results of the study showed that rice grain yield ranged from 444.3 g m−2 to 796.3 g m−2 under different OS-urea substitution rate treatments (Table 2). There was no significant variation in yield with 25% OS compared to 0% OS. By contrast, rice yield under 50% OS, 75%OS, 100% OS treatments was significantly lower than 0% OS treatment. GHGI was significantly increased by 17.3%, 76.9% and 175.0% for 50% OS, 75% OS and 100% OS treatments, respectively, compared to 0% OS treatment (p < 0.05), but significantly decreased by 5.77% for 25% OS treatment (p < 0.05).
Figure 4a shows a substantial quadratic relationship between the OS-urea substitution ratio and the net GWP of seasonal CH4 and N2O emissions (Figure 4a, R2 = 0.99, p < 0.01). GWPs were lowest for 25% OS (9.4% below 0% OS) and highest for 100% OS (55.6% above 0% OS). In addition, 73.3–97.2% of the total GWP was derived from CH4 emission (Table 2). As illustrated in Figure 4b, the contribution of CH4 and N2O emission to the GWP reached 48.9–60.4% in the first 38 d while 39.6–51.1% was emitted from 38 d to 192 d. Similar to GWP, GHGI was lowest in 25% OS treatment (3.9% lower than 0% OS). Overall, 25% substitution significantly decreased GWP and GHGI without reducing rice grain yield, as compared to 0% substitution.

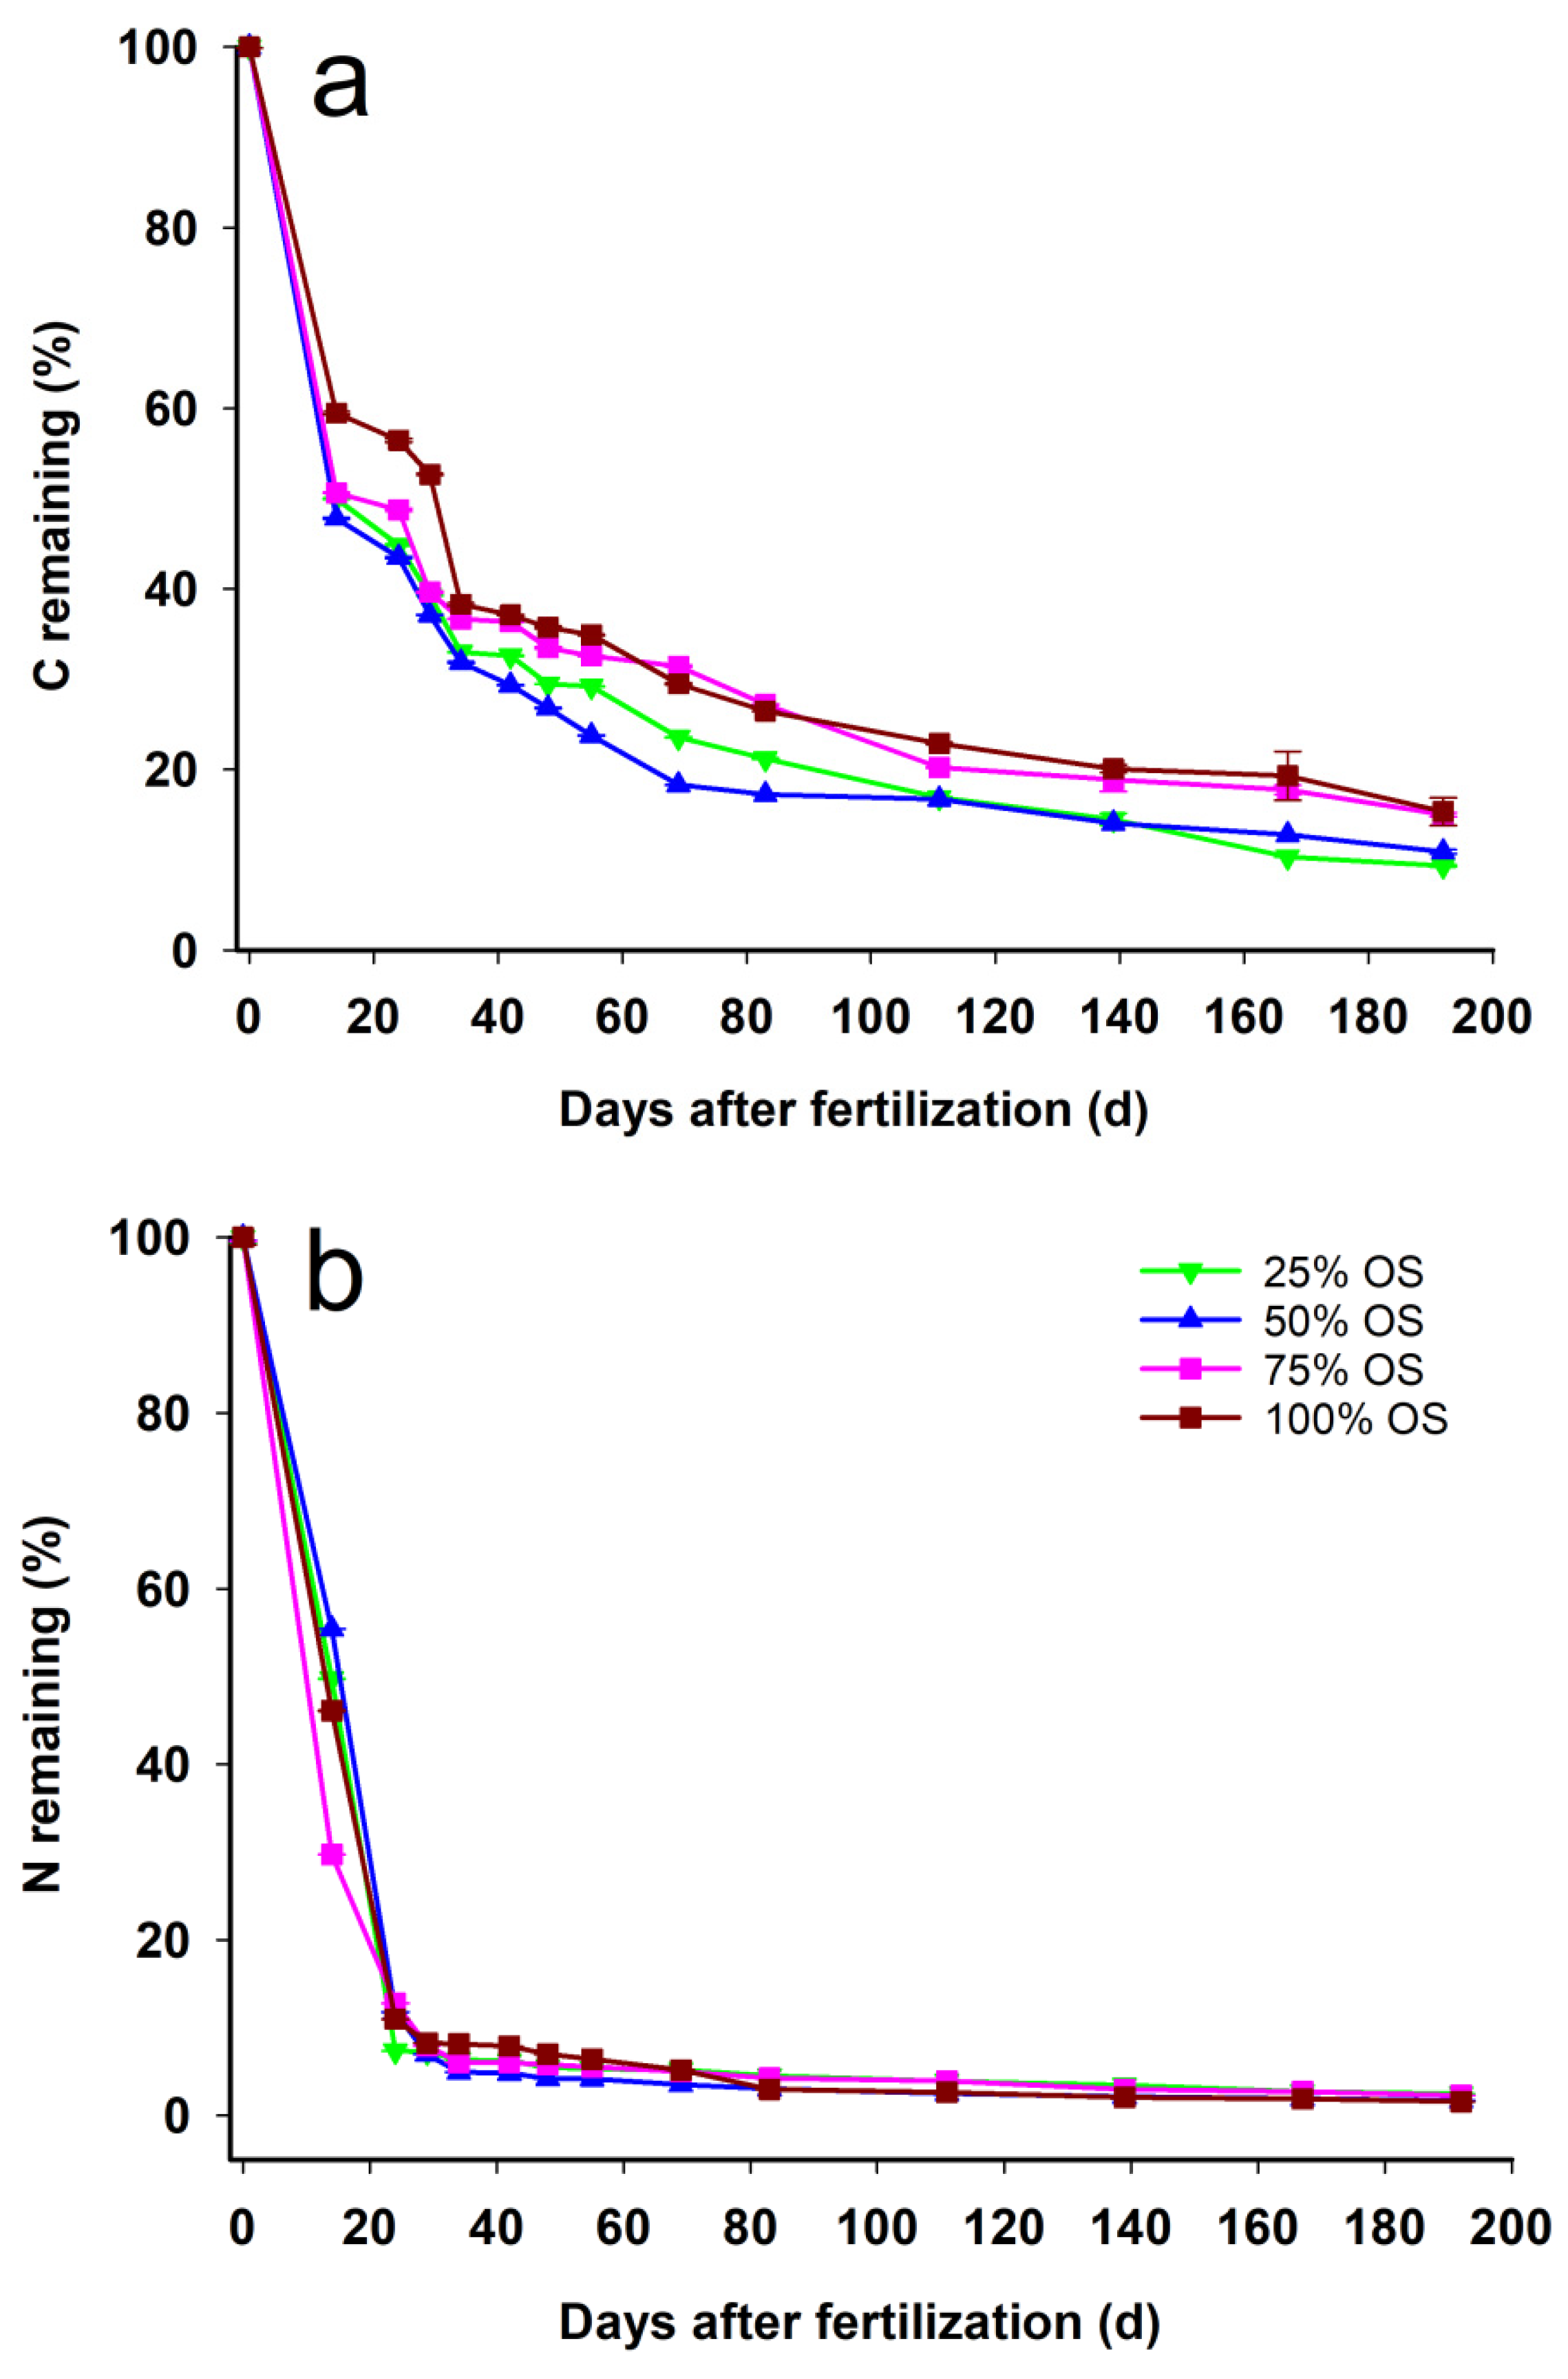
3.3. C and N Released during Decomposition of OS

Carbon release (68.6–81.7%) and nitrogen release (92.7–97%) from oilseed rape residues were mainly concentrated within 69 and 29 days after application to the soil, respectively (Figure 5a,b). After 192 days, C remaining in OS residue (9.3–15.3%) was much higher than N remaining in OS residue (1.6–2.5%). A single decay index model effectively described the release dynamics of C (r2 = 0.68–0.84, p < 0.05) versus N (r2 = 0.96–0.99, p < 0.05) following the addition of OS to rice soil (Table 3).
The values for kC (0.0202–0.0303) were much lower than for kN (0.0667–0.0832), illustrating C release from OS residue was slower than N release. The highest C release rate was found in the 50% OS treatment and had the lowest N release rate, while the 100% OS treatment had the lowest kC value (0.0202) and the 75% OS treatment had the highest kN value (0.0832) (Table 3). The OS residues released 84.7% to 90.7% C and 97.5% to 98.4% N over 192 days, with the mineralization of C and N being consistent with a single exponential decay model.

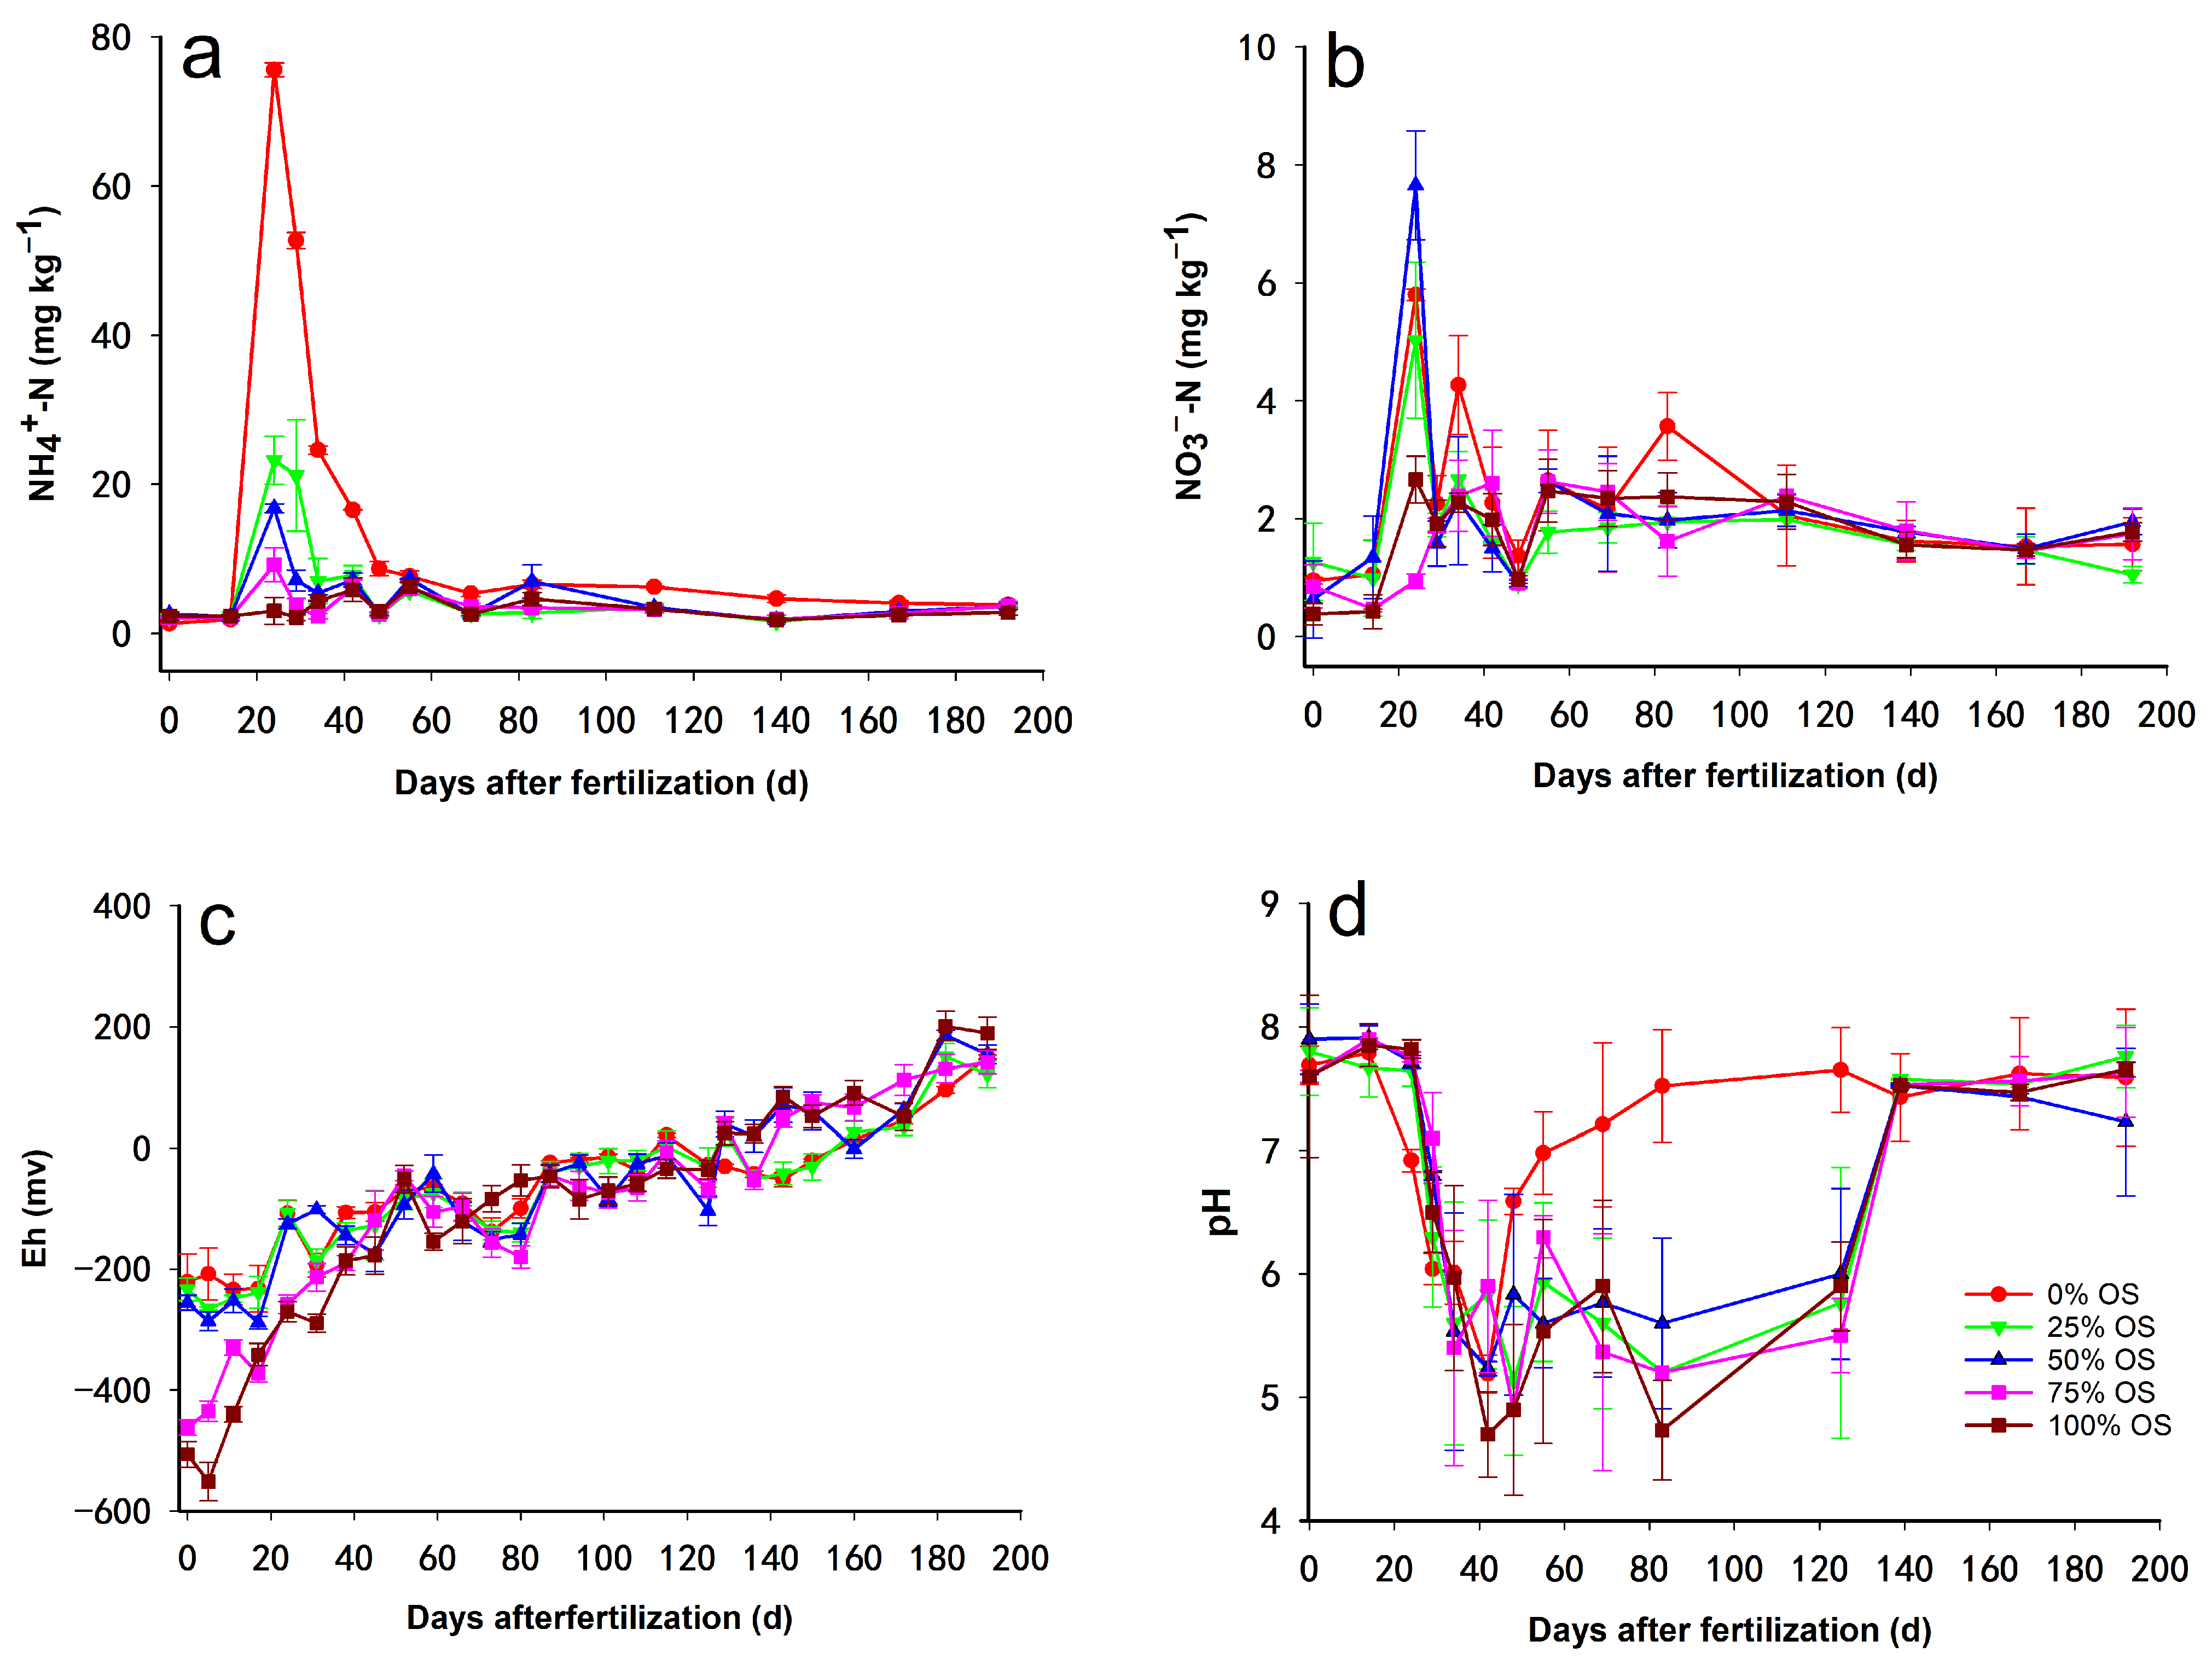
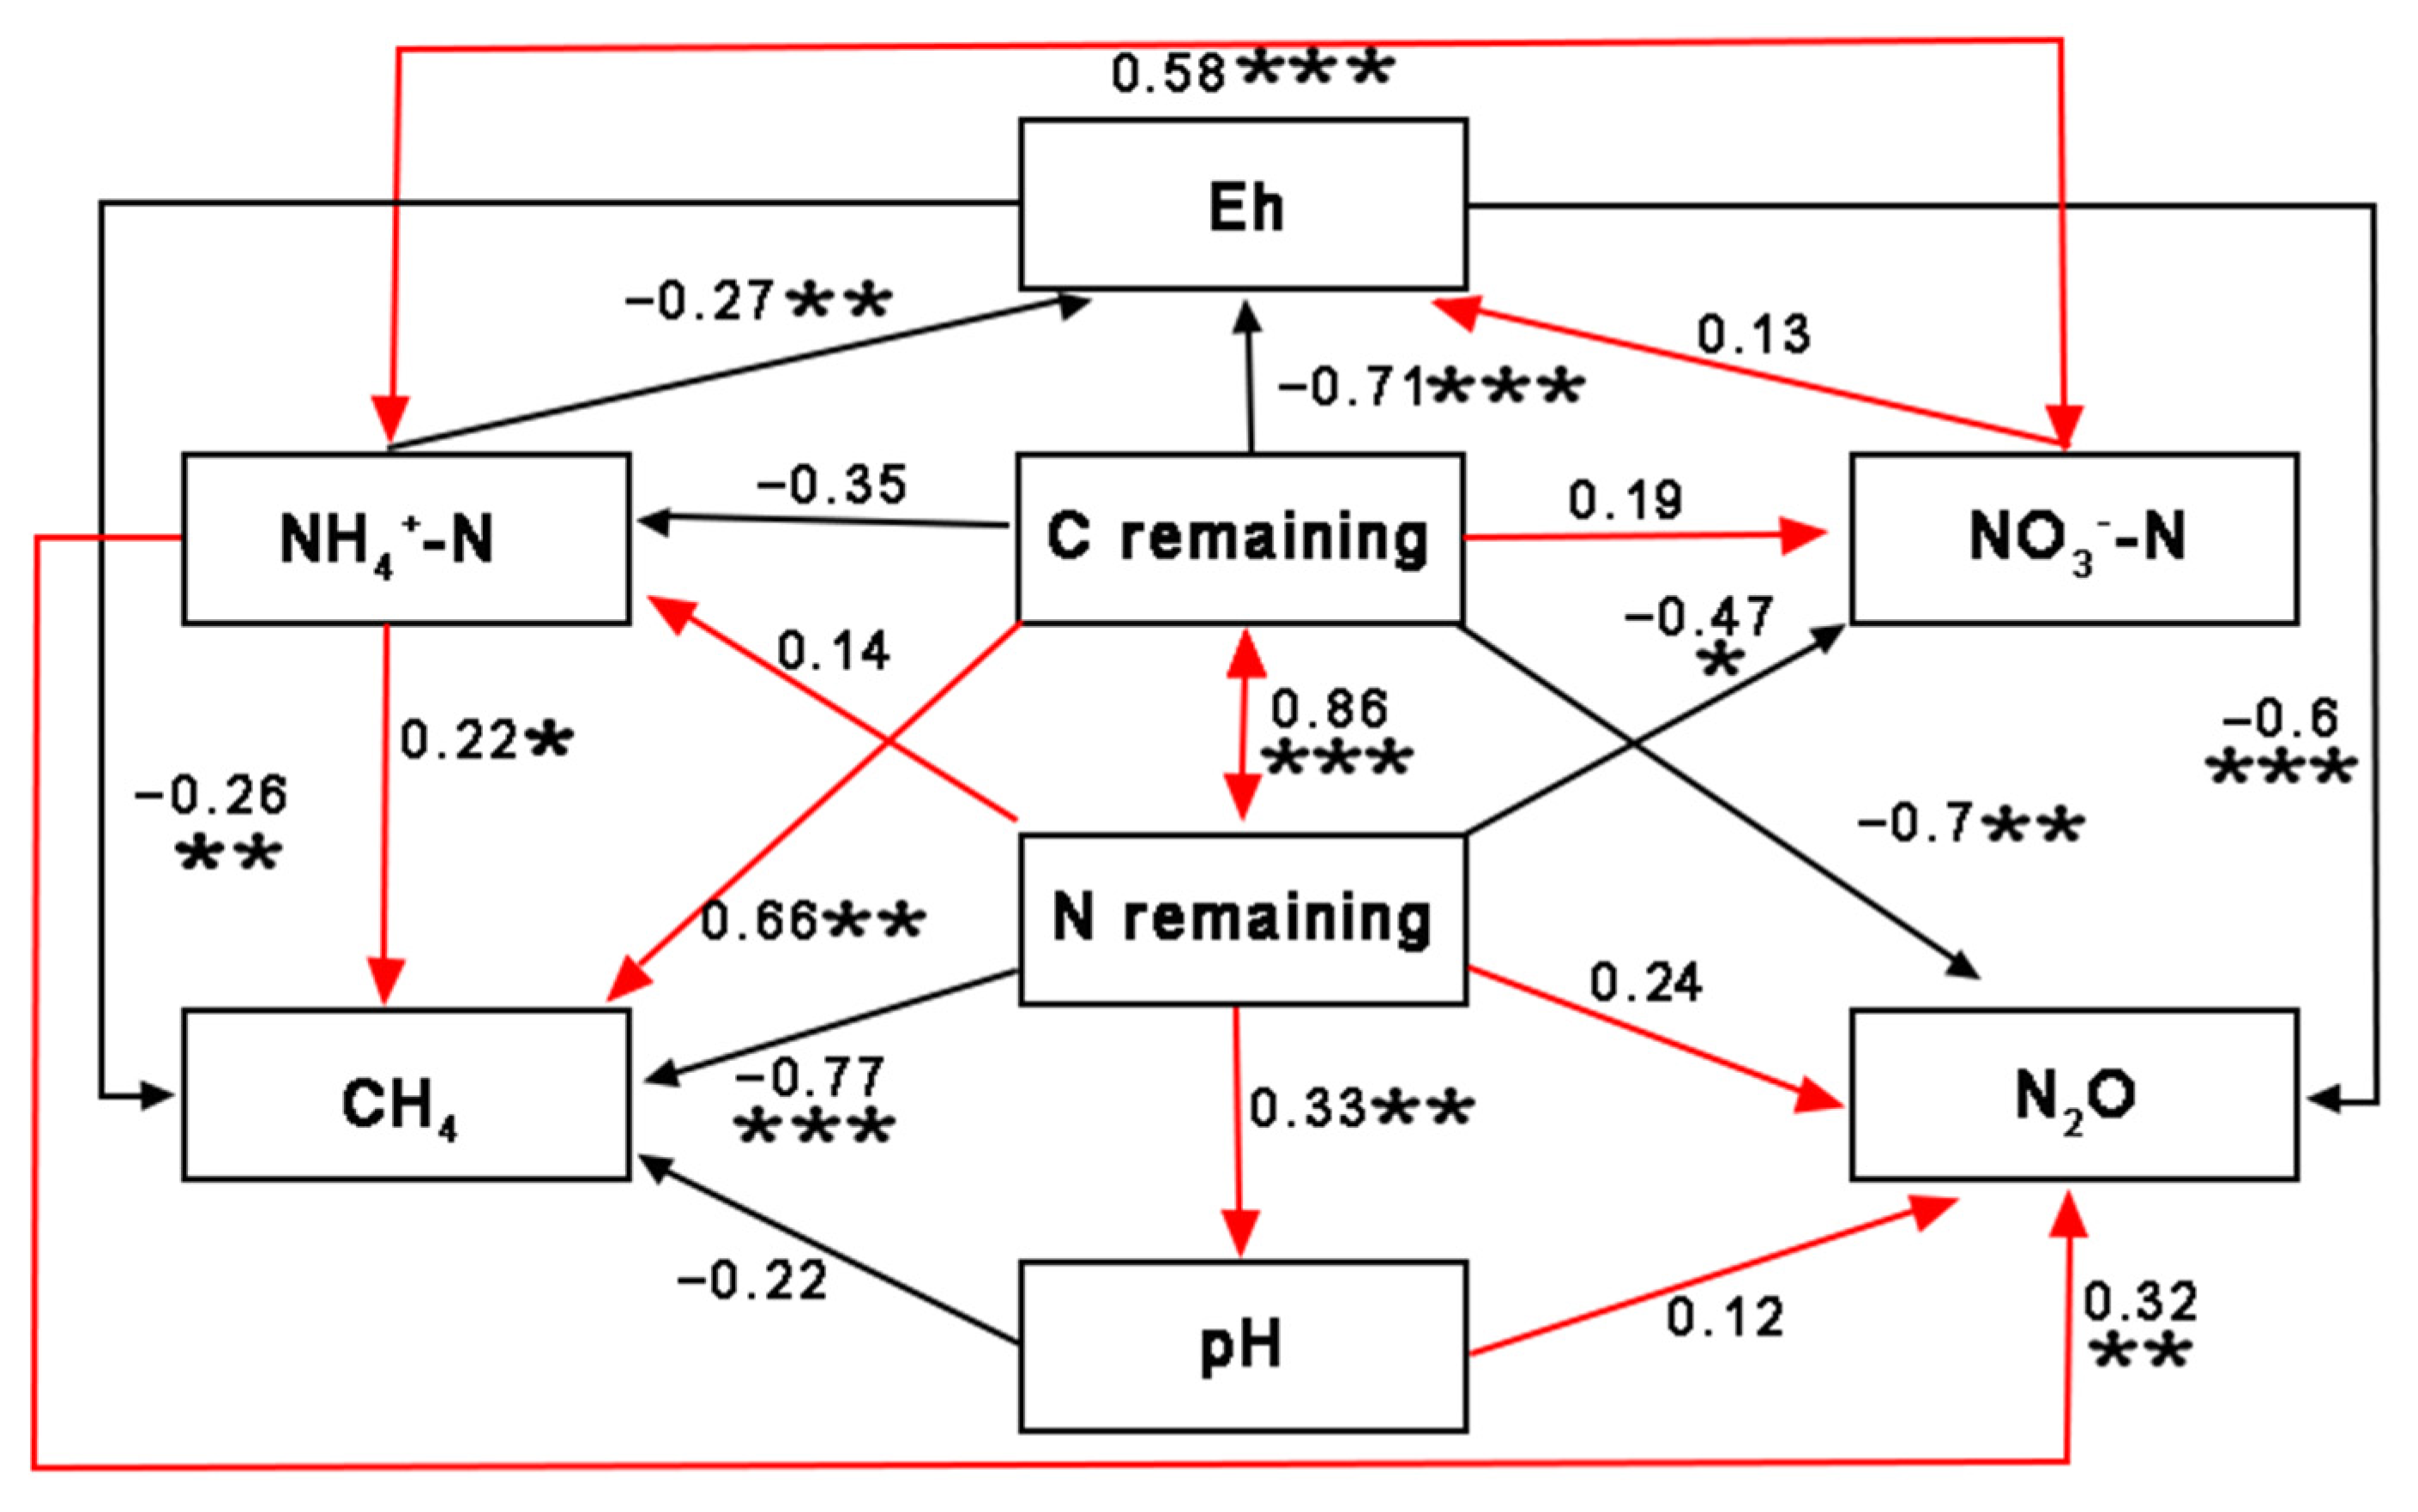
3.4. Effect of OS Decomposition on Soil Properties and the Relationship between the Concentrations of Different N and C Forms Produced

The concentrations of NO3N and NH4+-N in the soil were relatively high during the pre-experimental period, with NH4+-N concentrations being considerably higher than NO3N. (Figure 6a,b). NO3-N and NH4+-N peaked at 14–29 days after the addition of OS to paddy soil. The highest NH4+-N content was found in the 0% OS treatment, while the opposite was true for the 100% OS treatment. Redox state (Eh value) increased steadily throughout the experiment, with relatively low Eh values for higher OS substitution rates (Figure 6c). Soil pH showed acidic during 40–130 days and relatively low with OS incorporation (Figure 6d).
Soil properties affect CH4 and N2O emissions based on the structural equation model (SEM, Figure 7). NH4+-N (r = −0.27, p < 0.01) and C remaining (r = −0.71, p < 0.001) were significantly negatively affected by Eh. A significant positive correlation existed between residual N and pH (p < 0.01). Additionally, soil N remaining (r = −0.77, p < 0.001) and Eh (r = −0.26, p < 0.01) were significantly negatively linked with CH4 emission, whereas C remaining (r = 0.66, p < 0.01) and NH4+-N (r = 0.22, p < 0.05) were positively linked with CH4 emission. N2O emissions were significantly negatively correlated with C remaining (r = −0.7, p < 0.01) and Eh (r = −0.6, p < 0.001) and significantly positively correlated with NH4+-N (r = 0.32, p < 0.01). The results indicated that soil N remaining, C remaining, NH4+-N and Eh were factors influencing CH4 emission, whereas C remaining, NH4+-N and Eh were important factors controlling N2O emission.

4. Discussion

4.1. Influence of OS-Urea Substitution Ratio on CH4 Emission

The addition of organic matter (green manure, animal excrement, straw, etc.) leads to an increase in the production and emission of CH4 in rice soils [29,30]. It was proven that OS incorporation increased CH4 emissions, particularly the higher the OS-urea substitution ratio, the more obvious the effect (Figure 2). Similarly, previous studies demonstrated that fresh green manure as an alternative to chemical fertilization can significantly increase CH4 emission in flooded paddy soils [31]. The rapid phase of C release from oilseed rape residues was found to be the time of concentrated CH4 emission, indicating that CH4 emission was influenced by C in oilseed rape residues. (Figure 2a and Figure 5a). The ratio of OS-urea substitution significantly affects the decomposition of green manure, where C substrates are utilized by methanogens to produce CH4 [32,33].
Organic supplements can improve the quality of depleted soils, but they also impact the activities of methane-oxidizing and methanogenic bacteria, thus influencing the production and consumption of CH4. The rapid decomposition of OS consumed a large amount of oxygen (O2) in the soil and water layer, resulting in a decrease in Eh (Figure 7). Lower Eh provides a suitable anaerobic environment for methanogenic activities in paddy soil [34]. At the same time, the community structure of methanogenic bacteria in the soil changed due to the decrease in pH value [35]. Higher CH4 emissions at lower pH and Eh were also found by Baumann et al. [36] and Fan et al. [37]. Therefore, the significant increase in methane was due to the large amount of OS-organic materials input.

4.2. Influence of OS-Urea Substitution Ratio on N2O Emission

N2O emission increases with the increase of chemical nitrogen fertilizer (urea), with results that are consistent with those of previous authors [38,39,40]. However, some researchers have shown that green manure helps improve N use efficiency and reduces N2O emissions [40,41] due to the ability of appropriate organic substitution ratios to influence soil physicochemical properties and ammonia-oxidising bacteria (AOB) community structure, thereby reducing the AOB contribution of N2O [42]. In this study, N2O emission reached different peaks after applying different amounts of urea (Figure 3a), and the N2O emission peaks and seasonal N2O emissions had lower values at higher OS-urea substitution ratios (Figure 3). Nitrification and denitrification are the major contributors to N2O production [43]. The process of NH4+-N to NO3-N through nitrification leads to the production of N2O intermediates [44]. The results indicate that low OS-urea substitution ratio supplied greater NH4+-N than high OS-urea substitution ratio, contributing to higher N2O emission (Figure 6a). In addition, the amount of residual C after OS decomposition showed a significant negative correlation with the association of N2O emissions (p < 0.01, Figure 7). It may be that OS can increase soil C source and organic C content, providing a suitable environment for denitrifying anaerobic microorganisms, resulting in N2O emission [44].

4.3. GWP and GHGI

In the study, GWP and GHGI were used to estimate the global climatic impacts of CH4 and N2O emissions under different OS-urea substitution ratios. Approximately 73.3–97.2% of GWP comes from CH4 emission, suggesting that CH4 is a major GHG [45,46] (Figure 4a). Meanwhile, 48.9–60.4% of GWP occurred in the first 38 d after OS incorporation, suggesting that the critical period for reducing GHG emissions was during the pre-growth period of rice or the early stage of OS decomposition (Figure 4b). The 25% (decreased by 9.4%) and 50% OS (decreased by 3.6%) treatments significantly decreased GWP compared to the 0% OS (408.2 g CO2-eq m−2) treatment, mainly due to lower N2O emissions [47]. However, higher OS-urea substitution ratios have higher GWP because the replacement of chemical N fertilizer with OS reduces N2O emissions but significantly increases CH4 emissions. Although 25% OS increased CH4 emissions, the significantly lower N2O emissions more than offset the CH4 increase, thus offsetting the GWP caused by CH4, resulting in a significant 8.76% lower total GWP for 25% OS (369.7 g CO2-eq m−2) compared to the 0% OS treatment (405.2 g CO2-eq m−2), while the 25% OS yield did not change significantly from 0% OS treatment, resulting in lower GIGH (Table 2). Therefore, in order to maintain grain yield while allowing for GHG reductions, 25% OS treatment is an effective alternative strategy. The OS-urea alternative did not positively affect rice yield under the same pure nitrogen application conditions. Because the green manure oilseed rape, although rich in nutrients, is a slow-acting source of fertilizer compared with urea, a fast-acting fertilizer with high nitrogen content, the release of nutrients is slower. And to a certain extent, it is possible to meet the needs of crop growth in the early stage, but with the gradual reduction of easily decomposable substances in the decomposition of straw, the remaining difficult to degrade substances decompose slowly, and the release of nutrients is low [48]. Coupled with the reduction in the amount of urea applied, the fast-acting nitrogen that can be supplied can not promptly meet the needs of subsequent growth of rice, thus causing rice yield reduction. In particular, the greater the substitution rate, the more obvious the negative impact on yield. In this study, only 25% of the OS substitution rate did not significantly reduce yield (Table 2). Therefore, in subsequent related studies, measures can be taken to offset the yield reduction caused by the slow release of a small amount of straw as well as the reduction of urea dosage, such as increasing the amount of straw input. At the same time, more attention needs to be paid to GHG emission reduction during the pre-straw decomposition period (0–38 d), because more CH4 is emitted during this period (Figure 4b), and the contribution of CH4 emission to GHG is significantly higher than that of N2O emission (Figure 4a).

5. Conclusions

OS-urea substitution rate during rice cultivation has a role in influencing CH4 and N2O emissions from soil. CH4 emissions were strongly positively correlated with the OS-urea replacement ratio, while N2O emissions showed the opposite trend. The 25% OS treatment had the lowest total GWP and GHGI and the 100% OS had the highest GWP and GHGI, but the 25% OS treatment reduced GHG emissions while safeguarding rice yields compared to the conventional 0% OS treatment with fertilizer alone. The OS-urea substitution rate lead to changes in C and N content in paddy soils, and CH4 and N2O emissions were further affected. Soil NH4+-N, Eh, N and C remaining were the key variables linked to CH4 emissions, while Eh, NH4+-N and C remaining were the significant factors affecting N2O emissions.

Author Contributions

L.Y. (Lai Yao): Investigation, Writing–Original Draft. J.Z.: Investigation. W.Y.: Investigation, Formal analysis. D.Z.: Investigation. Y.Z.: Investigation. S.L.: Investigation. J.N.: Visualization, Writing-Review and Editing. L.Y. (Lixia Yi): Conceptualization, Writing–Review and Editing. Z.L.: Conceptualization, Writing–Review and Editing. B.Z.: Conceptualization, Supervision, Writing–Review and Editing. All authors have read and agreed to the published version of the manuscript.

Funding

This study was supported by the National Key Program of Strategic Science and Technology Innovation Cooperation of China (2022YFE0209200-04), the National Natural Science Foundation of China (No. 31870424), and the Shishou Leading County Advanced Technology Integrated Demonstration Base Construction (SS202304, SS202305).

Institutional Review Board Statement

Not applicable.

Data Availability Statement

Data available on request due to restrictions, e.g., privacy or ethical. The data presented in this study are available on request from the corresponding author.

Conflicts of Interest

The authors declare no conflicts of interest.

References

  1. Ye, S.; Song, C.; Shen, S.; Gao, P.; Cheng, C.; Cheng, F.; Zhu, D. Spatial pattern of arable land-use intensity in China. Land Use Policy 2020, 99, 104845. [Google Scholar] [CrossRef]
  2. FAO. FAOSTAT: Production: Crops and Livestock Products; FAO: Rome, Itlay, 2023; Available online: https://www.fao.org/faostat/en/#data/QCL (accessed on 6 March 2024).
  3. Hasukawa, H.; Inoda, Y.; Toritsuka, S.; Sudo, S.; Oura, N.; Sano, T.; Shirato, Y.; Yanai, J. Effect of Paddy-Upland Rotation System on the Net Greenhouse Gas Balance as the Sum of Methane and Nitrous Oxide Emissions and Soil Carbon Storage: A Case in Western Japan. Agriculture 2021, 11, 52. [Google Scholar] [CrossRef]
  4. Saunois, M.; Stavert, A.R.; Poulter, B.; Bousquet, P.; Canadell, J.G.; Jackson, R.B.; Raymond, P.A.; Dlugokencky, E.J.; Houweling, S.; Patra, P.K.; et al. The global methane budget 2000–2017. Earth Syst. Sci. Data 2020, 12, 1561–1623. [Google Scholar] [CrossRef]
  5. IPCC. Climate Change 2022: Mitigation of Climate Change; Cambridge University Press: Cambridge, UK; New York, NY, USA, 2022; Available online: https://www.ipcc.ch/report/ar6/wg3/ (accessed on 14 March 2023).
  6. Heffer, P.; Gruere, A.; Roberts, T. Assessment of Fertilizer Use by Crop at the Global Level 2014-2014/15; International Fertilizer Association, International Plant Nutrition Institute: Paris, France, 2017. [Google Scholar]
  7. Shaukat, M.; Samoy-Pascual, K.; Maas, E.D.; Ahmad, A. Simultaneous effects of biochar and nitrogen fertilization on nitrous oxide and methane emissions from paddy rice. J. Environ. Manag. 2019, 248, 109242. [Google Scholar] [CrossRef] [PubMed]
  8. Iboko, M.P.; Dossou-Yovo, E.R.; Obalum, S.E.; Oraegbunam, C.J.; Diedhiou, S.; Brümmer, C.; Témé, N. Paddy rice yield and greenhouse gas emissions: Any trade-off due to co-application of biochar and nitrogen fertilizer? A systematic review. Heliyon 2023, 9, e22132. [Google Scholar] [CrossRef] [PubMed]
  9. Bonginkosi, S.V.; Rebecca, Z.; Paramu, M.; Napo, N.; James, T. Seasonal Efuxes of Greenhouse Gases Under Diferent Tillage and N Fertilizer Management in a Dryland Maize Mono-crop. J. Soil Sci. Plant Nutr. 2021, 21, 2873–2883. [Google Scholar] [CrossRef]
  10. Zeng, Y.; Li, F. Impacts of Nitrogen Fertilizer Substitution on Greenhouse Gas Emission in a Paddy Field of South China Under Ridge Irrigation. J. Soil Sci. Plant Nutr. 2022, 22, 837–847. [Google Scholar] [CrossRef]
  11. Alpana, S.; Vishwakarma, P.; Adhya, T.K.; Inubushi, K.; Dubey, S.K. Molecular ecological perspective of methanogenic archaeal community in rice agroecosystem. Sci. Total Environ. 2017, 596–597, 136–146. [Google Scholar] [CrossRef] [PubMed]
  12. Islam, S.M.M.; Gaihre, Y.K.; Islam, M.R.; Ahmed, M.N.; Akter, M.; Singh, U.; Sander, B.O. Mitigating greenhouse gas emissions from irrigated rice cultivation through improved fertilizer and water management. J. Environ. Manag. 2022, 307, 114520. [Google Scholar] [CrossRef]
  13. Senthilraja, K.; Venkatesan, S.; Udhaya Nandhini, D.; Dhasarathan, M.; Prabha, B.; Boomiraj, K.; Geethalakshmi, V. Mitigating Methane Emission from the Rice Ecosystem through Organic Amendments. Agriculture 2023, 13, 1037. [Google Scholar] [CrossRef]
  14. Popa, D.C.; Laurent, Y.; Popa, R.A.; Pasat, A.; Bălănescu, M.; Svertoka, E.; Marin, M.P. A Platform for GHG Emissions Management in Mixed Farms. Agriculture 2023, 14, 78. [Google Scholar] [CrossRef]
  15. Kim, G.W.; Gwon, H.S.; Jeong, S.T.; Hwang, H.Y.; Kim, P.J. Different responses of nitrogen fertilization on methane emission in rice plant included and excluded soils during cropping season. Agric. Ecosyst. Environ. 2016, 230, 162–168. [Google Scholar] [CrossRef]
  16. Braker, G.; Conrad, R. Diversity, structure, and size of N2O-producing microbial communities in soils—What matters for their functioning? Adv. Appl. Microbiol. 2011, 75, 33–70. [Google Scholar] [CrossRef] [PubMed]
  17. Nyamadzawo, G.; Wuta, M.; Nyamangara, J.; Smith, J.L.; Rees, R.M. Nitrous oxide and methane emissions from cultivated seasonal wetland (dambo) soils with inorganic, organic and integrated nutrient management. Nutr. Cycl. Agroecosyst. 2014, 100, 161–175. [Google Scholar] [CrossRef]
  18. Yuan, J.; Yuan, Y.; Zhu, Y.; Cao, L. Effects of different fertilizers on methane emissions and methanogenic community structures in paddy rhizosphere soil. Sci. Total Environ. 2018, 627, 770–781. [Google Scholar] [CrossRef] [PubMed]
  19. Hodge, A.; Stewart, J.; Robinson, D.; Griffiths, B.S.; Fitter, A.H. Competition between roots and soil micro-organisms for nutrients from nitrogen-rich patches of varying complexity. J. Ecol. 2000, 88, 150–164. [Google Scholar] [CrossRef]
  20. Kuzyakov, Y.; Xu, X. Competition between roots and microorganisms for nitrogen: Mechanisms and ecological relevance. New Phytol. 2013, 198, 656–669. [Google Scholar] [CrossRef] [PubMed]
  21. Lashermes, G.; Nicolardot, B.; Parnaudeau, V.; Thuriès, L.; Chaussod, R.; Guillotin, M.L.; Linères, M.; Mary, B.; Metzger, L.; Morvan, T.; et al. Typology of exogenous organic matters based on chemical and biochemical composition to predict potential nitrogen mineralization. Bioresour. Technol. 2010, 101, 157–164. [Google Scholar] [CrossRef]
  22. Guo, T.; Zhang, Q.; Ai, C.; Liang, G.; He, P.; Zhou, W. Nitrogen enrichment regulates straw decomposition and its associated microbial community in a double-rice cropping system. Sci. Rep. 2018, 8, 1812–1847. [Google Scholar] [CrossRef]
  23. Zhu, B.; Yi, L.; Hu, Y.; Zeng, Z.; Lin, C.; Tang, H.; Yang, G.; Xiao, X. Nitrogen release from incorporated ¹⁵N-labelled Chinese milk vetch (Astragalus sinicus L.) residue and its dynamics in a double rice cropping system. Plant Soil 2014, 374, 331–344. [Google Scholar] [CrossRef]
  24. Bhattacharyya, P.; Roy, K.S.; Neogi, S.; Adhya, T.K.; Rao, K.S.; Manna, M.C. Effects of rice straw and nitrogen fertilization on greenhouse gas emissions and carbon storage in tropical flooded soil planted with rice. Soil. Tillage Res. 2012, 124, 119–130. [Google Scholar] [CrossRef]
  25. Linquist, B.A.; Marcos, M.; Adviento-Borbe, M.A.; Anders, M.; Harrell, D.; Linscombe, S.; Reba, M.L.; Runkle, B.R.K.; Tarpley, L.; Thomson, A. Greenhouse Gas Emissions and Management Practices that Affect Emissions in US Rice Systems. J. Environ. Manag. 2018, 47, 395–409. [Google Scholar] [CrossRef]
  26. Sun, H.F.; Zhou, S.; Zhang, J.N.; Zhang, X.X.; Wang, C. Effects of controlled-release fertilizer on rice grain yield, nitrogen use efficiency, and greenhouse gas emissions in a paddy field with straw incorporation. Field Crops Res. 2020, 253, 107814. [Google Scholar] [CrossRef]
  27. Song, K.; Zhang, G.; Ma, J.; Peng, S.; Lv, S.; Xu, H. Greenhouse gas emissions from ratoon rice fields among different varieties. Field Crops Res. 2022, 277, 108423. [Google Scholar] [CrossRef]
  28. IPCC. Climate Change 2021: The Physical Science Basis: Working Group I Contribution to the Sixth Assessment Report of the Intergovernmental Panel on Climate Change; Cambridge University Press: Cambridge, UK; New York, NY, USA, 2021; Available online: https://www.ipcc.ch/report/ar6/wg1/?__cf_chl_jschl_tk__=pmd_817adc6b26470b2060154bd1c68bd1ea450c9a50-1628507325-0-gqNtZGzNAjijcnBszQfO (accessed on 25 May 2023).
  29. Hu, Q.Y.; Liu, T.Q.; Jiang, S.S.; Cao, C.G.; Li, C.F.; Chen, B.; Liu, J.B. Combined Effects of Straw Returning and Chemical N Fertilization on Greenhouse Gas Emissions and Yield from Paddy Fields in Northwest Hubei Province, China. J. Soil Sci. Plant Nutr. 2020, 20, 392–406. [Google Scholar] [CrossRef]
  30. Wu, J.Q.; Wang, M.; Li, P.; Shen, L.Y.; Ma, M.Y.; Xu, B.Y.; Zhang, S.Y.; Sha, C.Y.; Ye, C.M.; Xiong, L.J.; et al. Effects of pig manure and its organic fertilizer application on archaea and methane emission in paddy fields. Land 2022, 4, 499. [Google Scholar] [CrossRef]
  31. Liu, Y.; Tang, H.; Muhammad, A.; Zhong, C.; Li, P.; Zhang, P.; Yang, B.; Huang, G. Rice yield and greenhouse gas emissions affected by Chinese milk vetch and rice straw retention with reduced nitrogen fertilization. Agron. J. 2019, 111, 3028–3038. [Google Scholar] [CrossRef]
  32. Watanabe, T.; Kimura, M.; Asakawa, S. Dynamics of methanogenic archaeal communities based on rRNA analysis and their relation to methanogenic activity in Japanese paddy field soils. Soil. Biol. Biochem. 2007, 39, 2877–2887. [Google Scholar] [CrossRef]
  33. Xu, H.; Zhu, B.; Liu, J.; Li, D.; Yang, Y.; Zhang, K.; Jiang, Y.; Hu, Y.; Zeng, Z. Azolla planting reduces methane emission and nitrogen fertilizer application in double rice cropping system in southern China. Agron. Sustain. Dev. 2017, 37, 29. [Google Scholar] [CrossRef]
  34. Muhammad, Q.; Huang, J.; Waqas, A.; Li, D.C.; Liu, S.J.; Zhang, L.; Cai, A.D.; Liu, L.S.; Xu, Y.M.; Gao, J.S.; et al. Yield sustainability, soil organic carbon sequestration and nutrients balance under long-term combined application of manure and inorganic fertilizers in acidic paddy soil. Soil Tillage Res. 2020, 198, 104569. [Google Scholar] [CrossRef]
  35. Pereira-Mora, L.; Terra, J.A.; Fernández-Scavino, A. Methanogenic community linked to organic acids fermentation from root exudates are affected by rice intensification in rotational soil systems. Appl. Soil. Ecol. 2022, 176, 104498. [Google Scholar] [CrossRef]
  36. Baumann, K.; Marschner, P.; Smernik, R.J.; Baldock, J.A. Residue chemistry and microbial community structure during decomposition of eucalypt, wheat and vetch residues. Soil Biol. Biochem. 2009, 41, 1966–1975. [Google Scholar] [CrossRef]
  37. Fan, L.; Dippold, M.A.; Ge, T.; Wu, J.; Thiel, V.; Kuzyakov, Y.; Dorodnikov, M. Anaerobic oxidation of methane in paddy soil: Role of electron acceptors and fertilization in mitigating CH4 fluxes. Soil Biol. Biochem. 2020, 141, 107685. [Google Scholar] [CrossRef]
  38. Sun, G.L.; Zhang, Z.G.; Xiong, S.W.; Guo, X.Y.; Han, Y.C.; Wang, G.P.; Feng, L.; Lei, Y.Q.; Li, X.F.; Yang, B.F.; et al. Mitigating greenhouse gas emissions and ammonia volatilization from cotton fields by integrating cover crops with reduced use of nitrogen fertilizer. Agric. Ecosyst. Environ. 2022, 332, 107946. [Google Scholar] [CrossRef]
  39. Xu, P.S.; Li, Z.T.; Wang, J.Y.; Zou, J.W. Fertilizer-induced nitrous oxide emissions from global orchards and its estimate of China. Agric. Ecosyst. Environ. 2022, 328, 107854. [Google Scholar] [CrossRef]
  40. Yang, W.; Yao, L.; Zhu, M.Z.; Li, C.W.; Li, S.Q.; Wang, B.; Dijkstra, P.; Liu, Z.Y.; Zhu, B. Replacing urea-N with Chinese milk vetch (Astragalus sinicus L.) mitigates CH4 and N2O emissions in rice paddy. Agric. Ecosyst. Environ. 2022, 336, 108033. [Google Scholar] [CrossRef]
  41. Zhou, G.P.; Cao, W.D.; Bai, J.S.; Xu, C.X.; Zeng, N.H.; Gao, S.J.; Rees, R.M.; Dou, F.G. Co-incorporation of rice straw and leguminous green manure can increase soil available nitrogen (N) and reduce carbon and N losses: An incubation study. Pedosphere 2020, 30, 661–670. [Google Scholar] [CrossRef]
  42. Bi, R.Y.; Xu, X.T.; Zhan, L.P.; Chen, A.F.; Zhang, Q.Q.; Xiong, Z.Q. Proper organic substitution attenuated both N2O and NO emissions derived from AOB in vegetable soils by enhancing the proportion of Nitrosomonas. Sci. Total Environ. 2023, 866, 161231. [Google Scholar] [CrossRef]
  43. Kuypers, M.M.M.; Marchant, H.K.; Kartal, B. The microbial nitrogen-cycling network. Nat. Rev. Microbiol. 2018, 16, 263–276. [Google Scholar] [CrossRef]
  44. Cheng, Y.; Xie, W.; Huang, R.; Yan, X.Y.; Wang, S.Q. Extremely high N2O but unexpectedly low NO emissions from a highly organic and chemical fertilized peach orchard system in China. Agric. Ecosyst. Environ. 2017, 246, 202–209. [Google Scholar] [CrossRef]
  45. Ariani, M.; Haryono, E.; Hanudin, E. Greenhouse gas emission from rice field in Indonesia: Challenge for future research and development. Indones. J. Geogr. 2021, 53, 30–44. [Google Scholar] [CrossRef]
  46. Wang, W.; Lai, D.Y.F.; Wang, C.; Tong, C.; Zeng, C. Effects of inorganic amendments, rice cultivars and cultivation methods on greenhouse gas emissions and rice productivity in a subtropical paddy field. Ecol. Eng. 2016, 95, 770–778. [Google Scholar] [CrossRef]
  47. Zhou, W.; Ma, Q.X.; Wu, L.; Hu, R.G.; Jones, D.L.; Chadwick, D.R.; Jiang, Y.B.; Wu, Y.P.; Xia, X.G.; Yang, L.; et al. The effect of organic manure or green manure incorporation with reductions in chemical fertilizer on yield-scaled N2O emissions in a citrus orchard. Agric. Ecosyst. Environ. 2022, 326, 107806. [Google Scholar] [CrossRef]
  48. Latifmanesh, H.; Deng, A.; Li, L.; Chen, Z.J.; Zheng, Y.T.; Bao, X.T.; Zheng, C.Y.; Zhang, W.J. How incorporation depth of corn straw affects straw decomposition rate and C&N release in the wheat-corn cropping system. Agric. Ecosyst. Environ. 2020, 300, 107000. [Google Scholar] [CrossRef]
Figure 1. Rainfall and average daily temperatures during the test period.
Agriculture 14 00839 g001
Figure 2. Emission fluxes (a) and cumulative emissions (b) of CH4 at five OS urea substitution rates. The tillering stage, filling stage, first maturity stage and regeneration stage represent the first season of rice from transplanting to tillering, from tillering to filling, from filling to first season maturity and from first season maturity to regrowth season maturity, respectively, hereafter. The bar perpendicular to the x-axis represents the standard error (SE), below. Different lowercase letters indicate significant differences between treatments (p < 0.05), below. Quadratic linear regression between OS-urea substitution rate and cumulative CH4 emissions was significant (p < 0.01). The red curve is the fitted curve of the equation.
Agriculture 14 00839 g002
Figure 3. Emission fluxes (a) and cumulative emissions (b) of N2O at five OS-urea substitution rates. Quadratic linear regression between OS-urea substitution rate and cumulative N2O emissions was significant (p < 0.01). The red curve is the fitted curve of the equation.
Agriculture 14 00839 g003
Figure 4. GWP (a) at five OS-urea substitution rates (0% OS, 25% OS, 50% OS, 75% OS, 100% OS). GWPCH4 is the global warming potential contributed by CH4 emissions and GWPN2O is the global warming potential contributed by N2O emissions. Quadratic linear regression between OS-urea substitution rate and GWP is significant (p < 0.01). GWP (b) around the major peak of CH4 in percent. 0–38 d and 38–192 d represent the total GWP due to CH4 and N2O emissions from fertilizer application to day 38 and from day 38 to day 192, respectively. The red curve is the fitted curve of the equation.
Agriculture 14 00839 g004
Figure 5. Percentage of carbon (a) and nitrogen (b) residues in oilseed rape residues at different OS-urea substitution ratios from fertilizer application to day 192.
Agriculture 14 00839 g005
Figure 6. Soil NH4+-N (a), NO3-N (b), Eh (c) and pH (d) changes of different OS-urea substitution ratios.
Agriculture 14 00839 g006
Figure 7. The effects of each soil indicator on CH4 and N2O emissions were analyzed by constructing a structural equation model (SEM). The results of model fitting parameters: X2/df = 1.94, p = 0.88, RMSEA (Root Mean Square Error of Approximation) = 0.094, NFI (Normed Fit Index) = 0.94, CFI (Comparative Fit Index) = 0.97, GFI (Goodness Fit Index) = 0.92. Soil properties: Eh, pH, C remaining, N remaining, NH4+-N and NO3-N. The black and red lines indicate negative correlations, positive correlations and the value of the standardized path coefficient represents the degree of influence between the two indicators, respectively. * p < 0.05, ** p < 0.01, *** p < 0.001.
Agriculture 14 00839 g007
Table 1. Contribution of OS or urea applied to carbon and nitrogen per treatment.
TreatmentN Applied from Urea (g pot−1)N Applied from OS
(g pot−1)
C Applied from OS
(g pot−1)
0% OS0.300
25% OS0.2250.0750.67
50% OS0.150.151.35
75% OS0.0750.2252.03
100% OS00.32.71
Table 2. Effects of different OS-urea substitution rates on total GWP, CH4 and N2O-induced global warming potential, rice yield and GHGI.
TreatmentCH4-Induced GWPN2O-Induced GWPTotal GWP
(g CO2-eq m−2)
Grain Yield
(g m−2)
GHGI
(kg CO2-eq kg−1 Yield)
GWP
(g CO2−eq m−2)
Account for Total GWP (%)GWP
(g CO2−eq m−2)
Account for Total GWP (%)
0% OS297.1 e73.3108.1 a26.7405.2 b785.7 a0.52 b
25% OS312.3 d84.557.3 a15.5369.7 d755.7 a0.49 c
50% OS362.4 c92.131.2 b7.9393.5 c648.0 b0.61 a
75% OS465.0 b95.820.6 c4.2485.6 b526.1 bc0.92 a
100% OS617.2 a97.217.8 d2.8635.0 a444.3 c1.43 a
In the same column, different lowercase letters indicate significant differences between OS-urea replacement rate treatments (p < 0.05).
Table 3. C, N release rates (kC, kN) of OS residues at different OS-urea substitution rates (single-index model).
TreatmentKCr2KNr2
25% OS0.02720.83130.07060.9574
50% OS0.03030.83800.06670.9563
75% OS0.02320.68340.08320.9855
100% OS0.02020.79460.06890.9747
Disclaimer/Publisher’s Note: The statements, opinions and data contained in all publications are solely those of the individual author(s) and contributor(s) and not of MDPI and/or the editor(s). MDPI and/or the editor(s) disclaim responsibility for any injury to people or property resulting from any ideas, methods, instructions or products referred to in the content.

