Article

Does the Trade of Livestock Products Enhance Micro-Nutrient Availability While Minimizing Environmental Impact?

1
School of Mathematics and Science, Hebei GEO University, 136 Huai’an Road, Shijiazhuang 050031, China
2
State Key Laboratory of Crop Biology, College of Agronomy, Shandong Agricultural University, Tai’an 271018, China
3
Hebei Key Laboratory of Soil Ecology, Center for Agricultural Resources Research, Institute of Genetic and Developmental Biology, The Chinese Academy of Sciences, 286 Huaizhong Road, Shijiazhuang 050021, China
*
Author to whom correspondence should be addressed.
Agriculture 2024, 14(6), 861; https://doi.org/10.3390/agriculture14060861
Submission received: 30 April 2024 / Revised: 22 May 2024 / Accepted: 27 May 2024 / Published: 30 May 2024
(This article belongs to the Section Agricultural Economics, Policies and Rural Management)

Abstract

:
Providing sufficient, high-quality food without compromising efforts in climate change and environmental pollution control is a long-term imperative for humanity. Livestock product trade may help bridge the gap in micro-nutrient supply; however, its potential environmental impacts remain underexplored. Using data from 200 countries and 77 different livestock commodities from 1961 to 2019, this study uncovers the impact of livestock trade on micro-nutrient productivity per livestock unit and per feed nitrogen input. Our results indicate that livestock trade has improved productivity for all seven studied micro-nutrients over the past 59 years, except for vitamin A. This improvement has led to a substantial reduction in the number of livestock units and feed nitrogen requirements needed to deliver the same amount of micro-nutrients, thereby reducing related greenhouse gas emissions and nitrogen losses globally. Generally, livestock trade has become more optimal and functional in terms of livestock productivity and feed use efficiency, particularly in the most recent decade, although there were slight differences between various micro-nutrients. We recommend continuing and potentially increasing international livestock trade, given the higher efficiency gap between exporting and importing countries; however, this should be structured more appropriately.

1. Introduction

In 2020, about 150 million children under the age of five suffered from stunting, despite a global decrease in undernutrition over the recent decades [1]. Additionally, over 370 million infants and young children were estimated to be deficient in essential micro-nutrients [2], which could inhibit their healthy growth and development [3]. The micro-nutrient deficiency issue is more severe when considering the edibility, loss, and waste of food during the production and consumption chain. It is estimated that 90 of 156 countries were in a deficit for all the vitamins and minerals, and no country was free of deficiencies for all 11 analyzed nutrients [4]. Animal-sourced foods are rich in amino acids and micro-nutrients such as iron, zinc, calcium, and vitamin A [5]. These foods are crucial for the physical and cognitive development of children and adolescents. Consistent consumption of animal-sourced foods is associated with reduced stunting in young children [6,7], increased child weight in developing countries [6,7,8], and is necessary to ensure adequate nutrition in developed countries, such as the United States of America (USA) [9].
Livestock production is typically associated with higher environmental costs, partly due to increased demand for concentrated feed [10] and partly due to poor manure management [11,12,13]. The livestock production and consumption chain is responsible for around 20% of anthropogenic greenhouse gas (GHG) emissions, considering the food system’s overall contribution to total anthropogenic GHG emissions and livestock production’s specific share [14,15]. Most of these emissions occur from feed-related land-use change and farm management practices [15]. Additionally, the livestock production chain is a significant contributor to reactive nitrogen (N) losses, accounting for one-third of all anthropogenic reactive N losses, primarily resulting from inefficient manure management [13]. Therefore, it is essential to supply sufficient micro-nutrients via livestock while minimizing associated environmental costs.
Over the past six decades, the trade of livestock products has increased dramatically, with significant increases in meat, milk, and egg exports. From 1961 to 2022, meat exports grew by 17 times, milk by 3.4 times, and eggs by 6.8 times (Figure S1). In 2022, exported products accounted for 14% of produced meat, 2.7% of produced milk, and 8.7% of produced eggs, marking a significant increase compared to six decades ago (Figure S1). The increase is due to increased globalization and advances in international freight transportation technologies. The large trade of livestock products may substantially impact the virtual trading of environmental costs between countries, given the high environmental impacts of livestock production, such as GHG emissions [15].
Recent studies have highlighted the importance of quantifying the environmental costs associated with the trade of agricultural products. For example, using the global MRIO model, Liu et al. (2023) found that 25% of global N2O emissions in 2014 were linked to international trade [16]. The trade of crop products and livestock products was responsible for 42% and 31% of these trade-related N2O emissions, respectively. Similarly, around a quarter of agricultural-related NH3 emissions were trade-related, possibly inducing 61,000 PM2.5-related deaths, with 36,000 of these deaths linked to the trade of livestock products. The total amount of GHG emissions embedded in livestock product trade was 92 Tg in 2017, accounting for 2.6% of the total emissions from livestock production [17]. These studies focused on the environmental impacts embedded in traded products and the trading communities but paid less attention to evaluating whether trade has increased or decreased resource use and environmental pollution compared with a situation of no trade.
Few studies have tried to quantify the effects of trade. For example, Liu et al. (2024a) found that the trade of agricultural products has worsened the water scarcity in California, Arizona, and New Mexico [18]. However, most of these studies relied on the multi-regional input–output model, which requires complex trade data between countries that are not easy to access and analyze. The multi-regional input–output model also neglects changes in agricultural production structure due to trade. For instance, countries may substitute low-yield soybean production with high-yield maize production, or high-environmental cost beef production with poultry production, due to the availability of traded soybean and bovine meat. These changes could substantially affect the productivity and environmental performance of net importing countries; however, the multi-regional input–output model was unable to capture this. In addition, the input–output model requires a pair-to-pair comparison of productivity and environmental pollution for traded products. However, the importing countries in cold regions often import tropical products from hot regions, and it is impossible to create pair-to-pair companions since no tropical products can be grown in cold regions.
To solve the inconvenience of the multi-regional input–output model, Bai et al. (2021a) developed a new method, the cumulative distribution curve, to systematically evaluate the impacts of food and feed trade on global land use, livestock production, and N fertilizer use [19]. This method introduced two new indicators, trade optimality and functionality, to quantitatively evaluate the impacts of trade on resource use and environmental performances. Bai et al. (2021a) found that trading food and feed may substantially increase global land use efficiency and livestock productivity when trade was evaluated on a protein basis [19]. Using the same method, Bai et al. (2023) found that the trade of agricultural products has improved the partial factor productivity of phosphorus fertilizer and feed globally [20].
Although few studies have evaluated the impacts of trade of agricultural products on the resources use and environmental performances [18,19,20], most of these studies have focused on the availability of macro-nutrients such as protein and calories. There was still little information available about the trade impacts based on micro-nutrients. In addition, the trend and overall impacts may differ between macro- and micro-nutrients. Bai et al. (2021a) found a controversial result when comparing the trade impacts of agricultural products based on calories versus protein [19]. The difference is due to the contrasting calorie and protein content between different products. In addition, the optimality of trade increased when evaluated based on the partial factor productivity of N fertilizer in the past six decades, but decreased when evaluated based on the partial factor productivity of phosphorus fertilizer [19,20]. The micro-nutrient contents of different agricultural products differed from their protein and calorie content [19] (Table S1). Therefore, the effects of trading agricultural products on micro-nutrient supply and environmental performances remain uncertain and require further investigation.
Here, we aim to fill this crucial knowledge gap by applying the trade optimality and functionality analytic framework developed by Bai et al. (2021a; 2023) [19,20]. We have selected seven micro-nutrients for study, including vitamin A (VA), vitamin B3 (VB3), vitamin B12, calcium (Ca), magnesium (Mg), iron (Fe), and zinc (Zn), due to their importance in supplying essential micro-nutrients to humans [4,5,6,7,8,9]. The main contributions of this study are threefold: (1) quantifying the micro-nutrients in 77 different livestock products from 160 countries or regions over the past six decades; (2) assessing the optimality and functionality of livestock product trade in terms of livestock productivity and the partial factor productivity of feed N using a comprehensive analytical framework; (3) distinguishing differences in trade optimality and functionality between various micro-nutrients.

2. Material and Methods

2.1. Trade of Livestock Products and Micro-Nutrient Contents

We calculated the net trade of livestock products in terms of various micro-nutrients, between importing and exporting countries for approximately 200 countries worldwide from 1961 to 2019. The net trade was determined using the following equation:
N e t   t r a d e a g r i   p r o d = i = 1 n I i × C i i = 1 n E i × C i
where N e t   t r a d e a g r i   p r o d represents the net trade (importing minus exporting) of micro-nutrients embedded in the livestock products per country. I i and E i represent the import and export of agricultural product i (where i = 1, 2, 3……n), in Tg, respectively. Ci represents the micro-nutrients for product i in kg t−1. The export and import of 77 livestock products from 200 countries from 1961 to 2019 were obtained from the FAOSTAT [21]. There has always been inconsistency between reported imports and exports due to fluctuations in the storage of traded livestock products, which was found to be 5% for most decades, with a few exceptions. Therefore, discrepancies between global export and import data for livestock products were addressed by proportionally adjusting the importation data for each product, decade, and country to align with their original contributions until the export–import difference was less than 5%. The micro-nutrient contents for different livestock products, as documented in the FAOSTAT trade database, were collected from Yang (2019), Wang et al. (2023), and USDA (2023), and these details are presented in Table S1 [4,22,23].

2.2. The Micro-Nutrient Productivity of Livestock Production

Two primary productivity parameters were selected to assess the impact of livestock product trade on micro-nutrient productivity: (1) livestock productivity, expressed as micro-nutrient production per livestock unit per year per country; (2) partial feed N productivity in livestock production, expressed as micro-nutrient production per feed N input per year per country. The selection of these two indicators was based on the consideration of environmental costs, as we aim to achieve the same or higher amount of micro-nutrients with fewer livestock units or feed N inputs, thereby minimizing the negative impacts on greenhouse gas emissions and N losses. Livestock productivity in terms of micro-nutrients is defined as the total amount of micro-nutrients produced by livestock in a country, divided by the total livestock population in that country. Here, all livestock numbers were converted into standard livestock units (LSU), equivalent to 500 kg of dairy cattle. Micro-nutrient production was calculated based on livestock product data derived from the FAOSTAT production database [21], multiplied by their micro-nutrient contents (Table S1). Livestock numbers were converted to standard LSU using coefficients from Liu et al. (2017) [24]. Partial feed N productivity in terms of micro-nutrient production was calculated based on the total micro-nutrient production by livestock and total feed N intake by livestock, following the methodology of Bai et al. (2021a) [19].

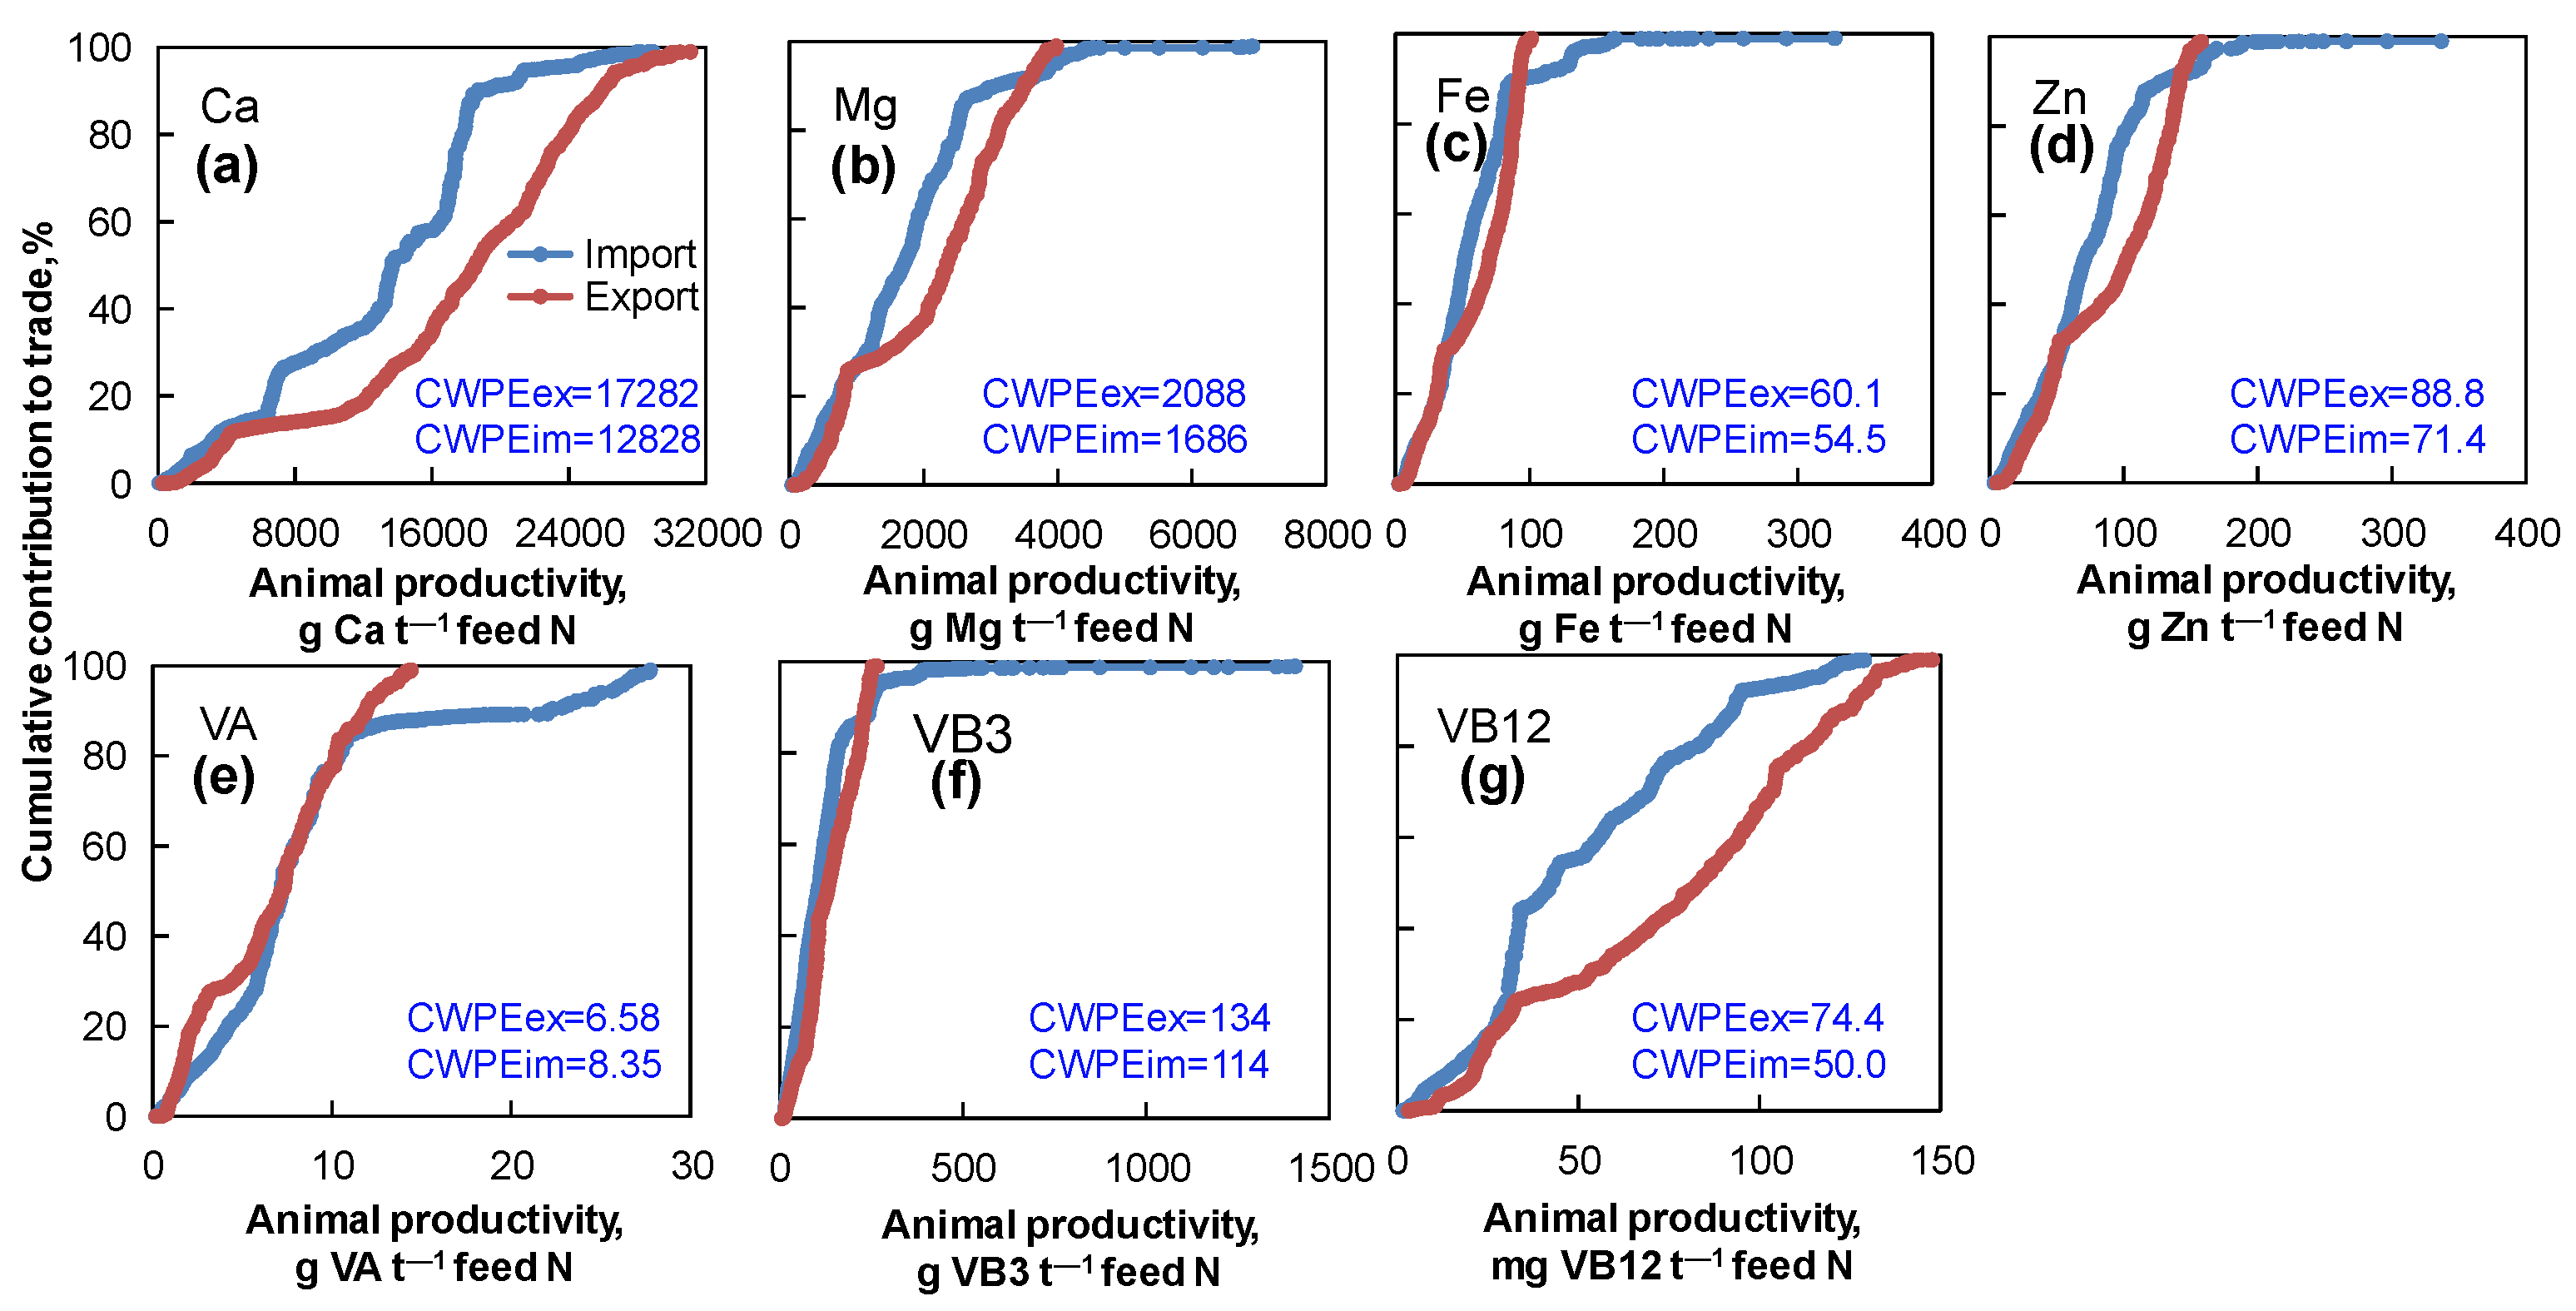
2.3. The Cumulative Distribution Curve of Livestock Production

The cumulative distribution curve was developed by Bai et al. (2021) as a tool to quantify the level of production concentration in high-productivity countries and trade optimality [19]. We constructed the curve by plotting each country on the x-axis in ascending order of livestock productivity (Figure 1a), while the contribution of each country to the total global production of micro-nutrients by livestock is plotted on the y-axis (%). The cumulative productivity distribution curve of livestock divides the graph into two parts, area A (dark grey) between the y-axis, the 100% contribution line, and the curve itself; and area B (light blue) between the x-axis, the maximum productivity line, and the curve (Figure 1a). For estimating functionality and optimality of trade, we produced separate cumulative distribution curves for the net importing countries and net exporting countries for each micro-nutrient (Figure 1b).

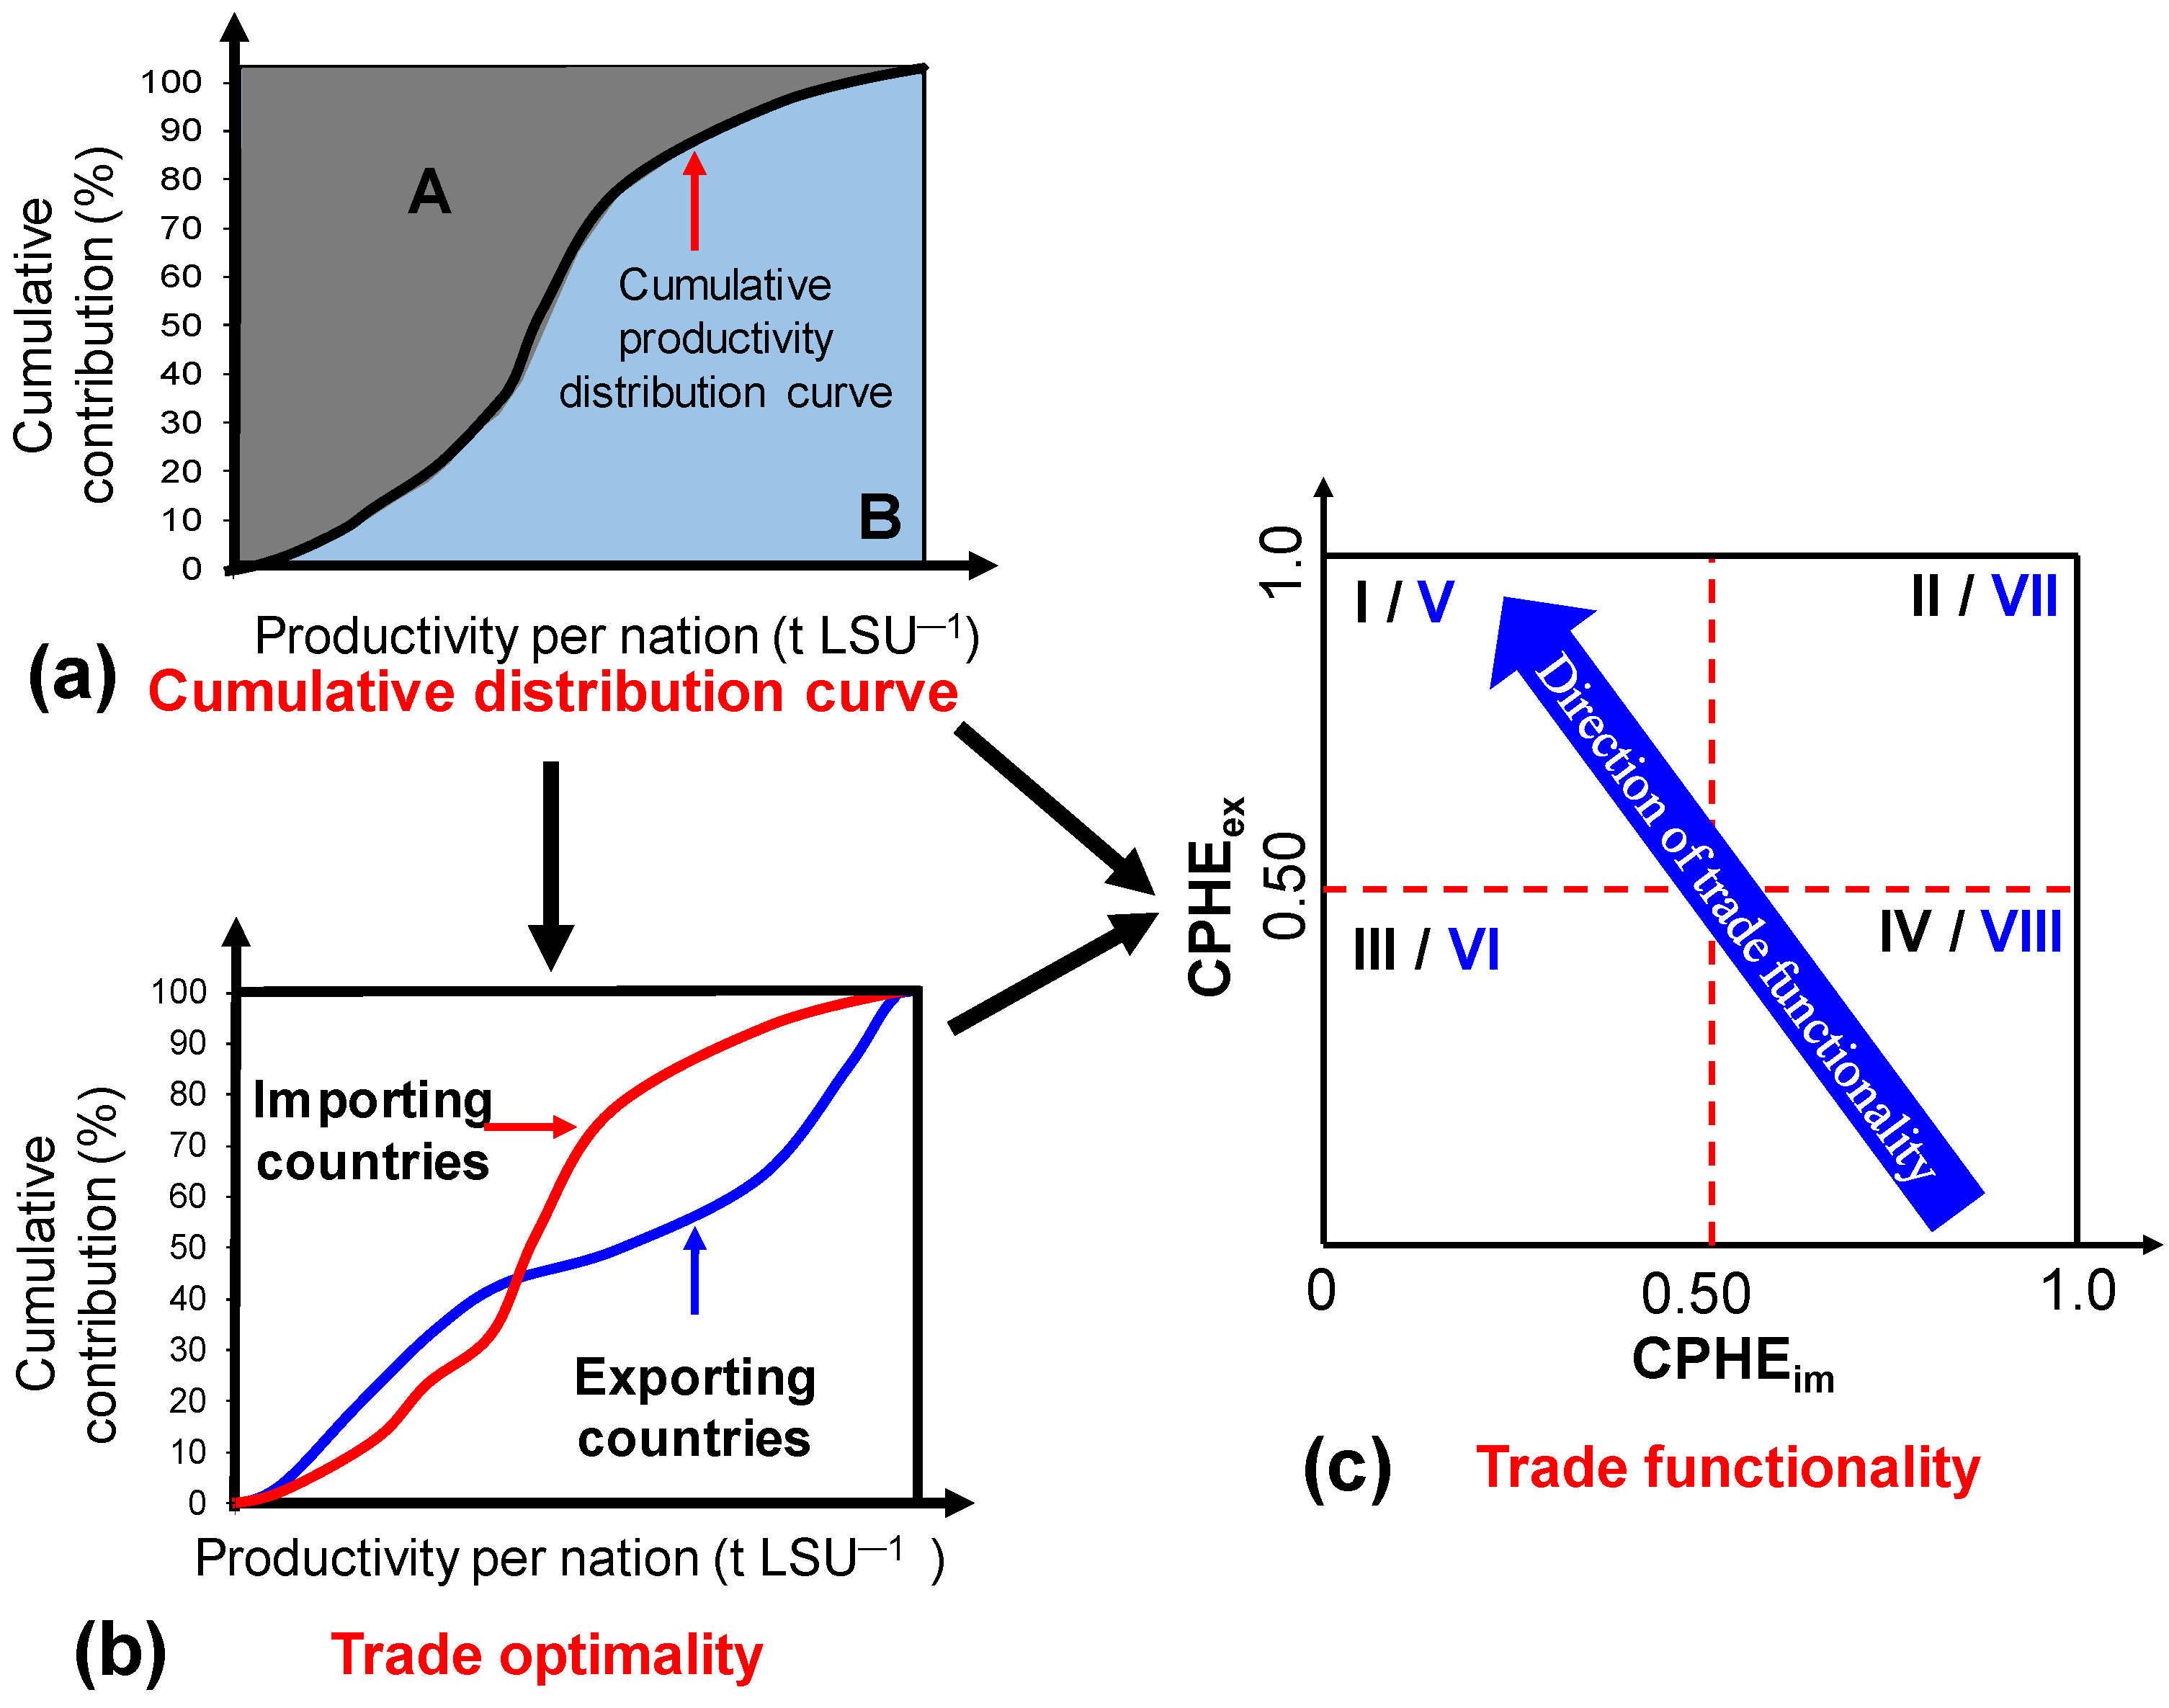
2.4. Trade Optimality and Functionality Analytic Farmwork

We employed two complementary indicators to evaluate the impact of international livestock product trade on micro-nutrient productivity: trade functionality and trade optimality. These indicators are derived from the cumulative productivity distribution curve introduced by Bai et al. (2021a) [19] and are illustrated in Figure 1c.
Trade functionality is defined as the concentration of trade by high-productivity exporting or importing countries. These values are dimensionless and range between 0 and 1.0. Export or import functionality is calculated based on the concentration of production in high-efficiency countries (CPHE):
CPHE = A ÷ ( A + B )
where A is the area of the cumulative productivity distribution curve of countries (Figure 1a). A + B is the area of the rectangle (Figure 1a). CPHE ranges from 0 to 1; a relatively high value indicates a concentration of trade by a few high-efficiency countries. Trade was considered functional when the CPHE of exporting countries (CPHEex) was >0.50 and the CPHE of importing countries (CPHEim) was <0.50 (Figure 1b). Livestock product trade is deemed functional when more than 50% of the micro-nutrients embedded in exported livestock products are exported by relatively high-efficiency countries, and more than 50% of the micro-nutrients embedded in imported products are imported by relatively low-productivity countries (Figure 1c).
Trade optimality is defined as the functionality-corrected average productivity of net exporting or importing countries. We utilized concentration-weighted production efficiency (CWPE) to assess the productivity of a given agricultural product, which is calculated by multiplying CPHE by the maximum productivity:
CWPE = P r o d u c i v i t y m a x × C P H E
where P r o d u c t i v i t y m a x is the highest micro-nutrient production per livestock stand unit (LSU) or feed N input per country in kg LSU−1 or kg kg−1 feed N. Here, LSU refers to a standard unit of dairy cattle with a weight of 500 kg. Trade was considered near-optimal when CWPEex/CWPEim ≥ 1.0 (Figure 1c). Trade of a commodity is deemed near-optimal when exporting countries exhibit a higher CWPE than importing countries; this reflects the transfer of goods from areas of high productivity to areas of low productivity. Conversely, trade is considered less optimal when CWPEex < CWPEim. There are eight possible combinations of CPHEex, CPHEim, CWPEex, and CWPEim, as depicted in Figure 1c.

2.5. Potential Impacts on Livestock Productivity and Feed N Use

The potential reduction or increase in LSU and feed N through the trade of livestock products, in terms of the productivity of micro-nutrients, has also been estimated relative to a scenario without trade.
L S U   o r   f e e d   N s a v e   = a = 1 n ( I Q a ÷ I p r o d u c t i v i t y a ) a = 1 n ( E Q a ÷ E p r o d u c i t i v i t y a )
where I Q a is the number of micro-nutrients imported by country a. I p r o d u c t i v i t y a is the livestock productivity or partial feed N productivity in importing country a. E Q a is the amount of micro-nutrients exported by country a. E p r o d u c t i v i t y a is the livestock productivity or partial feed N productivity in exporting country a. If the values are larger than zero, it indicates that trade contributed to a reduction in LSU or feed N input. Conversely, when the values are below than zero, it indicates the opposite effect.

3. Results and Discussion

3.1. Impacts of Trade on the Micro-Nutrient Production per Livestock Unit

Here, we analyzed the difference between CWPEex and CWPEim, aiming to evaluate the effects of trade livestock products on the production of seven distinct micro-nutrients per livestock standard unit (LSU). Over the 59-year period, the mean CWPEex exceeded those of CWPEim for all seven micro-nutrients, except for vitamin A (VA) (Figure 2). This trend suggests that livestock products were predominantly exported from high to low micro-nutrient productivity countries. This implies a potential increase in global livestock productivity in micro-nutrients or a decrease in the LSU requirements for producing the same amount of micro-nutrients, except for vitamin A. These findings align with those of Bai et al. (2021a), who reported that the trade of livestock products could potentially save LSU when productivity is expressed as protein and calorie production [19].
There were significant variations in the CWPEex/CWPEim ratio across different micro-nutrients over the past 59 years. The ratio decreased in the order of VB12 (1.46), Ca (1.22), VB3 (1.20), Zn (1.19), Mg (1.15), Fe (1.13), and VA (0.89), indicating that trade had a lesser positive impact on improving livestock productivity or decreasing productivity when expressed as VA (Figure 2). For detailed impacts of trade on livestock productivity in terms of micro-nutrients across different decades, refer to Figures S2–S8.
The contrasting differences observed between VA and six other micro-nutrients are possibly due to differences in their concentrations across various products. For example, livestock offal, such as liver, is rich in VA but lacks significant levels of other micro-nutrients (Table S1). Net importing countries were usually poor countries with a habit of consuming livestock offal, such as China, resulting in higher productivity of VA per LSU compared to net exporting countries. Similar findings also exist for the trade of crop products. There was abundant trade in soybeans between countries, which potentially increased global land use efficiency when evaluated based on protein content. However, this trade turned to reduce global land use efficiency when assessed in terms of calorie content. This is because soybeans are rich in protein content but poor in calorie content. While exporting countries might excel in protein yield per hectare of cropland, they may lag behind importing countries with intense rice and maize production [19] (Bai et al., 2021a).

3.2. Impacts of Trade on the Micro-Nutrient Production per Feed N Input

Parallel to livestock productivity, the trade of livestock products has increased the partial factor productivity of feed N for all seven studied micro-nutrients, except for VA, over the past 59 years (Figure 2 and Figure 3). Despite large differences in the CWPEex/CWPEim ratio for different micro-nutrients in terms of partial factor productivity of feed N, the order of the ratio for various micro-nutrients was similar to that for livestock productivity per LSU (Figure 2 and Figure 3). This suggests that countries with higher livestock productivity may also exhibit higher partial factor productivity of feed N. For a detailed analysis of the impacts of trade on the partial factor productivity of feed N in terms of micro-nutrients across different decades, see Figures S9–S15.

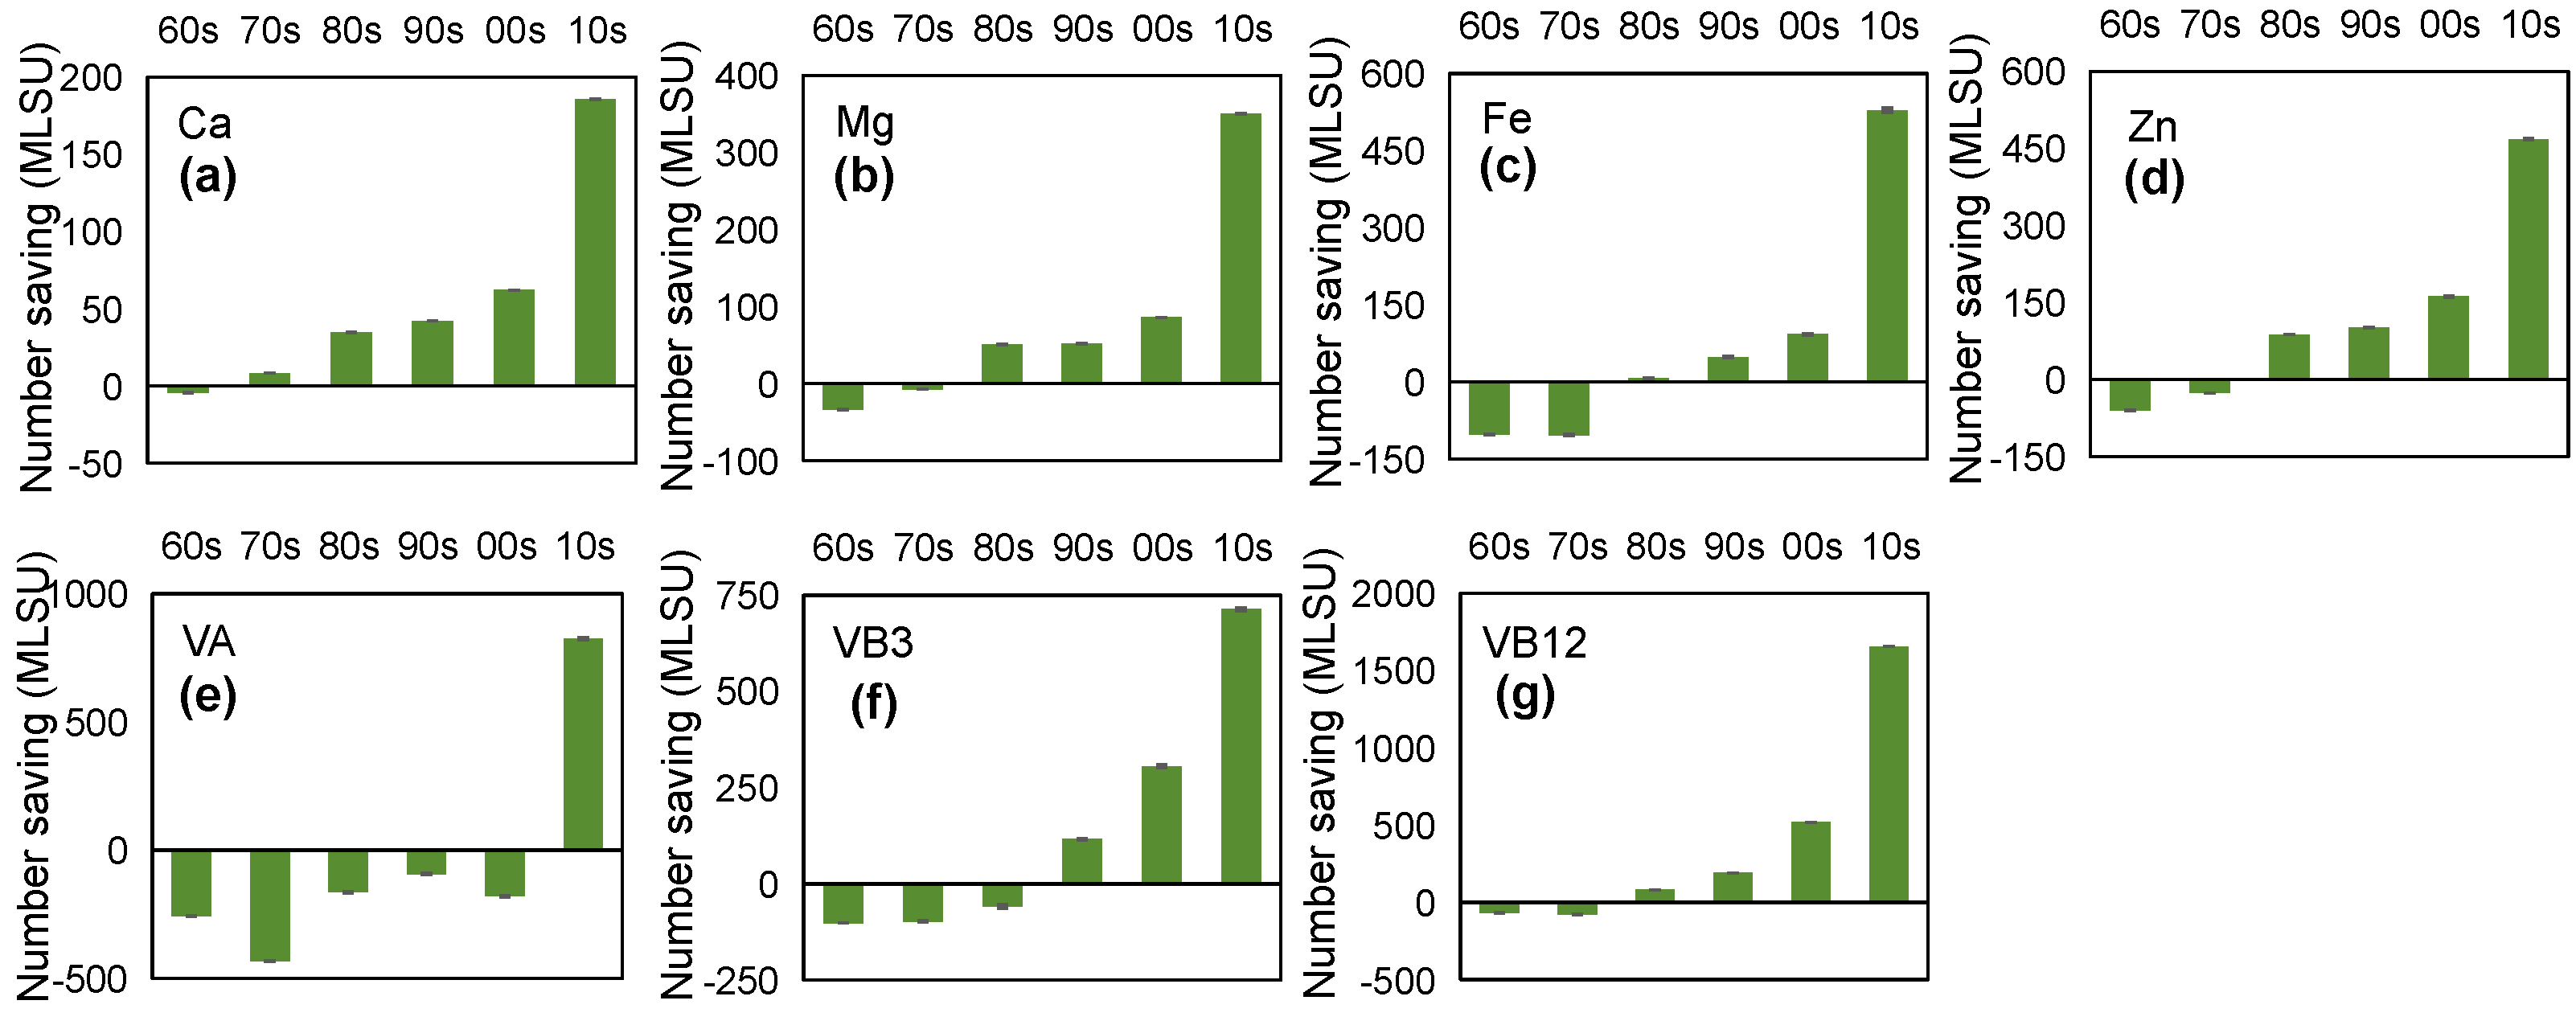
3.3. Potential Increase or Reduction in Livestock Units through Trade

The cumulative potential reduction in livestock numbers due to international trade of livestock products varied between −200 million LSU for VA and 2200 million LSU for VB12 annually over the period 1961–2019 (Figure 4a). Approximately 1000 million LSU was reduced through trade for VB3 and Zn production, while the reduction rate was halved to around 500 million LSU when productivity was based on Ca, Mg, and Fe (Figure 4a).
However, there were large variations in the potential increase or reduction in livestock units between different decades (Figure 5). Trade has potentially increased livestock units in the 1960s and 1970s for all micro-nutrients, leading to a reduction in livestock productivity, especially for Fe and VA production (Figure 5). Then, the trade of livestock products turned to a reduction in the livestock units or an increase in productivity for all micro-nutrients after the 1990s, except for VA. The most significant reduction in livestock units through trade occurred in the most recent decade—2010s, even for VA (Figure 5). This trend was also found by Bai et al. (2021a), who reported that the potential reduction in livestock units has gradually increased in recent decades. The large contribution to the reduction in LSU in the 2010s was partially due to the enlarged CWPEex/CWPEim ratio (Figures S2–S8) and partly due to the rapid increase in the trade of livestock products in recent decades (Figure S1).
In the most recent decade, the average potential reduction in livestock population through the trade of livestock products was lowest from 18 M LSU for Ca to 150 M LSU for VB12 per year (Figure 5). For comparison, the global livestock number was around 370 million LSU in 2019 (FAO, 2024). This indicates that without the trade of livestock products, the global livestock population may be 4.9%-40% higher than the current level when the purpose of livestock production is to supply micro-nutrients. This would lead to a substantial reduction in GHG emissions. It has been estimated that livestock production contributed around 9900 Tg CO2eq per year [15]. A reduction of 4.9–40% through trade may potentially lead to a decrease in GHG emissions by 480–3900 Tg CO2eq per year. The livestock production and consumption chain is also responsible for 65 Tg N losses per year to the environment [13], which can also be potentially reduced by 3.2–26 Tg through the trade of livestock products aimed at supplying micro-nutrients.

3.4. Potential Increase or Reduction in Feed N through Trade

The trade of livestock products has potentially led to a reduction in feed N by −140 Tg for VA to 60 Tg N for VB12 over the past 59 years (Figure 4b). The minus value means that the trade of livestock products has the potential to increase global feed N use by 140 Tg compared to a situation with no trade, when the purpose of livestock product trade was to supply VA. Conversely, when the values were positive, it suggested a decrease in global feed N usage. The cumulative reduction rate was highest for VB3 and VB12, followed by Mg and Zn during the past 59 years. Similar to livestock units, the use of feed N was potentially increased through trade in the 1960s and 1970s. However, it then gradually began to decrease, especially in the most recent decade. Most of the reduction in feed N was also observed in the 2010s, partly due to the higher CWPEex/CWPEim ratio (Figures S9–S15) and partly due to the increased trade volume.
An average reduction in feed N through the trade of livestock products was in the range of 0.8 to 5.0 Tg annually in the 2010s, when the purpose of the trade was for the supply of micro-nutrients (Figure 6). For comparison, the current feed N intake by all livestock is estimated at 120 Tg [19]. Without the trade of livestock products, global feed N consumption may potentially increase from 0.7% to 4.2%. Reducing feed requirements may decrease feed consumption, particularly soybean, which is often linked to a higher risk of land-use change and associated GHG emissions in Latin America [25]. A reduction in feed N may also substantially decrease substantial N losses through reduced total N excretions and potential losses in the subsequent management chain due to lower N concentrations in the manure [26].

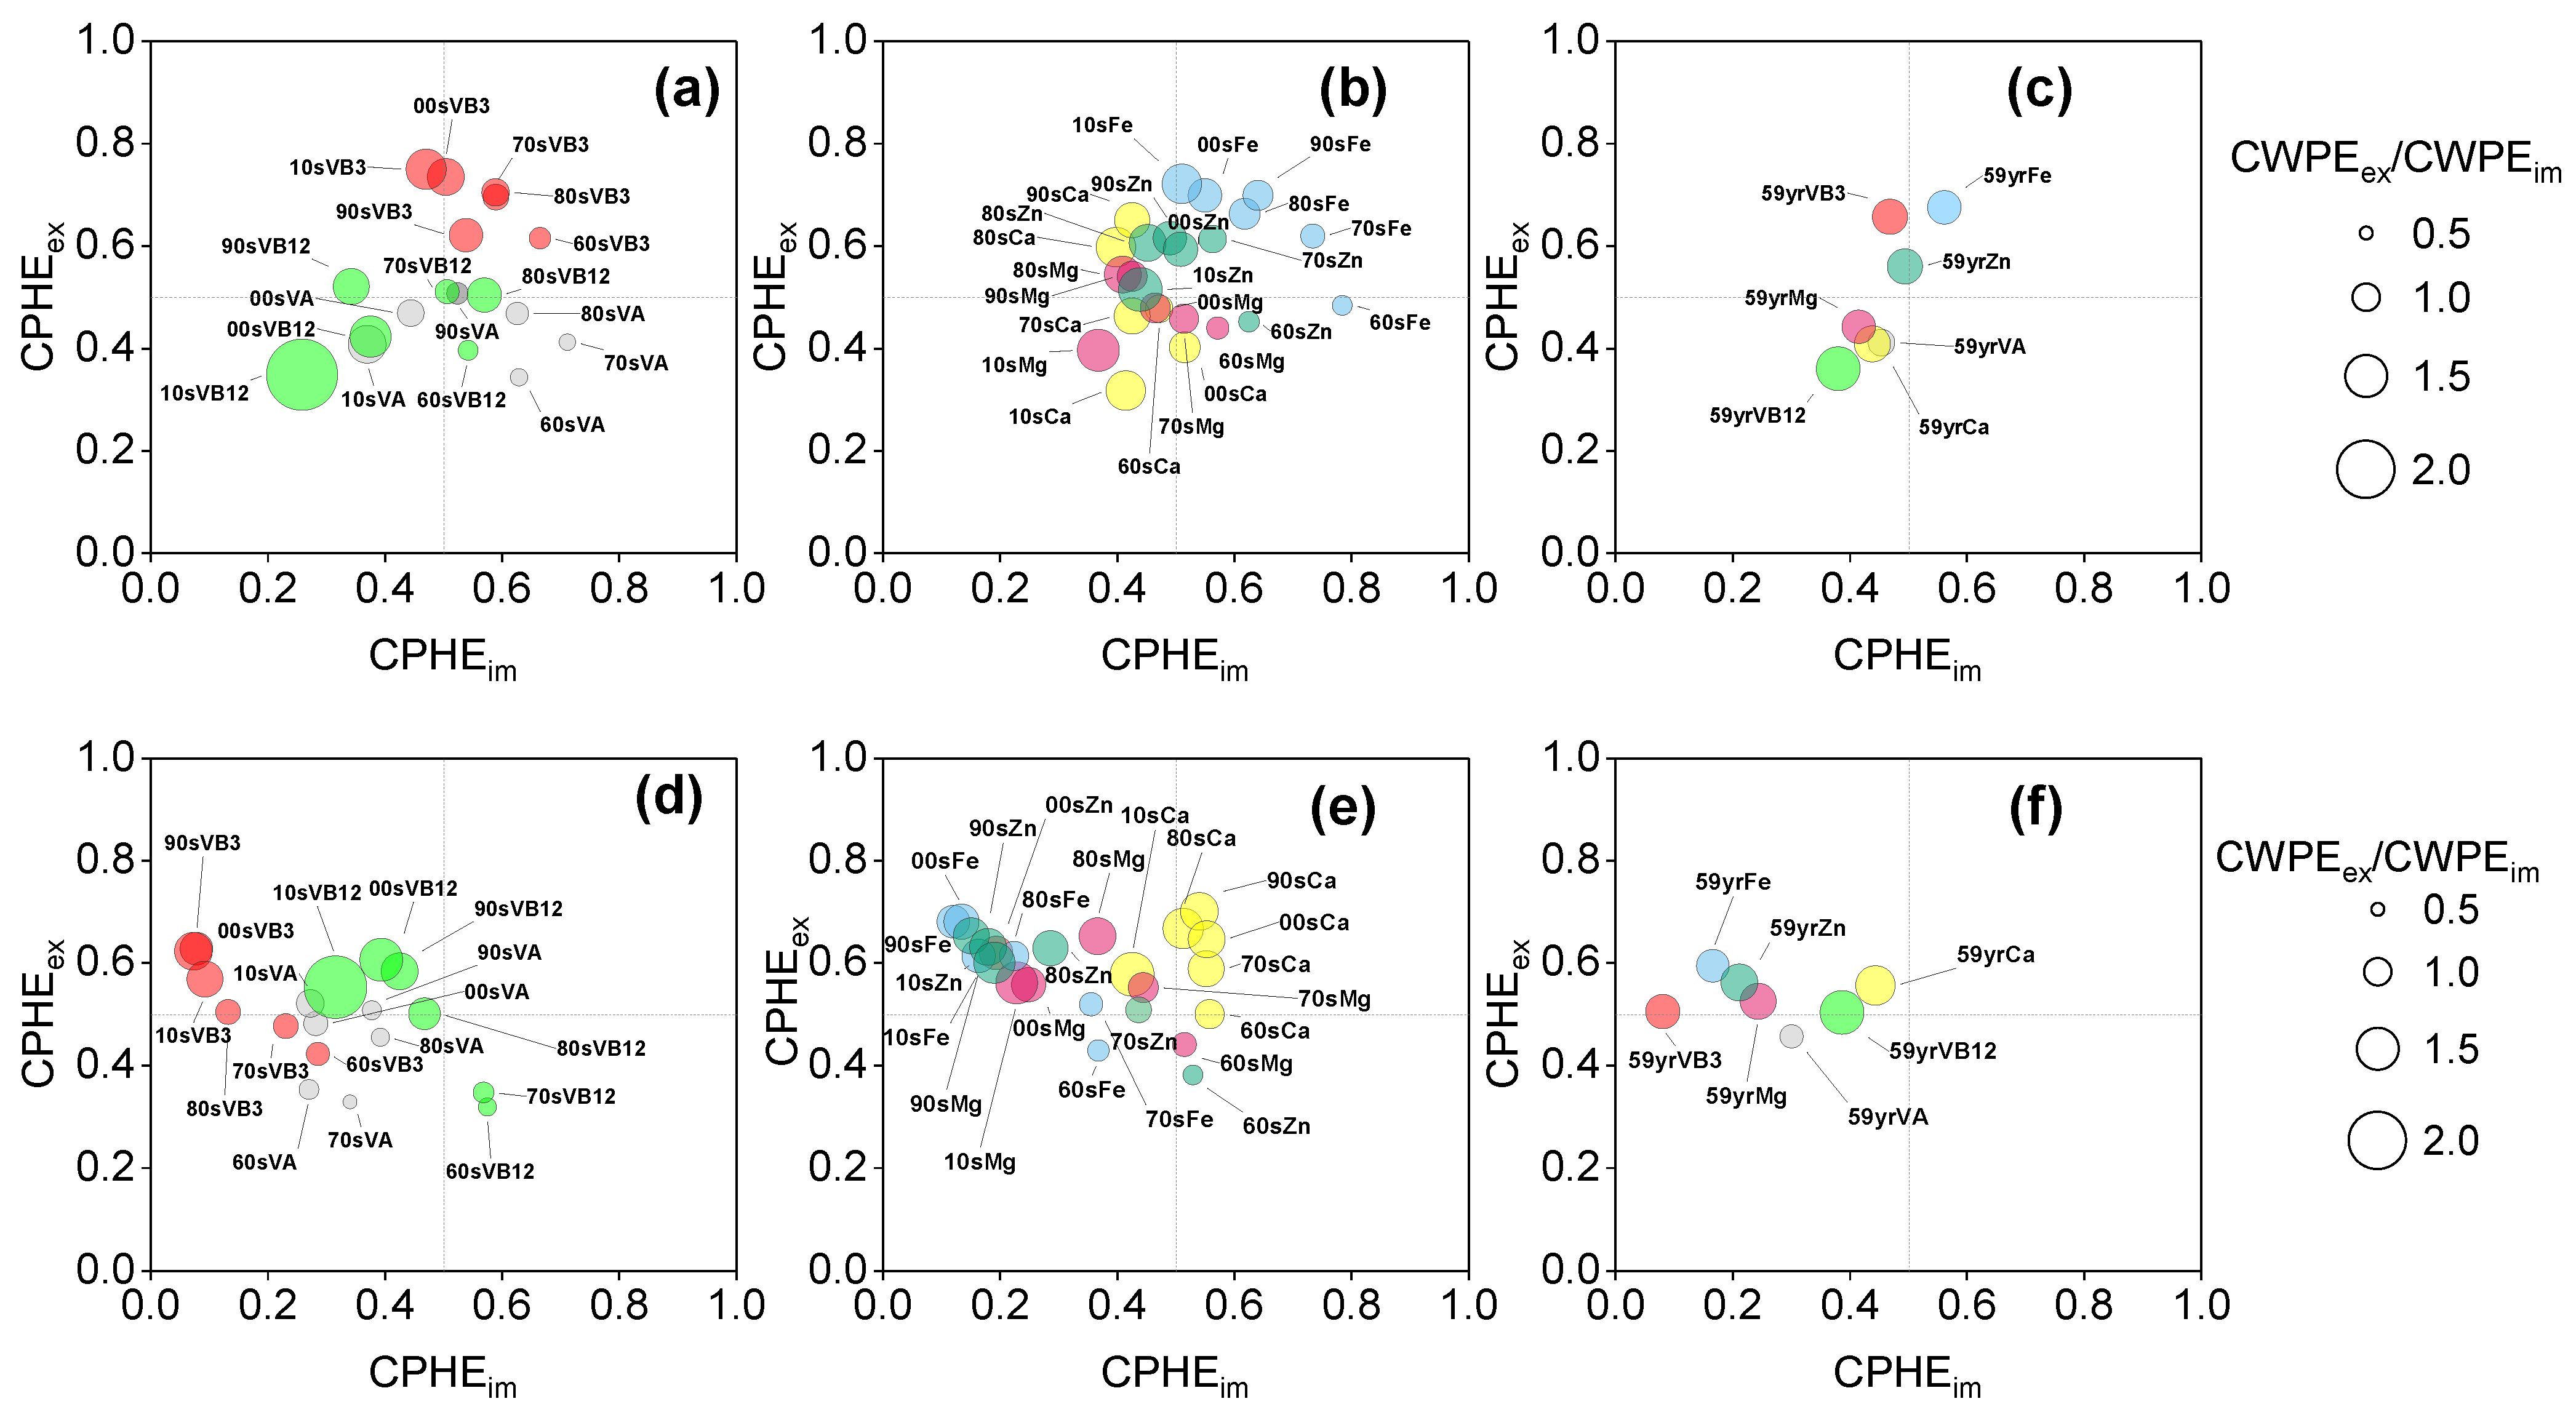
3.5. Changes in Trade Optimality and Functionality

Over the past 59 years, the trade of livestock products has been optimal for all micro-nutrients in terms of livestock productivity per LSU and partial factor productivity of feed N, except for vitamin A (Figure 7c,f). The optimality of the trade has increased over the past six decades for all seven selected micro-nutrients, as reflected by the enlarged CWPEex/CWPEim ratio (Figures S2–S15) and the increasing potential reduction in livestock units and feed N (Figure 6). This increase in trade optimality, based on protein and calorie productivity, has also been reported in previous studies (Bai et al., 2021a, 2023) [19,20]. This trend is attributed to the intensification of livestock production, resulting in higher productivity in exporting countries compared to importing countries, which is a common outcome of globalization. Additionally, the optimality, determined by the CWPEex/CWPEim ratio, generally decreased in the order of VB12, Ca, VB3, Zn, Mg, Fe, and VA over the period from 1961 to 2019 (Figure 7c,f).
The trade of livestock products in terms of VB3 and Zn production per LSU was located in Quadrant I, indicating that it was more functional than other micro-nutrients over the past 59 years (Figure 7f). This suggests that over 50% of livestock products were exported by countries with high VB3 and Zn productivity, while over 50% of the products were imported by countries with low VB3 and Zn productivity, representing an ideal scenario for international trade. Trade functionality for all micro-nutrients, when productivity was based on per feed N input, was located in Quadrant I over the past 59 years, except for vitamin A, which was in Quadrant VII. The partial factor productivity of feed N for iron production was more functional among all seven micro-nutrients in recent years, as it was closer to the top-left corner—the direction indicating higher functionality.
In general, the trade of livestock products has become more functional over the past six decades for all seven micro-nutrients, both in terms of livestock units and feed N-based productivity, although slight differences were observed between different nutrients. The trade of livestock products in terms of VB3 production per LSU in the 2010s, and in terms of VB3 and Fe production per feed N input in the 1990s and 2000s, was more functional than other nutrients and decades, as they were closer to the top-left of the quadrants (Figure 7).
A similar increase in trade optimality has also been observed when the productivity of livestock production was estimated using the partial factor productivity of feed N [19] and feed phosphorus [20] in the past six decades. This trend is mainly due to the more intensive management of livestock production in net exporting countries, such as the USA, the Netherlands, and Brazil [21], which usually have higher livestock productivity compared with net importing countries [27]. However, there are increasing concerns about environmental pollution due to intense livestock production in these countries. For example, farmers in the Netherlands are protesting a Dutch high court decision that suspended permits for the expansion of livestock production that pollutes the atmosphere with N compounds and harms nature reserves [28]. A similar rapid increase in ammonia emissions from livestock production in Brazil was observed between 1980 and 2018 [29].

3.6. Future Implications

The trade of livestock products has potentially increased the productivity of micro-nutrients per LSU and feed N input, especially in recent decades. A potential reduction in livestock populations through the trade of livestock products is relatively large compared to current levels, while a relatively lower reduction in feed N is also observed. These changes have all contributed to mitigating GHG emissions and N losses related to livestock production. However, there is increasing debate about international trade in the post-pandemic world. Many countries are advocating for promoting domestic production over imports to ensure stable supply chains. As a result, the trade of livestock products, including meat, milk, and eggs, has remained at levels comparable to the past five years (Figure S1). We propose the continuation and potential increase in international trade in livestock products. This approach would increase the global supply of the micro-nutrient at a lower cost.
In addition, the net import of livestock products directly contributes to the improvement of diet micro-nutrient intake levels in net importing countries. For example, China imported 10 Tg of fresh milk and 2.0 Tg of beef recently [21], accounting for 10% of VA intake from animal-based food (Figure S15). The extensive trade of livestock products can facilitate the improvement of micro-nutrient supply in developing countries. For example, in countries such as Congo, Egypt, Philippines, Lao, and Viet Nam, imported livestock products contribute 10–90% of micro-nutrient consumption (Figure S15). The trade of livestock products may even help improve micro-nutrient supply in developed countries, such as the United Kingdom, Singapore, and Japan, which experience a lower deficiency in micro-nutrients compared with African countries [30] (Figure S15).
To promote free trade in livestock products, the tariffs on livestock products could be removed or reduced. There are already several free trade agreements in place between countries, such as the RCEP [31], which help keep a more efficient supply of micro-nutrients. In addition, trading livestock products may help maintain lower food prices in importing countries. For example, China imported large amounts of pork, beef, and lamb during the African Swine Fever outbreak, which wiped out 20% of China’s pig population and greatly increased the consumer price index (CPI) [32]. The subsequent importation of livestock products helped alleviate the rapid CPI increase in China [32]. The structure of trade could be further improved to increase trade optimality and functionality. Some studies have suggested that the trade of red meat has exacerbated dietary risks in importing countries and is associated with an increase of 0.15 million deaths [33]. In contrast, increasing the production and trade of eggs, vegetables, and root crops could help close the nutrient gap with lower GHG emissions in most countries [34]. Trade in dairy products not only aids in improving child stunting [35] but also reduces GHG emissions [36]. Therefore, the trade in livestock products could be directed toward dairy products and eggs by reducing tariffs on these items and increasing tariffs on red meat. This shift could further increase livestock productivity or feed N use efficiency in exporting countries. Such a strategy could reduce the environmental impacts of livestock production globally, due to the high productivity and N-use efficiency of dairy cattle and laying hens [27,37,38]. In addition, the decoupling of crop and livestock production, due to the enlarged international trade of livestock products, also requires to be properly managed to avoid additional environmental pollution in the net exporting countries [39].

Limitations

The varying concentrations of calories and protein in different traded products have resulted in different effects of trade on land use efficiency. The micro-nutrient concentration in different livestock products may also impact the results. In this study, the micro-nutrient data for different products were mainly derived from three studies, which covered major types of livestock products (Table S1). However, there are still uncertainties due to the lack of comprehensive studies. The potential reduction in livestock population and feed N may be possibly overestimated since we assumed net importing countries have the capability to produce products they import. However, these countries may confront physical limitations in cropland, water, and investment capacity in producing imported livestock products. Therefore, we use the term “potential reduction” to express the maximum impacts through trade.

4. Conclusions

The present study, employing an innovative analytical framework, has delineated the global impact of livestock trade on the productivity of micro-nutrients derived from livestock over the past six decades. The findings indicate a significant enhancement in micro-nutrient productivity, except for vitamin A, attributable to international trade. The 2010s were particularly pivotal for achieving optimal and functional trade, characterized by the most substantial decrease in LSU and feed N use. These reductions, if realized, could lead to a significant decrease in GHG emissions and N losses associated with livestock production, thereby contributing to environmental sustainability. This study advocates for the continuation and potential expansion of international trade in livestock products, with a strategic emphasis on optimizing the trade structure. This study highlights the importance of a nuanced approach to global livestock trade that balances nutritional requirements with environmental sustainability and economic feasibility.

Supplementary Materials

The following supporting information can be downloaded at: https://www.mdpi.com/article/10.3390/agriculture14060861/s1; Figure S1: Exportation of meat, milk and eggs at the global level from 1961 to 2022 (FAO, 2024); Figure S2: Changes of the concentration of trade by high efficiency countries, and changes of the concentration corrected weighted production efficiency (CWPE) in exporting (CWPEex) and importing countries (CWPEim). Based on livestock productivity per livestock unit expressed as vitamin (VA) production in 1960s, 1970s, 1980s, 1990s, 2000s and 2010s; Figure S3: Changes of the concentration of trade by high efficiency countries, and changes of the concentration corrected weighted production efficiency (CWPE) in exporting (CWPEex) and importing countries (CWPEim). Based on livestock productivity per livestock unit expressed as VB3 production in 1960s, 1970s, 1980s, 1990s, 2000s and 2010s; Figure S4: Changes of the concentration of trade by high efficiency countries, and changes of the concentration corrected weighted production efficiency (CWPE) in exporting (CWPEex) and importing countries (CWPEim). Based on livestock productivity per livestock unit expressed as VB12 production in 1960s, 1970s, 1980s, 1990s, 2000s and 2010s; Figure S5: Changes of the concentration of trade by high efficiency countries, and changes of the concentration corrected weighted production efficiency (CWPE) in exporting (CWPEex) and importing countries (CWPEim). Based on livestock productivity per livestock unit expressed as calcium (Ca) production in 1960s, 1970s, 1980s, 1990s, 2000s and 2010s; Figure S6: Changes of the concentration of trade by high efficiency countries, and changes of the concentration corrected weighted production efficiency (CWPE) in exporting (CWPEex) and importing countries (CWPEim). Based on livestock productivity per livestock unit expressed as magnesium (Mg) production in 1960s, 1970s, 1980s, 1990s, 2000s and 2010s; Figure S7: Changes of the concentration of trade by high efficiency countries, and changes of the concentration corrected weighted production efficiency (CWPE) in exporting (CWPEex) and importing countries (CWPEim). Based on livestock productivity per livestock unit expressed as iron (Fe) production in 1960s, 1970s, 1980s, 1990s, 2000s and 2010s; Figure S8: Changes of the concentration of trade by high efficiency countries, and changes of the concentration corrected weighted production efficiency (CWPE) in exporting (CWPEex) and importing countries (CWPEim). Based on livestock productivity per livestock unit expressed as zinc (Zn) production in 1960s, 1970s, 1980s, 1990s, 2000s and 2010s; Figure S9: Changes of the concentration of trade by high efficiency countries, and changes of the concentration corrected weighted production efficiency (CWPE) in exporting (CWPEex) and importing countries (CWPEim). Based on partial factor of feed nitrogen (N) productivity of livestock production expressed as vitamin (VA) production in 1960s, 1970s, 1980s, 1990s, 2000s and 2010s; Figure S10: Changes of the concentration of trade by high efficiency countries, and changes of the concentration corrected weighted production efficiency (CWPE) in exporting (CWPEex) and importing countries (CWPEim). Based on partial factor of feed nitrogen (N) productivity of livestock production expressed as VB13 production in 1960s, 1970s, 1980s, 1990s, 2000s and 2010s; Figure S11: Changes of the concentration of trade by high efficiency countries, and changes of the concentration corrected weighted production efficiency (CWPE) in exporting (CWPEex) and importing countries (CWPEim). Based on partial factor of feed nitrogen (N) productivity of livestock production expressed as VB12 production in 1960s, 1970s, 1980s, 1990s, 2000s and 2010s; Figure S12: Changes of the concentration of trade by high efficiency countries, and changes of the concentration corrected weighted production efficiency (CWPE) in exporting (CWPEex) and importing countries (CWPEim). Based on partial factor of feed nitrogen (N) productivity of livestock production expressed as calcium (Ca) production in 1960s, 1970s, 1980s, 1990s, 2000s and 2010s; Figure S13: Changes of the concentration of trade by high efficiency countries, and changes of the concentration corrected weighted production efficiency (CWPE) in exporting (CWPEex) and importing countries (CWPEim). Based on partial factor of feed nitrogen (N) productivity of livestock production expressed as magnesium (Mg) production in 1960s, 1970s, 1980s, 1990s, 2000s and 2010s; Figure S14: Changes of the concentration of trade by high efficiency countries, and changes of the concentration corrected weighted production efficiency (CWPE) in exporting (CWPEex) and importing countries (CWPEim). Based on partial factor of feed nitrogen (N) productivity of livestock production expressed as iron (Fe) production in 1960s, 1970s, 1980s, 1990s, 2000s and 2010s; Figure S15: Changes of the concentration of trade by high efficiency countries, and changes of the concentration corrected weighted production efficiency (CWPE) in exporting (CWPEex) and importing countries (CWPEim). Based on partial factor of feed nitrogen (N) productivity of livestock production expressed as zinc (Zn) production in 1960s, 1970s, 1980s, 1990s, 2000s and 2010s; Table S1: The micro-nutrient contents of different traded livestock products.

Author Contributions

X.L., L.L. and Z.B. conceived the study and drafted the manuscript. Q.L. and L.L. conducted the analytical methodology and data compilation. All authors have read and agreed to the published version of the manuscript.

Funding

This work was supported by the National Natural Science Foundation of China (31972517; T2222016) and the Hebei Meat Poultry Innovation Team of Hebei Agriculture Research System HBCT2024270203.

Data Availability Statement

All the data about livestock production and trade of livestock products can be found either from FAOSTAT (2022) [21] or Bai et al. (2023) [20].

Acknowledgments

We thanked Luo Jiafa for his constructive recommends.

Conflicts of Interest

The authors declare no competing interests.

References

  1. Malnutrition Data (UNICEF, WHO & World Bank, 2021). Available online: https://data.unicef.org/resources/dataset/malnutrition-data/ (accessed on 29 April 2024).
  2. Swinburn, B.A.; Kraak, V.I.; Allender, S.; Atkins, V.J.; Baker, P.I.; Bogard, J.R.; Brinsden, H.; Calvillo, A.; De Schutter, O.; Devarajan, R.; et al. The global syndemic of obesity, undernutrition, and climate change: The Lancet Commission report. Lancet 2019, 393, 791–846. [Google Scholar] [CrossRef]
  3. Caulfield, L.E.; Richard, S.A.; Rivera, J.A.; Musgrove, P.; Black, R.E. Stunting, wasting, and micronutrient deficiency disorders. In Disease Control Priorities in Developing Countries; Jamison, D.T., Breman, J.G., Measham, A.R., Alleyne, G., Claeson, M., Evans, D.B., Jha, P., Mills, A., Musgrove, P., Eds.; Ch. 28; The International Bank for Reconstruction and Development/The World Bank & Oxford University Press: Washington, DC, USA, 2006. [Google Scholar]
  4. Wang, X.; Dou, Z.; Feng, S.; Zhang, Y.; Ma, L.; Zou, C.; Bai, Z.; Lakshmanan, P.; Shi, X.; Liu, D.; et al. Global food nutrients analysis reveals alarming gaps and daunting challenges. Nat. Food 2023, 4, 1007–1017. [Google Scholar] [CrossRef]
  5. Dror, D.K.; Lindsay, A. The importance of milk and other animal-source foods for children in low-income countries. Food Nutr. Bull. 2011, 32, 227–243. [Google Scholar] [CrossRef]
  6. Headey, D.; Hirvonen, K.; Hoddinott, J. Animal sourced foods and child stunting. Am. J. Agric. Econ. 2018, 100, 1302–1319. [Google Scholar] [CrossRef] [PubMed]
  7. Zaharia, S.; Ghosh, S.; Shrestha, R.; Manohar, S.; Thorne-Lyman, A.L.; Bashaasha, B.; Kabunga, N.; Gurung, S.; Namirembe, G.; Appel, K.H.; et al. Sustained intake of animal-sourced foods is associated with less stunting in young children. Nat. Food 2021, 2, 246–254. [Google Scholar] [CrossRef]
  8. Pimpin, L.; Kranz, S.; Liu, E.; Shulkin, M.; Karageorgou, D.; Miller, V.; Fawzi, W.; Duggan, C.; Webb, P.; Mozaffarian, D. Effects of animal protein supplementation of mothers, preterm infants, and term infants on growth outcomes in childhood: A systematic review and meta-analysis of randomized trials. Am. J. Clin. Nutr. 2019, 110, 410–429. [Google Scholar] [CrossRef] [PubMed]
  9. Chungchunlam, S.M.S.; Moughan, P.J.; Garrick, D.P.; Drewnowski, A. Animal-sourced foods are required for minimum-cost nutritionally adequate food patterns for the United States. Nat. Food 2020, 1, 376–381. [Google Scholar] [CrossRef]
  10. Mottet, A.; Haan, C.; Falcucci, A.; Tempio, G.; Opio, C.; Gerber, P. Livestock: On our plates or eating at our table? A new analysis of the feed/food debate. Glob. Food Secur. 2017, 1, 1–8. [Google Scholar] [CrossRef]
  11. Webb, J.; Menzi, H.; Misselbrook, T.H.; Dämmgen, U.; Hendriks, H.; Döhler, H. Managing ammonia emissions from livestock production in Europe. Environ. Pollut. 2005, 135, 399–406. [Google Scholar] [CrossRef]
  12. Bai, Z.; Ma, L.; Jin, S.; Ma, W.; Velthof, G.; Oenema, O.; Liu, L.; Chadwick, D.; Zhang, F. Nitrogen, phosphorus, and potassium flows through the manure management chain in China. Environ. Sci. Technol. 2016, 50, 13409–13418. [Google Scholar] [CrossRef]
  13. Uwizeye, A.; de Boer, I.J.; Opio, C.I.; Schulte, R.P.; Falcucci, A.; Tempio, G.; Teillard, F.; Casu, F.; Rulli, M.; Galloway, J.N.; et al. Nitrogen emissions along global livestock supply chains. Nat. Food 2020, 1, 437–446. [Google Scholar] [CrossRef]
  14. Crippa, M.; Solazzo, E.; Guizzardi, D.; Monforti-Ferrario, F.; Tubiello, F.N.; Leip, A. Food systems are responsible for a third of global anthropogenic GHG emissions. Nat. Food 2021, 2, 198–209. [Google Scholar] [CrossRef] [PubMed]
  15. Xu, X.; Sharma, P.; Shu, S.; Lin, T.; Ciais, P.; Tubiello, F.N.; Smith, P.; Campbell, N.; Jain, A.K. Global greenhouse gas emissions from animal-based foods are twice those of plant-based foods. Nat. Food 2021, 2, 724–732. [Google Scholar] [CrossRef] [PubMed]
  16. Liu, K.; Ma, R.; Yan, K.; Zhang, B.; Xu, S.; Feng, C. Tracing global N2O emission mitigation strategies through trade networks. J. Environ. Manag. 2023, 344, 118455. [Google Scholar] [CrossRef] [PubMed]
  17. Wang, X.; Qiang, W.; Liu, X.; Yan, S.; Qi, Y.; Jia, Z.; Liu, G. The spatiotemporal patterns and network characteristics of emissions embodied in the international trade of livestock products. J. Environ. Manag. 2022, 322, 116128. [Google Scholar] [CrossRef] [PubMed]
  18. Liu, B.; Feng, K.; Sun, L.; Baiocchi, G. Does interstate trade of agricultural products in the US alleviate land and water stress? J. Environ. Manag. 2024, 354, 120427. [Google Scholar] [CrossRef]
  19. Bai, Z.; Ma, W.; Zhao, H.; Guo, M.; Oenema, O.; Smith, P.; Velthof, G.; Liu, X.; Hu, C.; Wang, P.; et al. Food and feed trade has greatly impacted global land and nitrogen use efficiencies over 1961–2017. Nat. Food 2021, 2, 780–791. [Google Scholar] [CrossRef]
  20. Bai, Z.; Liu, L.; Obersteiner, M.; Mosnier, A.; Chen, X.; Yuan, Z.; Ma, L. Agricultural trade impacts global phosphorus use and partial productivity. Nat. Food 2023, 4, 762–773. [Google Scholar] [CrossRef]
  21. Food and Agriculture Organization of the United Nations (FAO). Available online: https://www.fao.org/faostat/en/#data/domains_table (accessed on 29 April 2024).
  22. Yang, Y. China Food Composition Tables, 6th ed.; Peking University Medical Press: Beijing, China, 2019; pp. 2–307. (In Chinese) [Google Scholar]
  23. USDA (U.S. Department of Agriculture). 2023. Available online: https://fdc.nal.usda.gov/fdc-app.html#/?query=Asparagus (accessed on 29 April 2024).
  24. Liu, Q.; Wang, J.; Bai, Z.; Ma, L.; Oenema, O. Global animal production and nitrogen and phosphorus flows. Soil Res. 2017, 55, 451–462. [Google Scholar] [CrossRef]
  25. Castanheira, É.G.; Freire, F. Greenhouse gas assessment of soybean production: Implications of land use change and different cultivation systems. J. Clean. Prod. 2013, 54, 49–60. [Google Scholar] [CrossRef]
  26. Hou, Y.; Velthof, G.; Oenema, O. Mitigation of ammonia, nitrous oxide and methane emissions from manure management chains: A meta-analysis and integrated assessment. Glob. Chang. Biol. 2015, 21, 1293–1312. [Google Scholar] [CrossRef]
  27. Herrero, M.; Havlík, P.; Valin, H.; Obersteiner, M. Biomass use, production, feed efficiencies, and greenhouse gas emissions from global livestock systems. Proc. Natl. Acad. Sci. USA 2013, 110, 20888–20893. [Google Scholar] [CrossRef]
  28. Stokstad, E. Nitrogen crisis threatens Dutch environment—And economy. Science 2019, 366, 1180–1181. [Google Scholar] [CrossRef] [PubMed]
  29. Liu, L. Exploring global changes in agricultural ammonia emissions and their contribution to nitrogen deposition since 1980. Proc. Natl. Acad. Sci. USA 2022, 119, e2121998119. [Google Scholar] [CrossRef]
  30. Poppy, G.M.; Baverstock-Poppy, J.; Baverstock, J. Trade and dietary preferences can determine micronutrient security in the United Kingdom. Nat. Food 2022, 3, 512–522. [Google Scholar] [CrossRef] [PubMed]
  31. Wilson, J.D. Mega-regional trade deals in the Asia-Pacific: Choosing between the TPP and RCEP? J. Contemp. Asia 2015, 45, 345–353. [Google Scholar] [CrossRef]
  32. Bai, Z.; Jin, X.; Oemema, O.; Lee, M.; Zhao, J.; Ma, L. Impacts of African swine fever on water quality in China. Environ. Res. Lett. 2021, 16, 054032. [Google Scholar] [CrossRef]
  33. Springmann, M.; Kennard, H.; Dalin, C.; Freund, F. International food trade contributes to dietary risks and mortality at global, regional and national levels. Nat. Food 2023, 4, 886–893. [Google Scholar] [CrossRef] [PubMed]
  34. Geyik, Ö.; Hadjikakou, M.; Bryan, B. Publisher Correction: Climate-friendly and nutrition-sensitive interventions can close the global dietary nutrient gap while reducing GHG emission. Nat. Food 2023, 4, 126. [Google Scholar] [CrossRef]
  35. Liu, X.; Liang, Y.; Chen, K. Dairy trade liberalization and child stunting: Evidence from low-and middle-income countries. Food Policy 2024, 122, 102554. [Google Scholar] [CrossRef]
  36. Wu, Y.; Mao, X.; Lu, J.; Wang, M.; Zhang, Q.; Song, P.; Liu, Z.; Gong, W. Dairy Trade Helps to Alleviate Global Carbon Emission Pressure. Environ. Sci. Technol. 2022, 56, 12656–12666. [Google Scholar] [CrossRef] [PubMed]
  37. Peters, C.J.; Picardy, J.; Darrouzet-Nardi, A.; Griffin, T. Feed conversions, ration compositions, and land use efficiencies of major livestock products in US agricultural systems. Agric. Syst. 2014, 130, 35–43. [Google Scholar] [CrossRef]
  38. Leip, A.; Billen, G.; Garnier, J.; Grizzetti, B.; Lassaletta, L.; Reis, S.; Simpson, D.; Sutton, M.A.; De Vries, W.; Weiss, F.; et al. Impacts of European livestock production: Nitrogen, sulphur, phosphorus and greenhouse gas emissions, land-use, water eutrophication and biodiversity. Environ. Res. Lett. 2015, 10, 115004. [Google Scholar] [CrossRef]
  39. Lassaletta, L.; Billen, G.; Grizzetti, B.; Garnier, J.; Leach, A.; Galloway, J. Food and feed trade as a driver in the global nitrogen cycle: 50-year trends. Biogeochemistry 2014, 118, 225–241. [Google Scholar] [CrossRef]
Figure 1. The illustration of the cumulative distribution curve used to determine the concentration of production in high-efficiency countries (CPHE, equal to the area of A/(A + B) (a), and illustration of the theory of trade optimality (b) and trade functionality (c), with the curve and theory derived from Bai et al. (2021a) [19].
Agriculture 14 00861 g001
Figure 2. Net trade of livestock products and its impact on micro-nutrient productivity per livestock standard unit (LSU) from 1961 to 2019. Note: The figure illustrates the concentration-weighted production efficiency (CWPE) ratio between exporting (CWPEex) and importing (CWPEim) countries for seven key micro-nutrients, highlighting the exceptions for vitamin A.
Agriculture 14 00861 g002
Figure 3. Net trade of livestock products and its impact on micro-nutrient productivity per kilogram of feed nitrogen input from 1961 to 2019. Note: CWPE is the weighted production efficiency, applied to importing and exporting countries (CWPEim and CWPEex; the unit of CWPE depends on the unit of the x-axis of each sub-figure).
Agriculture 14 00861 g003
Figure 4. Cumulative potential changes in livestock standard units (LSU) (a) and feed nitrogen (N) (b) through international trade of livestock products from 1961 to 2019. Note: Positive values correspond to recuing and negative values correspond to an increase in livestock units and nitrogen in feed, respectively.
Agriculture 14 00861 g004
Figure 5. Potential reduction or increase in livestock units through trade in different decades for calcium Ca, (a), magnesium Mg, (b), iron Fe, (c), zinc Zn, (d), vitamin A VA, (e), VB3 (f), and VB 12 (g). Note: The x-axis refers to 1960s (60s), 1970s (70s), 1980s (80s), 1990s (90s), 2000s (00s) and 2010s (10s).
Agriculture 14 00861 g005
Figure 6. Potential of reducing or increasing feed nitrogen (N) through trade in different decades for calcium (Ca, a), magnesium (Mg, b), iron (Fe, c), zinc (Zn, d), vitamin A (VA, e), VB3 (f), and VB12 (g). Note: The x-axis refers to 1960s (60s), 1970s (70s), 1980s (80s), 1990s (90s), 2000s (00s), and 2010s (10s).
Agriculture 14 00861 g006
Figure 7. The trade functionality and optimality in terms of livestock productivity (upper panel) and partial factor productivity of feed nitrogen (N) (bottom panel) for vitamin A (VA), VB3, and VB12 (a,d), and for calcium (Ca), magnesium (Mg), iron (Fe), and zinc (Zn) (b,e) in the 1960s (60s), 1970s (70s), 1980s (80s), 1990s (90s), 2000s (00s), and 2010s (10s), and for all micro-nutrients over the 59 years (59yr) from 1961 to 2019 (c,f). Note: CPHE is the concentration of export or import by the high-efficiency exporting or importing countries, respectively. They are dimensionless, with values ranging between 0 and 1.0. The size of the circles represents CWPEex/CWPEim. The red solid dots represent positive trade optimality (levels I–IV; that is, CWPEex/CWPEim ≥ 1.0); the blue solid dots represent negative trade optimality (levels V–VIII; that is, CWPEex/CWPEim < 1.0). Different colors represent different micro-nutrients.
Agriculture 14 00861 g007
Disclaimer/Publisher’s Note: The statements, opinions and data contained in all publications are solely those of the individual author(s) and contributor(s) and not of MDPI and/or the editor(s). MDPI and/or the editor(s) disclaim responsibility for any injury to people or property resulting from any ideas, methods, instructions or products referred to in the content.

