Article

Genetic Association of APOA5 and AKT3 Genes with Milk Production Traits in Chinese Holstein Cows

1
Department of Animal Genetics and Breeding, College of Animal Science and Technology, Key Laboratory of Animal Genetics, National Engineering Laboratory for Animal Breeding, State Key Laboratory of Animal Biotech Breeding, China Agricultural University, Breeding and Reproduction of Ministry of Agriculture and Rural Affairs, Beijing 100193, China
2
Inner Mongolia Academy of Agricultural and Animal Husbandry Sciences, Hohhot 010031, China
3
Inner Mongolia SK Xing Animal Breeding and Breeding Biotechnology Research Institute Co., Ltd., Hohhot 011517, China
4
Inner Mongolia XuYi Animal Husbandry Co., Ltd., Bayannur 015000, China
*
Author to whom correspondence should be addressed.
Agriculture 2024, 14(6), 869; https://doi.org/10.3390/agriculture14060869
Submission received: 18 April 2024 / Revised: 24 May 2024 / Accepted: 29 May 2024 / Published: 30 May 2024
(This article belongs to the Section Farm Animal Production)

Abstract

:
Genome selection (GS) technology is an important means to improve the genetic improvement of dairy cows, and the mining and application of functional genes and loci for important traits is one of the important bases for accelerating genetic improvement. Our previous study found that the apolipoprotein A5 (APOA5) and AKT serine/threonine kinase 3 (AKT3) genes were differentially expressed in the liver tissue of Chinese Holstein cows at different lactation stages and influenced milk component synthesis and metabolism, so we considered these two genes as the candidates affecting milk production traits. In this study, we found in total six single nucleotide polymorphisms (SNPs), three in APOA5 and three in AKT3. Subsequent association analysis showed that the six SNPs were significantly associated with milk yield, fat yield, protein yield, or fat percentage (p ≤ 0.05). Three SNPs in APOA5 formed a haplotype block, which was found to be significantly associated with milk yield, fat yield, and protein yield (p ≤ 0.05). In addition, four SNPs were proposed to be functional mutations affecting the milk production phenotype, of which three, 15:g.27446527C>T and 15:g.27447741A>G in APOA5 and 16:g.33367767T>C in AKT3, might change the transcription factor binding sites (TFBSs), and one is a missense mutation, 15:g.27445825T>C in APOA5, which could alter the secondary structure and stability of mRNA and protein. In summary, we demonstrated the genetic effects of APOA5 and AKT3 on milk production traits, and the valuable SNPs could be used as available genetic markers for dairy cattle’s GS.

1. Introduction

Milk is a naturally nutritious food that can provide a plethora of essential nutrients including high-quality proteins, fats, carbohydrates (lactose), minerals, trace elements, and vitamins for the human diet [1,2]. Beyond its nutritional value, mounting evidence suggests that milk may confer numerous health-related benefits; these include its potential roles in preventing cardiovascular diseases, cancers, obesity, and diabetes, among others [3,4,5,6]. With the improvement of economic levels and awareness of nutrition and health, milk consumption will undoubtedly continue to increase, so it is crucial to enhance milk production and its nutritional content.
In recent years, researchers have implemented multiple strategies to improve the production performance of dairy cattle. Among them, genomic selection (GS) using dense markers covering the whole genome is a strategy for the genetic improvement of livestock and has revolutionized the breeding system in dairy cattle [7,8,9]. Since 2009, GS technology has been widely used in early selective breeding of dairy cattle, which significantly shortens generation intervals and reduces breeding costs, accelerating genetic progress within the population [10,11]. Studies have shown that incorporating single nucleotide polymorphism (SNP) information from functional genes with significant genetic effects on the target traits into chip marker data can enhance the accuracy of genomic estimated breeding values [12,13]. Therefore, more and more studies are dedicated to identifying functional genes and SNP loci that have a significant impact on milk production traits [14,15,16,17,18,19], with the aim of applying them to dairy cattle’s GS to improve the accuracy of milk production trait selection.
Previously, we analyzed the proteomes of liver tissue samples from three Holstein cows during the dry period and early and peak lactations and found that the apolipoprotein A5 (APOA5) and AKT serine/threonine kinase 3 (AKT3) genes exhibited differential expression across various lactation stages, and they were also involved in the pathways related to the synthesis and metabolism of milk components, so these two genes were considered to be promising candidate genes that affect milk production traits [20]. The APOA5 gene is an integral part of the regulation of plasma triglyceride levels [21,22,23] and is highly expressed in the liver of periparturient cows, regulating the synthesis and metabolism of fatty acids and lipoproteins in preparation for lactation [24,25]. AKT3 is a major nodal gene in the phosphatidylinositol 3-kinase (PI3K)/Akt pathway, which regulates cell proliferation, differentiation, apoptosis, and other biological processes by responding to extracellular signals [26,27]. It also participates in mammalian target of rapamycin (mTOR), AMP-activated protein kinase (AMPK), and insulin receptor signaling networks, which are the pathways related to the lactation of dairy cows [28]. In addition, the APOA5 gene was found to be located 0.22–2.13 Mb away from the quantitative trait loci (QTL) associated with fat yield and percentage, protein yield and percentage, and fatty acid content [29,30,31,32]. AKT3 was located near 2.03–3.33 Mb of known QTLs for milk yield and fat yield [30,33]. Therefore, we considered that the APOA5 and AKT3 genes might play important roles for milk production traits in dairy cattle.
In this study, we identified the single nucleotide polymorphisms (SNPs) of the APOA5 and AKT3 genes in a Chinese Holstein population and analyzed their genetic associations with 305-day milk yield, fat yield, fat percentage, protein yield, and protein percentage. Further, we conducted functional predictions of key mutation sites to speculate on the reasons why they affect milk production traits. The purpose of this study is to provide valuable SNP loci information for dairy cattle’s GS and gene information for the in-depth study of the mechanism related to milk production traits in dairy cattle.

2. Materials and Methods

2.1. Animals and Phenotypic Data

In this study, a total of 944 Chinese Holstein cows in the first lactation and 637 in the second lactation (307 cows had just finished the milking of first lactation) were used for association analyses. The cows were from 45 sire families and fed under the same conditions in 22 dairy farms of Beijing Sunlon Livestock Development Co., Ltd. (Beijing, China), where each sire family had 1–68 daughters, with an average of 21. Each cow had pedigree information and dairy herd improvement (DHI) records, which were provided by the Beijing Dairy Cattle Center (Beijing, China). The descriptive statistics of phenotypic values for milk production traits of the first and second lactations are presented in Table S1.

2.2. DNA Extraction and Quality Control

DNA was extracted from semen samples of the 45 sires using the salt-out procedure and from blood samples of the 944 cows with a TIANamp Blood DNA Kit (Tiangen, Beijing, China). These frozen semen and blood samples were provided by Beijing Dairy Cattle Center. Then, a NanoDrop 2000 Spectrophotometer (Thermo Scientific, Hudson, NH, USA) and gel electrophoresis were used to determine the quantity and quality of the extracted DNA, respectively.

2.3. SNP Identification and Genotyping

According to the sequences of bovine APOA5 (Gene ID: 538914) and AKT3 (Gene ID: 100137872) downloaded from GenBank (https://www.ncbi.nlm.nih.gov/genbank/, accessed on 12 January 2024), primers were designed by Primer3 (https://primer3.ut.ee/, accessed on 12 January 2024) to amplify these genes’ coding regions and 2000 bp of upstream and downstream flanking regions (Table S2). The primers were synthesized by BGI Genomics Co., Ltd. (Beijing, China). The DNA samples of the 45 bulls were used as the template for PCR amplification (Table S2), and then its products were sequenced by Sanger sequencing. After that, the potential SNPs were identified by comparing the sequences with the reference sequence (ARS-UCD1.2) through NCBI-BLAST (https://blast.ncbi.nlm.nih.gov/Blast.cgi, accessed on 12 January 2024). Subsequently, the identified SNPs were genotyped in the 944 cows using Genotyping by Target Sequencing (GBTS) technology by Boruidi Biotechnology Co., Ltd. (Shijiazhuang, China).

2.4. Association Analyses

Haploview4.2 (Broad Institute of MIT and Harvard, Cambridge, MA, USA) was utilized to estimate the extent of linkage disequilibrium (LD) between the identified SNPs, and pairwise SNP correlations were represented by R2 when R2 = 1 indicated that the SNPs were in complete linkage disequilibrium. Then, SAS 9.4 (SAS Institute Inc., Cary, NC, USA) was used to assess the association between the SNPs/haplotype blocks and milk yield and composition traits on the first and second lactations with the following animal model:
y i j k l = μ + H Y S j + b × M k + G i + a l + e i j k l
where yijkl is the phenotypic value of each trait for each cow; µ is the overall mean; HYSj is the fixed effect of the farm (1–22 for 22 farms), year (1–4 for the years 2012–2015, respectively), and season (1 for April–May; 2 for June–August; 3 for September–November; and 4 for December–March); Mk is the age of calving as a covariant; b is the regression coefficient of covariant M; Gi is the genotype or haplotype combination effect; a l is the individual random additive genetic effect, distributed as N ( 0 , A δ a 2 ) , with the additive genetic variance δ a 2 ; and eijkl is the random residual, distributed as N 0 , I δ e 2 , with identity matrix I and residual error variance δ e 2 . Multiple tests were implemented by Bonferroni correction, with the significance level equal to the original p value multiplied by the number of genotype or haplotype combinations.
In addition, the additive effect (a), dominant effect (d), and substitution effect (α) were calculated using the following formulas: a = A A B B 2 , d = A B A A + B B 2 , α = a + d ( q p ) , where AA, BB, and AB are the least squares means of the milk production traits in the corresponding genotypes, p is the frequency of allele A, and q is the frequency of allele B.

2.5. Functional Prediction of Mutation Sites

The Jaspar online website (http://jaspar.genereg.net/, accessed on 20 March 2024) was employed to predict whether SNPs in the 5′ flanking region of the APOA5 and AKT3 genes changed the transcription factor binding sites (TFBSs; relative score (RS) ≥ 0.85). To predict changes in mRNA secondary structures for missense mutation, RNAfold web server (http://rna.tbi.univie.ac.at/cgi-bin/RNAWebSuite/RNAfold.cgi, accessed on 20 March 2024) was used, with the minimum free energy (MFE) of the optimal secondary structure reflecting the stability of the mRNA structure. A lower MFE value indicates greater stability in the mRNA structure. Additionally, the impact of missense mutation on protein secondary structure, including α-helix, β-turn, extended strand, and random coil, was determined using SOPMA (https://npsa-pbil.ibcp.fr/cgi-bin/npsa_automat.pl?page=/NPSA/npsa_sopma.html, accessed on 20 March 2024). Changes in protein stability caused by mutation were predicted through SAAFEC-SEQ Web (http://compbio.clemson.edu/SAAFEC-SEQ/, accessed on 20 March 2024). The changes in ΔΔG value before and after mutation represent alterations in protein stability, where a value greater than zero indicates an increase in stability. Finally, PROVEAN (http://provean.jcvi.org/seq_submit.php, accessed on 20 March 2024) was applied to predict whether the protein function was altered before and after the mutation, and when the score was lower than −2.5, it was considered to be a harmful mutation.

3. Results

3.1. SNP Identification

We found three SNPs in the APOA5 gene and three in AKT3. In APOA5, two SNPs, 15:g.27447741A>G (rs41755770) and 15:g.27446527C>T (rs1755767), were located in the 5′ regulatory region and one SNP, 15:g.27445825T>C (rs41755766), in exon 1, a missense mutation in which, when the allele mutates from T to C, the amino acid changes from lysine (AAG) to arginine (AGG). In AKT3, 16:g.33367767T>C (rs208316642) was located in the 5′ regulatory region, 16:g.33417238C>T (rs41798799) in intron 1, and 16:g.33551706T>C (rs209739552) in intron 6 (Table 1). The genotypic and allelic frequencies of all the identified SNPs are summarized in Table 1.

3.2. Association Analyses between SNPs and Five Milk Production Traits

We analyzed the genetic associations between the six SNPs in the APOA5 and AKT3 genes and five milk production traits, including 305-day milk yield, fat yield, fat percentage, protein yield, and protein percentage (Table S3). In APOA5, 15:g.27447741A>G had significant associations with milk yield (p = 0.0025) and protein yield (p = 0.0146) in the first lactation and milk yield (p = 0.0003), fat yield (p = 0.0019), and protein yield (p = 0.0041) in the second lactation. 15:g.27446527C>T was found to be significantly associated with milk yield (p = 0.0012) and protein yield (p = 0.0108) in the first lactation and milk yield (p < 0.0001), fat yield (p < 0.0001), and protein yield (p < 0.0001) in the second lactation. 15:g.27445825T>C was significantly associated with milk yield in the first lactation (p = 0.0116) and milk yield (p < 0.0001), fat yield (p < 0.0001), and protein yield (p = 0.0030) in the second lactation.
In AKT3, 16:g.33367767T>C was significantly associated with fat yield (p = 0.0035) in the first lactation and fat yield (p < 0.0001), fat percentage (p = 0.0141), and protein yield (p = 0.0017) in the second lactation. 16:g.33417238C>T had significant associations with milk yield (p = 0.0141), fat yield (p = 0.0030), and protein yield (p = 0.0003) in the second lactation. 16:g.33551706T>C was found to be significantly associated with milk yield (p = 0.0005) and protein yield (p < 0.0001) in the second lactation. Additionally, the additive, dominant, and substitution effects of the six SNPs are shown in Table S4.
In APOA5, for 15:g.27447741A>G (Figure 1A), 15:g.27446527C>T (Figure 1B,C), and 15:g.27445825T>C (Figure 1D), we observed that the GG, TT, and CC genotypes were the dominant genotypes for milk yield or protein yield. As for the AKT3 gene, the CC genotype in 16:g.33367767T>C was the dominant genotype for fat yield (Figure 1E).

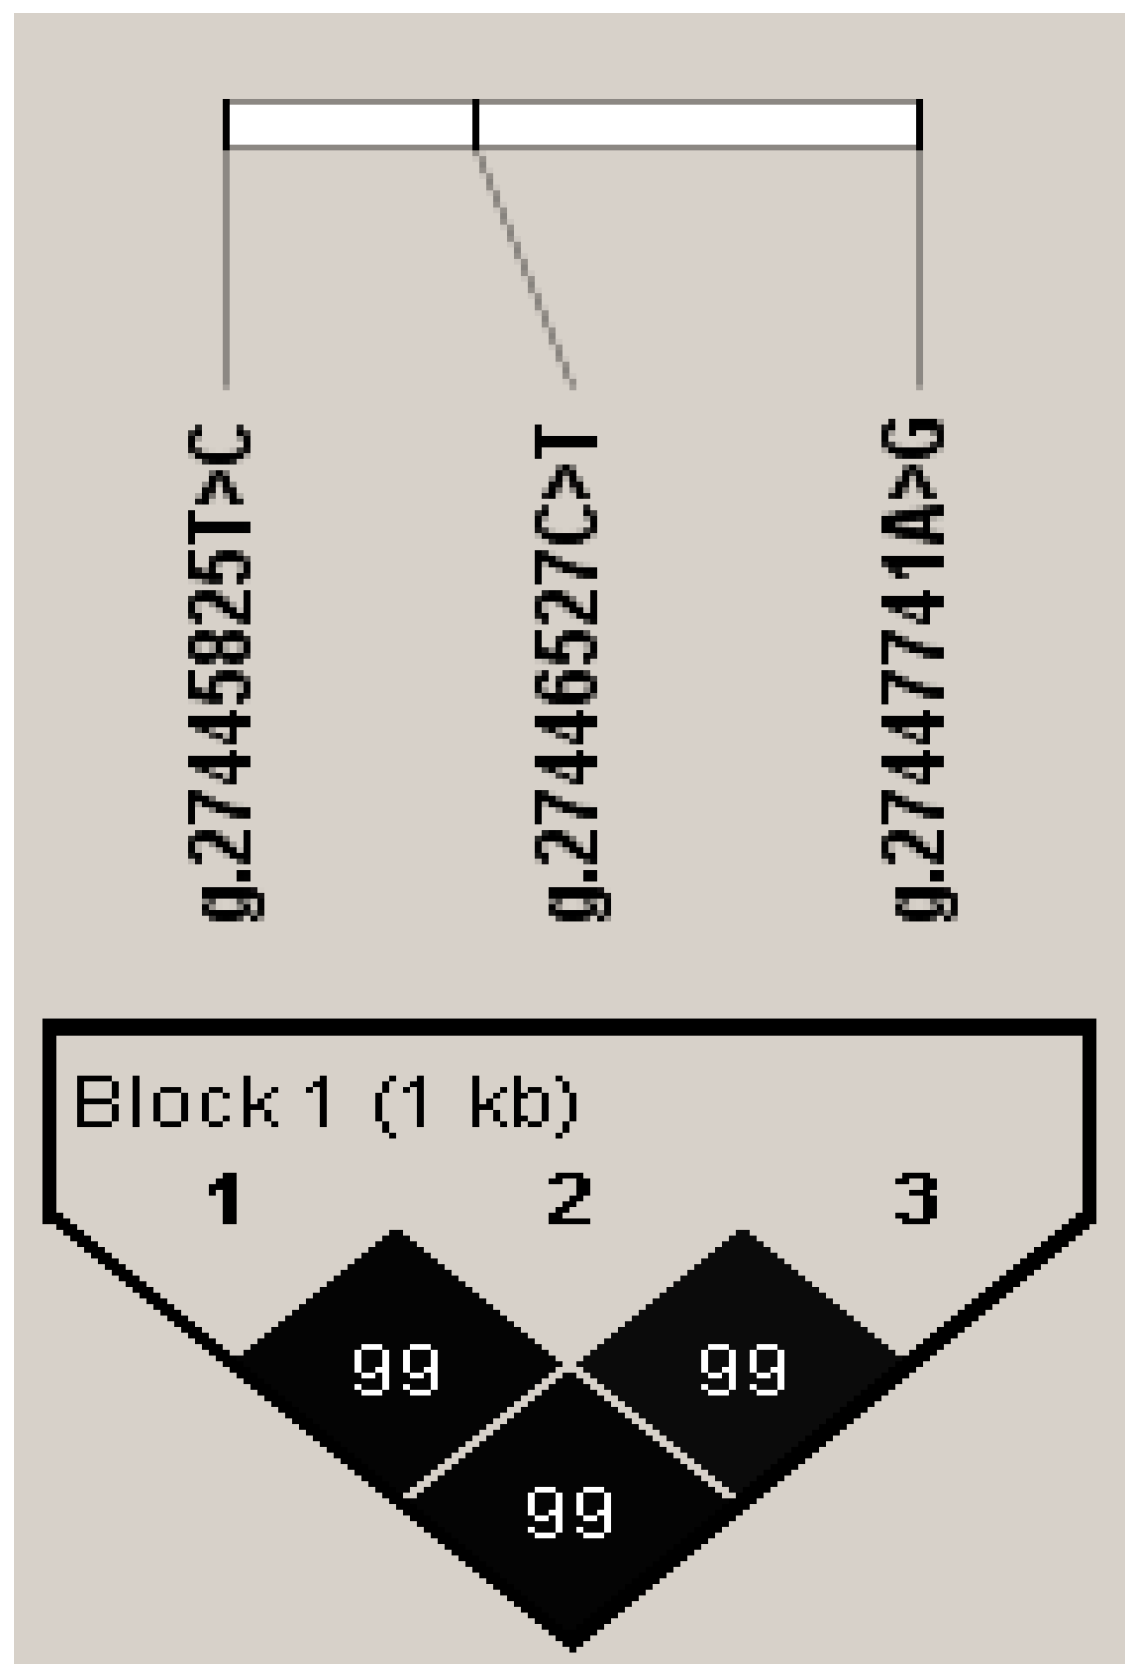
3.3. Association between Haplotype Block and Five Milk Production Traits

We estimated the degree of LD among the identified SNPs in APOA5 and AKT3 using Haploview4.2 and found that one haplotype block including three SNPs, 15:g.27447741A>G, 15:g.27446527C>T, and 15:g.27445825T>C, in the APOA5 gene was inferred (R2 = 0.99; Figure 2). In the block, the frequencies of the H1 (CTG) and H2 (TCA) haplotypes were 66.7% and 31.7%, respectively. The block was significantly associated with milk yield, fat yield, and protein yield in both lactations (p ≤ 0.05; Table 2). H1H1 was the best haplotype for milk yield, and H2H2 was the worst. However, we found no LD for the three SNPs in the AKT3 gene.

3.4. Changes in Transcription Factor Binding Sites Caused by SNPs in 5′ Region

We predicted the changes in TFBSs caused by the three SNPs, 15:g.27447741A>G, 15:g.27446527C>T, and 16:g.33367767T>C, in the 5′ regulatory region of the APOA5 and AKT3 genes. For 15:g.27447741A>G in APOA5, allele A invented binding sites (BSs) for transcription factor (TF) NK2 homeobox 8 (NKX2.8), and allele G invented BSs for EBF Transcription Factor 1 (EBF1), E74-like ETS transcription factor 5 (ELF5), and HIC ZBTB Transcriptional Repressor 2 (HIC2). Allele C of 15:g.27446527C>T in APOA5 provided BSs for Twist Family BHLH Transcription Factor 2 (TWIST2) and Rhox Homeobox Family Member 1 (RHOXF1), and when the allele was T there was no BS for any TF. Allele C of 16:g.33367767T>C in AKT3 created BSs for Nuclear Factor Of Activated T Cells 5 (NFAT5) (Table 3).

3.5. Changes in mRNA and Protein Structure and Function by Missense Mutation

We utilized the RNAfold web server to predict the changes in mRNA secondary structure caused by a missense mutation, 15:g.27445825T>C, in the APOA5 gene and found that when the allele T mutated to C, the MFE changed from −522.90 kcal/mol to −522.80 kcal/mol, indicating that the mRNA secondary structure of this gene is more unstable after mutation. SOPMA analysis revealed that this missense mutation changed the protein secondary structure, with the α-helix changing from 83.70% to 86.96% and random coil from 16.03% to 12.77%, when the allele T mutated into C. By SAAFEC-SEQ prediction, the ΔΔG was reduced to 0.04 kcal/mol after mutation to decrease protein stability. However, this missense mutation was a neutral mutation and did not alter protein function because the predicted PROVEAN score was −0.364. In summary, this missense mutation could reduce the stability of the mRNA secondary structure of the APOA5 gene and decrease its protein secondary structure and stability.

4. Discussion

In GS, SNPs are given different weights based on their importance in the genome relationship matrix, making the prediction of traits more accurate and less biased. For instance, by increasing the weight of SNPs affecting the production performance of Nordic Holstein, Danish Jersey, and Nordic Red cattle, the prediction reliability was increased by up to 3~5% [34]. Sara et al. integrated previously significant SNP information related to the carcass traits of Hanwoo cattle into the GS method, resulting in an improved prediction accuracy of 2~6% [13]. Currently, the six SNPs identified in this study are not present in any of the four gene chips (GeneSeek Genomic Profiler (GGP) Bovine 150K and 100K arrays, illumina Bovine SNP50K BeadChip, illumina BovineHD Genotyping BeadChip). That these SNPs have significant genetic effects on milk production traits suggests that their significant SNPs can be added to the SNP chip, and their weight should be increased during GS to accelerate the selection of cows for milk production traits.
Many phenotypic differences among individuals may be elicited by alterations in gene expression and the underlying transcriptional regulation, and the expression of genes can be regulated by TF binding to TFBSs [35,36]. The SNP located in the TFBS may affect the binding of TF, resulting in differences in gene expression among individuals with different genotypes [37,38]. Here, we found that the SNPs located in the 5′ regulatory regions of the APOA5 and AKT3 genes led to changes in gene-binding TFs (Table 3). Studies reported that transcription factors EBF1, ELF5, HIC2, and NFAT5 can promote the expression of target genes to which they bind [39,40,41,42], and NKX2.8, TWIST2, and RHOXF1 may inhibit the expression of their target genes [43,44,45,46]. The upregulation of APOA5 can improve the transport of triglycerides from the liver, overall lipid metabolism, and delivery of preformed fatty acids to the mammary gland, thereby promoting the synthesis of milk components [47]. AKT3 can stimulate β-casein synthesis and mammary epithelial cell proliferation through its involvement in signaling pathways such as mTOR and PI3K/AKT, thereby promoting milk production traits [48,49]. For instance, we observed that the cows with the GG genotype had significantly higher milk yield, fat yield, and protein yield than those with the AA genotype, suggesting that the GG genotype might activate the expression of the APOA5 gene by binding the TFs EBF1, ELF5, and HIC2, leading to an increase in milk production traits. Therefore, we inferred that the three SNPs, 15:g.27447741A>G, 15:g.27447741A>G, and 16:g.33367767T>C, alter the TFBS, leading to changes in TF binding, which in turn regulate APOA5 or AKT3 gene expression, ultimately affecting milk production traits.
Genetic polymorphisms of alleles can significantly affect the secondary structure of mRNA, and the stability of mRNA largely depends on its secondary structural elements, which will influence the speed and fidelity of its translation into proteins [50]. The alteration in the amino acid sequence leads to changes in the conformation of polypeptide chains, resulting in variations in the protein’s secondary structure and influencing protein translation [51,52]. In this study, the milk yield, fat yield, and protein yield of the CC-genotype individuals were significantly higher than those of the TT-genotype individuals, probably because the stability of APOA5 mRNA and protein decreased when the allele T was mutated to C at 15:g.27445825T>C, suggesting that SNP sites may lead to changes in gene structure and function, and then affect the phenotype.
In this study, we observed that 15:g.27447741A>G, 15:g.27447741A>G, and 15:g.27445825T>C in the APOA5 gene are in linkage disequilibrium, and haplotype block association analysis revealed that these SNPs have a higher significance in affecting milk yield, fat yield, and protein yield across two lactations compared to single-marker analysis. This may be due to the coordinated effect of these three causal mutations influencing the function or expression of the APOA5 gene, leading to milk production trait variation. The effects of these SNPs on gene function or expression can be verified by dual luciferase assay, Chromatin Immunoprecipitation (ChIP), Electrophoretic Mobility Shift Assay (EMSA), etc., with which their effects on milk traits can be explored in greater depth.

5. Conclusions

This study confirmed the significant genetic effects of three SNPs in the APOA5 gene and three SNPs in the AKT3 gene on milk production traits in dairy cattle. Four SNPs were proposed to be the causal mutations affecting milk production traits: three SNPs, 15:g.27447741A>G and 15:g.27446527C>T in APOA5 and 16:g.33367767T>C in AKT3, regulated the expression of genes by alteration of the TFBSs, and one missense mutation in APOA5, 15:g.27445825T>C, changed the secondary structure and stability of its mRNA and protein. This project lays a foundation for further functional verification of APOA5 and AKT3, whose valuable SNPs can be used as candidate markers for molecular breeding of dairy cattle.

Supplementary Materials

The following supporting information can be downloaded at: https://www.mdpi.com/article/10.3390/agriculture14060869/s1, Table S1: Descriptive statistics of phenotypic values for dairy milk production traits of the first and second lactations; Table S2: Primers and procedures for PCR in SNP identification of APOA5 and AKT3 genes; Table S3: Associations of six SNPs in APOA5 and AKT3 genes with milk production traits in two lactations of Chinese Holstein cows; Table S4: Additive, dominant, and allele substitution effects of six SNPs on milk production traits of APOA5 and AKT3 genes in Chinese Holstein cows.

Author Contributions

Conceptualization, D.S.; methodology, Z.G. and L.X.; validation, A.D.; formal analysis, Z.G.; investigation, Z.G., R.T. and W.S.; resources, H.L. and G.Z.; data curation, J.T. and J.Z.; writing—original draft preparation, Z.G.; writing—review and editing, B.H. and D.S.; supervision, X.B.; project administration, D.S.; funding acquisition, D.S. All authors have read and agreed to the published version of the manuscript.

Funding

This research was funded by the Science and Technology Program of Inner Mongolia Autonomous Region (2021GG0102; 2021GG0403); the National Key R&D Program of China (2021YFF1000700); STI 2030—Major Projects (2023ZD04069); and the Program for Changjiang Scholar and Innovation Research Team in University (IRT_15R62).

Institutional Review Board Statement

The study was conducted in accordance with the Guide for the Care and Use of Laboratory Animals and approved by the Institutional Animal Care and Use Committee (IACUC) at China Agricultural University (Beijing, China; permit number: DK996, 23 May 2018).

Data Availability Statement

The datasets generated and/or analyzed during the current study are available in the article and its Supplementary Material.

Acknowledgments

We appreciate Beijing Dairy Cattle Center for providing the semen and blood samples and phenotypic data.

Conflicts of Interest

The authors, Wei Sun, Gaoping Zhao and Xiangnan Bao, were employed by the company Inner Mongolia SK Xing Animal Breeding and Breeding Biotechnology Research Institute Co., Ltd., Jixin Zhang was employed by the company Inner Mongolia XuYi Animal Husbandry Co., Ltd. The remaining authors declare that the research was conducted in the absence of any commercial or financial relationships that could be construed as a potential conflict of interest.

References

  1. Rumbold, P.; McCullogh, N.; Boldon, R.; Haskell-Ramsay, C.; James, L.; Stevenson, E.; Green, B. The potential nutrition-, physical- and health-related benefits of cow’s milk for primary-school-aged children. Nutr. Res. Rev. 2022, 35, 50–69. [Google Scholar] [CrossRef] [PubMed]
  2. Scholz-Ahrens, K.E.; Ahrens, F.; Barth, C.A. Nutritional and health attributes of milk and milk imitations. Eur. J. Nutr. 2020, 59, 19–34. [Google Scholar] [CrossRef] [PubMed]
  3. Dai, J.; Yin, T.; Cao, L. Dairy consumption and liver cancer risk: A meta-analysis of observational studies. Oncol. Lett. 2024, 27, 108. [Google Scholar] [CrossRef] [PubMed]
  4. Pereira, P.C. Milk nutritional composition and its role in human health. Nutrition 2014, 30, 619–627. [Google Scholar] [CrossRef] [PubMed]
  5. Tunick, M.H.; Van Hekken, D.L. Dairy Products and Health: Recent Insights. J. Agric. Food Chem. 2015, 63, 9381–9388. [Google Scholar] [CrossRef] [PubMed]
  6. Yang, S.; Bhargava, N.; Connor, A.O.; Gibney, E.R.; Feeney, E.L. Dairy consumption in adults in China: A systematic review. BMC Nutr. 2023, 9, 116. [Google Scholar] [CrossRef] [PubMed]
  7. Guinan, F.L.; Wiggans, G.R.; Norman, H.D.; Dürr, J.W.; Cole, J.B.; Van Tassell, C.P.; Misztal, I.; Lourenco, D. Changes in genetic trends in US dairy cattle since the implementation of genomic selection. J. Dairy Sci. 2023, 106, 1110–1129. [Google Scholar] [CrossRef]
  8. König, S.; Simianer, H.; Willam, A. Economic evaluation of genomic breeding programs. J. Dairy Sci. 2009, 92, 382–391. [Google Scholar] [CrossRef]
  9. Schaeffer, L.R. Strategy for applying genome-wide selection in dairy cattle. J. Anim. Breed. Genet. 2006, 123, 218–223. [Google Scholar] [CrossRef]
  10. Ding, X.; Zhang, Z.; Li, X.; Wang, S.; Wu, X.; Sun, D.; Yu, Y.; Liu, J.; Wang, Y.; Zhang, Y.; et al. Accuracy of genomic prediction for milk production traits in the Chinese Holstein population using a reference population consisting of cows. J. Dairy Sci. 2013, 96, 5315–5323. [Google Scholar] [CrossRef]
  11. Wiggans, G.R.; Cole, J.B.; Hubbard, S.M.; Sonstegard, T.S. Genomic Selection in Dairy Cattle: The USDA Experience. Annu. Rev. Anim. Biosci. 2017, 5, 309–327. [Google Scholar] [CrossRef] [PubMed]
  12. Zhang, Z.; Ober, U.; Erbe, M.; Zhang, H.; Gao, N.; He, J.; Li, J.; Simianer, H. Improving the accuracy of whole genome prediction for complex traits using the results of genome wide association studies. PLoS ONE 2014, 9, e93017. [Google Scholar] [CrossRef] [PubMed]
  13. de Las, H.S.; Lopez, B.I.; Moghaddar, N.; Park, W.; Park, J.E.; Chung, K.Y.; Lim, D.; Lee, S.H.; Shin, D.; van der Werf, J. Use of gene expression and whole-genome sequence information to improve the accuracy of genomic prediction for carcass traits in Hanwoo cattle. Genet. Sel. Evol. 2020, 52, 54. [Google Scholar] [CrossRef] [PubMed]
  14. Han, B.; Yuan, Y.; Liang, R.; Li, Y.; Liu, L.; Sun, D. Genetic Effects of LPIN1 Polymorphisms on Milk Production Traits in Dairy Cattle. Genes 2019, 10, 265. [Google Scholar] [CrossRef] [PubMed]
  15. Khan, K.; Suhail, S.M.; Khan, R.; Ahmed, I.; Khan, F.A.; Khan, M.J. Genetic polymorphism of Β-casein gene and its association with milk production and composition in Azi-Kheli buffalo. Trop. Anim. Health Prod. 2023, 55, 94. [Google Scholar] [CrossRef] [PubMed]
  16. Sun, Y.; Wu, X.; Ma, Y.; Liu, D.; Lu, X.; Zhao, T.; Yang, Z. Molecular Marker-Assisted Selection of ABCG2, CD44, SPP1 Genes Contribute to Milk Production Traits of Chinese Holstein. Animals 2023, 13, 89. [Google Scholar] [CrossRef] [PubMed]
  17. Worku, D.; Gowane, G.; Verma, A. Genetic variation in promoter region of the bovine LAP3 gene associated with estimated breeding values of milk production traits and clinical mastitis in dairy cattle. PLoS ONE 2023, 18, e277156. [Google Scholar] [CrossRef]
  18. Fu, Y.; Jia, R.; Xu, L.; Su, D.; Li, Y.; Liu, L.; Ma, Z.; Sun, D.; Han, B. Fatty acid desaturase 2 affects the milk-production traits in Chinese Holsteins. Anim. Genet. 2022, 53, 422–426. [Google Scholar] [CrossRef]
  19. Du, A.; Zhao, F.; Liu, Y.; Xu, L.; Chen, K.; Sun, D.; Han, B. Genetic polymorphisms of PKLR gene and their associations with milk production traits in Chinese Holstein cows. Front. Genet. 2022, 13, 1002706. [Google Scholar] [CrossRef]
  20. Xu, L.; Shi, L.; Liu, L.; Liang, R.; Li, Q.; Li, J.; Han, B.; Sun, D. Analysis of Liver Proteome and Identification of Critical Proteins Affecting Milk Fat, Protein, and Lactose Metabolism in Dariy Cattle with iTRAQ. Proteomics 2019, 19, 1800387. [Google Scholar] [CrossRef]
  21. Coleman, D.N.; Vailati-Riboni, M.; Elolimy, A.A.; Cardoso, F.C.; Rodriguez-Zas, S.L.; Miura, M.; Pan, Y.; Loor, J.J. Hepatic betaine-homocysteine methyltransferase and methionine synthase activity and intermediates of the methionine cycle are altered by choline supply during negative energy balance in Holstein cows. J. Dairy Sci. 2019, 102, 8305–8318. [Google Scholar] [CrossRef] [PubMed]
  22. Fruchart-Najib, J.; Baugé, E.; Niculescu, L.; Pham, T.; Thomas, B.; Rommens, C.; Majd, Z.; Brewer, B.; Pennacchio, L.A.; Fruchart, J. Mechanism of triglyceride lowering in mice expressing human apolipoprotein A5. Biochem. Biophys. Res. Commun. 2004, 319, 397–404. [Google Scholar] [CrossRef] [PubMed]
  23. Pennacchio, L.A.; Olivier, M.; Hubacek, J.A.; Cohen, J.C.; Cox, D.R.; Fruchart, J.C.; Krauss, R.M.; Rubin, E.M. An apolipoprotein influencing triglycerides in humans and mice revealed by comparative sequencing. Science 2001, 294, 169–173. [Google Scholar] [CrossRef] [PubMed]
  24. Khan, M.J.; Jacometo, C.B.; Graugnard, D.E.; Correa, M.N.; Schmitt, E.; Cardoso, F.; Loor, J.J. Overfeeding Dairy Cattle During Late-Pregnancy Alters Hepatic PPARalpha-Regulated Pathways Including Hepatokines: Impact on Metabolism and Peripheral Insulin Sensitivity. Gene Regul. Syst. Biol. 2014, 8, 97–111. [Google Scholar] [CrossRef] [PubMed]
  25. Xu, T.; Cardoso, F.C.; Pineda, A.; Trevisi, E.; Shen, X.; Rosa, F.; Osorio, J.S.; Loor, J.J. Grain challenge affects systemic and hepatic molecular biomarkers of inflammation, stress, and metabolic responses to a greater extent in Holstein than Jersey cows. J. Dairy Sci. 2017, 100, 9153–9162. [Google Scholar] [CrossRef] [PubMed]
  26. Coffer, P.J.; Jin, J.; Woodgett, J.R. Protein kinase B (c-Akt): A multifunctional mediator of phosphatidylinositol 3-kinase activation. Biochem. J. 1998, 335 Pt 1, 1–13. [Google Scholar] [CrossRef] [PubMed]
  27. Rivière, J.; Mirzaa, G.M.; O’Roak, B.J.; Beddaoui, M.; Alcantara, D.; Conway, R.L.; St-Onge, J.; Schwartzentruber, J.A.; Gripp, K.W.; Nikkel, S.M.; et al. De novo germline and postzygotic mutations in AKT3, PIK3R2 and PIK3CA cause a spectrum of related megalencephaly syndromes. Nat. Genet. 2012, 44, 934–940. [Google Scholar] [CrossRef]
  28. Bionaz, M.; Loor, J.J. mTOR, AMPK, and insulin receptor signaling networks in the bovine mammary gland during the lactation cycle. FASEB J. 2007, 21, A1109. [Google Scholar]
  29. Meredith, B.K.; Kearney, F.J.; Finlay, E.K.; Bradley, D.G.; Fahey, A.G.; Berry, D.P.; Lynn, D.J. Genome-wide associations for milk production and somatic cell score in Holstein-Friesian cattle in Ireland. BMC Genet. 2012, 13, 21. [Google Scholar] [CrossRef]
  30. Cole, J.B.; Wiggans, G.R.; Ma, L.; Sonstegard, T.S.; Lawlor, T.J.; Crooker, B.A.; Van Tassell, C.P.; Yang, J.; Wang, S.; Matukumalli, L.K.; et al. Genome-wide association analysis of thirty one production, health, reproduction and body conformation traits in contemporary U.S. Holstein cows. BMC Genom. 2011, 12, 408. [Google Scholar] [CrossRef]
  31. Nayeri, S.; Sargolzaei, M.; Abo-Ismail, M.K.; May, N.; Miller, S.P.; Schenkel, F.; Moore, S.S.; Stothard, P. Genome-wide association for milk production and female fertility traits in Canadian dairy Holstein cattle. BMC Genet. 2016, 17, 75. [Google Scholar] [CrossRef] [PubMed]
  32. Olsen, H.G.; Knutsen, T.M.; Kohler, A.; Svendsen, M.; Gidskehaug, L.; Grove, H.; Nome, T.; Sodeland, M.; Sundsaasen, K.K.; Kent, M.P.; et al. Genome-wide association mapping for milk fat composition and fine mapping of a QTL for de novo synthesis of milk fatty acids on bovine chromosome 13. Genet. Sel. Evol. 2017, 49, 20. [Google Scholar] [CrossRef] [PubMed]
  33. Li, C.; Sun, D.; Zhang, S.; Wang, S.; Wu, X.; Zhang, Q.; Liu, L.; Li, Y.; Qiao, L. Genome wide association study identifies 20 novel promising genes associated with milk fatty acid traits in Chinese Holstein. PLoS ONE 2014, 9, e96186. [Google Scholar] [CrossRef] [PubMed]
  34. Brøndum, R.F.; Su, G.; Janss, L.; Sahana, G.; Guldbrandtsen, B.; Boichard, D.; Lund, M.S. Quantitative trait loci markers derived from whole genome sequence data increases the reliability of genomic prediction. J. Dairy Sci. 2015, 98, 4107–4116. [Google Scholar] [CrossRef] [PubMed]
  35. Georgakopoulos-Soares, I.; Deng, C.; Agarwal, V.; Chan, C.S.Y.; Zhao, J.; Inoue, F.; Ahituv, N. Transcription factor binding site orientation and order are major drivers of gene regulatory activity. Nat. Commun. 2023, 14, 2333. [Google Scholar] [CrossRef] [PubMed]
  36. Calkhoven, C.F.; Ab, G. Multiple steps in the regulation of transcription-factor level and activity. Biochem. J. 1996, 317 Pt 2, 329–342. [Google Scholar] [CrossRef] [PubMed]
  37. Degtyareva, A.O.; Antontseva, E.V.; Merkulova, T.I. Regulatory SNPs: Altered Transcription Factor Binding Sites Implicated in Complex Traits and Diseases. Int. J. Mol. Sci. 2021, 22, 6454. [Google Scholar] [CrossRef] [PubMed]
  38. Zheng, W.; Zhao, H.; Mancera, E.; Steinmetz, L.M.; Snyder, M. Genetic analysis of variation in transcription factor binding in yeast. Nature 2010, 464, 1187–1191. [Google Scholar] [CrossRef] [PubMed]
  39. Huang, P.; Peslak, S.A.; Ren, R.; Khandros, E.; Qin, K.; Keller, C.A.; Giardine, B.; Bell, H.W.; Lan, X.; Sharma, M.; et al. HIC2 controls developmental hemoglobin switching by repressing BCL11A transcription. Nat. Genet. 2022, 54, 1417–1426. [Google Scholar] [CrossRef]
  40. Somasundaram, R.; Jensen, C.T.; Tingvall-Gustafsson, J.; Ahsberg, J.; Okuyama, K.; Prasad, M.; Hagman, J.R.; Wang, X.; Soneji, S.; Strid, T.; et al. EBF1 and PAX5 control pro-B cell expansion via opposing regulation of the Myc gene. Blood 2021, 137, 3037–3049. [Google Scholar] [CrossRef]
  41. Huerga Encabo, H.; Traveset, L.; Argilaguet, J.; Angulo, A.; Nistal-Villán, E.; Jaiswal, R.; Escalante, C.R.; Gekas, C.; Meyerhans, A.; Aramburu, J.; et al. The transcription factor NFAT5 limits infection-induced type I interferon responses. J. Exp. Med. 2020, 217, e20190449. [Google Scholar] [CrossRef]
  42. Grassmeyer, J.; Mukherjee, M.; DeRiso, J.; Hettinger, C.; Bailey, M.; Sinha, S.; Visvader, J.E.; Zhao, H.; Fogarty, E.; Surendran, K. Elf5 is a principal cell lineage specific transcription factor in the kidney that contributes to Aqp 2 and Avpr 2 gene expression. Dev. Biol. 2017, 424, 77–89. [Google Scholar] [CrossRef]
  43. Liu, Y.; Peng, L.; Chen, J.; Chen, L.; Wu, Y.; Cheng, M.; Chen, M.; Ye, X.; Jin, Y. EIF5A2 specifically regulates the transcription of aging-related genes in human neuroblastoma cells. BMC Geriatr. 2023, 23, 83. [Google Scholar] [CrossRef] [PubMed]
  44. Zhou, Z.; Xiong, L.; Wu, Z.; Jiang, L.; Li, Y.; Li, Z.; Peng, Y.; Ning, K.; Zou, X.; Liu, Z.; et al. Nkx2.8 promotes chemosensitivity in bladder urothelial carcinoma via transcriptional repression of MDR1. Cell Death Dis. 2022, 13, 492. [Google Scholar] [CrossRef]
  45. Yu, C.; Liu, Z.; Chen, Q.; Li, Y.; Jiang, L.; Zhang, Z.; Zhou, F. Nkx2.8 Inhibits Epithelial–Mesenchymal Transition in Bladder Urothelial Carcinoma via Transcriptional Repression ofTwist1. Cancer Res. 2018, 78, 1241–1252. [Google Scholar] [CrossRef] [PubMed]
  46. Fang, X.; Cai, Y.; Liu, J.; Wang, Z.; Wu, Q.; Zhang, Z.; Yang, C.J.; Yuan, L.; Ouyang, G. Twist2 contributes to breast cancer progression by promoting an epithelial-mesenchymal transition and cancer stem-like cell self-renewal. Oncogene 2011, 30, 4707–4720. [Google Scholar] [CrossRef] [PubMed]
  47. Silva, P.R.B.; Weber, W.J.; Crooker, B.A.; Collier, R.J.; Thatcher, W.W.; Chebel, R.C. Hepatic mRNA expression for genes related to somatotropic axis, glucose and lipid metabolisms, and inflammatory response of periparturient dairy cows treated with recombinant bovine somatotropin. J. Dairy Sci. 2017, 100, 3983–3999. [Google Scholar] [CrossRef]
  48. Jiao, B.L.; Zhang, X.L.; Wang, S.H.; Wang, L.X.; Luo, Z.X.; Zhao, H.B.; Khatib, H.; Wang, X. MicroRNA-221 regulates proliferation of bovine mammary gland epithelial cells by targeting the STAT5a and IRS1 genes. J. Dairy Sci. 2019, 102, 426–435. [Google Scholar] [CrossRef] [PubMed]
  49. Li, S.S.; Loor, J.J.; Liu, H.Y.; Liu, L.; Hosseini, A.; Zhao, W.S.; Liu, J.X. Optimal ratios of essential amino acids stimulate β-casein synthesis via activation of the mammalian target of rapamycin signaling pathway in MAC-T cells and bovine mammary tissue explants. J. Dairy Sci. 2017, 100, 6676–6688. [Google Scholar] [CrossRef]
  50. Chiaruttini, C.; Guillier, M. On the role of mRNA secondary structure in bacterial translation. Wiley Interdiscip. Rev. RNA 2020, 11, e1579. [Google Scholar] [CrossRef]
  51. Faure, G.; Ogurtsov, A.Y.; Shabalina, S.A.; Koonin, E.V. Role of mRNA structure in the control of protein folding. Nucleic Acids Res. 2016, 44, 10898–10911. [Google Scholar] [CrossRef] [PubMed]
  52. Bucher, M.; Niebling, S.; Han, Y.; Molodenskiy, D.; Hassani Nia, F.; Kreienkamp, H.; Svergun, D.; Kim, E.; Kostyukova, A.S.; Kreutz, M.R.; et al. Autism-associated SHANK3 missense point mutations impact conformational fluctuations and protein turnover at synapses. eLife 2021, 10, e66165. [Google Scholar] [CrossRef] [PubMed]
Figure 1. Phenotypes of milk production traits for genotypes in different SNPs. (A) Milk yield of different genotypes in 15:g.27447741A>G; (B) milk yield of different genotypes in 15:g.27446527C>T; (C) protein yield of different genotypes in 15:g.27446527C>T; (D) milk yield of different genotypes in 15:g.27445825T>C; (E) fat yield of different genotypes in 16:g.33367767T>C. a or b indicate significant differences between the phenotypes of milk production traits of different genotypes (p ≤ 0.05); A or B indicate extremely significant differences between the phenotypes of milk production traits of different genotypes (p ≤ 0.01).
Agriculture 14 00869 g001
Figure 2. Linkage disequilibrium estimated between SNPs in APOA5 gene. The values in the black boxes are pairwise SNP correlations (R2). The numbers 1, 2 and 3 represent 15:g.27445825T>C, 15:g.27446527C>T and 15:g.27447741A>G respectively.
Agriculture 14 00869 g002
Table 1. Details of SNPs identified in APOA5 and AKT3 genes.
GeneSNP NameGenBank No.LocationGenotypeGenotypic FrequencyAlleleAllelic Frequency
APOA515:g.27447741A>Grs417557705′ regulatory regionAA0.0975A0.3173
AG0.4396G0.6827
GG0.4629
15:g.27446527C>Trs417557675′ regulatory regionCC0.1070C0.3332
CT0.4523T0.6668
TT0.4407
15:g.27445825T>C (missense mutation)rs41755766exon 1CC0.4523C0.6748
CT0.4449T0.3252
TT0.1028
AKT316:g.33367767T>Crs2083166425′ regulatory regionCC0.1631C0.4115
CT0.4968T0.5885
TT0.3400
16:g.33417238C>Trs41798799intron 1CC0.3612C0.5990
CT0.4756T0.4010
TT0.1631
16:g.33551706T>Crs209739552intron 6CC0.0191C0.1563
CT0.2744T0.8438
TT0.7066
Table 2. Associations of haplotype block in APOA5 gene with milk production traits in two lactations of Chinese Holstein cows (LSM ± SE).
LactationHaplotype CombinationMilk Yield (kg)Fat Yield (kg)Fat Percentage (%)Protein Yield (kg)Protein Percentage (%)
1H1H1 (415)10,439 Aa ± 64.96345.89 a ± 2.873.34 ± 0.027308.56 a ± 2.092.97 ± 0.02
H1H2 (405)10,295 ABb ± 63.30341.90 ab ± 2.803.33 ± 0.026304.47 b ± 2.042.97 ± 0.02
H2H2 (91)10,163 Bab ± 94.21337.46 b ± 3.973.33 ± 0.038301.73 b ± 2.892.99 ± 0.03
p0.00110.02590.99350.00440.7444
2H1H1 (268)10,893 Aa ± 71.27392.86 A ± 3.123.63 ± 0.029321.60 A ± 2.272.96 ± 0.02
H1H2 (279)10,649 Bab ± 67.19382.75 B ± 2.973.61 ± 0.028313.79 B ± 2.162.96 ± 0.02
H2H2 (64)10,591 ABb ± 110.92385.54 AB ± 4.633.65 ± 0.045315.26 AB ± 3.382.99 ± 0.03
p0.00050.00120.69720.00050.5671
LSM ± SE is Least Squares Mean ± Standard Error; the number in the bracket represents the number of cows for the corresponding haplotype; genotypes of H1 and H2 are CTG and TCA, respectively; p shows the significance for the genetic effects of SNPs; a or b within the same column with different superscripts means p ≤ 0.05; A or B within the same column with different superscripts means p ≤ 0.01.
Table 3. Changes in transcription factor binding sites (TFBSs) caused by the SNPs in 5′ regulatory region of APOA5 and AKT3.
GeneSNP NameAlleleTranscription FactorRelative Score (≥0.85)Predicted Core Binding Site Sequence
APOA515:g.27447741A>GANKX2.80.86GCACCTCAG
GEBF10.87ACCCCAGGAA
ELF50.86CCCAGGAAGAGA
HIC20.88GTGCACCCC
15:g.27446527C>TCTWIST20.86CAGAGCTGGG
RHOXF10.88CAGAGCTG
T---
AKT316:g.33367767T>CT---
CNFAT50.87ATTTTCTTTT
Underlined nucleic acids are the SNPs.
Disclaimer/Publisher’s Note: The statements, opinions and data contained in all publications are solely those of the individual author(s) and contributor(s) and not of MDPI and/or the editor(s). MDPI and/or the editor(s) disclaim responsibility for any injury to people or property resulting from any ideas, methods, instructions or products referred to in the content.

