Abstract
This study sought to better understand how time of day (ToD) or turgor pressure might affect the flexural stiffness of sweet sorghum stalks and potentially regulate stalk lodging resistance. Stalk flexural stiffness measured across a 48 h period in 2019 showed a significant diurnal association with leaf water potential and stalk flexural stiffness. While the correlation between stalk flexural stiffness and this proxy for internal turgor status was statistically significant, it only accounted for roughly 2% of the overall variance in stiffness. Given that turgor status is a dynamic rather than fixed physiological variable like the cellular structure, these data suggest that internal turgor plays a small yet significant role in influencing the flexural stiffness of fully mature stalks prior to a stalk lodging event. The association was assessed at earlier developmental stages across three distinct cultivars and found not to be significant. Panicle weight and stalk basal weight, but not stalk Brix or water content, were found to be better predictors of stalk flexural stiffness than either ToD or turgor status. Observation across three cultivars and four distinct developmental stages ranging from the vegetative to the hard-dough stages suggests that stalk flexural stiffness changes significantly as a function of time. However, neither ToD nor turgor status appear to meaningfully contribute to observed variations in stalk flexural stiffness in either individual stalks or across larger populations. As turgor status was not found to meaningfully influence stalk strength or flexural stiffness at any developmental time point examined in any of the three sweet sorghum cultivars under study, turgor pressure likely offers only inconsequential contributions to the biomechanics underlying sweet sorghum stalk lodging resistance.
1. Introduction
The breakage of stalks prior to harvest, also known as stalk lodging, eliminates billions of dollars’ worth of crop production every year [1,2]. Stalk morphology, plot environmental conditions, and even plant physiology have been shown to significantly affect the intrinsic ability of a plant to resist lodging [3,4,5]. While turgor pressure within plant cell walls has been observed to cycle between 0.1 and over 2.0 MPa, our understanding of how these diurnal fluctuations reinforce the ability of a plant to resist stalk lodging remains limited in grain stems despite a clear association between stem stiffness and turgor status in smaller herbaceous plants such as tulips and Arabidopsis [6,7].
Turgor pressure is a fundamental component of plant physiology, representing the force exerted by a cell’s contents, including water and solutes, against the cell walls. This pressure is essential for maintaining the plant’s structural rigidity and functional integrity. Historically, turgor pressure has been recognized as a key regulator of various aspects of plant growth and development. For example, even mild water stress leading to decreased turgor pressure has been observed to impair maize root and shoot growth and expansion [8,9]. Recent reviews continue to echo these sentiments, highlighting turgor pressure as a complex, emergent driver of plant growth and regulator of plant mechanical properties [10,11,12].
Previous studies have noted that turgor pressure plays an important role in sorghum growth and development. These dynamic diurnal osmotic adjustments drive cell elongation and plant growth and development, reducing plant growth during periods of low turgor and increasing it during periods of higher turgor [13]. While increased turgor is required for plant growth, recent work has shown that excessive internal turgor pressures will completely halt plant growth [14]. As turgor pressure is generated as a balanced physiological response to internal and external solute and water concentrations, the present work seeks to study how these diurnal fluctuations might affect natural variations in stalk flexural stiffness.
Stalk flexural stiffness (aka stalk flexural rigidity) is an essential, highly predictive trait for resistance against stalk lodging [15,16,17]. As herbaceous plants rely on turgor more than woody plants to maintain structural stiffness, prior studies have suggested that turgor pressure might play a significant role in the regulation of maize stalk strength and lodging resistance [3,15]. Despite this, little research has been carried out to quantify the direct effects of turgor pressure on grain stalk mechanical properties. Indeed, we are aware of only a single study found to directly explore the effects of turgor pressure on stalk stiffness in maize. Although the primary goal of the study was to explore how brace roots support stalk anchorage in maize, a sub-study comprising 23 maize plants measured at three time points (9 am, noon, and 4 pm) during the late vegetative phase of development was found to support a significant association between ToD and stalk stiffness [18]. Ultimately, the result of that study suggests that stalk stiffness might be reduced throughout the day. In parallel to this finding, prior studies have noted in herbaceous plants such as Arabidopsis, that a 10% loss in mechanical stiffness can result within 15 min of equilibration to room temperature and humidity [19].
In our present study, we sought to contrast the previous suggestion and hypothesized that stalk flexural stiffness should increase as the day progressed. This would theoretically culminate in stiffer sweet sorghum stalks that are more lodging-resistant during the late afternoon when turgor pressure is at its diurnal peak. However, the findings of our study did not support this hypothesis. We observed neither a significant uptick nor downtrend in stalk flexural stiffness across an expanded dataset comprising three distinct cultivars tested at both the late vegetative and fully mature stages of development. We show instead that basal stalk diameter, stalk density, and panicle weight are more accurate predictors of stalk stiffness and better metrics to gauge stalk lodging resistance in sweet sorghum that the turgor status of a plant.
2. Methods
2.1. Plant Material
Three locally grown cultivars of sweet sorghum—Simon, Della, and an unreleased variety called 644—were grown under rainfed conditions in 2019 and 2020. The three cultivars were chosen as they represent early-, mid-, and late-maturing (respectively) varieties under common cultivation throughout Kentucky [20]. Planting took place at Spindletop Farm in Lexington, KY, on either 15 May 2019 or 19 May 2020, using Concep III pretreated seeds planted in a field treated with 1.6 qt/acre Bicep II Magnum for weed control. Seeding was performed at a rate of 100 seeds/15ft row with a cone planter set to 36-inch row spacing. Several ranges of all cultivars were planted, and random, representative plants were selected for phenotyping; rows at the edge of the field and plants at the ends of rows were excluded to avoid edge effects confounding results. After emergence, plants were manually thinned back to 36-inch spacing. Approximately 1 month before testing, tillers were manually removed from individual plants to minimize potential confounding effects on stalk flexural strength during testing. For the 2019 experiments, testing was performed on stalks in the hard-dough stage of development 45 days after flowering (136 days after planting). In 2020, the late vegetative to the hard-dough stages of development were targeted, expanding testing dates ranging from 94 to 156 days after planting.
2.2. Turgor Status Determination
Changes in turgor status were monitored by measuring either leaf water potential or turgor pressure over continuous 12 or 48 h periods depending on study allowance. To assess water potential, we utilized a PMS Model 610 pressure chamber (PMS Instrument Company; Albany, OR, USA) equipped with a grass compression gland sealing system, following sample collection and preparation guidelines previously described [21]. Briefly, fresh leaf cuttings were taken from two representative, randomly selected plants every hour at the testing location. The last 4–6 inches of fully shaded unblemished leaf tips from the central part of a stalk were chosen to ensure consistency and reliability in readings. Readings were taken by recording the chamber pressure at which sap was expelled from the exposed midrib following a slow, gradual increase in chamber pressurization. Total water potential and matric potential were measured in parallel with a WP4C Dew Point Potentiometer (Meter Group; Pullman, WA, USA). The underside of each leaf cutting was gently abraded with 600 grit sandpaper, and a sample cutting tool was used to excise a 40 mm diameter circular sample for loading into the analysis chamber. Two on-site sample measurements were collected each hour and averaged to determine the combined matric and water potential values. Turgor pressure was calculated as the difference between water potential and solute potential (Turgor Pressure = WP − SP, where WP is the total water potential from the WP4C, and SP is the solute potential inferred from the pressure bomb readings). The matric potential typically used to calculate turgor pressure is assumed to be contained in the WP readings from the WP4C, and the gravitational potential is often assumed to be negligible at these measurement heights [22].
2.3. Strength/Stiffness Measurements
All measurements of stalk stiffness and strength were performed as previously described [23,24]. Briefly, immediately before testing, stalks were cut down to a 4-foot height, leaves and leaf sheaths were removed, and a DARLING (Device for Assessing Resistance to Lodging IN Grains) was used to measure stalk material properties. For testing, the DARLING was placed by the base of the plant, with the load cell of the DARLING placed near the middle of the tallest complete internode at the apex of a stalk. Data were processed and cleaned using custom MATLAB scripts and further refined, cleaned, and analyzed using custom R scripts.
2.4. Morphological and Material Property Phenotype Collection
In addition to the previously described mechanical properties, several further secondary phenotypes were collected for analysis. Brix readings from 1-inch stalk cuttings obtained from an internode situated approximately 3 feet above ground level were measured using a handheld Brix refractometer (Anpro; Amazon). Brix is a standard measure used to quantify the dissolved sugar content of an aqueous solution where 1 degree Brix is equal to 1% sugar by mass. The panicle of each stalk was weighed onsite using a digital scale accurate to 0.5 g, as was the fresh weight of the basal 3-foot length of stalk extending from the ground. The moisture content of each stalk was determined using the NREL Convection Oven Drying method, as outlined in NREL/TP-510-42620.
2.5. Statistical Methods and Analysis
The statistical analysis of the data in this study involved several methods to ensure robustness and accuracy. Data cleaning and exploratory data analysis were performed to confirm that the dataset met the necessary statistical assumptions. The normality of the distribution of phenotypes was assessed using the Shapiro–Wilk test, with a p-value threshold of <0.01 indicating normal distribution for most phenotypes except for stalk flexural stiffness and Brix which were log-transformed prior to subsequent analysis. Diurnal fluctuations in turgor pressure were modeled using sinusoidal functions. Mixed-effect and extreme gradient boosting models were generated using the lme4 (v1.1-7) and xgboost (v1.7.3.1) libraries, respectively [25,26]. All statistical analyses were performed using R (v4.2.2).
3. Results
3.1. Stalk Phenotypes Are Normally Distributed
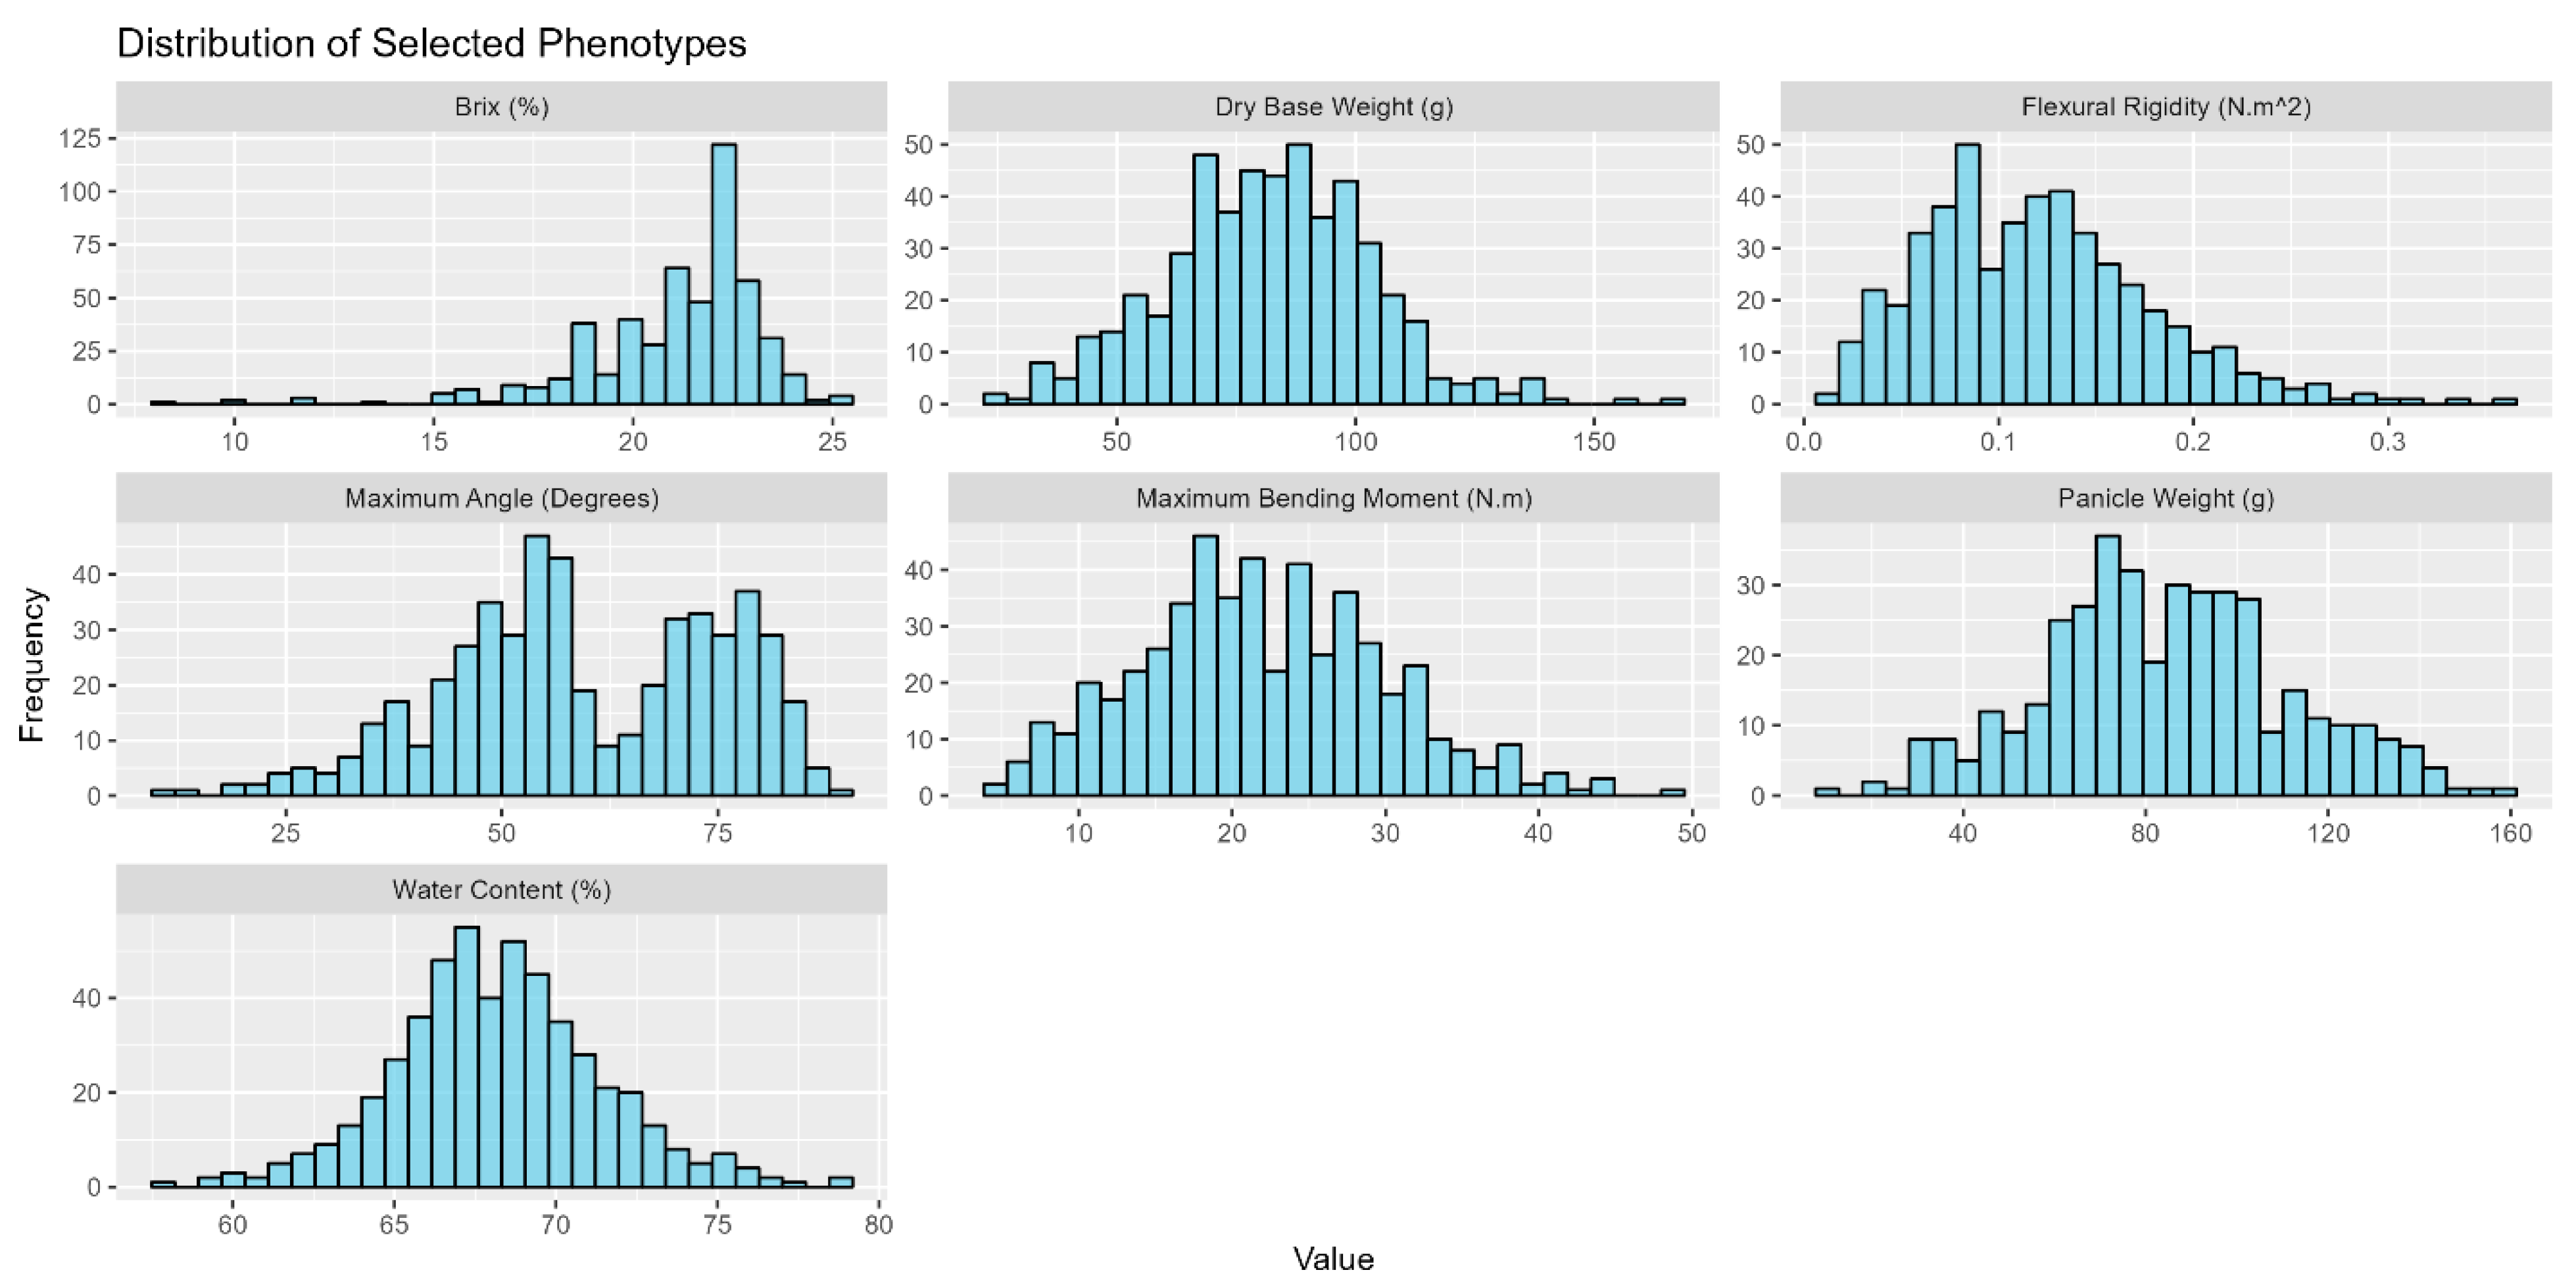
To ensure a suitable and robust dataset for the downstream examination of how morphological and physiological properties regulate mechanical properties associated with stalk lodging in sweet sorghum, exploratory data analysis and data cleaning were performed to ensure that the collected data met statistical assumptions for insight generation. The insights generated in this study were drawn from 991 stalks of sweet sorghum examined in 2019 and an additional 801 sweet sorghum stalks examined in 2020. All stalks were tested to failure with a DARLING and measurements of stalk flexural stiffness and stalk bending strength were acquired. Although exhaustive phenotyping for all stalks was impractical due to study limitations, approximately 90% of the examined stalks retained accurate measures of stalk flexural stiffness—the primary measure of stalk strength in the present study. To assess how turgor pressure might drive lodging resistance, the turgor status of 918 manually lodged stalks was recorded. The remaining stalks were manually lodged to gain insights into how stalk lodging resistance changes as a function of physiological development. While sub-study objectives drove phenotyping efforts, Figure 1 is a representative graphical visualization of the various phenotypes observed for the individuals examined in this study. Except for stalk flexural stiffness and Brix, which are naturally skewed, all phenotypes were found to be approximately normally distributed in all three cultivars. Such a distribution affirms the robustness of our dataset and underscores its suitability for an analysis investigating potential effects between stalk physiological metrics and stalk lodging resistance.
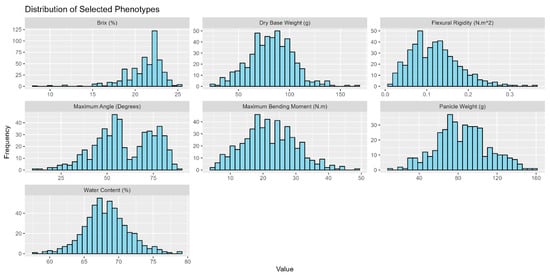
Figure 1.
Distribution of examined phenotypes. The plotted data represent a subset of the data collected from the Simon cultivar in 2019. The collected data were manually inspected and cleaned of outliers to ensure sound downstream analysis. While stalk Brix and flexural rigidity were slightly skewed, all observed phenotypes were normally distributed with a p-value < 0.01 following a Shapiro–Wilk test for normality.
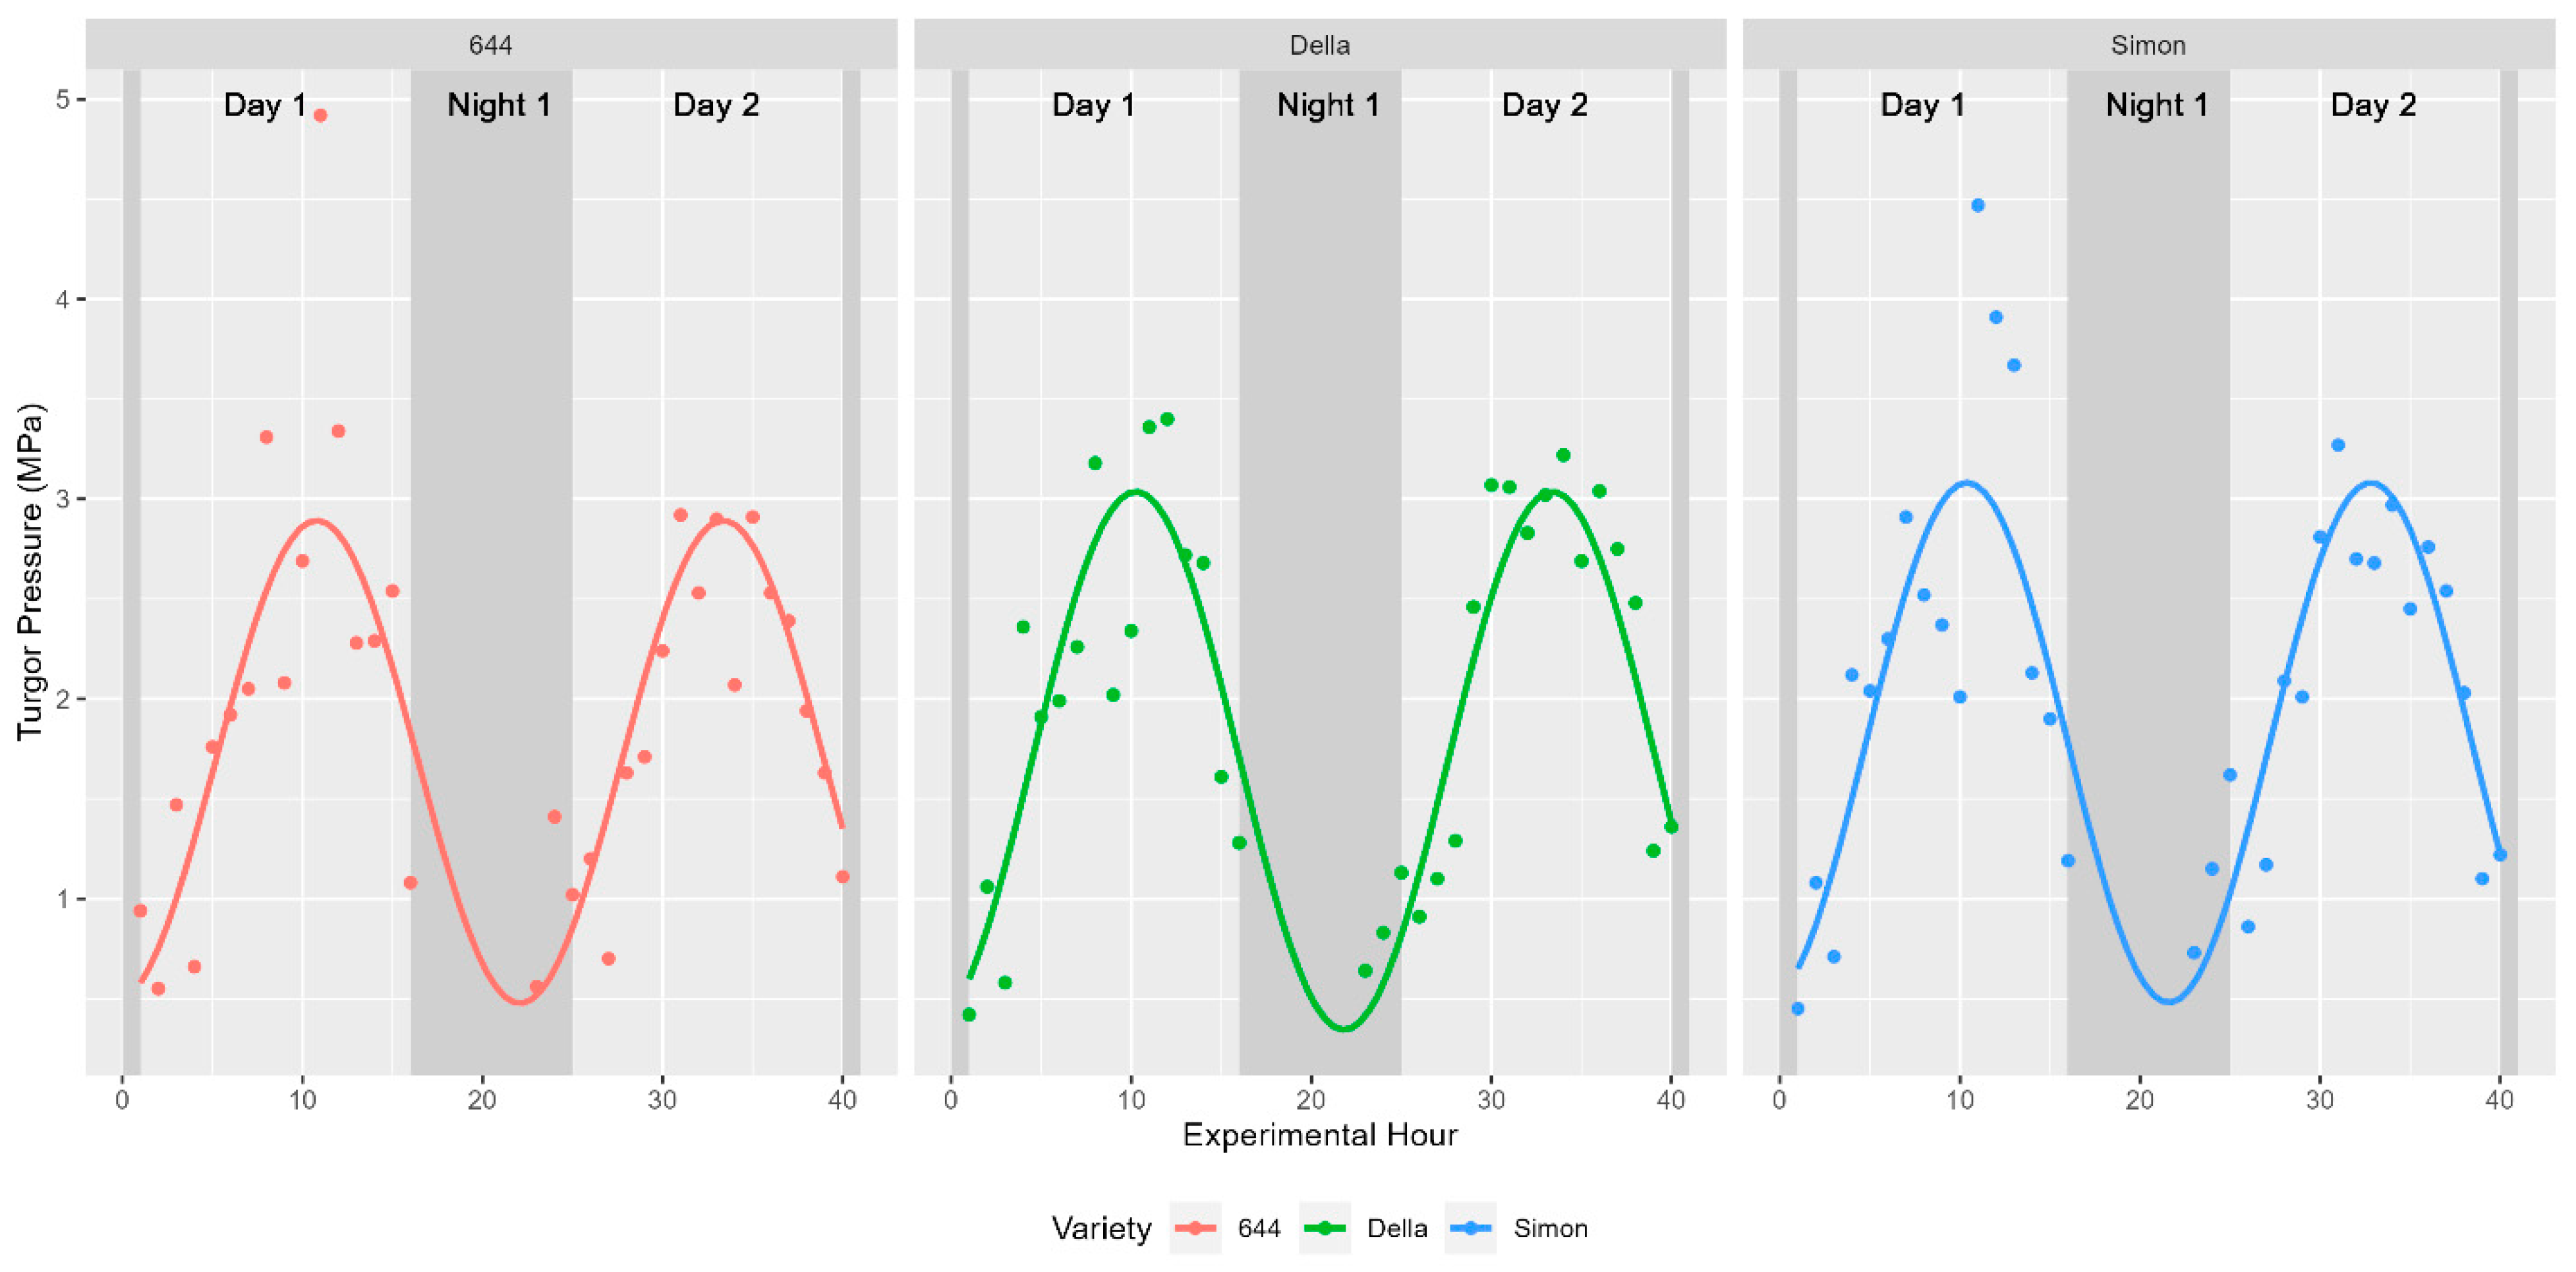
3.2. Turgor Pressure Does Fluctuate in a Diurnal Manner
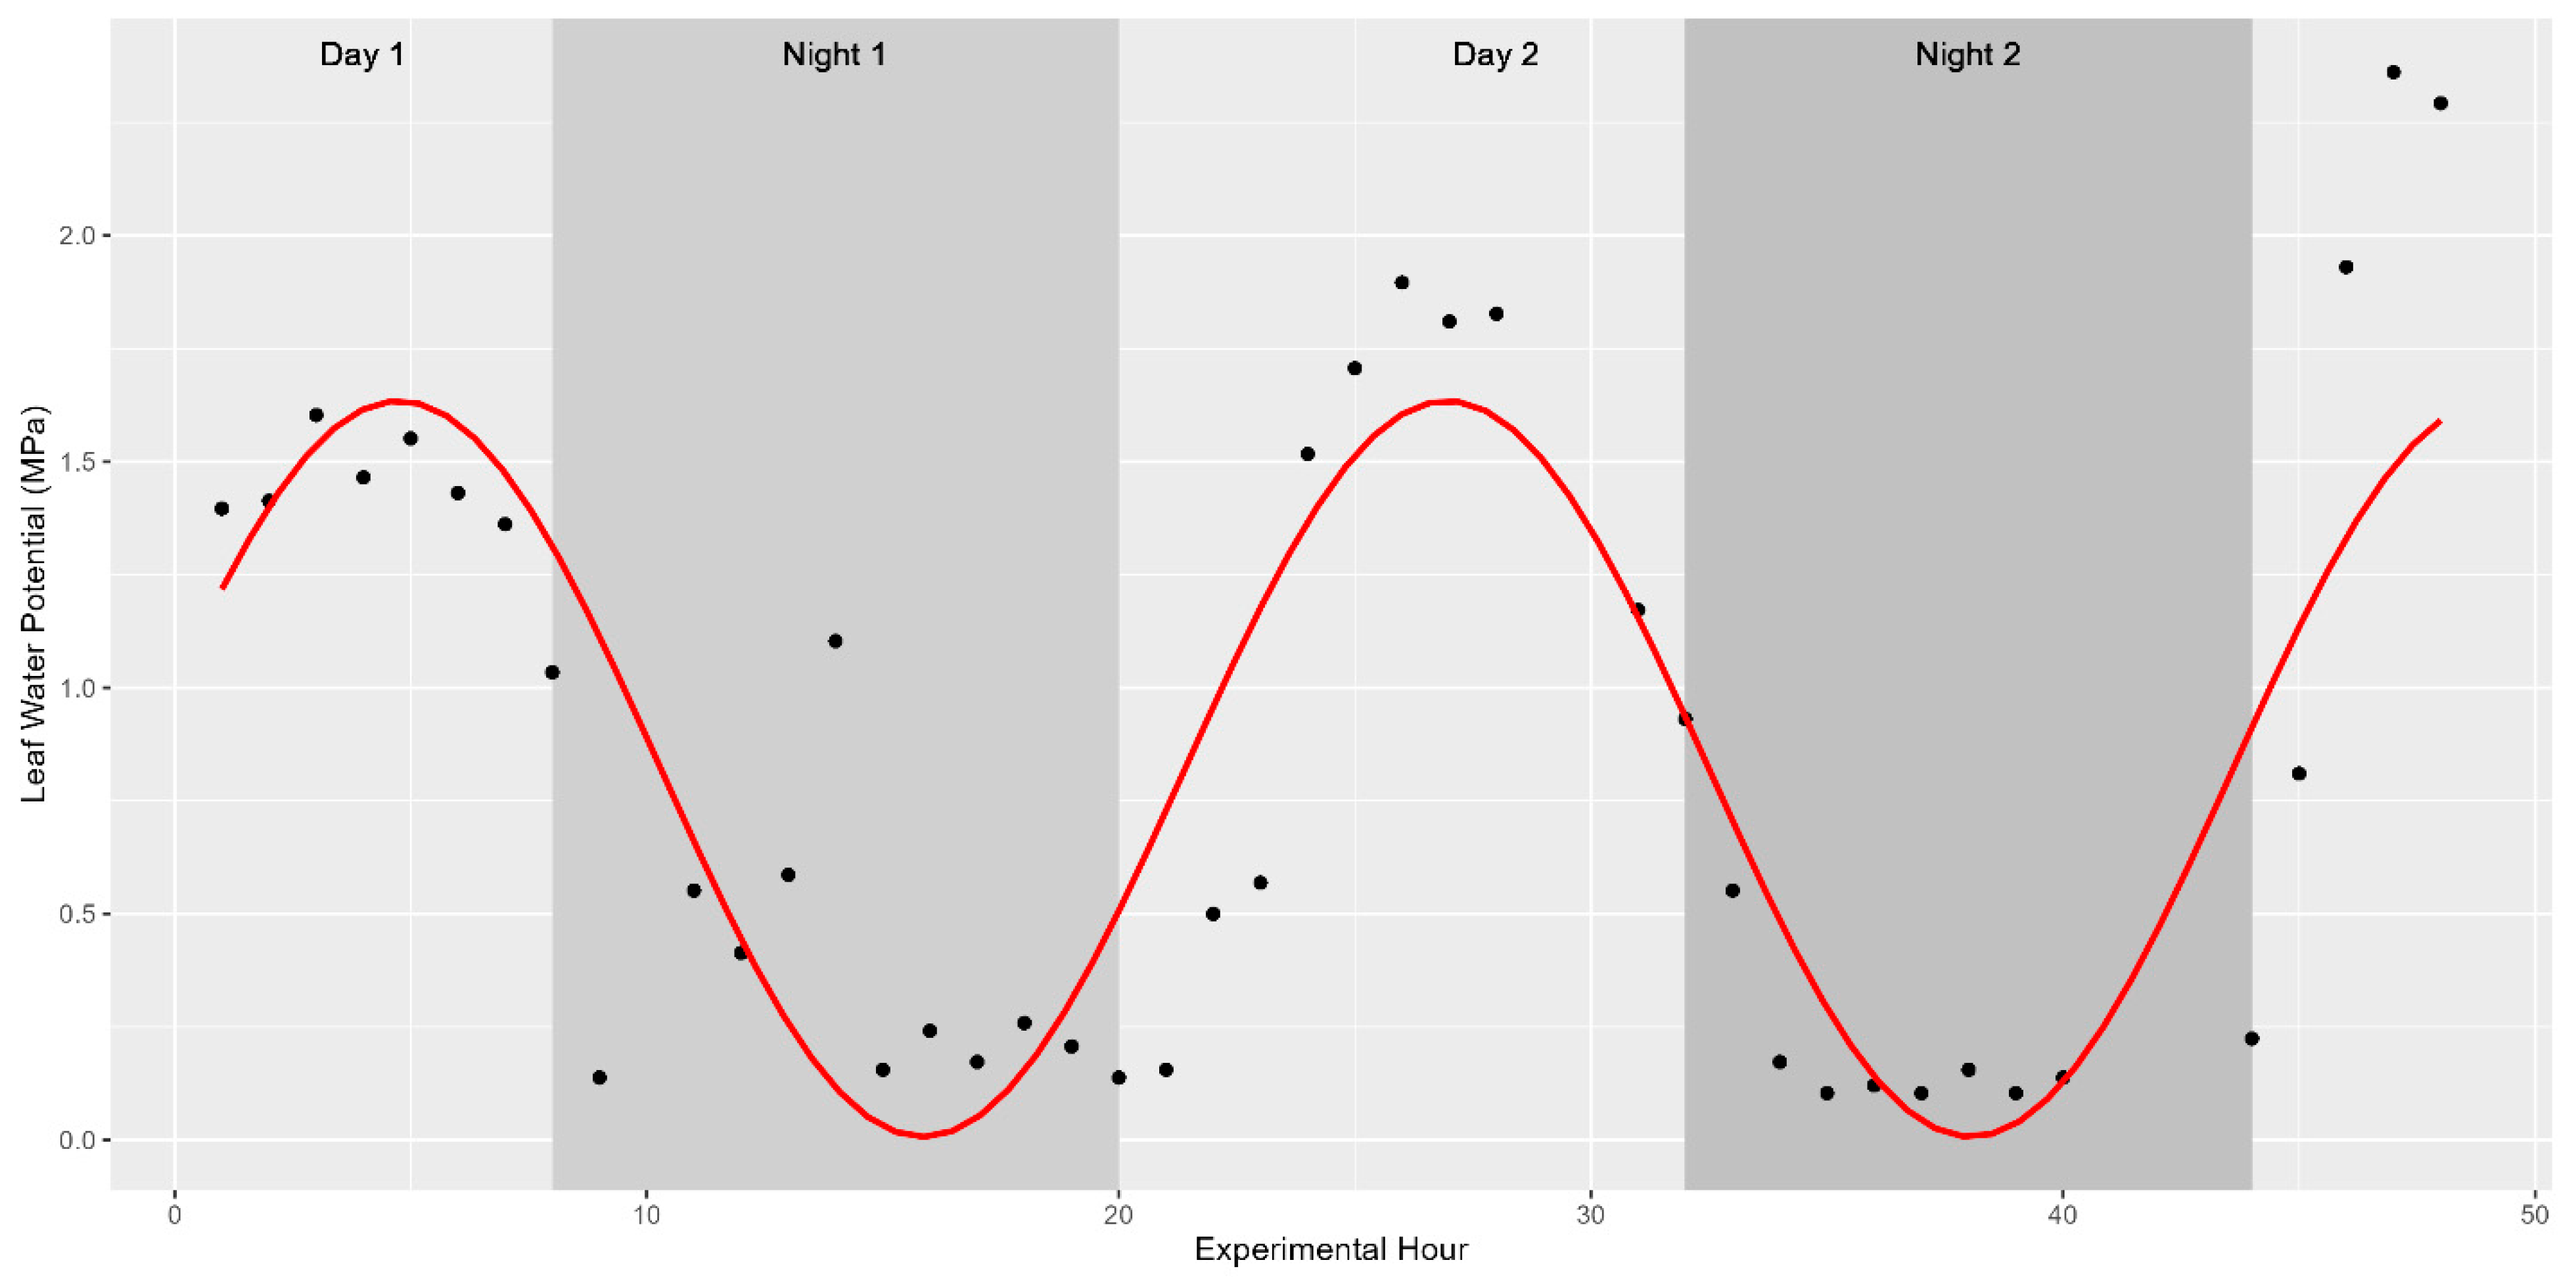
The core physiological parameter studied was the turgor status of plants during distinct times of the day. As such, plant water status was recorded and shown to fluctuate in a diurnal manner as expected. These fluctuations were captured using a pressure chamber in 2019 (water potential only) and a pressure bomb coupled with a WP4C in 2020 (turgor pressure). Leaf water potential ranged between 0.1 and 2.36 MPa in fully mature sweet sorghum in 2019 while turgor pressure was found to fluctuate between 0.42 and 4.92 MPa in vegetative sweet sorghum in 2020. In both years, these values indicate shifts spanning more than an order of magnitude in internal turgor status. Previous studies have shown that sinusoidal functions should be used to model diurnal trends in time-series data [27]. Indeed, fitting a sinusoidal function to the collected data as Leaf Turgor Status~sin(2 × pi × Time/24) returned strong significance with a p-value < 2.2 × 10⁻¹⁶. About 25.49% of the variability in water potential was explained by the ToD across the 514 fully mature stalks examined in 2019 (Figure 2). The remaining 75% of variation in water potential might be explained by morphological, environmental, and biological factors such as light intensity, temperature, relative humidity, stomatal regulation in response to drought stress, or soil moisture levels. Similar diurnal trends in the three cultivars measured directly for turgor pressure were observed in 2020 (Figure 3).
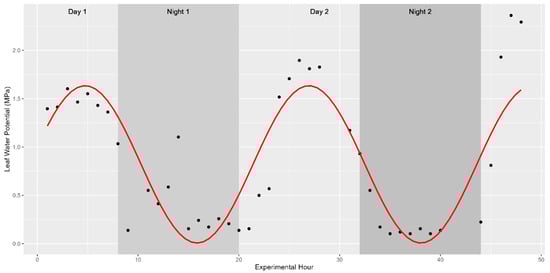
Figure 2.
Diurnal trends in leaf water potential. Trends significantly follow a sinusoidal pattern with peaks in leaf turgor pressure during the afternoon hours and valleys in leaf water potential following sunset. The study started at 1 pm on Day 1, continued through the night (shaded background), and concluded at noon on the third day. The red trend line depicts the best-fit association modelled with y~A × in(B(x)) + D, where A is an amplitude of 1, B is the period needed to complete a full cycle (in this case 2π/24), and D is a vertical shift in the model (the average leaf water potential for the hour). The association is significant at a p-value < 0.001.
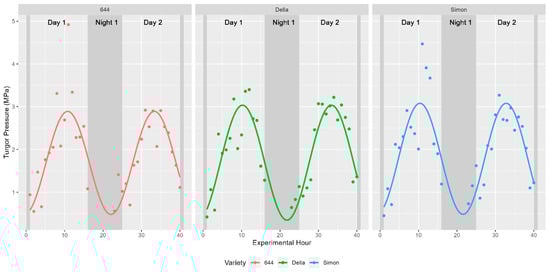
Figure 3.
Diurnal trends in turgor pressure. Trends were plotted as before for a separate dataset collected in 2020. Instead of water potential, the depicted values represent the collected measures of turgor pressure across individual plants for each cultivar examined.
3.3. Neither ToD Nor Turgor Pressure Explain More Than 5% of the Variation in Stalk Flexural Stiffness Measured during Different Times of Day
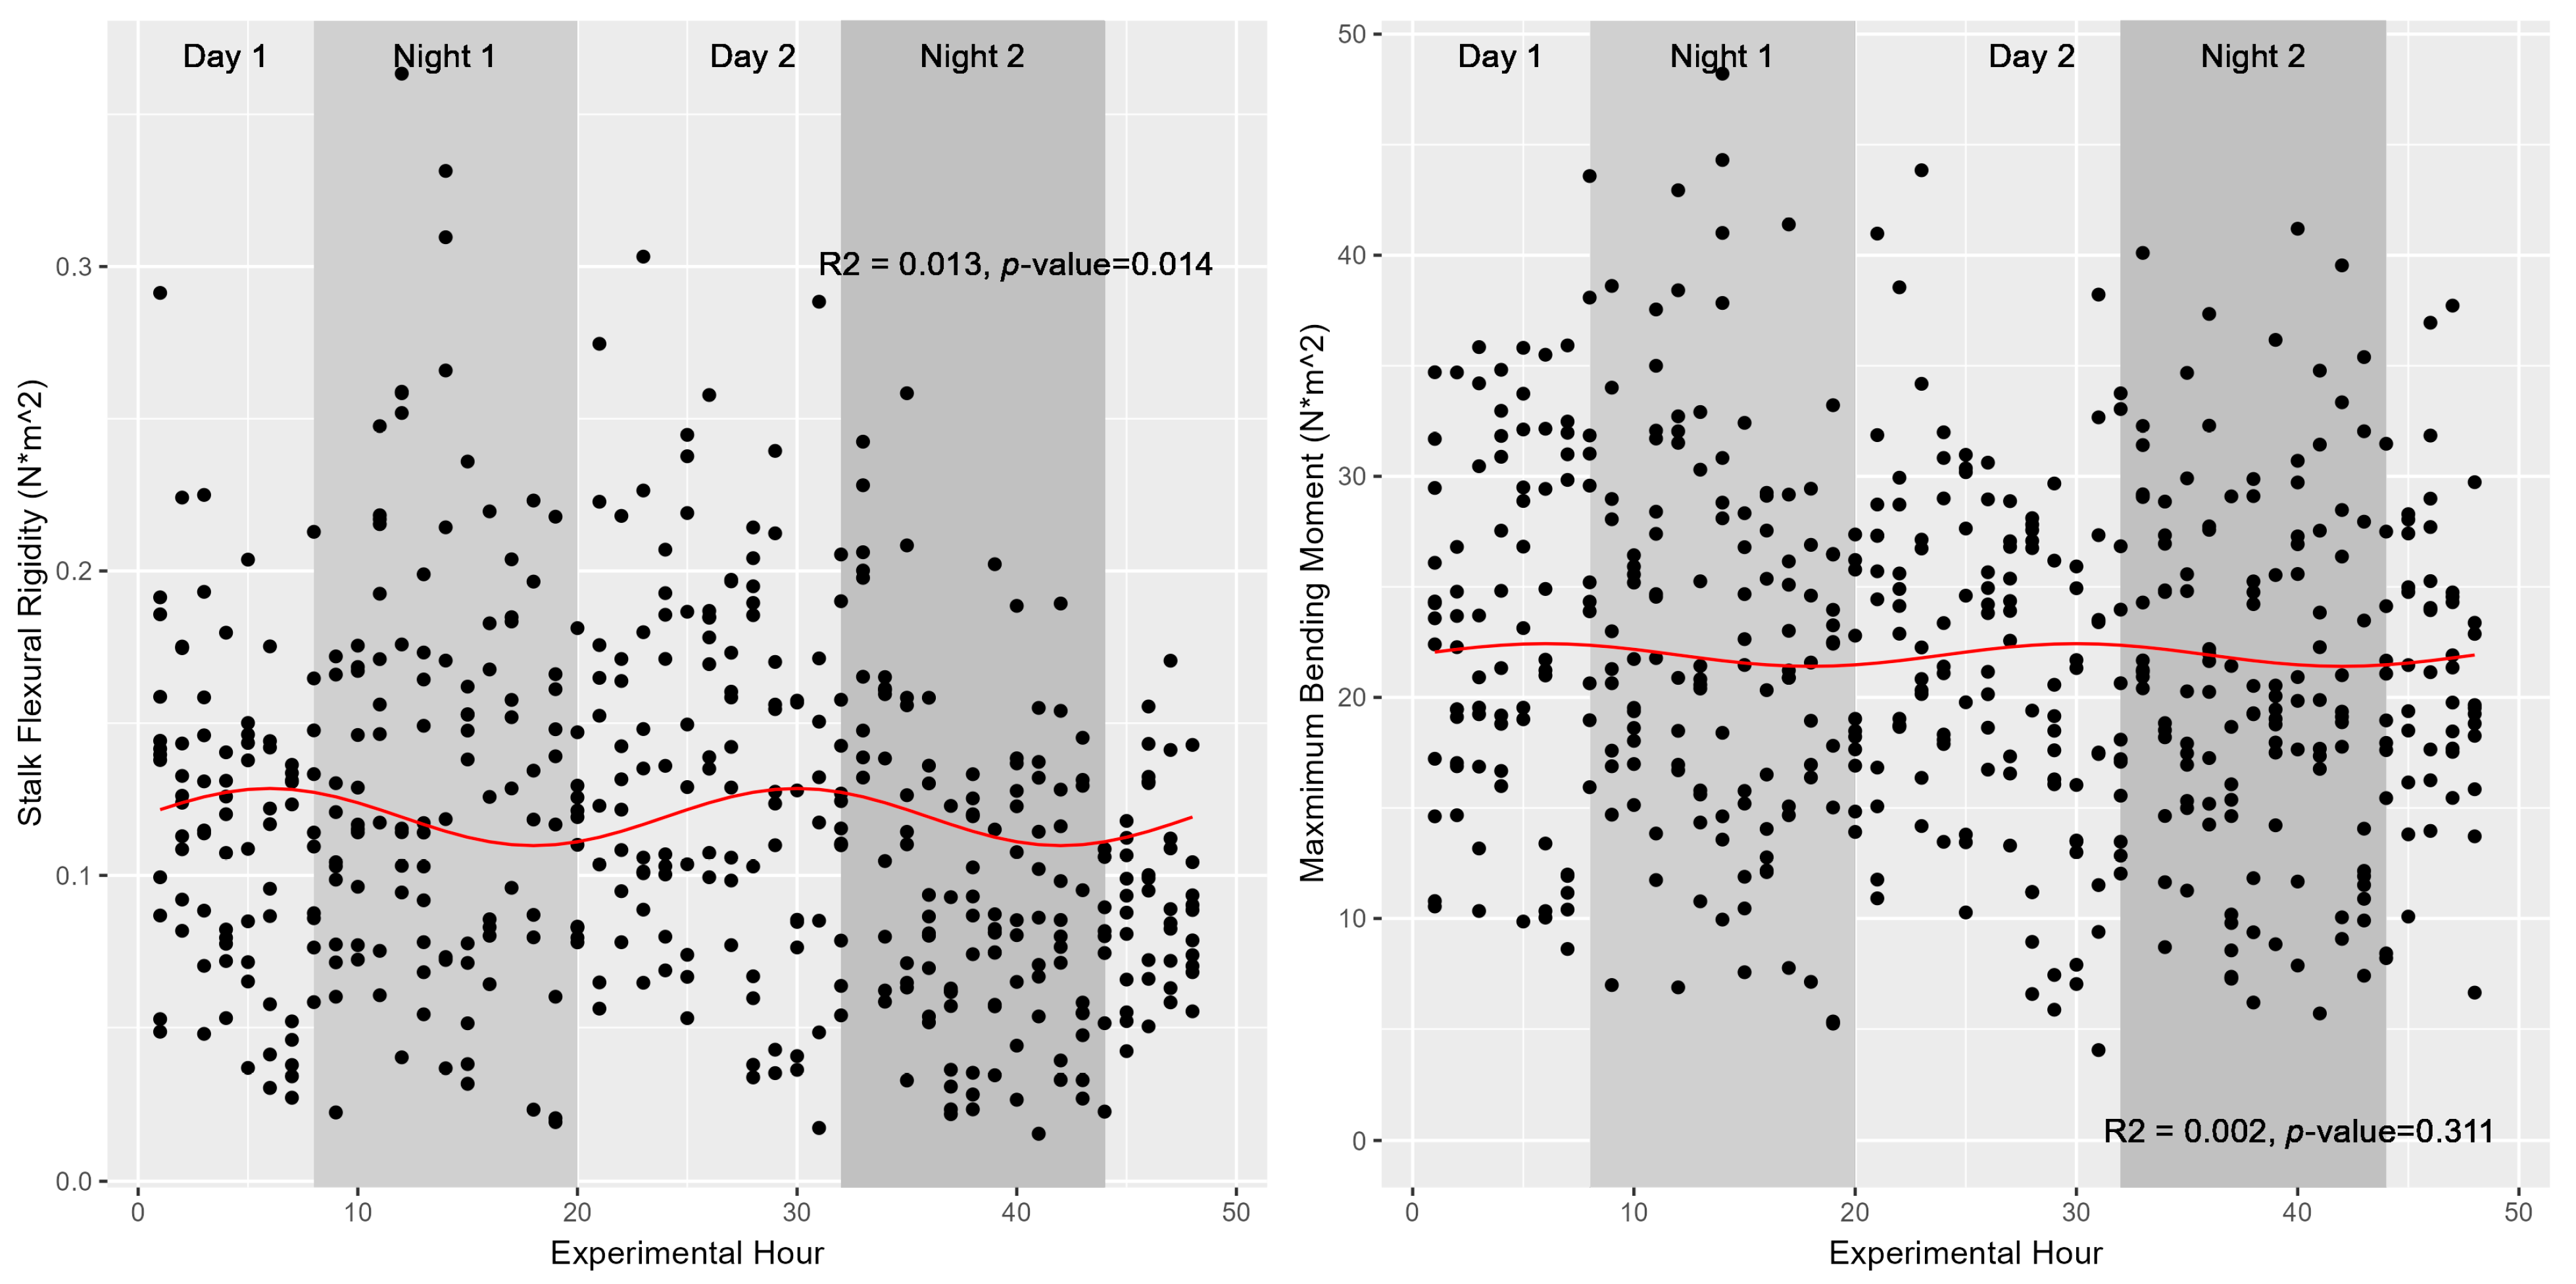
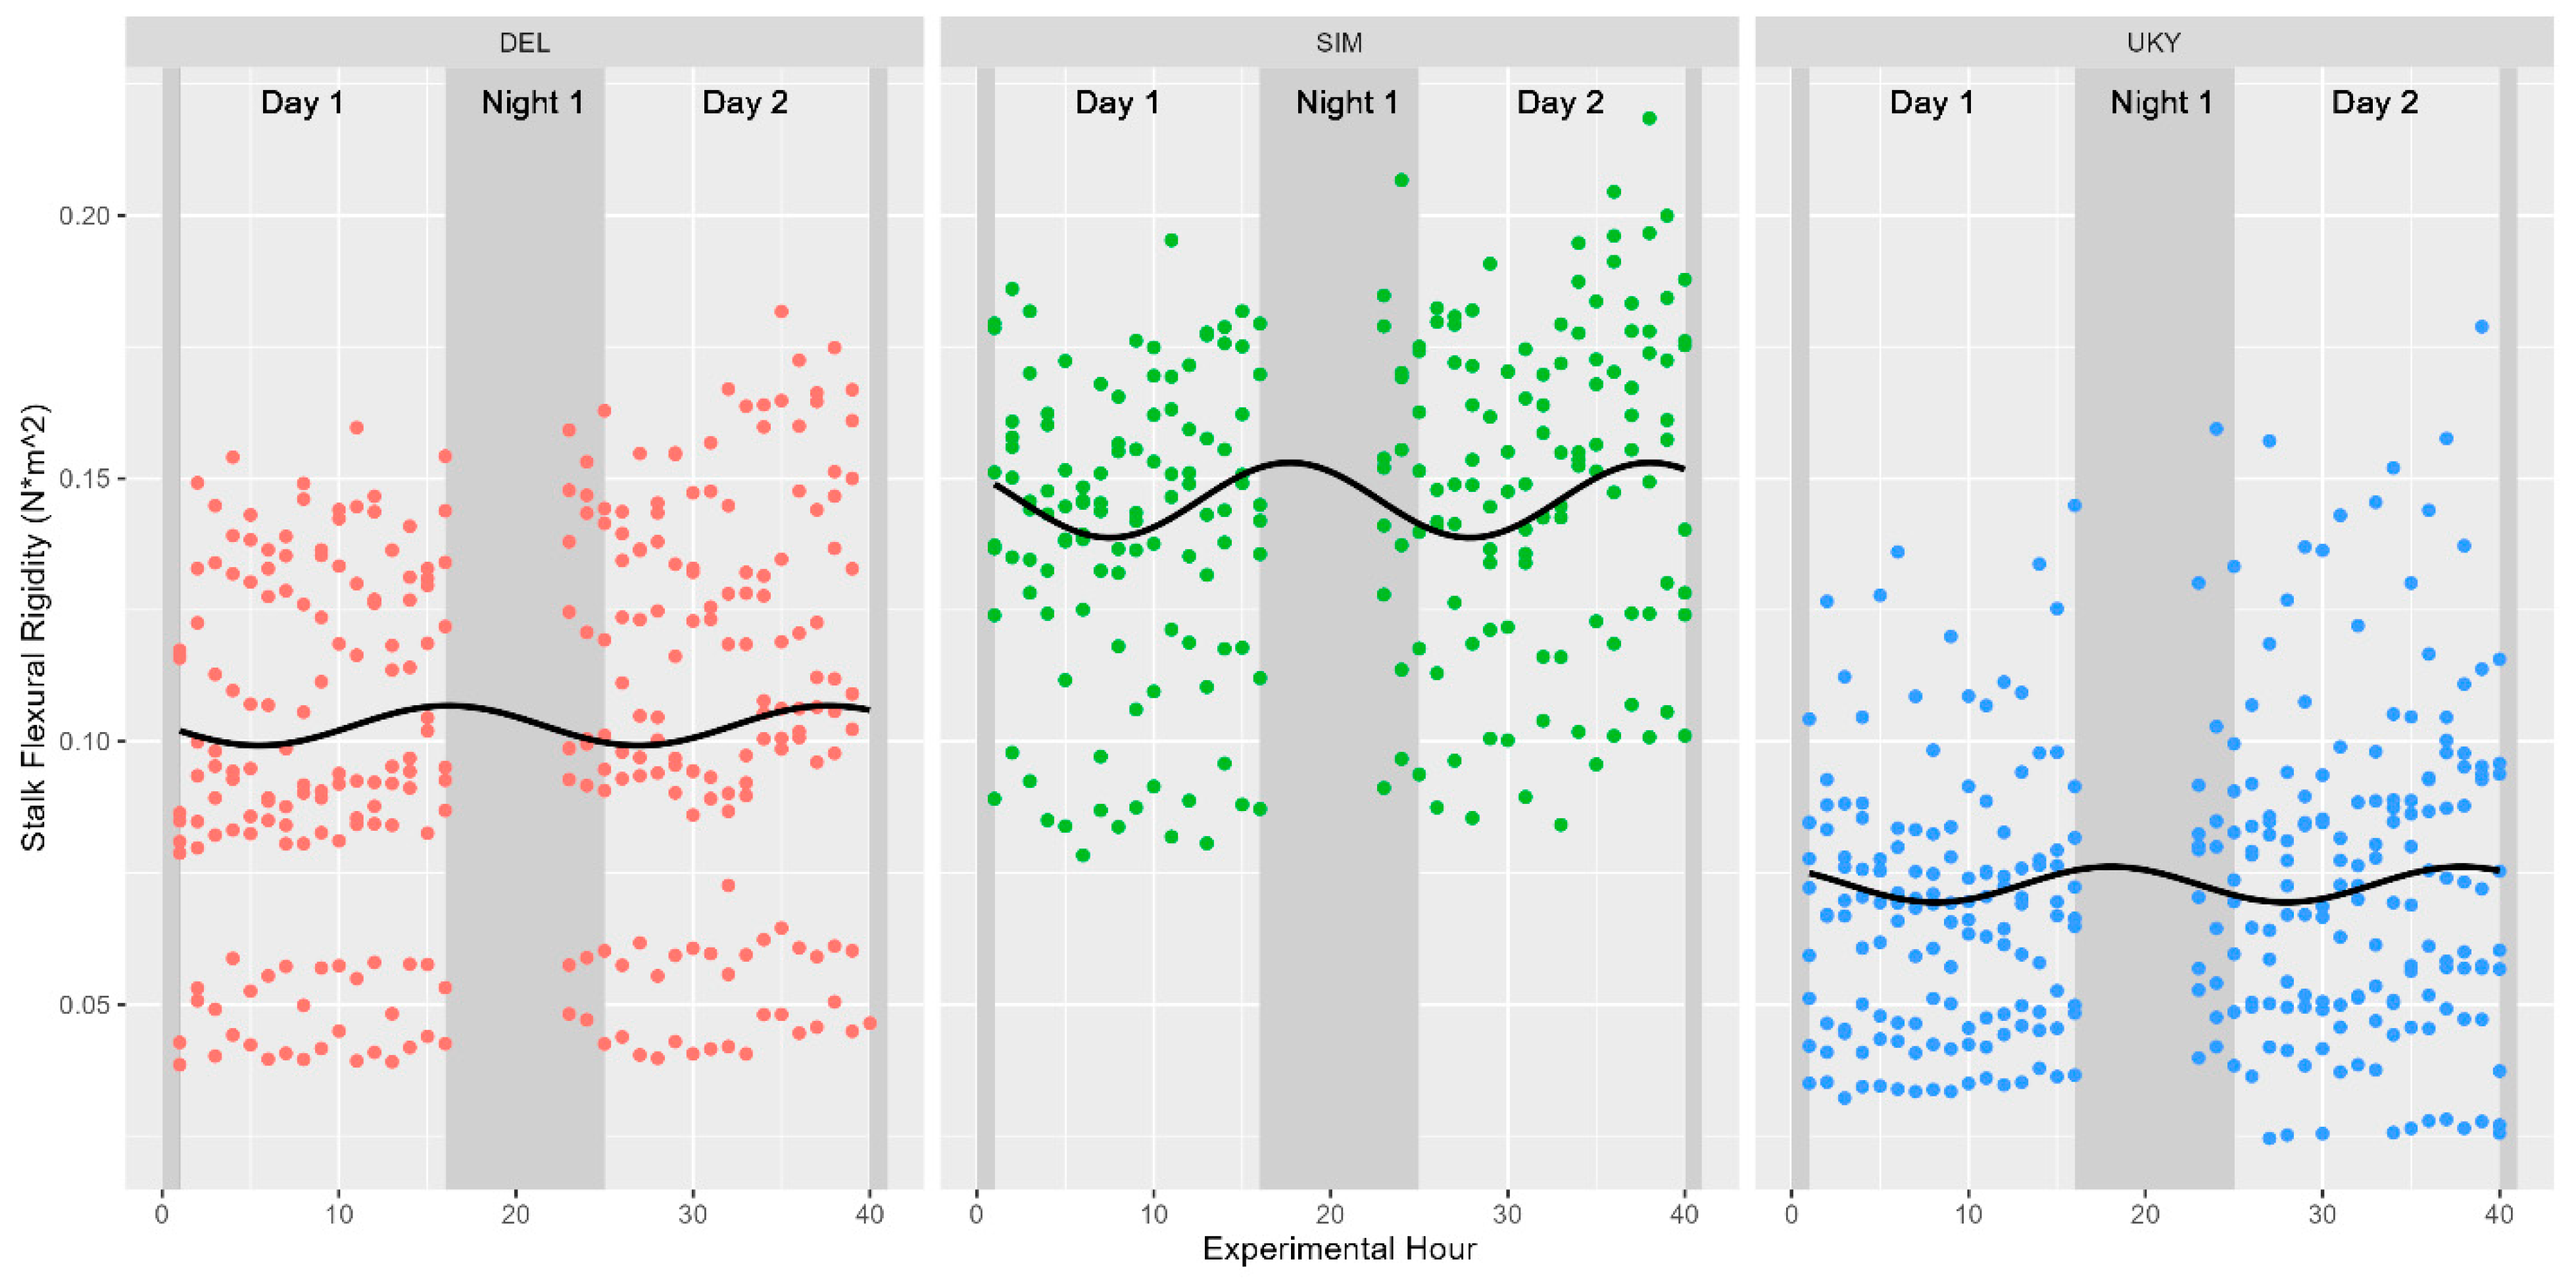
Although turgor status (as modeled either directly by turgor pressure in 2020 or indirectly by water potential in 2019) was shown to fluctuate significantly in a diurnal manner, neither stalk flexural stiffness nor the maximum bending moment (also known as stalk bending strength) were found to share these diurnal trends with the same magnitude. These relationships were again fitted against a sinusoidal function modelled as either Stalk Flexural Stiffness~sin(2 × pi × Time/24) or Time was replaced with either Turgor pressure in 2020 or Water Potential in 2019. None of the models were able to explain more than 5% of the variation in stalk flexural rigidity given sinusoidal variations in either time or turgor status (Table 1). Figure 4 depicts these associations graphically, highlighting the marginal utility of ToD or turgor status in predicting stalk flexural stiffness or stalk bending strength for the population of 514 individual stalks of Simon sweet sorghum stalks examined in 2019. Figure 5 depicts similar findings across the three varieties tested at earlier developmental stages in 2020. Our results suggest ToD is a better predictor of stalk flexural stiffness compared to stalk turgor status; however, only 1–5% of the variation in flexural stiffness is explained by either metric. Stalk bending strength (maximum bending moment), however, was not significantly associated with ToD, returning a p-value of 0.31 (Figure 4). Our results indicate that while there is statistical evidence supporting a link between the diurnal cycle of turgor status and stalk flexural rigidity in sweet sorghum, the practical relevance of this connection, given the low explanatory power, remains questionable. As such, additional factors beyond ToD, water potential, or turgor pressure are likely major contributors to variations in stalk flexural stiffness. Further, despite testing at earlier developmental stages in 2020, neither turgor pressure nor ToD appear to contribute meaningfully to observed variations in stalk flexural stiffness, suggesting that these metrics do not regulate stalk strength/stiffness at either late vegetative or fully physiological maturity in sweet sorghum.

Table 1.
Summary stats of sinusoidal associations between time, water potential, and turgor pressure on stalk flexural stiffness as observed in different cultivars of sweet sorghum.
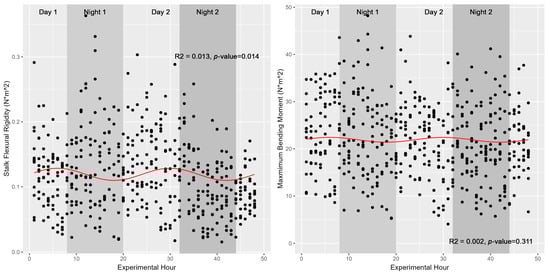
Figure 4.
Diurnal variations in stalk stiffness and bending strength. Plotted values represent hourly measures of Simon stalk stiffness (left) and stalk maximum bending moment (right). Nighttime hours are depicted with a shaded background. While stalk stiffness varies significantly as a function of ToD (p-value 0.014), this association is marginal at best and explains only ~1.3% of the variation in stiffness across the 480 individuals measured.
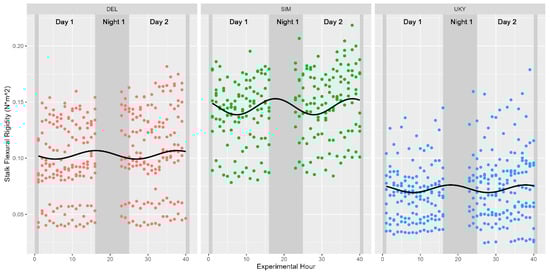
Figure 5.
Diurnal variations in stalk flexural stiffness for cultivars examined in 2020. Cultivars are depicted in separate facets, a sinusoidal best-fit line is appended to each data subset, and nighttime hours are indicated with a darker background. None of the cultivars tested in 2020 were found to be significantly associated with either ToD or turgor pressure at a p-value < 0.05.
3.4. Stalk Flexural Stiffness Has the Potential to Be Diminished during Nighttime Hours
Observations across three fully mature cultivars of sweet sorghum in 2019 rarely suggested significant differences between daytime and nighttime measures of stalk flexural stiffness. Table 2 below expands upon this finding following t-test comparisons within individual cultivars. Despite larger sample sizes compared to hourly measures of flexural stiffness, none of the cultivars were found to be significant at a p-value below 0.01. All cultivars, however, displayed suggestive decreases in nighttime measures of stalk flexural rigidity. Further, historically the most lodging-resistant cultivar (644) was found to display the lowest differences between average daytime and nighttime measures of stalk flexural rigidity. These results, coupled with previous observations that stalk flexural stiffness is strongly linearly correlated with stalk bending strength, suggest that stalk bending strength appears to diminish at night, potentially making plants more vulnerable to external mechanical stresses during those evening hours [15].
Table 2.
Average daytime and nighttime measures of sweet sorghum stalk flexural stiffness. Significance was quantified through a comparison of daytime and nighttime measures of stalk flexural stiffness via a Student’s t-test.
3.5. Differences in Flexural Stiffness between Different Developmental Stages Are Significant
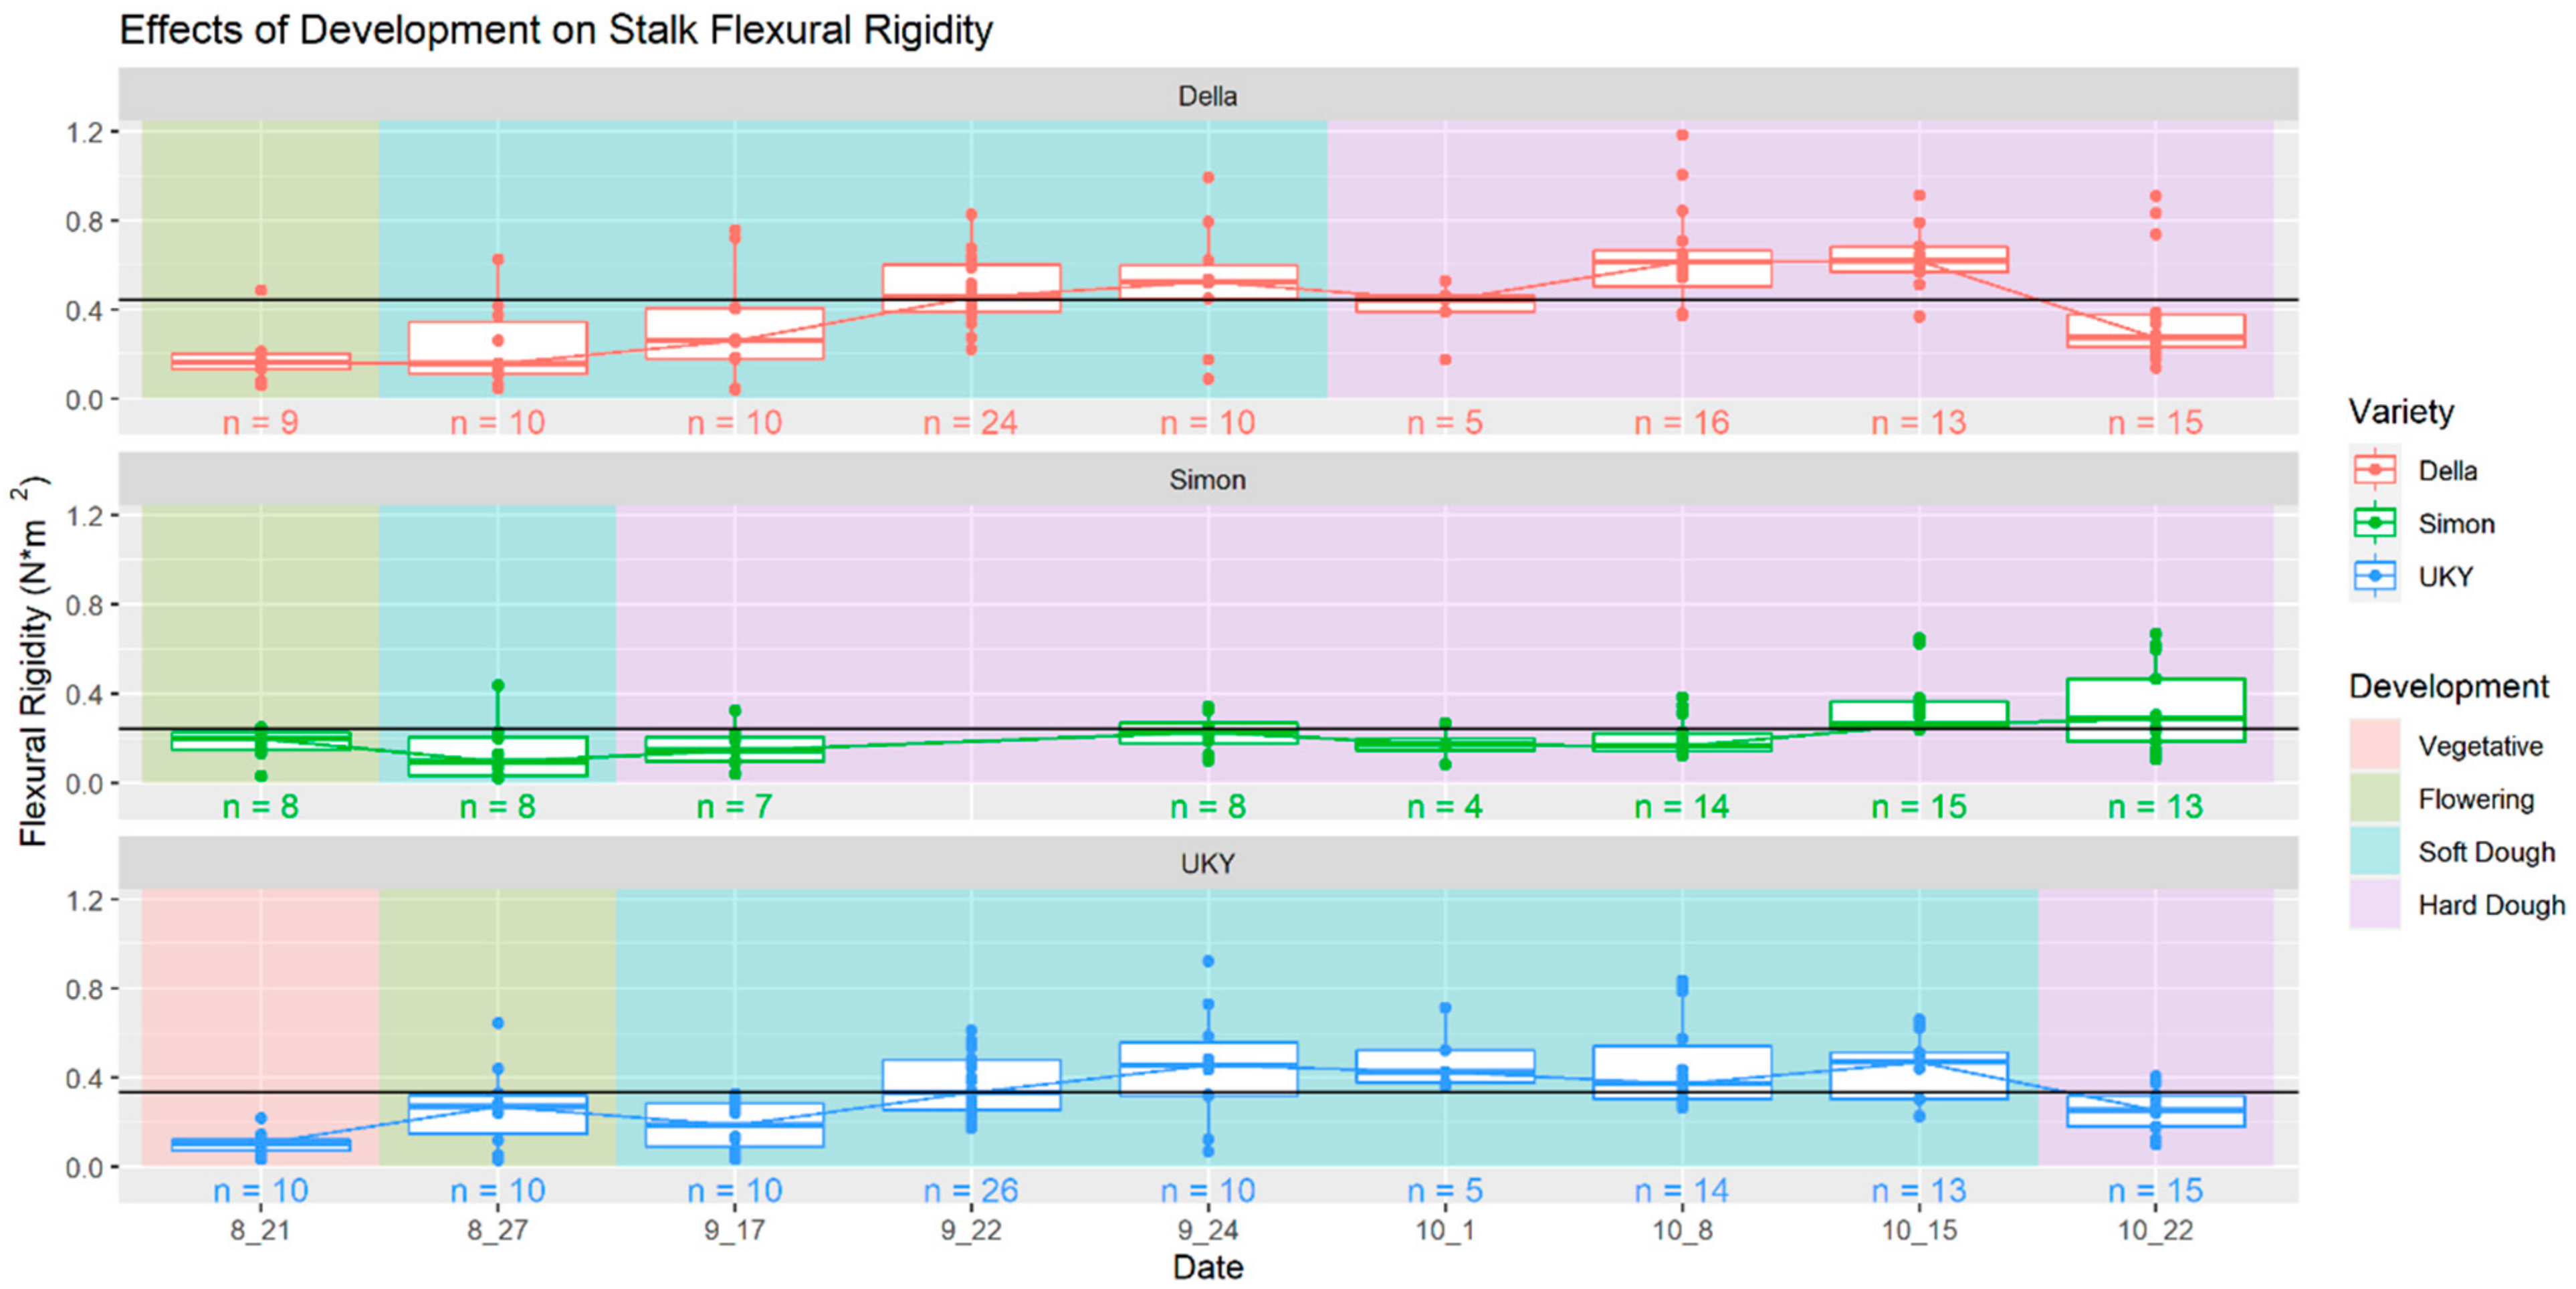
The assessments of stalk flexural rigidity across the final two months of crop growth period observed among three cultivars of sweet sorghum indicated a rise in stalk flexural stiffness associated with maturation and development. This trend appears to persist until a subsequent decline emerged, presumably associated with the onset of advanced senescence (Figure 6). This pattern builds upon earlier foundational studies in maize where similar associations were noted [28].
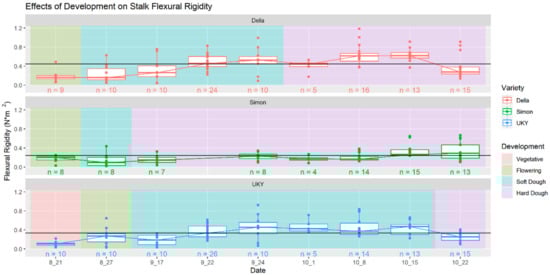
Figure 6.
Developmental trends in sweet sorghum stalk flexural stiffness. Across the three cultivars studied, stalk flexural stiffness tended to increase as stalk matured before declining after a peak approximately 140–145 days after planting.
Several mixed-effects models were fitted to our data to further study the effect of cultivar and development on stalk bending strength. A full model including both cultivar and testing date, as well as their interaction, was compared against sub models excluding interactions or individual fixed effects. An ANOVA, generated using the anova() function in R was used to compare sub models to the full model, revealing that the full model provided a significantly better fit than other models examined. The removal of the interaction between date and variety (Chisq = 29.69, df = 15, Pr(>Chisq) = 0.01309) indicated the importance of considering how different cultivars respond to developmental progression and aging. Further comparisons against models omitting cultivar (Chisq = 41.964, df = 17, Pr(>Chisq) = 0.0006788) or date effects (Chisq = 165.99, df = 23, Pr(>Chisq) < 2.2 × 10⁻¹⁶) underscored the significance both factors have, individually and in interaction, in influencing stalk flexural rigidity. These analyses support the conclusion that both the genetic background (cultivar) and the testing date, along with their interaction, are critical for understanding variations in stalk bending strength.
3.6. Panicle Weight, ToD, Maximum Bending Moment, and Stalk Density Are Better Linear and Non-Linear Predictors of Stalk Flexural Stiffness
To better determine the phenotypic predictors of stalk flexural stiffness, in addition to examining a sinusoidal model, we also examined more simple, univariate linear regression models for several secondary phenotypes. Analyzing p-values and associated R2 from these models, it was evident that certain phenotypes were statistically significantly associated with measures of stalk flexural stiffness, highlighting their potential as univariate, linear predictors. Table 3 below summarizes the metrics associated with these univariate models. Across all collected phenotypes, the maximum bending moment of a stalk is the most important predictor of stalk flexural stiffness. This is in line with previous findings and demonstrates that the strength of a stalk is directly related to its stiffness [15]. Both panicle weight and basal stalk density also returned p-values < 0.001, with R2 values of 0.1523 and 0.1653, respectively [29]. These results indicate that both phenotypes explain a larger proportion of the variation in stalk stiffness than even the 1–5% variation explained by the sinusoidal relationship between ToD and stalk stiffness.
Table 3.
Summary statistics of univariate associations between various secondary phenotypes potentially predictive of stalk lodging resistance and stalk stiffness.
Stalk water content, the maximum bending angle experienced by a stalk before failure, and the sugar content of individual stalks were all found to have p-values higher than 0.05, indicating that their relationships with stalk flexural stiffness might not be statistically significant in this dataset. It is worth noting that their R2 values are either negative or close to zero, thus accounting for little to no variance in stalk stiffness. The linear relationship between ToD and stalk flexural stiffness is statistically significant, as evidenced by its p-value of 0.014. However, the R2 value of 0.011 suggests that this relationship explains only a minor portion of the variance in stalk stiffness. Further, this correlation is comparable to values observed under a sinusoidal model, implying no substantial difference between the two.
As a final analysis, an extreme gradient boosted regression model (xgboost) was trained and evaluated to explore how non-linear relationships and interactions between predictors might lend themselves to improved insights (Table 4). Maximum bending moment was again the most important phenotype, representing 74.56% of the improvement in performance of the trained xgboost model. This aligns with the performance of the phenotype in prior univariate linear regression analysis. Similarly, panicle weight and stalk water content were again identified as important metrics in the xgboost model, supporting prior findings derived from univariate models. Notably, ToD and water potential were ranked higher in the xgboost model than univariate linear models, indicating that these diurnally varying phenotypes have complex relationships with stalk stiffness that may not be adequately captured by linear associations, highlighting the advantage of using algorithms like XGBoost to model such non-linear patterns.
Table 4.
Summary statistics of xgboost model. Secondary phenotypes potentially regulating stalk lodging resistance were included in the model to gauge their potential contributions to stalk flexural stiffness, our current proxy for stalk lodging resistance.
4. Discussion
Our study provides new insights into the complex relationship among the morphological and physiological characteristics of sweet sorghum and their influence on stalk flexural stiffness, a critical determinant of stalk lodging resistance. The analysis of the collected data covers observations across two growing years, three distinct cultivars, and spans several avenues of inspection including ToD, internal turgor status, stalk morphology, physiology, and stalk development. Contrary to previous results in maize, diurnal variations in turgor pressure, which we hypothesized to be a significant driver of stalk flexural stiffness, explain a relatively small fraction of the observed variance [18]. This finding is consistent with the complex physiology of plants, where multiple interacting factors may obscure the influence of turgor pressure on the mechanical properties of stalks [10,30,31]. Our results are particularly surprising given the significant diurnal fluctuation in turgor pressure observed, which changes at ranges spanning over an order of magnitude. While plant turgor status is, as expected, sensitive to the effects of ToD, ToD exhibited associations over 12× less predictive than conventional measurements of stalk lodging resistance—the maximum bending moment (or stalk bending strength) of an individual [16,32]. It should be noted that the results of this analysis were primarily based on flexural stiffness, which has previously been shown to be highly correlated with stalk bending strength [15].
The marginal association between stalk flexural stiffness and either ToD or turgor status suggests that other factors likely play more prominent roles in determining lodging resistance. Consequently, stalk Brix, panicle weight, and basal density were examined and queried for potential associations with increased stalk lodging resistance. Previously, a high stalk Brix was correlated with increased plant height in sweet sorghum, which is thought to increase lodging risk [33,34]. The findings of this study suggest that increases in stalk Brix within the same population are not significantly linearly or non-linearly associated with increased stalk flexural stiffness, our present metric to gauge stalk lodging resistance. These results suggest that stalk Brix does not play a significant role in directly altering stalk flexural stiffness, at least in the varieties under study in otherwise unstressed physiological states. Additional studies have also suggested that lower Brix and lower panicle weights might be associated with increases in lodging susceptible in grain sorghum likely due to reduced photosynthetic capacity in lodged plants [29,35]. In contrast to stalk Brix, increased panicle weight was found to be significantly, linearly associated with increased stalk flexural stiffness, explaining about 15% of the variation observed in stiffness and supporting previous theories that increased panicle weights might work to reinforce stalk structural elements, improving stalk lodging resistance [36,37]. Recent studies have shown that the basal dry weight of maize stalks is strongly correlated with both stalk bending strength and stalk lodging [38]. The observations collected in the present study further support this idea as the basal dry weight of our sweet sorghum stalks was able to explain about 17% of the variation in directly measured stalk flexural stiffness, higher even that the variation explained by the panicle weight of the same stalks. In summary, although neither ToD nor the turgor status of a plant are likely to explain a meaningful amount of the variation in stalk flexural stiffness, morphological features of stalks were shown to be useful predictors of stalk lodging resistance. Several of these findings are supported in a more comprehensive engineering study where stem linear density was shown to be a stronger predictor of stalk strength than several factors associated with stalk chemical composition or experimental design [39].
Our findings further suggest that stalk flexural stiffness potentially decreases at night. Although not statistically significant, the data note a clear trend across all cultivars examined, suggesting a possible vulnerability to lodging during nighttime hours. The agricultural implications of this vulnerability could be considerable, particularly in regions with strong nocturnal wind patterns. Furthermore, the significant changes in stiffness observed in our study across developmental stages align with earlier research indicating that plant maturation impacts stalk mechanical properties and lodging risk [28]. While this observation appears straightforward, it highlights the importance of timing harvest to avoid excessive risks of lodging during the final stages of cultivation when stalk strength is decreasing.
The present study leveraged straightforward linear models as well as more complex modeling alternatives to examine both simple and more complex interactions among the studied traits as they relate to stalk flexural stiffness. This approach revealed that, while simple linear regressions could identify panicle weight and stalk density as significant linear predictors of stalk flexural stiffness, the use of more complex non-linear modeling was necessary to accurately study the effects of ToD. While this association has previously been found to be significant using linear modelling in maize, our results suggest that non-linear modelling is more appropriate for this analysis and reveals that only about 5% of the variation in stalk stiffness is explained by ToD [18]. It should be noted that although both studies used the same instrument and methodology to measure stalk flexural stiffness, the 15–25% error in individual measurements suggest that for both studies, ToD would likely only explain a marginal amount of the variation in stalk stiffness in either crop studied [40].
5. Conclusions
ToD was found to have a significant, yet marginal effect on sweet sorghum stalk stiffness, a mechanical phenotype previously found to predict stalk lodging resistance. These associations were better modeled using non-linear methodology, with the trends approximately sinusoidal in nature. While direct measures of leaf turgor pressure were also significant, ToD was a better explainer of stiffness than leaf turgor pressure. Stalk bending strength was the best predictor of stalk flexural stiffness, explaining >70% of the variation in measures of stalk stiffness with a p-value < 0.001. Secondary phenotypes such as panicle weight and basal dry weight were better linear predictors of stalk stiffness than ToD, significantly explaining 15.23% and 16.53% of the variation in measured stalk stiffness. Neither stalk Brix nor water content were found to be accurate predictors of sweet sorghum stalk stiffness. The broader implications of our work suggest that plant breeders may not need to consider ToD with the same urgency as previously suggested during mechanical phenotyping related to stalk lodging resistance. Our study also underscores the potential benefits of integrating machine learning with traditional plant physiology and breeding approaches to better predict and model complex traits.
Author Contributions
Conceptualization, N.B., D.J.R. and S.D.; methodology, N.B., D.J.R. and C.M.; software, N.B. and C.M.; validation, N.B., Z.S. and J.W.; formal analysis, N.B.; investigation, N.B., Z.S., J.W., J.S., W.S., B.K. and M.S.B.; resources, N.B. and J.S.; data curation, N.B.; writing—original draft preparation, N.B.; writing—review and editing, N.B., S.D., R.S.S., C.M., J.W., J.S., Z.S., B.K. and W.S.; visualization, N.B.; supervision, S.D. and J.S.; project administration, S.D.; funding acquisition, S.D., D.J.R. and R.S.S. All authors have read and agreed to the published version of the manuscript.
Funding
This work was funded in part by the National Science Foundation (Award #1826715) and the United States Department of Agriculture—Hatch cooperative agreement. Any opinions, findings, conclusions, or recommendations are those of the author(s) and do not necessarily reflect the view of the funding bodies.
Institutional Review Board Statement
Not applicable.
Data Availability Statement
Dataset available on request from the authors.
Conflicts of Interest
The authors declare no conflicts of interest.
References
- Flint-Garcia, S.A.; Jampatong, C.; Darrah, L.L.; McMullen, M.D. Quantitative Trait Locus Analysis of Stalk Strength in Four Maize Populations. Crop Sci. 2003, 43, 13. [Google Scholar] [CrossRef]
- Kunduru, B.; Kumar, R.; Brar, M.S.; Stubbs, C.J.; Tabaracci, K.; Bokros, N.T.; Bridges, W.C.; Cook, D.D.; DeBolt, S.; McMahan, C.S.; et al. Unveiling the phenotypic landscape of stalk lodging resistance in diverse maize hybrids. Field Crops Res. 2023, 304, 109168. [Google Scholar] [CrossRef]
- Robertson, D.J.; Julias, M.; Lee, S.Y.; Cook, D.D. Maize Stalk Lodging: Morphological Determinants of Stalk Strength. Crop Sci. 2017, 57, 926–934. [Google Scholar] [CrossRef]
- Robertson, D.J.; Julias, M.; Gardunia, B.W.; Barten, T.; Cook, D.D. Corn Stalk Lodging: A Forensic Engineering Approach Provides Insights into Failure Patterns and Mechanisms. Crop Sci. 2015, 55, 2833–2841. [Google Scholar] [CrossRef]
- Stubbs, C.J.; McMahan, C.S.; Tabaracci, K.; Kunduru, B.; Sekhon, R.S.; Robertson, D.J. Cross-sectional geometry predicts failure location in maize stalks. Plant Methods 2022, 18, 56. [Google Scholar] [CrossRef] [PubMed]
- Shah, D.U.; Reynolds, T.P.; Ramage, M.H. The strength of plants: Theory and experimental methods to measure the mechanical properties of stems. J. Exp. Bot. 2017, 68, 4497–4516. [Google Scholar] [CrossRef] [PubMed]
- Beauzamy, L.; Nakayama, N.; Boudaoud, A. Flowers under pressure: Ins and outs of turgor regulation in development. Ann. Bot. 2014, 114, 1517–1533. [Google Scholar] [CrossRef]
- Frensch, J.; Hsiao, T.C. Transient Responses of Cell Turgor and Growth of Maize Roots as Affected by Changes in Water Potential. Plant Physiol. 1994, 104, 247–254. [Google Scholar] [CrossRef] [PubMed]
- Michelena, V.A.; Boyer, J.S. Complete Turgor Maintenance at Low Water Potentials in the Elongating Region of Maize Leaves. Plant Physiol. 1982, 69, 1145–1149. [Google Scholar] [CrossRef]
- Ali, O.; Cheddadi, I.; Landrein, B.; Long, Y. Revisiting the relationship between turgor pressure and plant cell growth. New Phytol. 2023, 238, 62–69. [Google Scholar] [CrossRef] [PubMed]
- Malivert, A.; Erguvan, Ö.; Chevallier, A.; Dehem, A.; Friaud, R.; Liu, M.; Martin, M.; Peyraud, T.; Hamant, O.; Verger, S. FERONIA and microtubules independently contribute to mechanical integrity in the Arabidopsis shoot. PLoS Biol. 2021, 19, e3001454. [Google Scholar] [CrossRef] [PubMed]
- Verger, S.; Long, Y.; Boudaoud, A.; Hamant, O. A tension-adhesion feedback loop in plant epidermis. eLife 2018, 7, e34460. [Google Scholar] [CrossRef] [PubMed]
- Acevedo, E.; Fereres, E.; Hsiao, T.C.; Henderson, D.W. Diurnal Growth Trends, Water Potential, and Osmotic Adjustment of Maize and Sorghum Leaves in the Field. Plant Physiol. 1979, 64, 476–480. [Google Scholar] [CrossRef] [PubMed]
- Pritchard, J.; Tomos, A.D.; Farrar, J.F.; Minchin, P.E.H.; Gould, N.; Paul, M.J.; MacRae, E.A.; Ferrieri, R.A.; Gray, D.W.; Thorpe, M.R. Turgor, solute import and growth in maize roots treated with galactose. Funct. Plant Biol. 2004, 31, 1095. [Google Scholar] [CrossRef] [PubMed]
- Robertson, D.J.; Lee, S.Y.; Julias, M.; Cook, D.D. Maize Stalk Lodging: Flexural Stiffness Predicts Strength. Crop Sci. 2016, 56, 1711–1718. [Google Scholar] [CrossRef]
- Sekhon, R.S.; Joyner, C.N.; Ackerman, A.J.; McMahan, C.S.; Cook, D.D.; Robertson, D.J. Stalk Bending Strength is Strongly Associated with Maize Stalk Lodging Incidence Across Multiple Environments. Field Crops Res. 2020, 249, 107737. [Google Scholar] [CrossRef]
- Erndwein, L.; Cook, D.D.; Robertson, D.J.; Sparks, E.E. Field-based mechanical phenotyping of cereal crops to assess lodging resistance. Appl. Plant Sci. 2020, 8, e11382. [Google Scholar] [CrossRef] [PubMed]
- Reneau, J.W.; Khangura, R.S.; Stager, A.; Erndwein, L.; Weldekidan, T.; Cook, D.D.; Dilkes, B.P.; Sparks, E.E. Maize brace roots provide stalk anchorage. Plant Direct 2020, 4, e00284. [Google Scholar] [CrossRef] [PubMed]
- Paul-Victor, C.; Rowe, N. Effect of mechanical perturbation on the biomechanics, primary growth and secondary tissue development of inflorescence stems of Arabidopsis thaliana. Ann. Bot. 2011, 107, 209–218. [Google Scholar] [CrossRef]
- Blitzer, M.J. AGR-122: Production of Sweet Sorghum for Syrup in Kentucky. Available online: http://www2.ca.uky.edu/agc/pubs/agr/agr122/agr122.pdf (accessed on 21 March 2024).
- Turner, N.C. Techniques and experimental approaches for the measurement of plant water status. Plant Soil. 1981, 58, 339–366. [Google Scholar] [CrossRef]
- Hernández-Hernández, V.; Benítez, M.; Boudaoud, A. Interplay between turgor pressure and plasmodesmata during plant development. J. Exp. Bot. 2019, 71, erz434. [Google Scholar] [CrossRef] [PubMed]
- Cook, D.D.; De La Chapelle, W.; Lin, T.-C.; Lee, S.Y.; Sun, W.; Robertson, D.J. DARLING: A device for assessing resistance to lodging in grain crops. Plant Methods 2019, 15, 102. [Google Scholar] [CrossRef] [PubMed]
- Tabaracci, K.; Bokros, N.; Oduntan, Y.; Kunduru, B.; DeKold, J.; Mengistie, E.; McDonald, A.G.; Stubbs, C.; Sekhon, R.S.; DeBolt, S.; et al. Biomechanical Phenotyping Pipeline for Stalk Lodging Resistance in Maize. MethodsX 2024, 12, 102562. [Google Scholar] [CrossRef] [PubMed]
- Bates, D.; Mächler, M.; Bolker, B.; Walker, S. Fitting Linear Mixed-Effects Models Using lme4. J. Stat. Soft. 2015, 67, 1–48. [Google Scholar] [CrossRef]
- Chen, T.; Guestrin, C. XGBoost: A Scalable Tree Boosting System. In Proceedings of the 22nd ACM SIGKDD International Conference on Knowledge Discovery and Data Mining, San Francisco, CA, USA, 13–17 August 2016; pp. 785–794. Available online: https://dl.acm.org/doi/10.1145/2939672.2939785794 (accessed on 1 March 2024).
- Simmons, L.F. Time-series decomposition using the sinusoidal model. Int. J. Forecast. 1990, 6, 485–495. [Google Scholar] [CrossRef]
- Hale, J.; Webb, S.; Hale, N.; Stubbs, C.; Cook, D. Assessing axial and temporal effects of the leaf sheath on the flexural stiffness of large-grain stems. Crop Sci. 2023, 63, 822–832. [Google Scholar] [CrossRef]
- Stubbs, C.J.; Oduntan, Y.A.; Keep, T.R.; Noble, S.D.; Robertson, D.J. The effect of plant weight on estimations of stalk lodging resistance. Plant Methods 2020, 16, 128. [Google Scholar] [CrossRef] [PubMed]
- Zimmermann, U.; Steudle, E. Physical Aspects of Water Relations of Plant Cells. In Advances in Botanical Research; Elsevier: Amsterdam, The Netherlands, 1979; Volume 6, pp. 45–117. Available online: https://linkinghub.elsevier.com/retrieve/pii/S0065229608603298 (accessed on 12 June 2024)ISBN 978-0-12-005906-5.
- Stubbs, C.J.; Larson, R.; Cook, D.D. Maize stalk stiffness and strength are primarily determined by morphological factors. Sci. Rep. 2022, 12, 720. [Google Scholar] [CrossRef] [PubMed]
- Riboldi, L.B.; Oliveira, R.F.; Angelocci, L.R. Leaf turgor pressure in maize plants under water stress. Aust. J. Crop Sci. 2016, 10, 878–886. [Google Scholar] [CrossRef]
- Murray, S.C.; Rooney, W.L.; Hamblin, M.T.; Mitchell, S.E.; Kresovich, S. Sweet Sorghum Genetic Diversity and Association Mapping for Brix and Height. Plant Genome 2009, 2, 48–62. [Google Scholar] [CrossRef]
- Stubbs, C.J.; Kunduru, B.; Bokros, N.; Verges, V.; Porter, J.; Cook, D.D.; DeBolt, S.; McMahan, C.; Sekhon, R.S.; Robertson, D.J. Moving toward short stature maize: The effect of plant height on maize stalk lodging resistance. Field Crops Res. 2023, 300, 109008. [Google Scholar] [CrossRef]
- Mizuno, H.; Kasuga, S.; Kawahigashi, H. Root lodging is a physical stress that changes gene expression from sucrose accumulation to degradation in sorghum. BMC Plant Biol. 2018, 18, 2. [Google Scholar] [CrossRef] [PubMed]
- Shah, L.; Yahya, M.; Shah, S.M.A.; Nadeem, M.; Ali, A.; Ali, A.; Wang, J.; Riaz, M.W.; Rehman, S.; Wu, W.; et al. Improving Lodging Resistance: Using Wheat and Rice as Classical Examples. Int. J. Mol. Sci. 2019, 20, 4211. [Google Scholar] [CrossRef] [PubMed]
- Yadav, S.; Singh, U.M.; Naik, S.M.; Venkateshwarlu, C.; Ramayya, P.J.; Raman, K.A.; Sandhu, N.; Kumar, A. Molecular Mapping of QTLs Associated with Lodging Resistance in Dry Direct-Seeded Rice (Oryza sativa L.). Front. Plant Sci. 2017, 8, 1431. [Google Scholar] [CrossRef] [PubMed]
- Jin, R.; Li, Z.; Wang, X.; Liu, F.; Kong, F.; Liu, Q.; Lan, T.; Feng, D.; Yuan, J. Optimizing Row Spacing Increases Stalk Lodging Resistance by Improving Light Distribution in Dense Maize Populations. Agronomy 2023, 13, 462. [Google Scholar] [CrossRef]
- Robertson, D.J.; Brenton, Z.W.; Kresovich, S.; Cook, D.D. Maize lodging resistance: Stalk architecture is a stronger predictor of stalk bending strength than chemical composition. Biosyst. Eng. 2022, 219, 124–134. [Google Scholar] [CrossRef]
- DeKold, J.; Robertson, D. Experimental error analysis of biomechanical phenotyping for stalk lodging resistance in maize. Sci. Rep. 2023, 13, 12178. [Google Scholar] [CrossRef] [PubMed]
Disclaimer/Publisher’s Note: The statements, opinions and data contained in all publications are solely those of the individual author(s) and contributor(s) and not of MDPI and/or the editor(s). MDPI and/or the editor(s) disclaim responsibility for any injury to people or property resulting from any ideas, methods, instructions or products referred to in the content. |
© 2024 by the authors. Licensee MDPI, Basel, Switzerland. This article is an open access article distributed under the terms and conditions of the Creative Commons Attribution (CC BY) license (https://creativecommons.org/licenses/by/4.0/).