Article

The Effects of Dietary Resveratrol and β-Hydroxy-β-Methylbutyric Acid Supplementation at Two Protein Levels on the Ruminal Microbiome and Metabolome of Tibetan Sheep

College of Agriculture and Animal Husbandry, Qinghai University, Xining 810016, China
*
Author to whom correspondence should be addressed.
These authors contributed equally to this work.
Agriculture 2024, 14(6), 936; https://doi.org/10.3390/agriculture14060936
Submission received: 10 May 2024 / Revised: 10 June 2024 / Accepted: 10 June 2024 / Published: 14 June 2024
(This article belongs to the Section Farm Animal Production)

Abstract

:
Resveratrol (RES) and β-hydroxy-β-methylbutyric acid (HMB) have antioxidant, anti-inflammatory, and other beneficial properties. Here, we hypothesize that supplementation with RES and HMB could affect the rumen function in Tibetan sheep. This study aims to explore the effects of RES and HMB supplementation at different protein levels on the rumen microbial and metabolite compositions of Tibetan sheep. Four treatments (n = 30) were prepared according to a 2 × 2 factorial arrangement, with two dietary protein levels (12% and 14%) and two feed additives (RES 1.50 g/day and HMB 1.25 g/day). The experimental treatments were fed diets with 12% CP level non-supplemented (L), 12% protein with RES and HMB (L-RES-HMB), 14% CP level non-supplemented (H), and 14% protein with RES and HMB (H-RES-HMB), respectively. Our results indicated that the trypsin, chymotrypsin, and lipase were significantly increased in the H-RES-HMB group (p < 0.05), while the lipopolysaccharide (LPS) concentration was significantly reduced (p < 0.05). The alpha diversity analysis found that the ACE indices of the L-RES-HMB, and H-RES-HMB groups was significantly higher than that of the L group (p < 0.05). Additionally, compared with the L, L-RES-HMB, and H groups, it was found that the abundance of Euryarchaeota, Spirochaeota, and Metanobrevibacter was significantly increased in the H-RES-HMB group, while the abundance of Proteobacteria was significantly decreased (p < 0.05). A total of 745 significantly different metabolites were identified, of which 14 metabolites were common among the three comparative groups. Differential metabolites were mainly enriched in pathways including the pyrimidine metabolism, the glycine, serine, and threonine metabolisms, and ABC transporters. Overall, CP level and RES/HMB exhibited positively interaction effect on digestive enzyme activity and antioxidant capacity. Dietary RES and HMB supplementation on 14% CP level improved the ruminal digestive enzyme activity and antioxidant capacity through modulating the microbial community and regulating the metabolism.

1. Introduction

Tibetan sheep are mainly distributed on the Tibetan Plateau [1]. Currently, the mode of feeding of Tibetan sheep is gradually transitioning from traditional grazing to intensive feeding [2]. This transition not only protects the ecological environment, but also significantly increases the overall sheep numbers within a short time [3]. In addition, the meat of the Tibetan sheep has both a delicate flavor and texture, and also provides the nomadic pastoralists with basic resources, including meat, milk, and wool [4], thus playing an irreplaceable role in local economic and social development.
The rumen is an anaerobic microbial ecosystem inhabited by complex microbial populations [5], and is the major site of nutrient digestion and absorption in ruminants [6]. Rumen microorganisms are considered to be the “second genome” of the host, and are capable of converting plant polysaccharides (such as starch, xylan, and cellulose) into the carbohydrates and proteins required by the host [7,8]. Metabolites are the final products of biochemical reactions occurring in the rumen microbiota, and their production is extremely sensitive to changes in the rumen microbes [9]. Approximately 55 to 60% of metabolites in the rumen fluid are derived from microbial communities [10]. Therefore, a better understanding of the composition of the rumen microbial communities is essential for ruminant health [11].
The resveratrol (RES) is a naturally occurring polyphenol found in plants that has antioxidant, anti-inflammatory, and antibacterial properties [12,13]. In calves, supplementing them with RES increased the desulfovibrio population, whereas it decreased the methanogenic archaea population, thereby affecting the ruminal bacterial community [14]. In addition, the population of Fibrobacter succinogenes, Ruminococcus albus, and Butyrivibrio fibrisolvens was greater in sheep treated with RES [15]. As a leucine metabolite, beta-hydroxy-beta-methylbutyrate (HMB) is widely used in human nutrition and animal production as a nutritional supplement, and plays an essential role in fermentation parameter and microbial diversity in rumen [16]. Treating the cow with HMB increased the ruminal abundance of F. succinogenes and R. flavefaciens [17]. The supplementation of HMB and dl-Met promoted the rumen bacterial growth via producing volatile fatty acids (VFA) in vitro [18]. However, there is little comparative research on the effects of RES and HMB supplementation on ruminal microflora and metabolites of Tibetan sheep.
Previously, the effect of dietary supplementation with RES and HMB alone or in combination with growth performance, carcass traits, and diet digestibility were evaluated in Tibetan sheep. Our results indicated that feeding RES at 1.50 g/d and HMB at 1.25 g/day may be recommended to benefit growth performance and feed-to-gain ratio. Additionally, the interaction of RES and HMB supplementation exhibited a greater positive effect on growth performance and feed-to-gain ratio. According to the regulatory function on ruminal bacterial community, we hypothesized that supplementation with RES and HMB could affect the rumen health in Tibetan sheep. Therefore, the aim of this study was to explore the effects of dietary RES and HMB supplementation at two protein levels on the digestive enzyme activity, antioxidant capacity, and LPS concentration in the rumens of Tibetan sheep.

2. Materials and Methods

This experimental study was approved by the Institutional Animal Care and Use Committee of Qinghai University (license number: QUA-2020-0710).

2.1. Experimental Design

One hundred and twenty healthy Tibetan ram lambs with an initial mean weight of 16.87 ± 0.31 kg (2 months old) were randomly selected from a commercial Tibetan sheep farm (Haiyan, Qinghai, China). Four treatments (n = 30) were prepared according to a 2 × 2 factorial arrangement, with two dietary protein levels (12% and 14%) and two levels of feed additives (RES 1.50 g/day and HMB 1.25 g/day). Each of the four dietary treatments was offered to six replicate pens (five lambs per pen). The experimental treatments fed the diets with 12% CP level non-supplemented (L), 12% protein with RES and HMB (L-RES-HMB), 14% CP level non-supplemented (H), and 14% protein with RES and HMB (H-RES-HMB), respectively. The RES (purity > 99%) used in this experiment was purchased from Xi’an grass plant technology Co., Ltd. (Xi’an, China). HMB (purity > 99%) was purchased from TSI Group Co., Ltd. (Shanghai, China). Both RES and HMB were firstly added to the premix, and then directly mixed with concentrates.
The three feedstuffs were prepared from a total mix with 30% forage and 70% concentrates on a dry matter basis. The roughage contained 50% oat hay and 50% oat silage. The composition of the basic diet and nutrient levels are shown in Table 1. The fattening program was continued for 100 days (including 10 days for the pre-test and 90 days for the test period). During the experimental period, the daily ration was divided into two equal meals which were given to each individual at 7:00 and 13:00. All the sheep had access to fresh water ad libitum. At the end of this period, six Tibetan sheep in each treatment (one Tibetan sheep per replicate) were randomly selected for slaughter.

2.2. Sample Collection and Processing

The rumen content was filtered through four layers of gauze, and the rumen fluid was collected in sterile enzyme-free freezing tubes. The samples were immediately inserted in dry ice and stored at −80 °C before DNA extraction, metabolite extraction, 16S rDNA sequencing, and subsequent microbial quantification. A total of 24 Tibetan sheep rumen-fluid samples were collected.

2.3. Determination of Digestive Enzyme Activity, Antioxidant Capacity, and (LPS) Concentration

After thawing on ice, the rumen fluid samples were transferred to 15 mL centrifuge tubes and centrifuged at 3000 rpm for 20 min at 2–8 °C. The supernatants were collected, and the cellulase, lipase, α-amylase, trypsin, chymotrypsin, glutathione peroxidase (GSH-PX), superoxide dismutase (SOD), total antioxidant capacity (T-AOC), catalase (CAT), malate dehydrogenase (MDA), and LPS were determined using an enzyme-linked immunosorbent assay kit (Enzyme Immune Industrial Co., Ltd., Nanjing, China), with absorbances read at 450 nm in a microplate reader.

2.4. DNA Extraction and 16S rDNA Gene Sequencing

Microbial DNA was extracted using the HiPure Stool DNA extraction kit (Magen, Guangzhou, China). The V3-V4 region of the 16S rRNA gene was amplified using the universal primer sequences 341F (5′-CCTACGGGGNGGCWGCAG-3′) and 806R (5′-GGACTACHVGGGGTATCTAAT-3′). The amplification conditions were 95 °C for 5 min, followed by 30 cycles of 95 °C for 1 min, 60 °C for 1 min, 72 °C for 1 min, and finally 72 °C for 7 min. Sequencing libraries were prepared using the Illumina DNA Prep Kit (Illumina, San Diego, CA, USA). Raw data were uploaded to the NCBI Sequence Read Archive (SRA) database.
The raw tags of the sequences were subjected to read filtering (FASTP software, version 0.18.0 [19]), tag splicing (FLASH software, version 1.2.11 [20]), tag filtering, operational taxonomic unit (OTU) clustering (UPARSE algorithm of USEARCH software, version 9.2.64 [21]), and tag de-chimerization (UCHIME [22] algorithm of USEARCH software, version 2.0.1). The clean tags were clustered into OTUs with ≥97% similarity using the UPARSE algorithm (version 9.2.64), and tag chimeras were removed using the UCHIME algorithm. After obtaining the OTUs, OTU abundance, and other analyses of abundance were performed based on the effective tags.
Sequencing data were analyzed with OTU clustering using the amplicon sequence variants (ASV) method. Both phylum and genus were classified and analyzed using RDP Classifier software (version 2.2) with parameter thresholds ranging from 0.8 to 1, and the abundance statistics of the taxonomy were visualized using KRONA (version 2.6) [23]. Alpha diversity analyses were calculated in QIIME (version 1.9.1) [22] and consisted mainly of the Chao1, ACE, Shannon, and Simpson indices. The beta distance was calculated using the R language package Vegan (version 2.5.3) to analyze beta diversity using the non-parametric test Analysis of Similarities (Anosim). Bray–Curtis distance matrix dissimilarities were assessed and visualized using Principal Coordinate Analysis (PCoA) and plotted using the R “ggplot2” package (version 2.2.1) [24].

2.5. Metabolite Extraction and LC-MS/MS Analysis

The LC-MS/MS analyses were performed on an ultra-high performance liquid chromatography (UHPLC) system (1290 Infinity LC, Agilent Technologies, Santa Clara, CA, USA) coupled to a quadrupole time-of-flight (QTOF) (AB Sciex TripleTOF 6600, SCIEX, Framingham, MA, USA). The operating conditions included a Waters ACQUITY UPLC BEH (1.7 µm × 2.1 mm × 100 mm) chromatographic column at a column temperature of 25 °C, a flow rate of 0.5 mL/min, and an injection volume of 2 µL. The mobile phases were eluent A (water, 25 mmol/L ammonium acetate, 25 mmol/L ammonia) and eluent B (acetonitrile), and the autosampler temperature was 4 °C. The AB Triple TOF 6600 mass spectrometer was used to acquire MS/MS spectra in the information-dependent acquisition (IDA) mode under the control of the acquisition software. The ion source conditions were a source temperature of 600 °C, an Ion Sapary Voltage Floating (ISVF) voltage of ±5500 V (both positive and negative modes), and Ion Source Gas 1 (Gas1), Ion Source Gas 2 (Gas2), and Curtain Gas (CUR) set to 60, 60, and 30 psi, respectively. For the parameters, the collision energy (CE) was fixed at 35 V ± 15 eV, and the declustering potential (DP) was set to ±60 V (both positive and negative modes).

2.6. Correlation Analysis

Correlation analyses were performed using Spearman’s statistical method to calculate correlation coefficients and p-values for rumen microbial composition and metabolites with digestive enzyme activity, antioxidant capacity, and (LPS) concentration, respectively. Then, the correlation between microbial composition and metabolites was analyzed using Mantel’s correlation, and the final correlation network diagram was plotted using R language Vegan package, Psych package.

2.7. Statistical Analysis

The homogeneity of variance in parametric tests was used to evaluate the normality of microbial data. And then, normal data were analyzed using a general linear model (GLM) using SPSS 25.0 software (IBM Corp., Armonk, NY, USA). The following statistical model was used:
Yij = u + Pi + Aj + Pi × Aj + eij, where Yijk was the detection value of the individuals, u was the observation, Pi was the fixed effect of CP levels (i = 1 (12%), 2 (14%)), Aj was the fixed effect of additive level (j = 1 (RES), 2 (HMB)), Pi × Aj was the interaction effect, and eij was the standard error. And the results are expressed as “mean ± SEM”, with p < 0.05 considered significant. The graphs were generated using Origin 2021. Metabolomic statistics were converted from raw MS data to MzXML format using ProteoWizard (version 3.0.7414), and then were imported into XCMS software (version 4.0) for analysis. Multivariate statistical analyses of the metabolome were performed using the OPLS-DA model, which was further validated with cross-validation and permutation testing.

3. Results

3.1. Effect of Dietary Supplementation with RES and HMB at Different Protein Levels on Digestive Enzyme Activity

The effects of the experimental treatments on trypsin, chymotrypsin, lipase, cellulase, and α-amylase content on the rumen content are shown in Table 2. Significantly, the interaction effect of CP levels with RES and HMB supplements were observed on trypsin, chymotrypsin, and lipase (p < 0.05). The trypsin and chymotrypsin were higher in the 14% protein diet supplemented with the RES and HMB group (H-RES-HMB) than in the other three groups, and lipase was significantly lower than in the 14% protein group (H) than in the other three groups (p < 0.05).

3.2. Effect of Dietary Supplementation with RES and HMB at Different Protein Levels on the Antioxidant Capacity

The effects of the experimental treatments on GSH-PX, SOD, T-AOC, CAT, and MDA content of the rumen are shown in Table 3. No interaction effects of CP levels with RES and HMB supplements were observed on the antioxidant indices (p > 0.05). The SOD, T-AOC, and CAT were higher in the H-RES-HMB group than in the other three groups, and MDA was lower than in the H-RES-HMB group than in the other three groups.

3.3. Effect of Dietary Supplementation with RES and HMB at Different Protein Levels on LPS Concentration

The effects of the experimental treatments on the LPS concentration of the rumen content were showed in Table 4. Significant interaction effects of CP levels with RES and HMB supplements was observed in the LPS concentration (p < 0.05). The LPS concentration was significantly lower in the H-RES-HMB group than in the other three groups (p < 0.05).

3.4. Differences in the Diversity in Rumen Microbial Communities

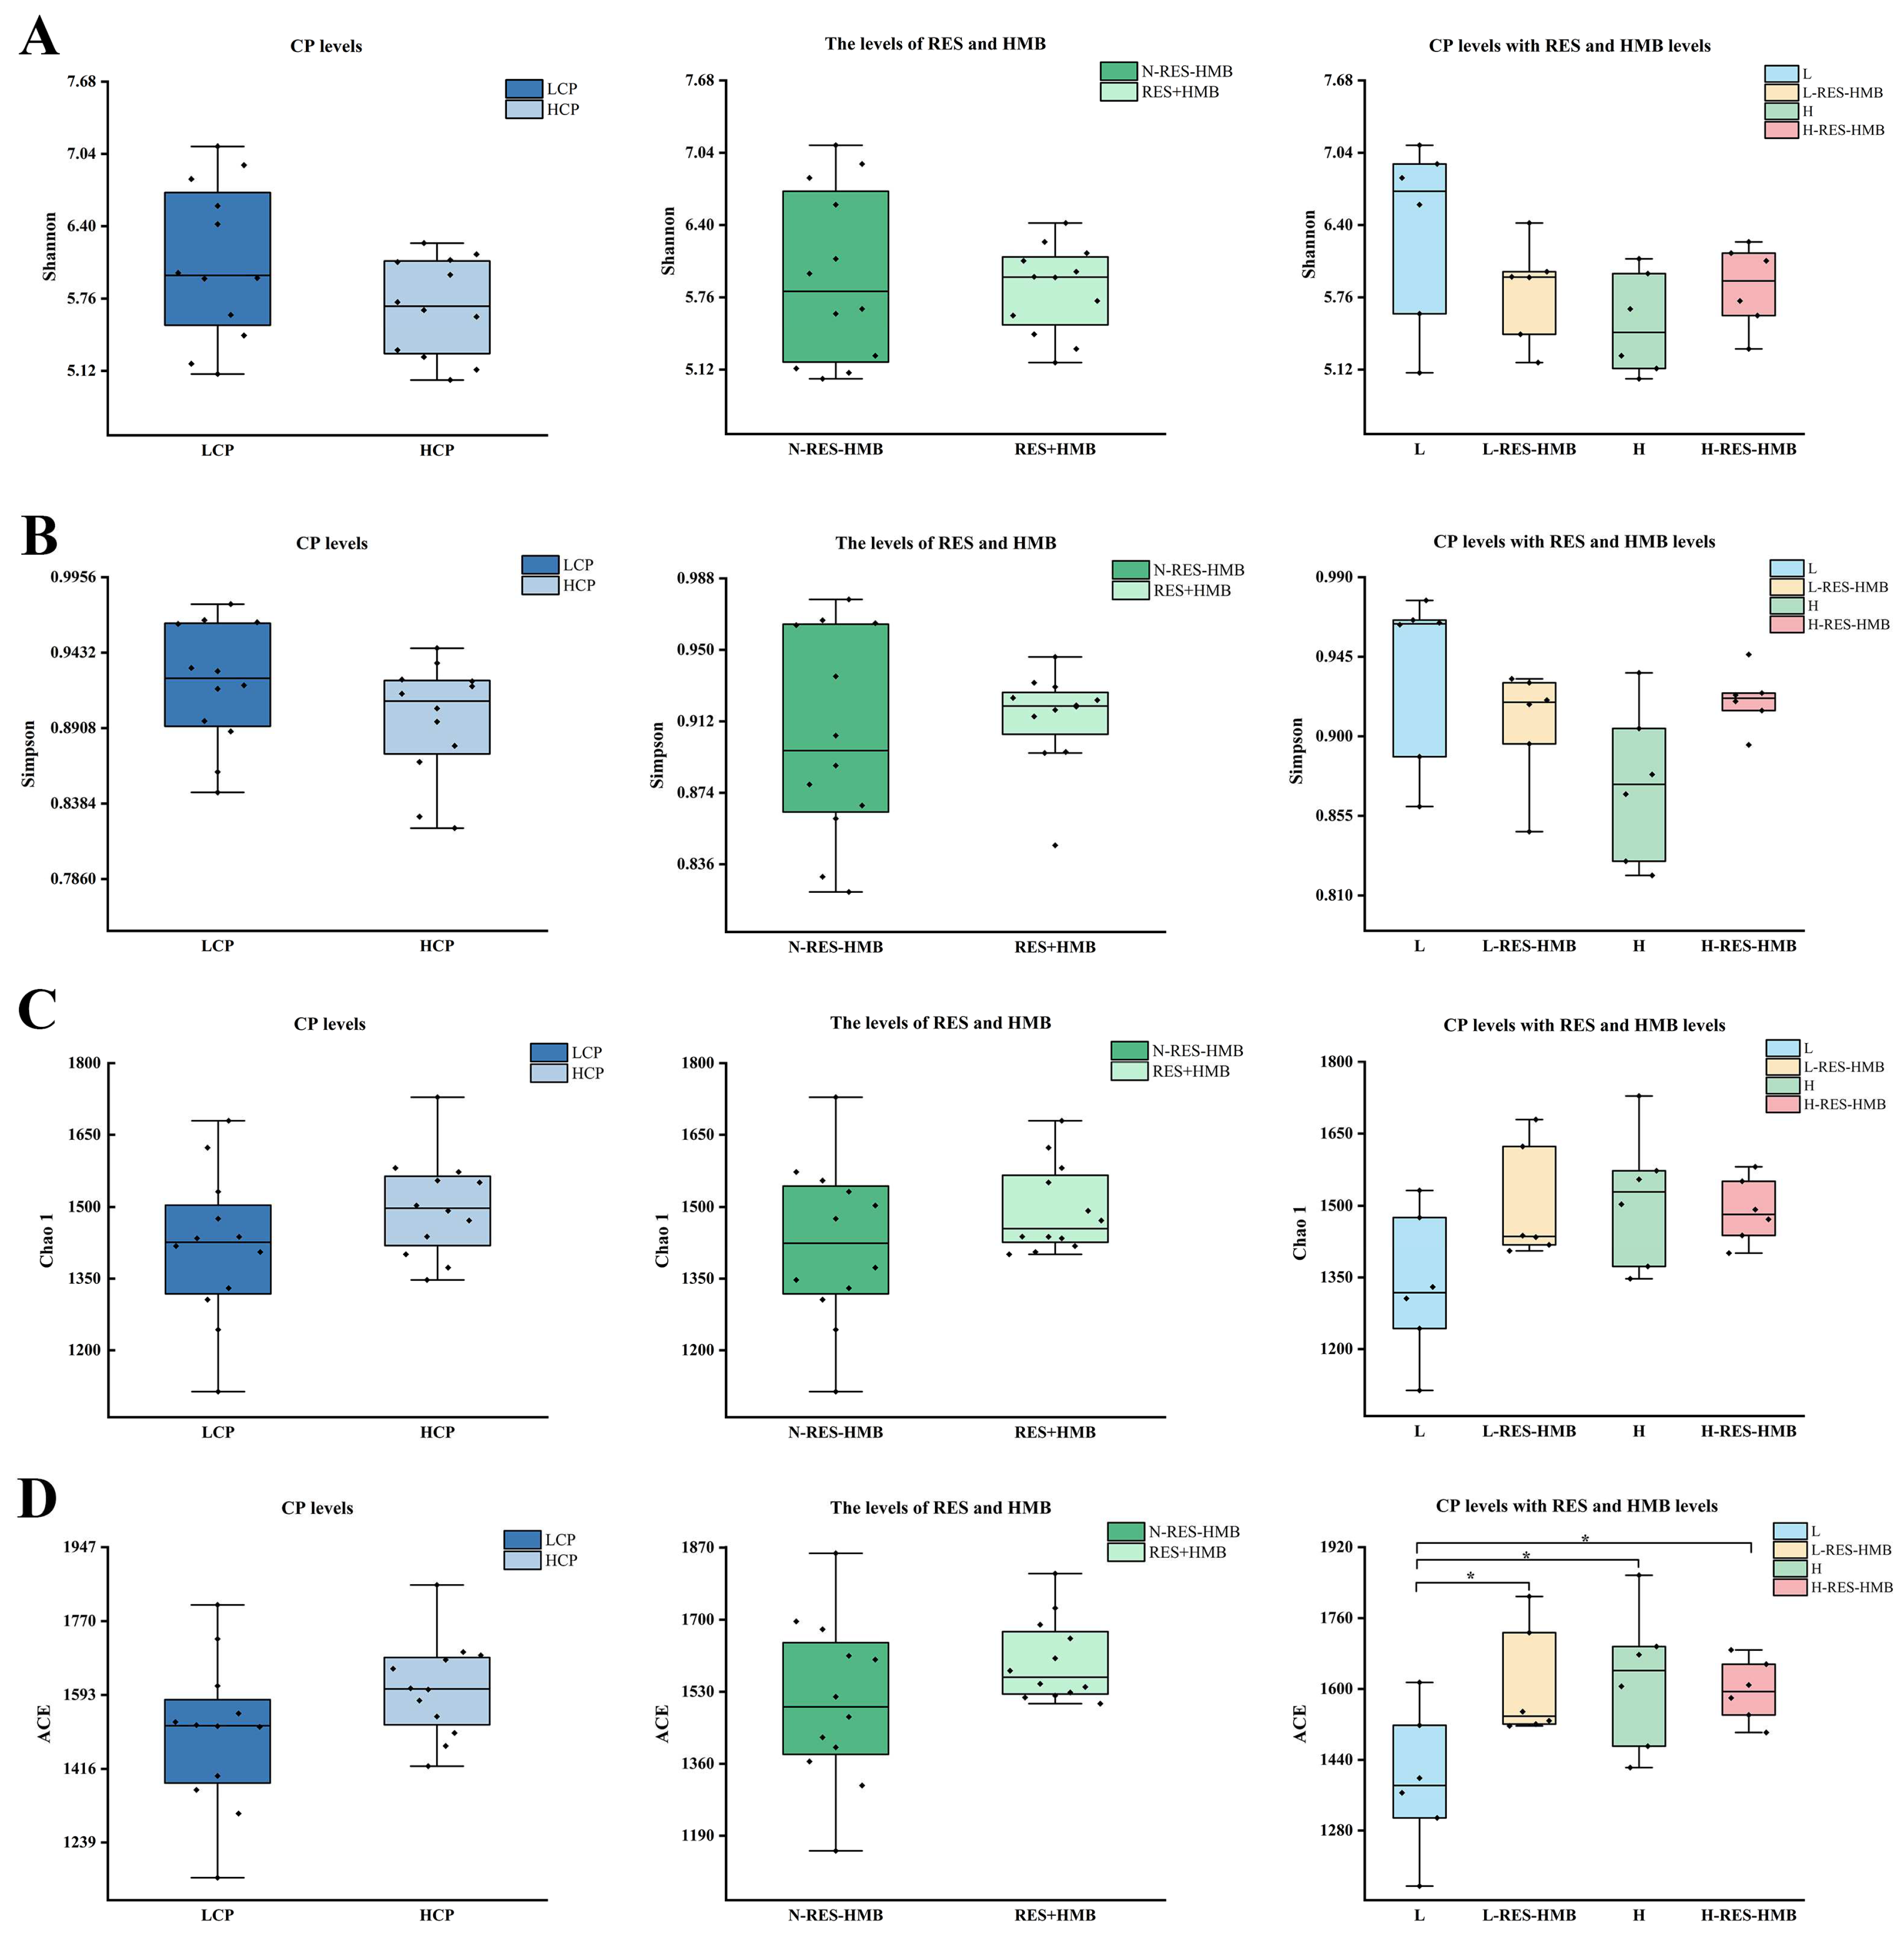
The Venn diagram of ruminal microbial diversity analyzed using the 16S rDNA gene sequencing shows that a total of 1900 OTUs were obtained from the four groups (Figure 1A), of which 371, 100, 123, and 113 OTUs were unique to the L, L-RES-HMB, H, and H-RES-HMB groups, respectively. The beta diversity of the rumen microbial communities was assessed using PCoA (Figure 1B), showing good clustering of the samples from each group. The BrayCurtis analysis was ANOSSIM R = 0.5676, p = 0.001 (Figure 1C), and the unweighted unifrac analysis was ANOSSIM R = 0.7176, p = 0.001 (Figure 1D), with both analyses indicating that there were significant differences in the microbial communities between the groups. Compare the alpha diversity indices of Shannon (Figure 2A), Simpson (Figure 2B), Chao1 (Figure 2C), and ACE (Figure 2D) in the four experimental groups (Figure 2). No significant differences were observed in the alpha diversity index in terms of either protein or RES and HMB supplementation (p > 0.05). There was an interaction effect between the level of CP and the addition of RES and HMB on the ACE index (p < 0.05), which was significantly lower in the L group than in the L-RES-HMB, H, and H-RES-HMB groups.

3.5. Differences in Rumen Microbial Compositions

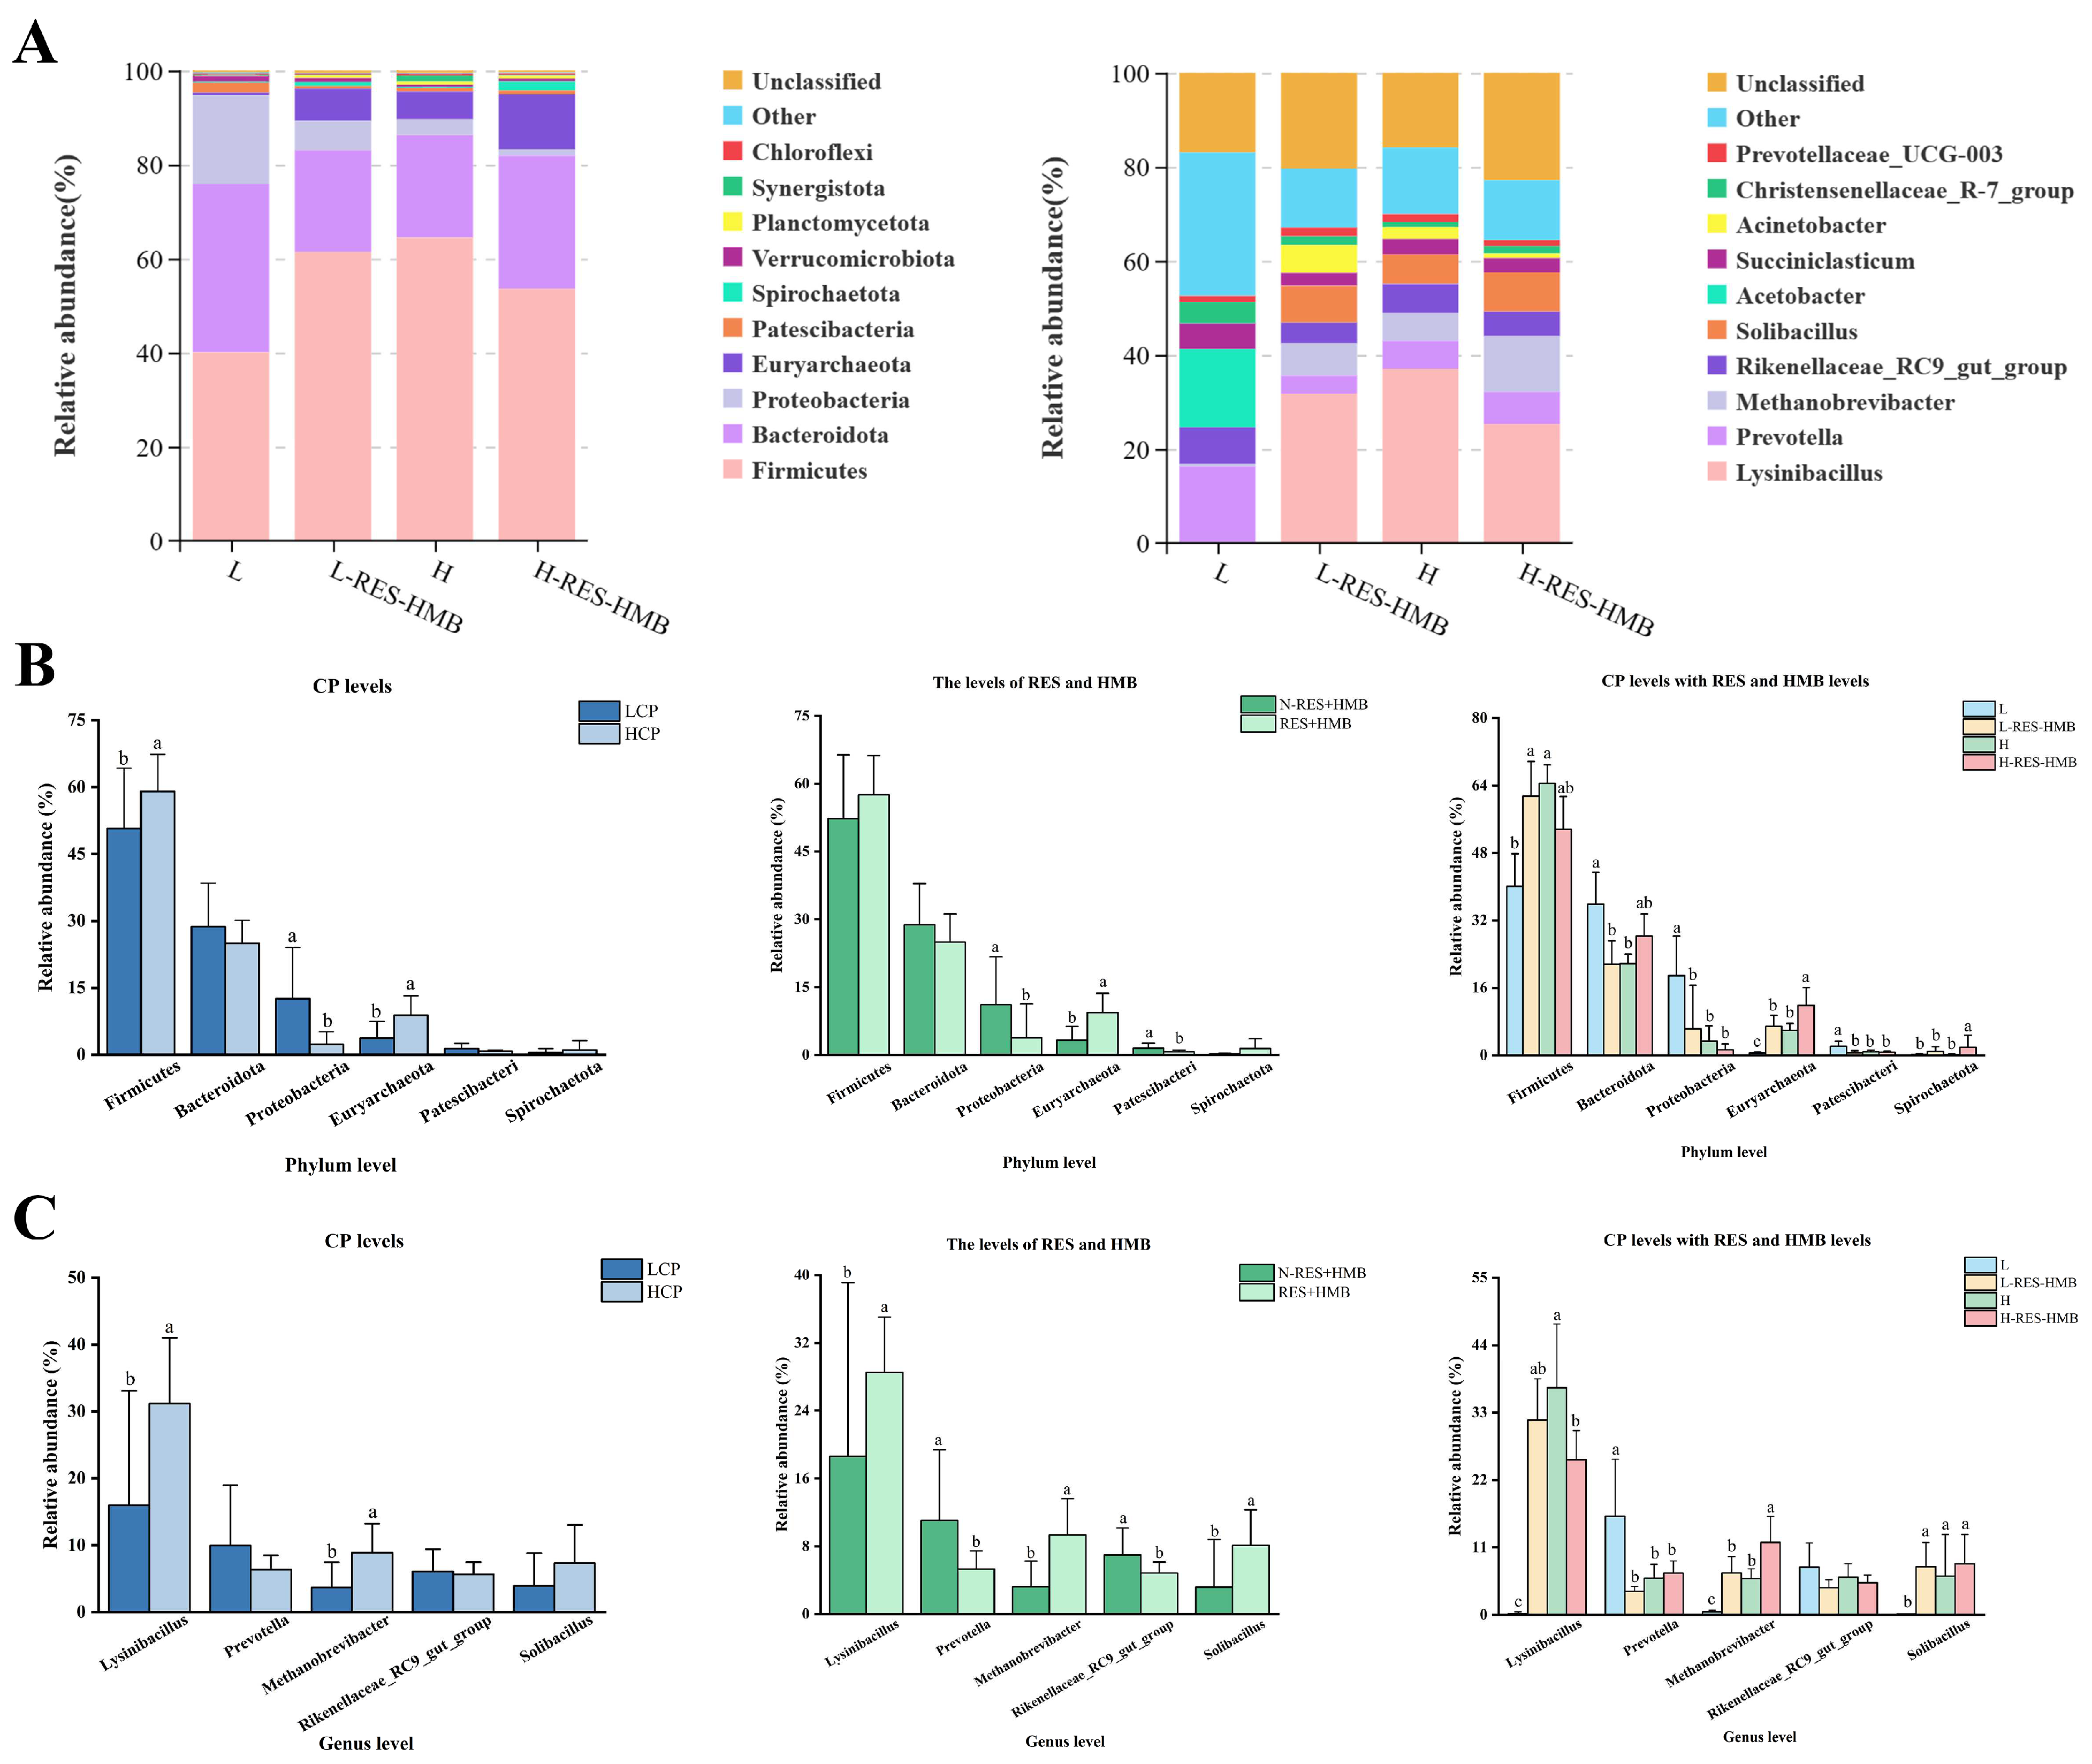
At the phylum level, Firmicutes, Bacteroidota, and Proteobacteria were the top three phyla in the L group, while Firmicutes, Bacteroidota, and Euryarchaeota were the top three phyla in the L-RES-HMB, H, and H-RES-HMB groups (Figure 3A). In terms of protein level, Firmicutes and Euryarchaeota were significantly lower in the LCP group than in the HCP group, while Proteobacteria were significantly higher. In terms of RES and HMB supplementation, Euryarchaeota were significantly higher in the RES + HMB group than in the N-RES-HMB group, while Proteobacteria and Patescibacteria were significantly lower in the RES + HMB group than in the N-RES-HMB group. Protein levels with RES and HMB additives were observed to interact with the abundance of Firmicutes, Bacteroidota, Proteobacteria, Euryarchaeota, Patescibacteria, and Spirochaetota (p < 0.05) (Figure 3B).
At the genus level, Prevotella, Acetobacter, and Rikenellaceae_RC9_gut_group were the dominant microflora in group L, and Lysinibacillus and Solibacillus were the common dominant genera in the H, L-RES-HMB, and H-RES-HMB groups. In terms of protein level, Lysinibacillus and Methanobrevibacter were significantly reduced in the LCP group compared with the HCP group. In terms of RES and HMB supplementation, Lysinibacillus, Methanobrevibacter, and Solibacillus were markedly lower in the N-RES + HMB group relative to the RES + HMB group, while Prevotella and Rikenellaceae_RC9_gut_group were significantly higher. Protein levels with RES and HMB supplements were found to interact with Lysinibacillus, Prevotella, Methanobrevibacter, and Solibacillus in the rumens of Tibetan sheep (p < 0.05) (Figure 3C).

3.6. Differences in Rumen Microbial Functions in Tibetan Sheep

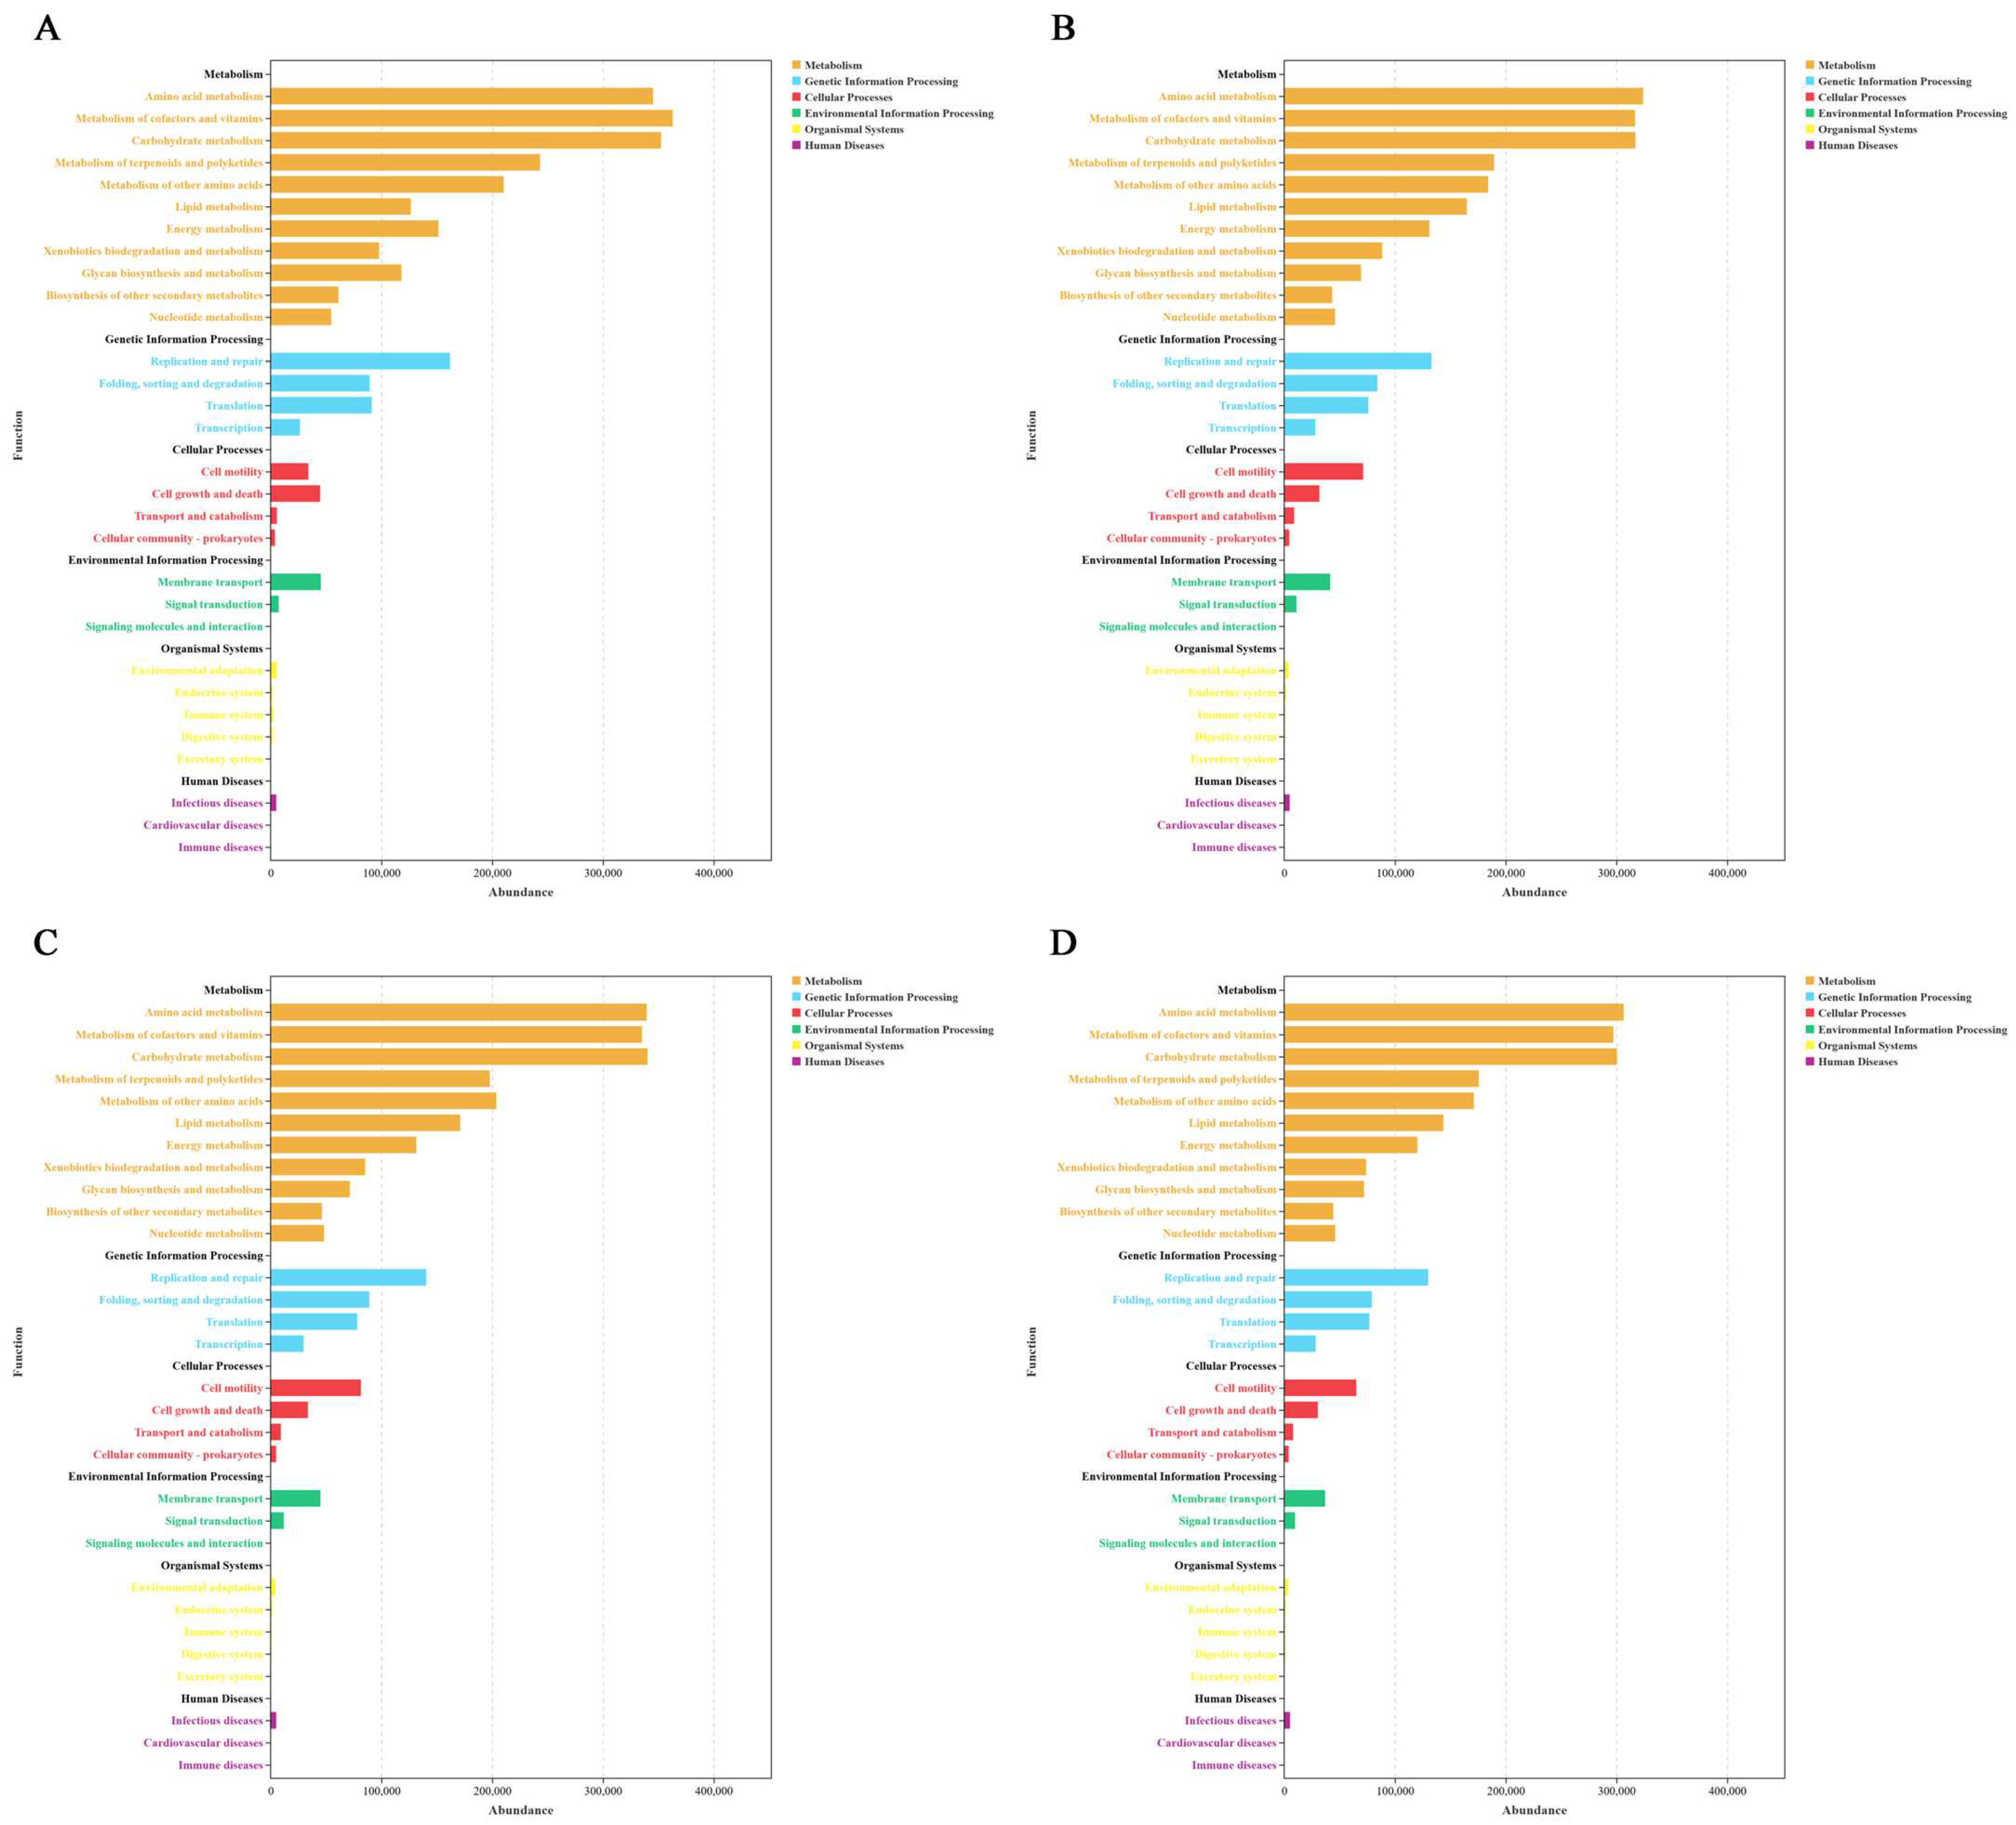
Based on the 16S sequencing data, functional prediction was performed using PICRUSt2 software (version 8.0.5) (Figure 4), and the predicted functional abundance distribution of the L (Figure 4A), L-RES-HMB (Figure 4B), H (Figure 4C), and H-RES-HMB (Figure 4D) groups were obtained. The results showed that the microbial functions in the four groups were mainly enriched in pathways associated with the amino acid metabolism, the metabolism of cofactors and vitamins, and the carbohydrate metabolism.

3.7. Metabolomic Analysis of the Rumen of Tibetan Sheep

LC-MS/MS analysis yielded 10,227 and 8168 valid peaks from the positive and negative ion modes, respectively. The OPLS-DA score diagram showed good fit (R2X and R2Y) and predictability (Q2) (Figure 5). The values of R2X, R2Y, and Q2 in L and L-RES-HMB groups, H and H-RES-HMB groups, and L-RES-HMB and H-RES-HMB groups were 0.639, 0.996, and 0.943; 0.374, 0.943, and 0.501; and 0.176, 0.998, and 0.146 in the positive ion mode, respectively. At the same time, the displacement test of the OPLS-DA model was performed. In the positive ion mode, the R2 and Q2 intercept values of the L and L-RES-HMB groups, the H and H-RES-HMB groups, and the L-RES-HMB and H-RES-HMB groups were 0.88 and −0.14, 0.94 and 0, and 0.96 and 0.08 (Figure 5A), respectively. The values of R2X, R2Y, and Q2 in the L and L-RES-HMB groups, H and H-RES-HMB groups, and L-RES-HMB and H-RES-HMB groups were 0.644, 0.999, and 0.959; 0.345, 0.981, and 0.628; and 0.326, 0.975, and 0.399 in negative ion mode, respectively. In the negative ion mode, the R2 and Q2 intercept were 0.93 and −0.13, 0.95 and 0.08, and 0.97 and 0.1 (Figure 5B), respectively.
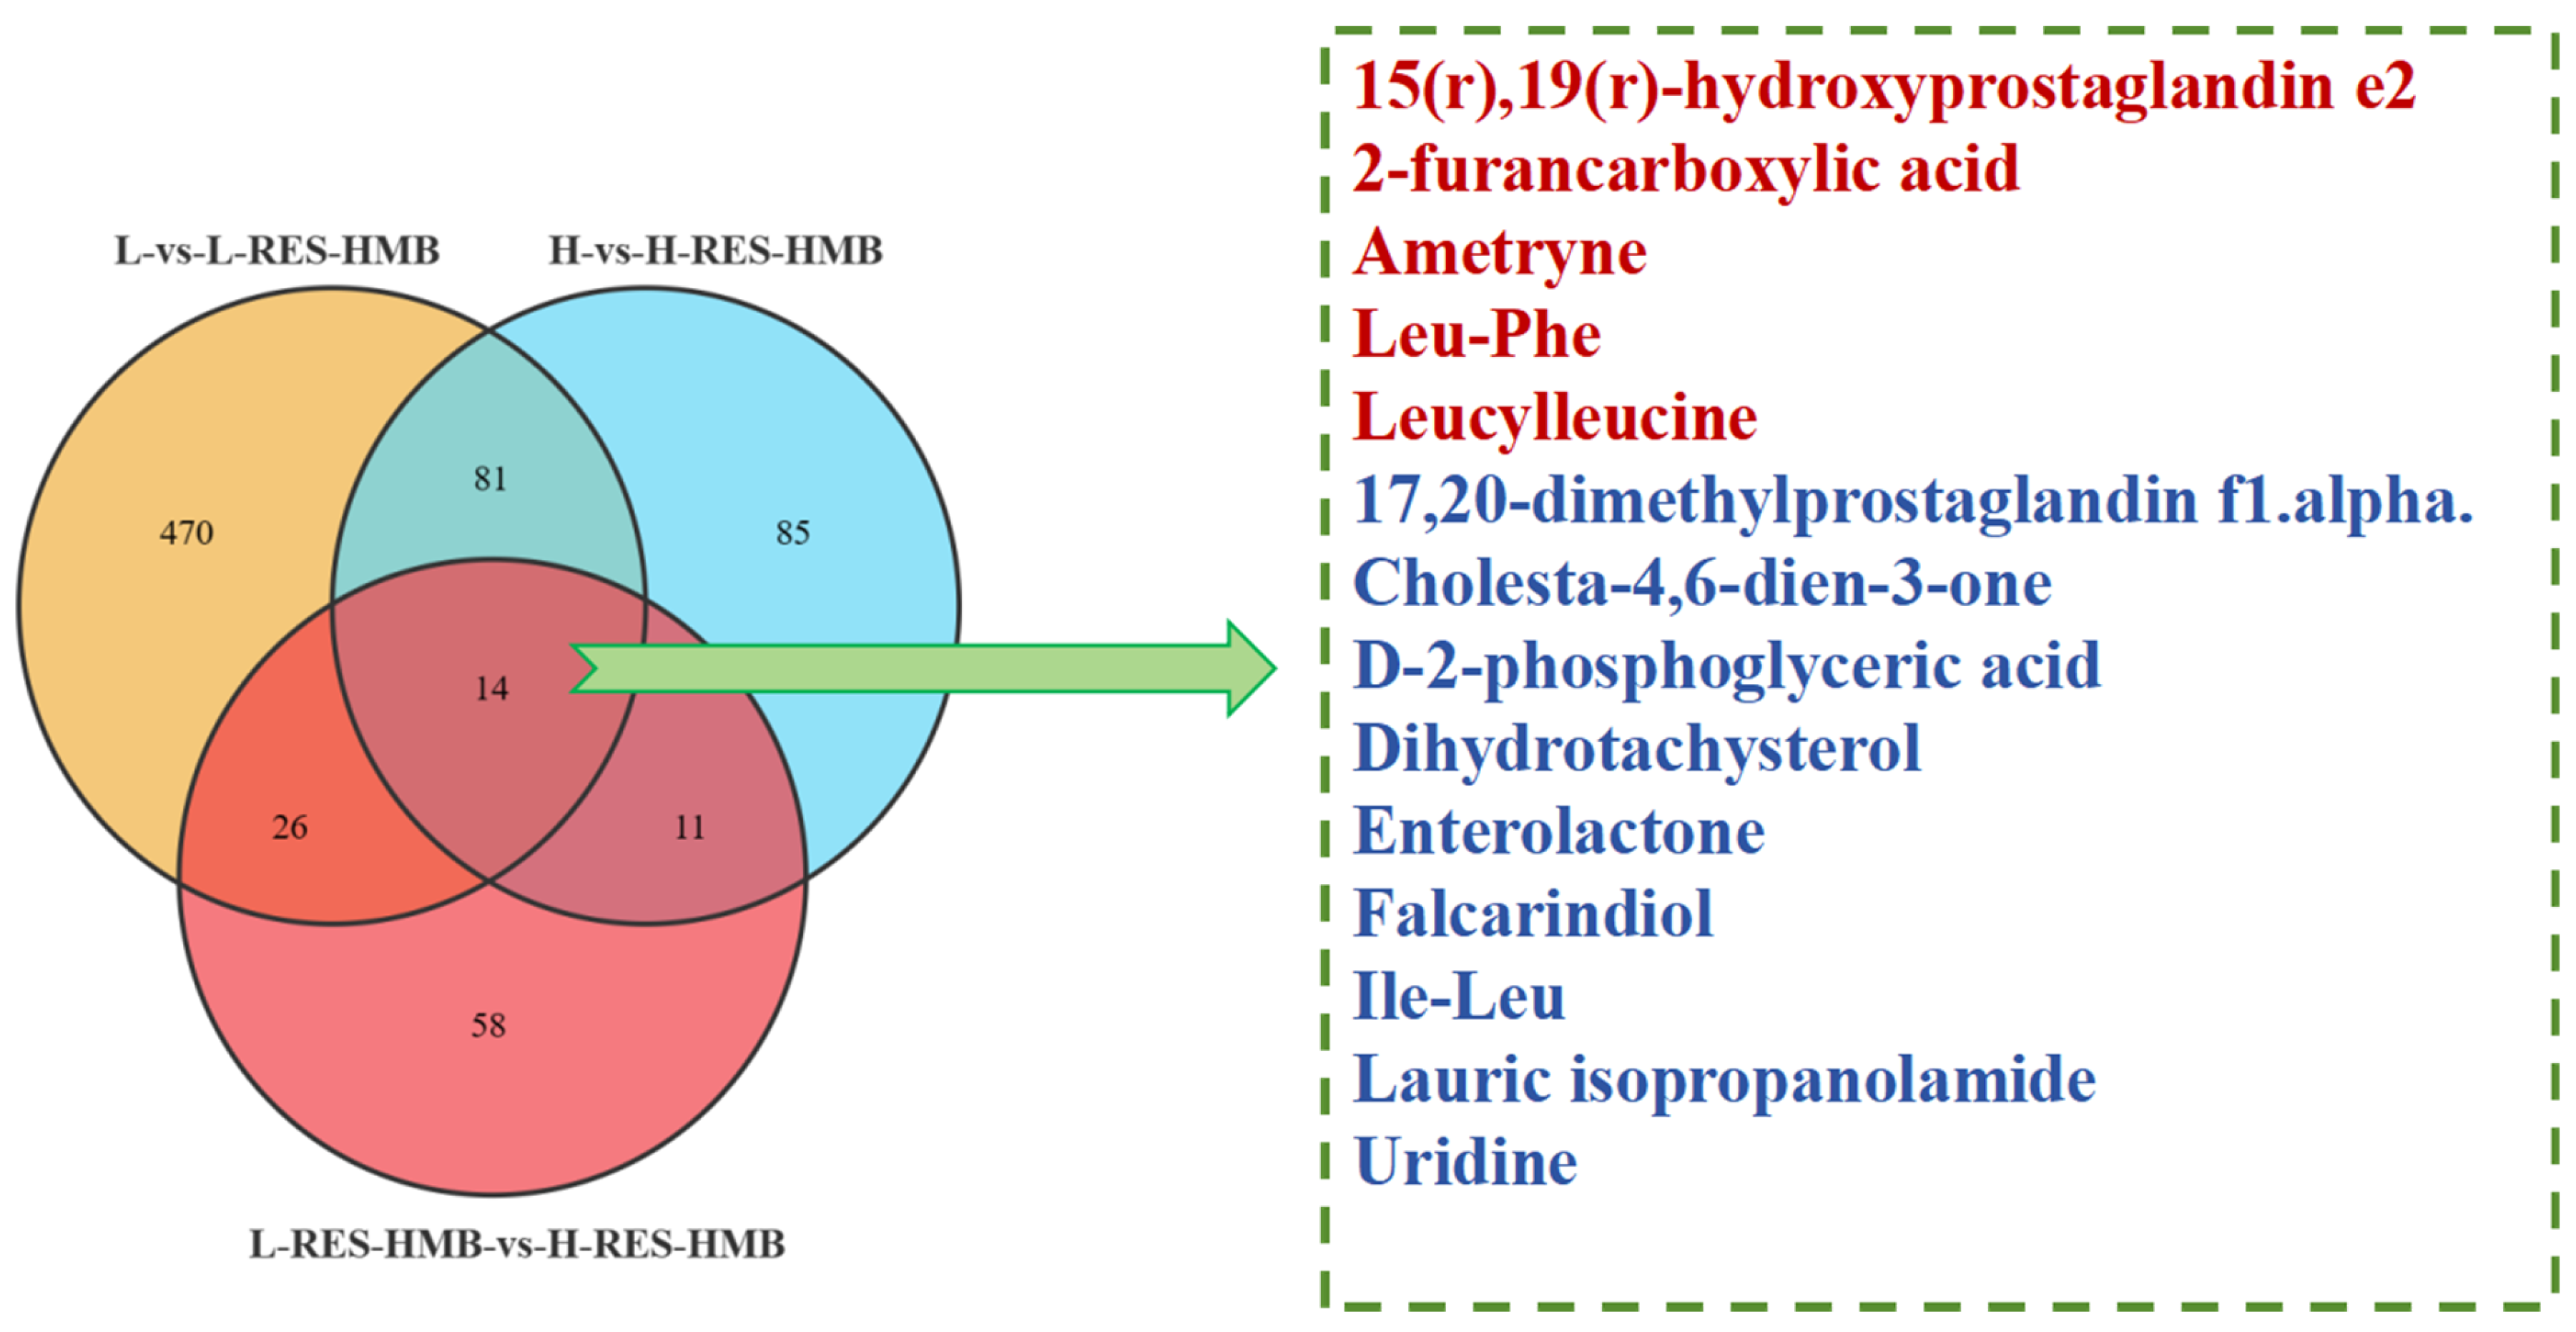
A total of 745 differential metabolites (DMs) were identified in the four groups by KEGG analysis using DM identification thresholds (VIP > 1, p < 0.05) in both the positive and negative ion modes (Figure 6). Pairwise comparisons showed that there were 591 DMs (319 and 272 in the positive and negative ion modes, respectively) between the L and L-RES-HMB groups, 191 DMs (84 and 107 in the positive and negative ion modes, respectively) between the H and H-RES-HMB groups, and 109 DMs (49 and 60 in the positive and negative ion modes, respectively) between the H and H-RES-HMB groups. Four of the groups had a total of 14 DMs (5 and 9 in the positive and negative ion modes, respectively), which were 15(R), 19(R)-hydroxyprostaglandin e2, 2-furancarboxylic acid, Ametryne, Leu-Phe, Leucylleucine, 17, 20-dimethylprostaglandin f1.alpha, cholesta-4,6-dien-3-one, D-2-phosphoglyceric acid, dihydrotachysterol, enterolactone, falcarindiol, Ile-Leu, lauric isopropanolamide, and uridine metabolites. At the same time, metabolites such as Acetyl coenzyme a, Pyruvaldehide, Succinate, 2-isopropyrmalic acid, and Glycine were identified in the same pathway.
Metabolic pathway enrichment analyses were performed to determine the function of the different metabolites (Figure 7), which resulted in the acquisition of significantly different metabolites in L and L-RES-HMB groups mainly enriched in the glycine, serine, and threonine metabolisms (Figure 7A), H and H-RES-HMB groups mainly enriched in the metabolic pathways and pyrimidine metabolisms (Figure 7B), and L-RES-HMB and H-RES-HMB groups mainly enriched in the ABC transporter metabolic pathways (Figure 7C), while the overall comparison was mainly enriched in the carbohydrate metabolism.

3.8. Correlation Analysis of Digestive Enzyme Activity, Antioxidant Capacity, LPS Concentration, Microbial Communities, and Metabolites in Rumen

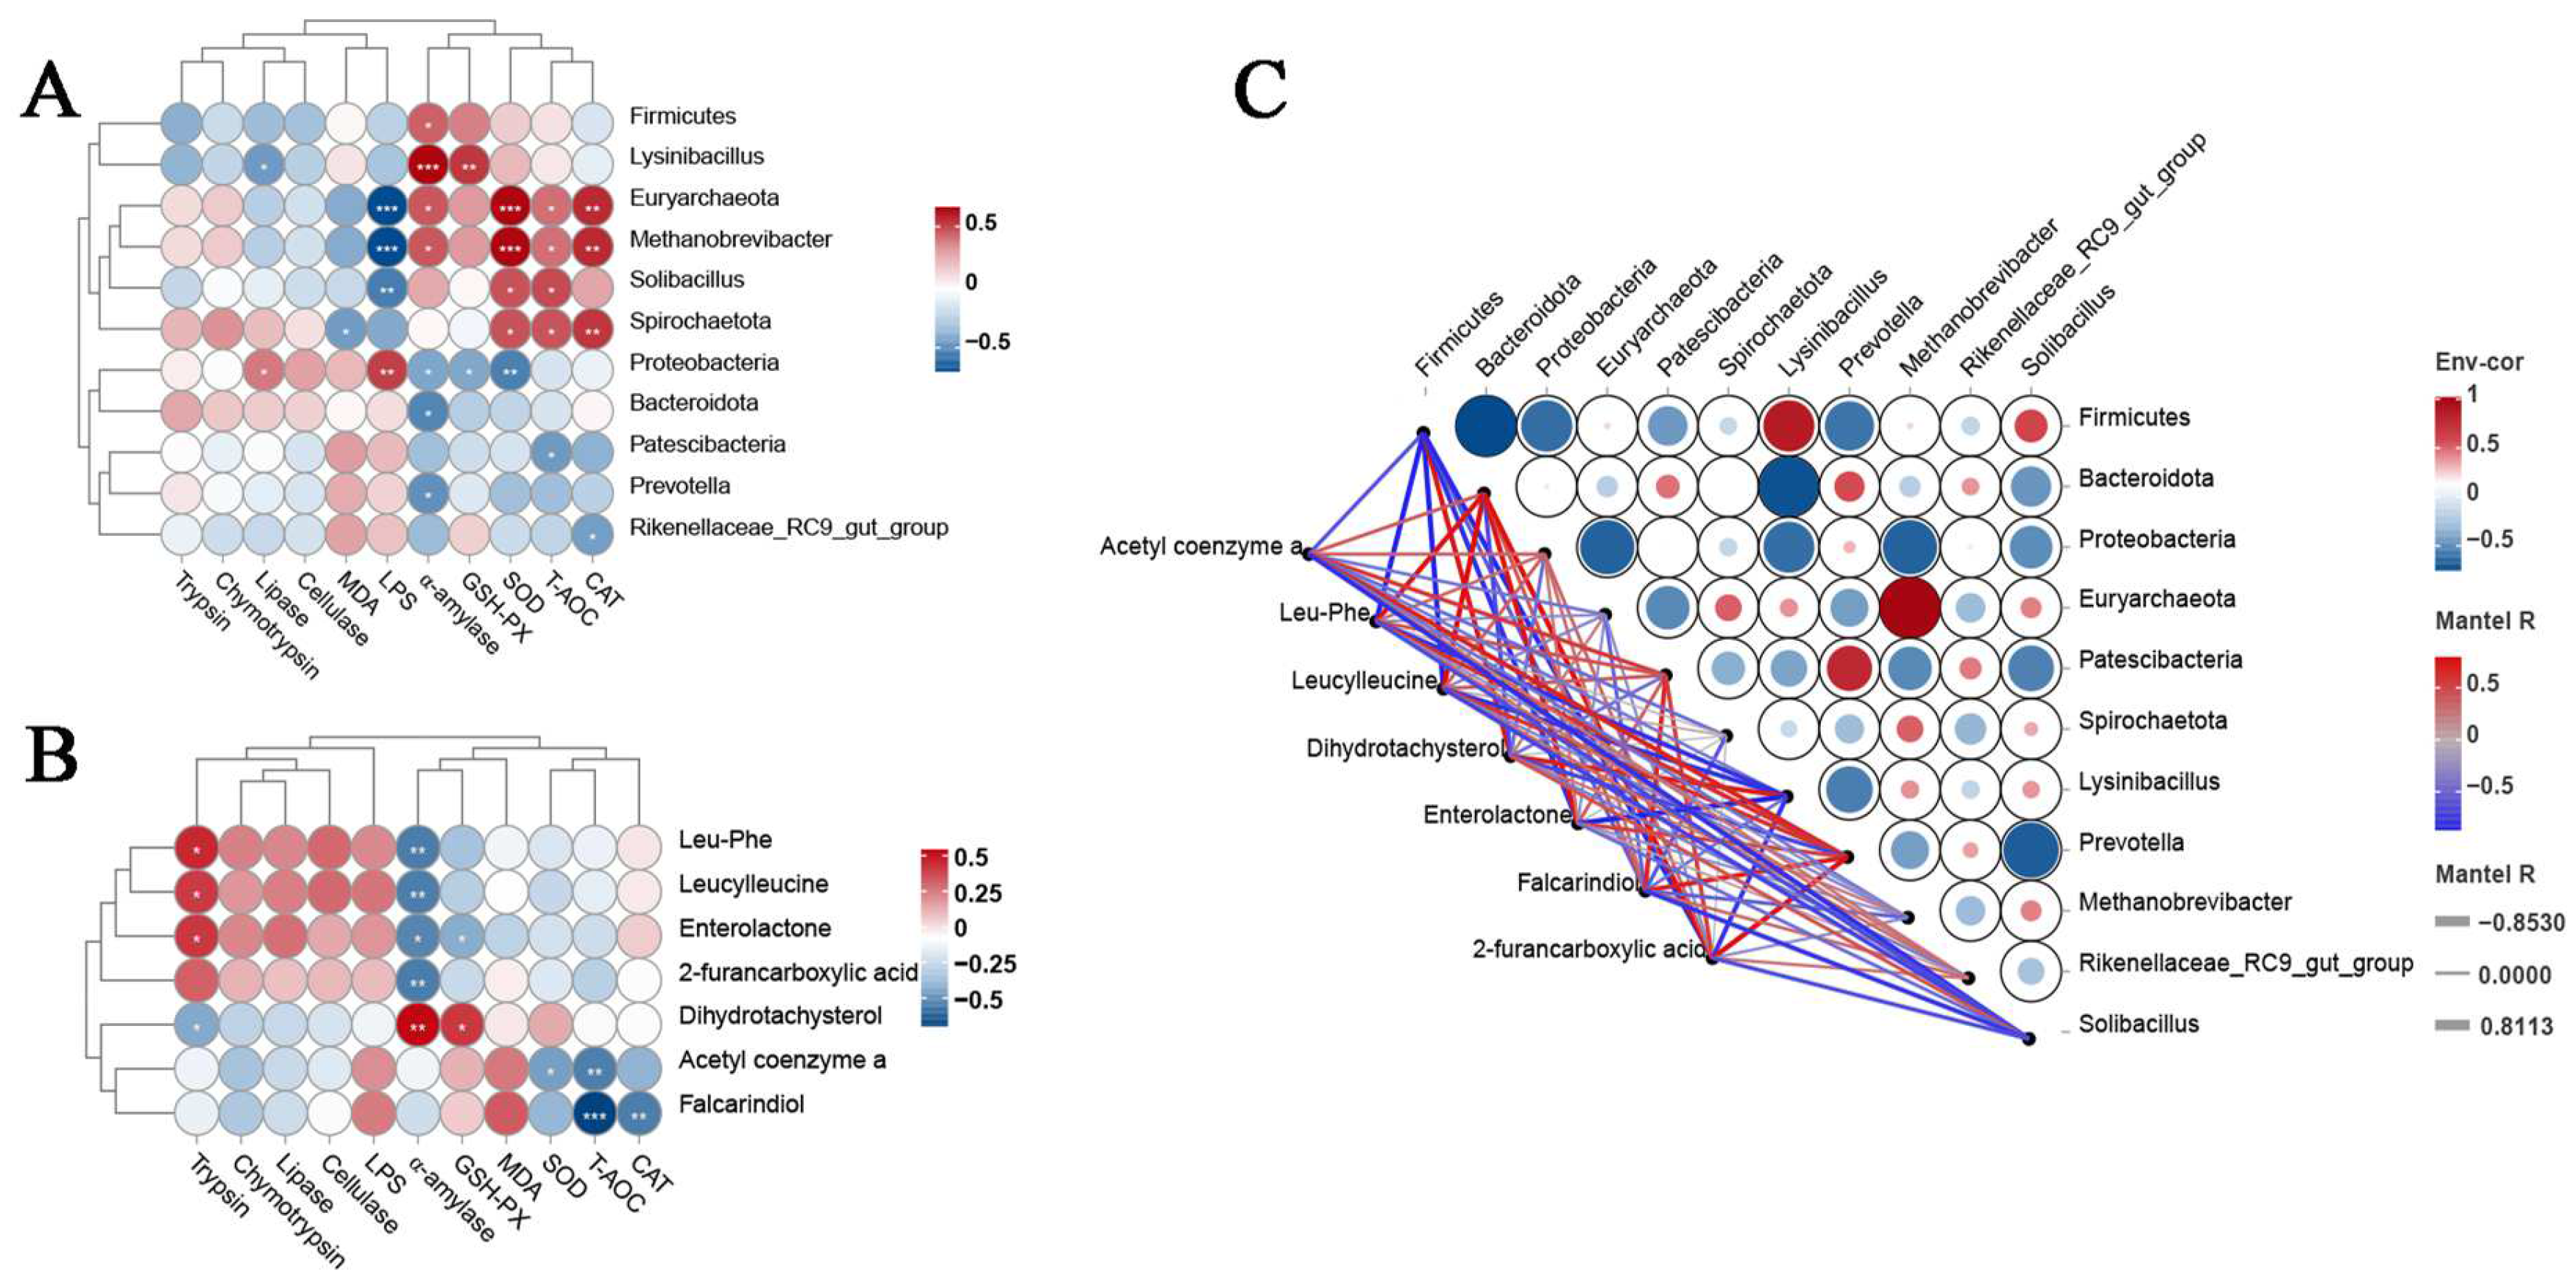
To investigate the correlations between digestive enzymes, antioxidant activities, and LPS concentration with rumen microbiota and metabolites, Spearman and Mantel correlations were evaluated. The Spearman correlation network showed that the abundance of Euryarchaeota, Metanobrevibacter, and Spirochaeota in the rumen microbiota was associated with CAT and SOD, while the abundance of Lysinibacillus was positively correlated with α-amylase and GSH-PX, and the Euryarchaeota and Methanobrevibacter abundance was negatively correlated with LPS (Figure 8A). Dihydrotachysterol was positively correlated with both GSH-PX and α-amylase, and Leu-Phe, Leucylleucine, and Enterolactone were positively associated with Trypsin, while Falcarindiol was negatively correlated with T-AOC (Figure 8B). In addition, the abundance of Firmicutes, Lysinibacillus, and Solibacillus were negatively correlated with the Acetyl coenzyme A, Leu Phe, Leucoleucine, Enterolactone, and 2-furancarboxylic acid metabolites, while these metabolites were positively associated with Bacteroidota and Prevotella. In addition, the abundances of Firmicutes and Lysinibacillus were positively correlated with Dihydroxytocysterol, while Patescibacteria and Prevotella were positively correlated with Falcarindiol (Figure 8C).

4. Discussion

Digestive enzymes are proteins that promote the hydrolysis of large molecules into smaller molecules for easy absorption by the body [25]. The HMB is a leucine metabolite associated with protein anabolism [26], and leucine is an essential branched-chain amino acid (BCAA), representing not only one of the most abundant amino acids in high-protein diets, but also one that reduces increases in protein degradation [27], suggesting that HMB may indirectly affect protease activity. In a study of the Siberian sturgeon, Yang Shiyong et al. [28] found that resveratrol increased alpha-amylase and lipase activities and improved digestion and intestinal health. Here, the addition of RES and HMB to the diet was found to increase the activities of trypsin, chymotrypsin, and lipase. However, the effects of HMB on digestive enzymes have not yet been investigated, and further studies are required for verification. In terms of CP levels, the trypsin, chymotrypsin, and lipase activities were improved in the LCP group relative to the HCP group. Yengkokpam et al. [29] found that feeding a high-protein diet modulated the oxidative stress and activation of various inflammation-related pathways, which ultimately led to reduced protease activity. The present study shows interactions between the protein levels and the RES and HMB supplements on the activities of digestive enzymes in the rumen content of Tibetan sheep.
The major antioxidant activities in rumen content, including GSH-PX, SOD, T-AOC, and CAT, together with the MDA content, are indicative of the oxidative status and antioxidant capacity of the rumen [30]. Phenolic compounds have been associated with antioxidant activity [31]. It has been suggested that plant polyphenols (curcumin or quercetin) or amino acid/metabolite mixtures (alaninyl glutamine or arginine + glutamine + beta-hydroxybeta-methylbutyric acid) may be beneficial in reducing the severity and progression of radiation-induced mucosal inflammation (RIOM) [32]. As HMB is a metabolite of leucine [26], it is possible that HMB may have antioxidant and anti-inflammatory effects similar to those of phenolic compounds, reducing oxidative stress and the inflammatory response, and thus indirectly promoting protein synthesis. It was found that the addition of 0.25% leucine significantly increased the T-AOC values in the serum, dorsal shortest muscles, and livers of piglets after the addition of varying amounts of leucine (0, 0.25, and 0.5%) [33]. Resveratrol, a stilbene molecule belonging to the polyphenol family that is commonly found in plants, is a natural antioxidant with potent antioxidant activity [34,35,36]. In this study, the addition of RES and HMB not only increased the activities of T-AOC and CAT, but also reduced the levels of MDA, in agreement with the findings of Chen et al. [37]. GSH-PX activity was significantly higher in the HCP group than in the LCP group; this is linked to antioxidant metabolism through the trans-sulphuration reaction in which homocysteine (Hcy) is converted to cysteine and reduced glutathione (GSH), and it has been shown that under low-protein diets, Hcy levels are reduced [38], leading to a decrease in the formation of GSH and therefore a decrease in GSH-PX activity. The present study showed that supplementation with RES and HMB increased both T-AOC and CAT activities, while reducing the levels of MDA in the rumen content of Tibetan sheep over two levels of protein and additives. The synergistic effects of RES and HMB on antioxidant activity have not yet been investigated, and require further investigation.
LPS is the major endotoxin of Gram-negative bacteria (e.g., Escherichia coli) [39]. Several studies have reported that HMB, when used as a dietary supplement, has beneficial effects in animals and humans under stressful or inflammatory conditions [26,40,41]. Numerous studies have demonstrated the multifunctionality and multiple activities of RES, including antioxidant, anti-diabetic, and anti-inflammatory properties [42,43,44]. In this study, it was found that the LPS content of the rumen in the H-RES-HMB group were significantly lower than that in the other three groups. Dietary supplementation with 0.6% HMB has been shown to ameliorate growth inhibition and intestinal damage in LPS-injured weaned piglets [40,41]. Several studies have also found that dietary supplementation with HMB improves gut integrity, function, and microbial communities in LPS-affected piglets [45]. RES has been shown to attenuate LPS-induced acute kidney injury by inhibiting macrophage-driven inflammation, and has also been found to attenuate LPS-induced liver injury and improve gut microbial function in LPS-induced inflammation [45,46]. The conclusion is that both RES and HMB have an inhibitory effect on LPS levels in the rumen content. In this study, in terms of the protein level, LPS levels were found to be significantly lower in the HCP group than in the LCP group. Leucine [47], lysine [48], and glutamate [49] have been shown to have defensive and protective effects against LPS induction. In low-protein diets, one or more amino acids may be deficient, resulting in increased levels in LPS.
The rumen is an anaerobic microbial ecosystem comprising a variety of microorganisms, including bacteria, protozoa, fungi, and archaea [5]. Here, the alpha diversity analysis showed that the ACE index of group L was lower, indicating that the rumen microbiota richness was significantly lower in animals that were fed low-protein diets. At the phylum level, the relative abundance of Firmicutes and Euryarchaeota was higher in the HCP group, while the relative abundance of Euryarchaeota was higher in the H-RES-HMB group. Firmicutes are one of the most abundant prokaryotic groups in the human and animal microbiota [50], and it has been found that the abundance of Firmicutes in piglets fed on a low-protein diet for 25 days was lower (14%) than that in animals fed with normal levels of protein (20%) [51]. In terms of the microbiota, it has been reported that the archaeal community is dominated by species belonging to the phylum Euryarchaeota, and the dominant archaea in animal digestive tracts are methanogens [52], a group of archaea capable of anaerobic fermentation of inorganic or organic compounds into methane and carbon dioxide. Studies have shown that the production of methane from protein fermentation and the response of methane production to the protein nitrogen supply may differ according to the basal substrate [53]. We hypothesize that the group that was fed a high-protein diet was more likely to produce large amounts of protein fermentation products, thereby increasing the relative abundance of Euryarchaeota and thus increasing methane emissions, while reducing methane emissions would benefit both the environment and the efficiency of livestock production [54]. Euryarchaeota were found to be negatively correlated with LPS. HMB has the effect of promoting protein synthesis [26], which may also contribute to the increase in Euryarchaeota; however, there are no relevant reports of the effects of RES and HMB on archaeal communities, and further research is needed. The relative abundance of Proteobacteria in the present study was lower in the H-RES-HMB group. Proteobacteria are Gram-negative bacteria, and thus contain LPS in their cell walls [39,55]. The LPS levels in the H-RES-HMB group were lower than those in the other three groups, resulting in a decrease in the abundance of Proteobacteria in this group. It has been reported that high-protein diets alter the abundance of Proteobacteria [56]. Current studies have shown that Proteobacteria are involved in metabolic disorders and inflammatory bowel disease [57], while RES and HMB supplements have anti-inflammatory and anti-cancer properties that may contribute to the reduced abundance of the Proteobacteria microflora [44]. In this study, the H-RES-HMB group had a higher abundance of Spirochaetota, which was positively correlated with CAT and SOD antioxidant activities; these bacteria produce butyric acid, which is essential for maintaining the host’s gut health [58]. RES can improve the diversity and structure of the gut microbiota by increasing the abundance of probiotics [59], while HMB may be used as a probiotic agent to reverse obesity induced by a high-fat diet (HFD), the underlying mechanism of which is related to the gut microbiota and metabolism [60], which may be responsible for the increase in probiotics. The mechanism requires further verification. At the genus level, the abundance of Lysinibacillus and Methanobrevibacter was higher in the HCP and RES + HMB groups, and there was an interaction between the protein and RES and HMB supplementation levels. Lysinibacillus is a hydrolase-producing bacterium associated with fermentation and the maintenance of enzyme activities [61]. This is due to the higher activity of α-amylase, which leads to an increased abundance of Lysinibacillus. Methanobrevibacter represent the main methanogens [62], and their abundance is dependent on the abundance of Euryarchaeota. However, the relative abundance of Prevotella was higher in group L; Prevotella is a Gram-negative bacterium, and thus produces LPS [39,63]. In this study, the relative abundance of Solibacillus was lower in the L group. We hypothesized that the abundance of Firmicutes in group L influences the relative abundance of Solibacillus, and that the low-protein diet caused nutrient deficiencies in the animals, resulting in its reduced abundance.
In addition to affecting the composition of the rumen microbiota, dietary protein and RES and HMB supplementation also influence the rumen metabolites and metabolic pathways. Some of these pathways are related to energy metabolism, amino acid metabolism, and immune regulation [25]. Pathways involved in the propanoate, pyruvate, and glyoxylate and dicarboxylate metabolisms are associated with secondary the carbohydrate metabolism, and these pathways were found to be significantly enriched by the differential metabolites. The propanoate metabolism plays an important role in maintaining intestinal homeostasis, and propionic acid and propionate salts have been shown to promote organ development. Propionate salts can be synthesized by the gut microbiota through the succinate pathway from phosphoenolpyruvate [64], and studies have found that propionate salts can be produced by Bacteroidetes and Firmicutes, respectively, from carbohydrates and lactate or succinate salts. Acetyl-CoA plays an important role in energy metabolism. It is an essential enzyme in the tricarboxylic acid cycle [65]. However, Acetyl-CoA can be converted to acetate and coenzyme A [66], which are also involved in fatty acid and the cholesterol metabolism, and show significant correlations with Firmicutes, Lysinibacillus, Solibacillusin, Bacteroidota, and Prevotella. In addition, the metabolites Leu Phe, Leuchylleucine, Dihydrotachysterol, Enterolactone, Falcarindiol, and 2-furancarboxylic acid were found to be significantly associated with Firmicutes, Bacteroidota, Lysinibacillus, Prevotella, and Solibacillus. Adding RES and HMB to a high-protein diet resulted in an increase in the abundance of Leu Phe and Leucylleucine, as HMB is a leucine metabolite involved in protein synthesis [26]. HMB is hydrolyzed by the rumen microbiota into Leu Phe and Leucylleucine in diets containing high protein levels. Dihydrotachysterol is a vitamin D analog, and its hydroxylated metabolite may effectively separate the effects of calcification from parathyroid inhibition [67,68]. Enterolactone is a phenolic metabolite and enterolignin that has been found to reduce the risk of various cancers [69]. Falcarindiol is a naturally occurring polyalkyne with a variety of beneficial biological activities, including being a possible novel anticancer agent [70]. A study has found that 5- (Tetradecycloxy) -2-furancarboxylic acid can lower blood lipids and inhibit fatty acid synthesis, and it represents a new class of hypolipidemic agents [71]. In short, both protein levels and RES and HMB supplementation not only altered the microbial community structures in the rumen, but also affected metabolic pathways and metabolites. Further investigation is needed to explore the relationship between microbiota and metabolites.

5. Conclusions

Given the finding that hybridization altered the microbiome and metabolome, it is possible to explain how the RES and HMB may affect the ruminal function of Tibetan sheep, including digestive enzyme activity, antioxidant capacity, and LPS concentration. Furthermore, CP level and RES/HMB exhibited a positive interaction effect on digestive enzyme activity and antioxidant capacity. Taken together, additive inclusion to a 14% crude protein diet had a more complementary effect on ruminal digestive enzyme activity compared to the 12% CP diet.

Author Contributions

K.Z.: conceptualization, data curation, formal analysis, writing—original draft. Y.Z.: conceptualization, formal analysis, data curation. Z.W., Q.S.: methodology. F.Z.: visualization. S.H.: funding acquisition, project administration. L.G.: conceptualization, project administration, writing—review and editing, funding acquisition. All authors have read and agreed to the published version of the manuscript.

Funding

The current work was funded by Construction of Standardized Production System for Improving quality and efficiency of Tibetan sheep industry (2022-NK-169-1).

Institutional Review Board Statement

All animal procedures for experiments were approved by the Committee of Experimental Animal care and handling techniques were approved (QUA- 2020–0710) by the Qinghai University of Animal Care committee. Moreover, all applicable rules and regulation of the organization and government were followed regarding the ethical use of experimental animals.

Data Availability Statement

The datasets presented in this study can be found in online repositories. The names of the repository/repositories and accession number(s) can be found below: NCBI SRA (accession: PRJNA1108485). MetaboLights (accession: MTBLS10154).

Conflicts of Interest

The authors declare no conflict of interest.

References

  1. Yao, K.; Wang, S.; Gaowa, N.; Huang, S.; Li, S.; Shao, W. Identification of the molecular mechanisms underlying brisket disease in Holstein heifers via microbiota and metabolome analyses. AMB Express 2021, 11, 86. [Google Scholar] [CrossRef]
  2. Zhang, X.; Han, L.; Gui, L.; Raza, S.H.A.; Hou, S.; Yang, B.; Wang, Z.; Ma, Y.; Makhlof, R.T.M.; Alhuwaymil, Z.; et al. Metabolome and microbiome analysis revealed the effect mechanism of different feeding modes on the meat quality of Black Tibetan sheep. Front. Microbiol. 2022, 13, 1076675. [Google Scholar] [CrossRef]
  3. da Silva, P.C.G.; Brandão Ferreira Ítavo, C.C.; Vinhas Ítavo, L.C.; de Nadai Bonin Gomes, M.; Dias Feijó, G.L.; Monteiro Ferelli, K.L.S.; da Silva Heimbach, N.; da Silva, J.A.; de Melo, G.K.A.; Filgueira Pereira, M.W. Carcass traits and meat quality of Texel lambs raised in Brachiaria pasture and feedlot systems. Anim. Sci. J. Nihon Chikusan Gakkaiho 2020, 91, e13394. [Google Scholar] [CrossRef] [PubMed]
  4. Li, L.L.; Ma, S.K.; Peng, W.; Fang, Y.G.; Duo, H.R.; Fu, H.Y.; Jia, G.X. Genetic diversity and population structure of Tibetan sheep breeds determined by whole genome resequencing. Trop. Anim. Health Prod. 2021, 53, 174. [Google Scholar] [CrossRef]
  5. Yue, Z.B.; Li, W.W.; Yu, H.Q. Application of rumen microorganisms for anaerobic bioconversion of lignocellulosic biomass. Bioresour. Technol. 2013, 128, 738–744. [Google Scholar] [CrossRef]
  6. Connor, E.E.; Baldwin, R.L.t.; Li, C.J.; Li, R.W.; Chung, H. Gene expression in bovine rumen epithelium during weaning identifies molecular regulators of rumen development and growth. Funct. Integr. Genom. 2013, 13, 133–142. [Google Scholar] [CrossRef] [PubMed]
  7. Chen, L.; Qiu, Q.; Jiang, Y.; Wang, K.; Lin, Z.; Li, Z.; Bibi, F.; Yang, Y.; Wang, J.; Nie, W.; et al. Large-scale ruminant genome sequencing provides insights into their evolution and distinct traits. Science 2019, 364, eaav6202. [Google Scholar] [CrossRef] [PubMed]
  8. Xiang, R.; Oddy, V.H.; Archibald, A.L.; Vercoe, P.E.; Dalrymple, B.P. Epithelial, metabolic and innate immunity transcriptomic signatures differentiating the rumen from other sheep and mammalian gastrointestinal tract tissues. PeerJ 2016, 4, e1762. [Google Scholar] [CrossRef] [PubMed]
  9. Wang, M.; Wang, H.; Zheng, H.; Dewhurst, R.; Roehe, R. A Knowledge-Driven Network-Based Analytical Framework for the Identification of Rumen Metabolites. IEEE Trans. Nanobioscience 2020, 19, 518–526. [Google Scholar] [CrossRef]
  10. Saleem, F.; Bouatra, S.; Guo, A.C.; Psychogios, N.; Mandal, R.; Dunn, S.M.; Ametaj, B.N.; Wishart, D.S. The Bovine Ruminal Fluid Metabolome. Metabolomics 2013, 9, 360–378. [Google Scholar] [CrossRef]
  11. Wang, L.; Zhang, K.; Zhang, C.; Feng, Y.; Zhang, X.; Wang, X.; Wu, G. Dynamics and stabilization of the rumen microbiome in yearling Tibetan sheep. Sci. Rep. 2019, 9, 19620. [Google Scholar] [CrossRef]
  12. Khazaei, M.; Rahmati, S.; Khazaei, M.R.; Rezakhani, L. Accelerated wound healing with resveratrol-loaded decellularized pericardium in mice model. Cell Tissue Bank. 2024, 25, 245–253. [Google Scholar] [CrossRef]
  13. Meng, Q.; Li, J.; Wang, C.; Shan, A. Biological function of resveratrol and its application in animal production: A review. J. Anim. Sci. Biotechnol. 2023, 14, 25. [Google Scholar] [CrossRef]
  14. Zhang, R.; Zhang, W.B.; Bi, Y.L.; Tu, Y.; Ma, T.; Dong, L.F.; Du, H.C.; Diao, Q.Y. Sanguinarine and resveratrol affected rumen fermentation parameters and bacterial community in calves. Anim. Feed Sci. Technol. 2019, 251, 64–75. [Google Scholar] [CrossRef]
  15. Ma, T.; Chen, D.D.; Tu, Y.; Zhang, N.F.; Si, B.W.; Deng, K.D.; Diao, Q.Y. Effect of dietary supplementation with resveratrol on nutrient digestibility, methanogenesis and ruminal microbial flora in sheep. J. Anim. Physiol. Anim. Nutr. 2015, 99, 676–683. [Google Scholar] [CrossRef] [PubMed]
  16. Sun, H.; Wu, Y.; Wang, Y.; Wang, C.; Liu, J. Effects of addition of Aspergillus oryzae culture and 2-hydroxyl-4-(methylthio) butanoic acid on milk performance and rumen fermentation of dairy cows. Anim. Sci. J. Nihon Chikusan Gakkaiho 2017, 88, 602–609. [Google Scholar] [CrossRef] [PubMed]
  17. Martin, C.; Mirande, C.; Morgavi, D.P.; Forano, E.; Devillard, E.; Mosoni, P. Methionine analogues HMB and HMBi increase the abundance of cellulolytic bacterial representatives in the rumen of cattle with no direct effects on fibre degradation. Anim. Feed Sci. Technol. 2013, 182, 16–24. [Google Scholar] [CrossRef]
  18. Noftsger, S.M.; St-Pierre, N.R.; Karnati, S.K.; Firkins, J.L. Effects of 2-hydroxy-4-(methylthio) butanoic acid (HMB) on microbial growth in continuous culture. J. Dairy Sci. 2003, 86, 2629–2636. [Google Scholar] [CrossRef]
  19. Chen, S.; Zhou, Y.; Chen, Y.; Gu, J. fastp: An ultra-fast all-in-one FASTQ preprocessor. Bioinformatics 2018, 34, i884–i890. [Google Scholar] [CrossRef]
  20. Magoč, T.; Salzberg, S.L. FLASH: Fast length adjustment of short reads to improve genome assemblies. Bioinformatics 2011, 27, 2957–2963. [Google Scholar] [CrossRef]
  21. Edgar, R.C. UPARSE: Highly accurate OTU sequences from microbial amplicon reads. Nat. Methods 2013, 10, 996–998. [Google Scholar] [CrossRef] [PubMed]
  22. Edgar, R.C.; Haas, B.J.; Clemente, J.C.; Quince, C.; Knight, R. UCHIME improves sensitivity and speed of chimera detection. Bioinformatics 2011, 27, 2194–2200. [Google Scholar] [CrossRef] [PubMed]
  23. Ondov, B.D.; Bergman, N.H.; Phillippy, A.M. Interactive metagenomic visualization in a Web browser. BMC Bioinform. 2011, 12, 385. [Google Scholar] [CrossRef] [PubMed]
  24. Wickham, H. ggplot2. WIREs Comput. Stat. 2011, 3, 180–185. [Google Scholar] [CrossRef]
  25. Zhang, R.; Wu, J.; Lei, Y.; Bai, Y.; Jia, L.; Li, Z.; Liu, T.; Xu, Y.; Sun, J.; Wang, Y.; et al. Oregano Essential Oils Promote Rumen Digestive Ability by Modulating Epithelial Development and Microbiota Composition in Beef Cattle. Front. Nutr. 2021, 8, 722557. [Google Scholar] [CrossRef] [PubMed]
  26. Holeček, M. Beta-hydroxy-beta-methylbutyrate supplementation and skeletal muscle in healthy and muscle-wasting conditions. J. Cachexia Sarcopenia Muscle 2017, 8, 529–541. [Google Scholar] [CrossRef] [PubMed]
  27. Duan, Y.; Li, F.; Li, Y.; Tang, Y.; Kong, X.; Feng, Z.; Anthony, T.G.; Watford, M.; Hou, Y.; Wu, G.; et al. The role of leucine and its metabolites in protein and energy metabolism. Amino Acids 2016, 48, 41–51. [Google Scholar] [CrossRef] [PubMed]
  28. Yang, S.; Xu, W.; Feng, L.; Zhang, C.; Yan, C.; Zhang, J.; Lai, J.; Yan, T.; He, Z.; Du, X.; et al. Resveratrol Improves the Digestive Ability and the Intestinal Health of Siberian Sturgeon. Int. J. Mol. Sci. 2022, 23, 11977. [Google Scholar] [CrossRef]
  29. Yengkokpam, S.; Debnath, D.; Sahu, N.P.; Pal, A.K.; Jain, K.K.; Baruah, K. Dietary protein enhances non-specific immunity, anti-oxidative capability and resistance to Aeromonas hydrophila in Labeo rohita fingerlings pre-exposed to short feed deprivation stress. Fish Shellfish. Immunol. 2016, 59, 439–446. [Google Scholar] [CrossRef]
  30. Diaz-Medina, L.K.; Colín-Navarro, V.; Arriaga-Jordán, C.M.; Brunett-Pérez, L.; Vázquez-de-Aldana, B.R.; Estrada-Flores, J.G. In vitro nutritional quality and antioxidant activity of three weed species as feed additives for sheep in the Central Highlands of Mexico. Trop. Anim. Health Prod. 2021, 53, 394. [Google Scholar] [CrossRef]
  31. Kaisoon, O.; Siriamornpun, S.; Weerapreeyakul, N.; Meeso, N. Phenolic compounds and antioxidant activities of edible flowers from Thailand. J. Funct. Foods 2011, 3, 88–99. [Google Scholar] [CrossRef]
  32. Dvoretskiy, S.; Pereira, S.L.; Das, T. Efficacy of Nutrients in Reducing the Symptoms of Radiation Induced Oral Mucositis in a Hamster Model. Nutr. Cancer 2022, 74, 1079–1089. [Google Scholar] [CrossRef] [PubMed]
  33. Chen, X.; Xiang, L.; Jia, G.; Liu, G.; Zhao, H.; Huang, Z. Effects of dietary leucine on antioxidant activity and expression of antioxidant and mitochondrial-related genes in longissimus dorsi muscle and liver of piglets. Anim. Sci. J. Nihon Chikusan Gakkaiho 2019, 90, 990–998. [Google Scholar] [CrossRef] [PubMed]
  34. Szabolcs, A.; Varga, I.S.; Varga, C.; Berkó, A.; Kaszaki, J.; Letoha, T.; Tiszlavicz, L.; Sári, R.; Lonovics, J.; Takács, T. Beneficial effect of resveratrol on cholecystokinin-induced experimental pancreatitis. Eur. J. Pharmacol. 2006, 532, 187–193. [Google Scholar] [CrossRef]
  35. Tian, B.; Liu, J. Resveratrol: A review of plant sources, synthesis, stability, modification and food application. J. Sci. Food Agric. 2020, 100, 1392–1404. [Google Scholar] [CrossRef]
  36. Zhang, X.; Jiang, L.; Chen, H.; Wei, S.; Yao, K.; Sun, X.; Yang, G.; Jiang, L.; Zhang, C.; Wang, N.; et al. Resveratrol protected acrolein-induced ferroptosis and insulin secretion dysfunction via ER-stress-related PERK pathway in MIN6 cells. Toxicology 2022, 465, 153048. [Google Scholar] [CrossRef]
  37. Chen, X.; Zeng, Z.; Huang, Z.; Chen, D.; He, J.; Chen, H.; Yu, B.; Yu, J.; Luo, J.; Luo, Y.; et al. Effects of dietary resveratrol supplementation on immunity, antioxidative capacity and intestinal barrier function in weaning piglets. Anim. Biotechnol. 2021, 32, 240–245. [Google Scholar] [CrossRef]
  38. Deminice, R.; Portari, G.V.; Marchini, J.S.; Vannucchi, H.; Jordao, A.A. Effects of a low-protein diet on plasma amino acid and homocysteine levels and oxidative status in rats. Ann. Nutr. Metab. 2009, 54, 202–207. [Google Scholar] [CrossRef]
  39. Raetz, C.R.; Whitfield, C. Lipopolysaccharide endotoxins. Annu. Rev. Biochem. 2002, 71, 635–700. [Google Scholar] [CrossRef]
  40. Duan, Y.; Zheng, C.; Zhong, Y.; Song, B.; Yan, Z.; Kong, X.; Deng, J.; Li, F.; Yin, Y. Beta-hydroxy beta-methyl butyrate decreases muscle protein degradation via increased Akt/FoxO3a signaling and mitochondrial biogenesis in weanling piglets after lipopolysaccharide challenge. Food Funct. 2019, 10, 5152–5165. [Google Scholar] [CrossRef]
  41. Zheng, C.; Song, B.; Duan, Y.; Zhong, Y.; Yan, Z.; Zhang, S.; Li, F. Dietary β-hydroxy-β-methylbutyrate improves intestinal function in weaned piglets after lipopolysaccharide challenge. Nutrition 2020, 78, 110839. [Google Scholar] [CrossRef] [PubMed]
  42. Einbond, L.S.; Zhou, J.; Wu, H.A.; Mbazor, E.; Song, G.; Balick, M.; DeVoti, J.A.; Redenti, S.; Castellanos, M.R. A novel cancer preventative botanical mixture, TriCurin, inhibits viral transcripts and the growth of W12 cervical cells harbouring extrachromosomal or integrated HPV16 DNA. Br. J. Cancer 2021, 124, 901–913. [Google Scholar] [CrossRef]
  43. Gómez-Zorita, S.; González-Arceo, M.; Trepiana, J.; Aguirre, L.; Crujeiras, A.B.; Irles, E.; Segues, N.; Bujanda, L.; Portillo, M.P. Comparative Effects of Pterostilbene and Its Parent Compound Resveratrol on Oxidative Stress and Inflammation in Steatohepatitis Induced by High-Fat High-Fructose Feeding. Antioxidants 2020, 9, 1042. [Google Scholar] [CrossRef]
  44. Mota, M.; Porrini, V.; Parrella, E.; Benarese, M.; Bellucci, A.; Rhein, S.; Schwaninger, M.; Pizzi, M. Neuroprotective epi-drugs quench the inflammatory response and microglial/macrophage activation in a mouse model of permanent brain ischemia. J. Neuroinflammation 2020, 17, 361. [Google Scholar] [CrossRef] [PubMed]
  45. Ding, S.; Jiang, H.; Fang, J.; Liu, G. Regulatory Effect of Resveratrol on Inflammation Induced by Lipopolysaccharides via Reprograming Intestinal Microbes and Ameliorating Serum Metabolism Profiles. Front. Immunol. 2021, 12, 777159. [Google Scholar] [CrossRef] [PubMed]
  46. Chen, L.; Yang, S.; Zumbrun, E.E.; Guan, H.; Nagarkatti, P.S.; Nagarkatti, M. Resveratrol attenuates lipopolysaccharide-induced acute kidney injury by suppressing inflammation driven by macrophages. Mol. Nutr. Food Res. 2015, 59, 853–864. [Google Scholar] [CrossRef]
  47. Giri, S.S.; Sen, S.S.; Jun, J.W.; Sukumaran, V.; Park, S.C. Protective effects of leucine against lipopolysaccharide-induced inflammatory response in Labeo rohita fingerlings. Fish Shellfish. Immunol. 2016, 52, 239–247. [Google Scholar] [CrossRef] [PubMed]
  48. Zhang, Y.; Yu, W.; Han, D.; Meng, J.; Wang, H.; Cao, G. L-lysine ameliorates sepsis-induced acute lung injury in a lipopolysaccharide-induced mouse model. Biomed. Pharmacother. 2019, 118, 109307. [Google Scholar] [CrossRef] [PubMed]
  49. Jiang, J.; Yin, L.; Li, J.Y.; Li, Q.; Shi, D.; Feng, L.; Liu, Y.; Jiang, W.D.; Wu, P.; Zhao, Y.; et al. Glutamate attenuates lipopolysaccharide-induced oxidative damage and mRNA expression changes of tight junction and defensin proteins, inflammatory and apoptosis response signaling molecules in the intestine of fish. Fish Shellfish. Immunol. 2017, 70, 473–484. [Google Scholar] [CrossRef]
  50. Lanza, V.F.; Tedim, A.P.; Martínez, J.L.; Baquero, F.; Coque, T.M. The Plasmidome of Firmicutes: Impact on the Emergence and the Spread of Resistance to Antimicrobials. Microbiol. Spectr. 2015, 3, 379–419. [Google Scholar] [CrossRef]
  51. Luo, Z.; Li, C.; Cheng, Y.; Hang, S.; Zhu, W. Effects of low dietary protein on the metabolites and microbial communities in the caecal digesta of piglets. Arch. Anim. Nutr. 2015, 69, 212–226. [Google Scholar] [CrossRef] [PubMed]
  52. Moissl-Eichinger, C.; Pausan, M.; Taffner, J.; Berg, G.; Bang, C.; Schmitz, R.A. Archaea Are Interactive Components of Complex Microbiomes. Trends Microbiol. 2018, 26, 70–85. [Google Scholar] [CrossRef] [PubMed]
  53. Vanegas, J.L.; González, J.; Carro, M.D. Influence of protein fermentation and carbohydrate source on in vitro methane production. J. Anim. Physiol. Anim. Nutr. 2017, 101, e288–e296. [Google Scholar] [CrossRef] [PubMed]
  54. Hurley, A.M.; López-Villalobos, N.; McParland, S.; Kennedy, E.; Lewis, E.; O’Donovan, M.; Burke, J.L.; Berry, D.P. Inter-relationships among alternative definitions of feed efficiency in grazing lactating dairy cows. J. Dairy Sci. 2016, 99, 468–479. [Google Scholar] [CrossRef] [PubMed]
  55. Henderson, I.R.; Lam, A.C. Polymorphic proteins of Chlamydia spp.--autotransporters beyond the Proteobacteria. Trends Microbiol. 2001, 9, 573–578. [Google Scholar] [CrossRef] [PubMed]
  56. Li, Z.; Tang, W.; Gong, S.; Li, Y.; Xia, S.; Zhang, B.; Ma, J. Effects of dietary protein on gut development, microbial compositions and mucin expressions in mice. J. Appl. Microbiol. 2022, 132, 2262–2269. [Google Scholar] [CrossRef] [PubMed]
  57. Rizzatti, G.; Lopetuso, L.R.; Gibiino, G.; Binda, C.; Gasbarrini, A. Proteobacteria: A Common Factor in Human Diseases. BioMed Res. Int. 2017, 2017, 9351507. [Google Scholar] [CrossRef] [PubMed]
  58. Meng, X.; Shu, Q. Novel primers to identify a wider diversity of butyrate-producing bacteria. World J. Microbiol. Biotechnol. 2024, 40, 76. [Google Scholar] [CrossRef] [PubMed]
  59. Song, X.; Liu, L.; Peng, S.; Liu, T.; Chen, Y.; Jia, R.; Zou, Y.; Li, L.; Zhao, X.; Liang, X.; et al. Resveratrol regulates intestinal barrier function in cyclophosphamide-induced immunosuppressed mice. J. Sci. Food Agric. 2022, 102, 1205–1215. [Google Scholar] [CrossRef]
  60. Duan, Y.; Zhong, Y.; Xiao, H.; Zheng, C.; Song, B.; Wang, W.; Guo, Q.; Li, Y.; Han, H.; Gao, J.; et al. Gut microbiota mediates the protective effects of dietary β-hydroxy-β-methylbutyrate (HMB) against obesity induced by high-fat diets. FASEB J. Off. Publ. Fed. Am. Soc. Exp. Biol. 2019, 33, 10019–10033. [Google Scholar] [CrossRef]
  61. Zhao, R.; Coker, O.O.; Wu, J.; Zhou, Y.; Zhao, L.; Nakatsu, G.; Bian, X.; Wei, H.; Chan, A.W.H.; Sung, J.J.Y.; et al. Aspirin Reduces Colorectal Tumor Development in Mice and Gut Microbes Reduce its Bioavailability and Chemopreventive Effects. Gastroenterology 2020, 159, 969–983.e964. [Google Scholar] [CrossRef] [PubMed]
  62. Mathur, R.; Kim, G.; Morales, W.; Sung, J.; Rooks, E.; Pokkunuri, V.; Weitsman, S.; Barlow, G.M.; Chang, C.; Pimentel, M. Intestinal Methanobrevibacter smithii but not total bacteria is related to diet-induced weight gain in rats. Obesity 2013, 21, 748–754. [Google Scholar] [CrossRef] [PubMed]
  63. Funayama, H.; Mayanagi, H.; Takada, H.; Endo, Y. Elevation of histidine decarboxylase activity in the mandible of mice by Prevotella intermedia lipopolysaccharide and its augmentation by an aminobisphosphonate. Arch. Oral Biol. 2000, 45, 787–795. [Google Scholar] [CrossRef] [PubMed]
  64. Wang, X.; Cai, Z.; Wang, Q.; Wu, C.; Sun, Y.; Wang, Z.; Xu, X.; Xue, W.; Cao, Z.; Zhang, M.; et al. Bacteroides methylmalonyl-CoA mutase produces propionate that promotes intestinal goblet cell differentiation and homeostasis. Cell Host Microbe 2024, 32, 63–78.e67. [Google Scholar] [CrossRef] [PubMed]
  65. Ma, T.; Liu, T.; Xie, P.; Jiang, S.; Yi, W.; Dai, P.; Guo, X. UPLC-MS-based urine nontargeted metabolic profiling identifies dysregulation of pantothenate and CoA biosynthesis pathway in diabetic kidney disease. Life Sci. 2020, 258, 118160. [Google Scholar] [CrossRef]
  66. Wang, J.; Wen, Y.; Zhao, W.; Zhang, Y.; Lin, F.; Ouyang, C.; Wang, H.; Yao, L.; Ma, H.; Zhuo, Y.; et al. Hepatic conversion of acetyl-CoA to acetate plays crucial roles in energy stress. eLife 2023, 12, RP87419. [Google Scholar] [CrossRef] [PubMed]
  67. Fan, S.L.; Schroeder, N.J.; Calverley, M.J.; Burrin, J.M.; Makin, H.L.; Cunningham, J. Potent suppression of the parathyroid glands by hydroxylated metabolites of dihydrotachysterol(2). Nephrol. Dial. Transplant. Off. Publ. Eur. Dial. Transpl. Assoc.-Eur. Ren. Assoc. 2000, 15, 1943–1949. [Google Scholar] [CrossRef] [PubMed]
  68. Lawson, D.E.; Bell, P.A. Metabolism of dihydrotachysterol and 5,6-trans-cholecalciferol in the chick and the rat. Biochem. J. 1974, 142, 37–46. [Google Scholar] [CrossRef] [PubMed]
  69. Liu, H.; Liu, J.; Wang, S.; Zeng, Z.; Li, T.; Liu, Y.; Mastriani, E.; Li, Q.H.; Bao, H.X.; Zhou, Y.J.; et al. Enterolactone has stronger effects than enterodiol on ovarian cancer. J. Ovarian Res. 2017, 10, 49. [Google Scholar] [CrossRef]
  70. Jin, H.R.; Zhao, J.; Zhang, Z.; Liao, Y.; Wang, C.Z.; Huang, W.H.; Li, S.P.; He, T.C.; Yuan, C.S.; Du, W. The antitumor natural compound falcarindiol promotes cancer cell death by inducing endoplasmic reticulum stress. Cell Death Dis. 2012, 3, e376. [Google Scholar] [CrossRef]
  71. Parker, R.A.; Kariya, T.; Grisar, J.M.; Petrow, V. 5-(Tetradecyloxy)-2-furancarboxylic acid and related hypolipidemic fatty acid-like alkyloxyarylcarboxylic acids. J. Med. Chem. 1977, 20, 781–791. [Google Scholar] [CrossRef] [PubMed]
Figure 1. Rumen microbial diversity. (A) A Venn diagram showing the number of OTUs. (B) PCoA principal component analysis was performed on OTU abundance. The PCo1 and PCo2 coordinates indicate the first and second principal components, and the percentages in parentheses indicate the contribution of the principal components to the differences in the samples. Points of different colors in the Figure indicate the groups of samples, respectively. (C) Principal component analysis using the Bray–Curtis of OTU level β diversity. (D) Principal component analysis (PCA) was performed on the β diversity at the OTU level using the Unweighted unifrac analysis method. In the (C,D), the Y-axis of the box plot indicates the distance rankings, and the X-axis indicates the between-group distances.
Agriculture 14 00936 g001
Figure 2. Analysis of the alpha diversity. (A) Shannon, (B) Simpson, (C) Chao 1, and (D) ACE indices were used to determine the diversity of microbial α. * p < 0.05.
Agriculture 14 00936 g002
Figure 3. Composition and differences of rumen microbial community in Tibetan sheep. (A) Composition of microbial communities at phylum and genus level, with each bar graph showing the relative abundance of the top ten microbiota in each group. (B) The abundance of the top six microflora at phylum level. Expression of protein levels, RES and HMB levels, and protein levels interacting with RES and HMB. (C) The abundance of the top five microflora at genus level. Expression of protein levels, RES and HMB levels, and protein levels interacting with RES and HMB. The values shown in the bar graphs are expressed as “mean ± SEM”, and differences in the graphs are marked with lowercase letters, (p < 0.05).
Agriculture 14 00936 g003
Figure 4. KEGG function prediction. (A) L group. (B) L-RES-HMB group. (C) H group. (D) H-RES-HMB group. The longitudinal axis arranges different grades of KEGG pathways, and the length of the column indicates the corresponding functional abundance in the pathway.
Agriculture 14 00936 g004
Figure 5. Protein levels and RES and HMB altered the levels of metabolites in the rumen content of Tibetan sheep. (A) shows OPLS-DA diagrams of positive ions of L and L-RES-HMB groups, H and H-ERS-HMB groups, and L-RES-HMB and H-RES-HMB groups. The abscissa represents the predicted component score values to show the difference between groups, and the ordinate represents the orthogonal component score values to show the difference between groups. On the second row are the displacement test plots to evaluate the accuracy of OPLS-DA; the ordinate represents the value of R2Y or Q2, and the abscissa represents the replacement retention rate. (B) shows OPLS-DA diagrams of negative ions of L and L-RES-HMB groups, H and H-res-HMB groups, and L-RES-HMB and H-res-HMB groups. Others as in Figure (A).
Agriculture 14 00936 g005
Figure 6. The Venn diagram shows the common and endemic metabolites in the three comparisons (L with L-RES-HMB; H with H-RES-HMB; and L-RES-HMB with H-RES-HMB). The three comparison common metabolites are shown on the right, and the red and blue letters represent the upregulation and downregulation of metabolites, respectively.
Agriculture 14 00936 g006
Figure 7. In the metabolic pathway enrichment analysis, the size of the bubble indicates the number of the differential metabolism enriched into the pathway, and the color of the bubble indicates the significance of the enrichment in the pathway, and the larger the value, the more significant the enrichment. (A) Enrichment analysis between L group and L-RES-HMB group. (B) Enrichment analysis of group H and H-RES-HMB. (C) Enrichment analysis of L-RES-HMB and H-RES-HMB groups.
Agriculture 14 00936 g007
Figure 8. In a Spearman’s correlation analysis, blue indicates a negative correlation, red indicates a positive correlation, and the darker the color, the stronger the correlation. Edge width corresponds to the Mantel’s r statistic for the corresponding distance correlation, and edge color denotes statistical significance. * p < 0.05. ** p < 0.01. *** p < 0.001. (A) Spearman correlation heatmap between rumen bacteria and digestive enzyme activity, antioxidant activity, and LPS concentration. (B) Spearman correlation heatmap between rumen metabolome and digestive enzyme activity, antioxidant capacity, and LPS concentration. (C) Spearman-related heatmap of rumen bacteria and metabolome.
Agriculture 14 00936 g008
Table 1. Composition of the basic diet.
L-CPH-CP
Ingredient (%)
Corn58.3051.50
Soybean meal1.002.00
Rapeseed meal7.0012.80
Cottonseed meal2.002.00
Palm meal25.0025.00
NaCl1.001.00
Limestone1.001.00
Baking soda0.100.10
Premix (1)4.604.60
Total100100
Nutrient levels (2)
Digestible energy (MJ·kg−1) 12.7112.84
Crude protein (%)14.2712.13
Ether extract (%)3.293.44
Crude fiber (%)11.6411.05
Neutral detergent fiber (%)26.7026.04
Acid detergent fiber (%)19.9719.11
Ca (%)0.860.80
P (%)0.400.40
Note: (1) Premixes provide Cu 18 mg, Fe 66 mg, Zn 30 mg, Mn 48 mg, Se 0.36 mg, I 0.6 mg, Co 0.24 mg, VA 24,000 IU, VD 4800 IU, and VE 48 IU per kg of feed. (2) Digestible energy is calculated, and the rest is measured.
Table 2. Effects of RES and HMB supplementation at different protein levels on digestive enzyme activities in the rumen of Tibetan sheep.
Trypsin
(ng/mL)
Chymotrypsin (ng/L)Lipase
(ng/L)
Cellulase
(ng/L)
α-Amylase
(μmol/L)
GroupsL32.79 ± 1.50 a738.42 ± 55.10 a278.08 ± 61.63 a308.35 ± 19.29101.16 ± 11.20
L-RES-HMB32.49 ± 1.42 a761.33 ± 35.20 a289.62 ± 11.54 a314.11 ± 21.92112.50 ± 5.44
H23.23 ± 3.38 b539.67 ± 12.61 b180.38 ± 7.12 b280.07 ± 10.76123.33 ± 13.54
H-RES-HMB32.90 ± 2.88 a764.67 ± 60.92 a231.28 ± 10.59 a294.04 ± 10.43118.82 ± 31.08
p-valueCP level<0.001<0.001<0.0010.0540.080
RES-HMB<0.001<0.0010.0010.1900.659
RES-HMB × CP level<0.001<0.0010.0130.5770.312
“CP Level” indicates dietary protein level (12% protein and 14% protein). “RES-HMB” indicates non-supplemented and HMB (1.25 g/day) plus RES (1.50 g/day). “RES-HMB × CP Level” indicates the interaction of RES and HMB with dietary protein level. Data in the same column with the same or no lowercase letters indicate nonsignificant differences (p > 0.05), and data with different lowercase letters indicate significant differences (p < 0.05).
Table 3. Effects of RES and HMB supplementation at different protein levels on the antioxidant capacity in the rumen of Tibetan sheep.
GSH-PX
(pmol/mL)
SOD
(pg/mL)
T-AOC
U-(u/mL)
CAT
(ng/L)
MDA
(pg/mL)
GroupsL26.61 ± 5.82167.18 ± 9.523.06 ± 0.28128.04 ± 10.101.57 ± 0.59
L-RES-HMB28.33 ± 6.41174.70 ± 7.293.55 ± 0.73140.65 ± 4.261.24 ± 0.14
H38.64 ± 2.62174.76 ± 4.253.06 ± 0.30119.78 ± 13.381.59 ± 0.33
H-RES-HMB31.55 ± 0.87182.77 ± 11.413.97 ± 0.63143.36 ± 6.050.99 ± 0.50
p-valueCP Level0.0160.0930.4760.5440.570
RES-HMB0.3380.0950.0290.0010.032
RES-HMB × CP
level
0.1280.9560.4630.2380.513
“CP Level” indicates dietary protein level (12% protein and 14% protein). “RES-HMB” indicates non-supplemented and HMB (1.25 g/day) plus RES (1.50 g/day). “RES-HMB × CP Level” indicates the interaction of RES and HMB with dietary protein level.
Table 4. Effects of RES and HMB supplementation at different protein levels on LPS concentration of rumen in Tibetan sheep.
LPS (ng/L)
GroupsL279.05 ± 18.70 a
L-RES + HMB268.25 ± 10.74 a
H226.19 ± 13.11 b
H-RES + HMB200.40 ± 15.61 c
p-valueCP level<0.001
RES-HMB0.024
RES-HMB × CP Level0.049
“CP Level” indicates dietary protein level (12% protein and 14% protein). “RES-HMB” indicates non-supplemented and HMB (1.25 g/day) plus RES (1.50 g/day). “RES-HMB × CP Level” indicates the interaction of RES and HMB with dietary protein level. Data with different lowercase letters indicate significant differences (p < 0.05).
Disclaimer/Publisher’s Note: The statements, opinions and data contained in all publications are solely those of the individual author(s) and contributor(s) and not of MDPI and/or the editor(s). MDPI and/or the editor(s) disclaim responsibility for any injury to people or property resulting from any ideas, methods, instructions or products referred to in the content.