Article

Technical Efficiency and Allocative Efficiency of Beef Cattle Fattening in the Content of Digital Economy: An Empirical Study Based on Survey in China

1
School of Economics, Shandong Women’s University, Ji’nan 250300, China
2
College of Economics and Management, Hebei Agricultural University, Baoding 071000, China
3
Marine Development Studies Institute, Ocean University of China, Qingdao 266100, China
4
School of Humanities and Law, Zhejiang A&F University, Hangzhou 311300, China
*
Author to whom correspondence should be addressed.
Agriculture 2024, 14(7), 1007; https://doi.org/10.3390/agriculture14071007
Submission received: 12 May 2024 / Revised: 11 June 2024 / Accepted: 24 June 2024 / Published: 26 June 2024
(This article belongs to the Section Agricultural Economics, Policies and Rural Management)

Abstract

:
This study applies data envelopment analysis (DEA) to gauge technical efficiency and allocative efficiency in China’s beef cattle-fattening industry using survey data. The Tobit model considers the salient determinants that drive these efficiencies. The results indicate that (1) large-scale farms exhibit robust TE and pure technical efficiencies (PTE), whereas scale efficiencies (SE) diverge significantly between large and medium-sized operations. The cost efficiency (CE) of smaller farms lags behind their larger counterparts, with the latter displaying greater revenue efficiencies (RE) and profit efficiency (PE). (2) The influence of identical factors on the efficiency of beef cattle fattening production can vary, sometimes antithetically, across different scales. Local policy interventions must be differentiated according to farm type and size. (3) The unique context of China’s national conditions and the status quo of livestock farming render the dual implementation of environmental regulations and technological subsidies less viable for Chinese beef cattle farms. These entities should prioritize production over technological innovation and advancement. Policymakers should adopt strategies such as targeted skill/technological training for farm managers at particular scales of operation. This could represent a critical trajectory to augment the efficiency of beef cattle production and increase beef yield in China.

1. Introduction

Productivity efficiency reflects the ratio of a producer’s actual output to their maximum potential output. This ratio signifies the extent to which the production possibility frontier (PPF) is achieved or the proximity to it, which is indicative of the degree to which maximum output, set objectives, or an optimal state is reached. It is frequently utilized to evaluate performance levels concerning producers’ input–output ratios and cost-benefit analyses Farrell [1]. Pareto efficiency, which is the core concept of productivity efficiency, assumes a perfectly competitive market. It posits that a production unit operates on the PPF, achieving a state where it is impossible to reduce the production of one product without diminishing the production of another, essentially signifying a state of ‘no waste of resources’ [2]. In academic research, the production efficiency of individual production entities is generally delineated and measured by calculating the current industry’s production frontier, which is synonymous with PPF. In 1957, Farrell first distinguished between technological progress and technical efficiency, proposing that a producer’s efficiency comprises two components: technical efficiency (TE), the capacity to maximize output from a given set of inputs, and allocation efficiency (AE), the ability to optimally allocate production factor resources and reap benefits under given prices and technology [1]. Collectively, these factors constitute economic efficiency, which is synonymous with production efficiency. Farrell introduced a novel analytical framework, discussing the roles of scale and price in production efficiency and raising the issue of allocation efficiency [3,4].
Technical efficiency can be defined from both the input and output perspectives as the ratio of a firm’s actual input to the ideal minimum input, given the same output, or the ratio of actual to ideal output when the input factors are constant. The discrepancy between actual industrial output and ideal output is termed technical inefficiency (or technical efficiency loss) [3,5]. When the assumption of a constant production scale is relaxed, allowing for variable returns to scale, the resultant efficiency measurement excludes the impact of scale on technical efficiency, denoted as pure technical efficiency (PTE) in production efficiency theory [6]. Conversely, technical efficiency, measured under the assumption of a constant scale, is termed comprehensive technical efficiency and includes scale effects [7]. The difference between pure and comprehensive technical efficiency lies solely in the impact of scale; thus, the interrelation between these efficiencies can be leveraged to ascertain the influence of scale on production, known as scale efficiency (SE), SE = TE/PTE [8].
When prices of inputs and outputs are known, allocation efficiency can be measured based on technical efficiency to determine the role of pricing in the allocation of production factors [1]. Under the given production technology levels and known factor and product prices, this efficiency pertains to the producer’s optimal allocation of resources, which is linked to the cost, revenue, and profit of factor inputs. Farrell, Färe, Grosskopf, and Lovell have made notable contributions to efficiency measurement. Cost efficiency (CE) can be calculated when input factor prices are known, revenue efficiency (RE)—when product prices are known, and profit efficiency (PE)—when both are known [9,10]. These efficiencies include the inherent effects of technology and pricing. By isolating the technological components from these three efficiencies, the role of pricing in production efficiency is effectively separated, yielding AE, which is the impact of factor and product prices on resource allocation, and hence, their close association [7,11]. Farrell’s research, under input-oriented conditions, posits that allocation efficiency is primarily determined by the cost of input factors, which can be derived as AE = CE/TE. Additionally, scholars investigated allocation efficiency from an output-oriented perspective, calculated using revenue and technical efficiency, reflecting the producer’s efficiency in factor allocation based on product prices [6,8]. Farrell and Färe separately discussed the meanings and interrelationships of these efficiencies under input-oriented (minimization of input) and output-oriented (maximization of output) conditions, with differences in the calculated allocation efficiency under different orientations [1,7]. Balk refers to the allocation efficiency calculated under cost efficiency as the input-oriented allocation efficiency and that under revenue efficiency as the output-oriented allocation efficiency [11]. This paper employs a geometric analysis of Farrell and Färe’s discussions on input and output orientations to analyze the technical, cost, revenue, and input-oriented allocation efficiencies of beef cattle farming [1,7]. Under a profit-maximization orientation, the discussion on production efficiency can lead to PE, assuming cost minimization and output maximization and considering both factor and product prices simultaneously. However, this is a complex issue, primarily studied using linear programming methods, with the DEA method providing a pathway for measuring profit efficiency [3,7].

2. Literature Review

Beef cattle farming in China is predominantly characterized by smallholders, with small-scale farmers accounting for 90% of the national market output. These farms are price takers in both the factor and product markets and lack the power to influence market prices [12]. In markets with imperfect competition, the level of economic efficiency is a direct reflection of the competitiveness of beef cattle production and serves as an economic tool to increase output amid tightening resource constraints and a lagging factor supply. The assessment of economic efficiency in beef cattle production must consider both the maximization of output under a given combination of inputs such as calves, feed, and labor, termed technical efficiency, and the level of factor allocation under fixed input prices, known as allocation efficiency [12,13]. Within the traditional framework of economic efficiency theory, these two aspects are used to depict the characteristics and patterns of resource use in beef cattle production. The production process, influenced by social conditions and local economic development, necessitates the inclusion of external shock factors for a more objective and accurate evaluation of economic efficiency [14]. Beef cattle production is subject to the collective influence of industry and policy environments, operational and managerial characteristics, and other distinctive factors, requiring government intervention and the active participation and leadership of farming entities as economic agents [15,16]. The assumption of rational economic agents, who prioritize economic activities based on their relative importance in maximizing benefits, forms the theoretical basis for enhancing the economic efficiency of beef cattle production [13,17].
Research on the economic efficiency of beef cattle farming has primarily focused on measuring efficiency levels and studying the influencing factors. There is general scholarly consensus on the slow technological progress of the beef cattle industry. For instance, a study combining DEA with the Malmquist index method to measure the TFP of beef cattle farming in five provinces—Heilongjiang, Henan, Shaanxi, Ningxia, and Xinjiang—from 1998 to 2011 revealed a slow rate of technological advancement, with some years experiencing stagnation that led to a decline in TFP [18]. Similar conclusions regarding the slow technological progress in beef cattle farming have been drawn in other countries. A study using a Stochastic Frontier Approach (SFA) based on farm-level data found that the average annual growth rate of TFP for beef cattle in Brazil was 1.73%, mainly driven by improvements in scale efficiency, while technical efficiency declined at an annual rate of 0.03% [19]. A comparative study of cost efficiency in beef cattle farming in Hebei, Heilongjiang, Henan, Shaanxi, Ningxia, and Xinjiang showed that the cost efficiency values for small-scale beef cattle farming exhibited an initial decline, followed by an increase from 2007 to 2017, with the average annual rate of change being negative, indicating worsening cost inefficiency [17,20]. Second, differences in beef cattle breeds, farming scales, farming models, and nutritional health management are direct causes of significant variations in economic efficiency. Improving the nutrition, management, and health levels within the South African beef cattle production system to match high-level production systems elsewhere in the world could further enhance farm productivity and efficiency [21,22,23]. Enhancements in technology, health, genetics, and nutrition could lead to increased productivity in the beef cattle industry [23]. Using survey data from their study on beef cattle breeding technical efficiency, our research team noted that while the growth rate of dairy bulls in China is lower than that of crossbred cattle, the breeding costs of dairy bulls are not necessarily higher when analyzed in conjunction with farming costs [12,24]. A comparative study of the differences in efficiency between dairy and beef cattle farms revealed that the technical efficiency of beef cattle farms in Hungary was 9.3 percentage points lower than that of dairy farms from 2014 to 2015, with differences observed across farms of varying scales [25].
Influencing factors are a critical focus of academic research on the economic benefits of beef cattle farming. The characteristics of operators and farms, as well as the social and economic environment in which they operate, are primary aspects of economic efficiency in beef cattle farming [12,13]. Improvements in economic efficiency are attributed to technological advancements (such as animal breeding and improvement), favorable production environments (such as soil and climatic conditions), and enhanced management techniques (such as the integration of livestock and crop systems) [19]. The behavior of agricultural operators is influenced a number of factors, including the farmers’ characteristics, operational features, job composition, educational background, and social roles [26]. For instance, whether a farmer is a part-time village official, member of an association, or party may influence their behavior [26]. The management level of farm operators directly reflects their ability to control costs and profits during beef cattle breeding, significantly affecting farming efficiency [27]. A study on the technical efficiency differences in beef cattle farming in Tanzania found that the higher technical efficiency in lake regions was primarily due to the higher technical skill level of operators during the fattening phase of beef cattle [28]. Studies have shown that feed structure, capital investment, and disease risk are factors that affect the technical efficiency of beef cattle farming [12,13,29,30]. Policies play a crucial role in the development of the industry, with the status of the beef cattle industry in local agriculture, government attitudes, and local environmental regulations having a significant impact on industry development [12,31]. Michael Porter’s hypothesis on environmental regulation, i.e., “The implementation of environmental regulations can incentivize enterprise innovation, thereby offsetting the costs associated with compliance and bolstering market profitability,” is well-known [32]. Domestic research has also shown that environmental regulations can affect agricultural TFP and TE, with a distinct regional impact on animal husbandry [33,34]. Agriculture, being a weak industry, benefits directly from government support, with subsidies for the purchase of agricultural machinery promoting the replacement of labor with machinery, thereby enhancing agricultural production efficiency. Inputs and price subsidies have a positive income effect that influences the profit margins of agricultural production [35]. The industrial organization of the livestock industry also influences the efficiency of beef cattle production, with local cooperative organizations and livestock farming technology training directly affecting the specific management behaviors and production efficiency of farmers [36].
Although scholars have conducted research on the economic efficiency of beef cattle production and its influencing factors, there is still scope for further exploration. Previous literature has primarily utilized statistical data for comparative studies across different regions without distinguishing between farming stages, often conflating beef cattle breeding with fattening in a singular discussion. The conclusions drawn from such research are often imprecise and lack comparative analysis across different farm scales. Previous studies have predominantly focused on the technical efficiency and TFP of beef cattle production, examining changes and comparative efficiency values. There is a relative dearth of systematic research on the economic efficiency of beef cattle production and its influencing factors, with even less attention paid to allocation efficiency. As some studies have indicated, the technological progress of the beef cattle fattening industry is relatively slow, particularly in areas such as breeding technology and embryo transfer. However, the increase in beef cattle fattening productivity is more attributable to AE and TE than to technological progress. Consequently, research on allocative efficiency is of significant importance. The analysis of TE, AE and their determinants in beef cattle production is of particular significance for the optimization and upgrading of resource allocation [12,13,37].
The factors influencing economic efficiency, which is the focus of this study, must be examined. The study aims to identify the reasons for the differences in economic efficiency of beef cattle fattening on different-scale fattening farms. This was achieved through the analysis of influencing factors, which in turn informed the development of strategies for improving the production efficiency, beef production capacity and economic benefits of beef cattle fattening. Therefore, this study begins with an examination of the new allocation efficiency calculation model. Subsequently, the economic efficiency (including TE and AE) of beef cattle farming in China is evaluated by survey data from North China. And then, the effects of various influencing factors on beef cattle are measured and explored. We examine the differences in the results obtained from the various sizes of fattening farms. Finally, we discuss the similarities and differences between the results of the present study and those of previous studies, and we focus on some of the new findings of the present study.

3. Materials and Methods

3.1. The Modeling Approaches

3.1.1. Efficiency Measurement Models

(1) Technical Efficiency Estimation Model
Tone developed both super-efficiency and undesirable output models. In this section, the two linear programming models constructed by Tone are integrated and nested to form a super-efficiency model with undesirable outputs [3,8,38], as represented below:
Objective Function:
max φ = m i n 1 + 1 m i = 1 m ( s i x i k ) 1 1 q 1 + q 2 ( r = 1 q 1 s r + y r k + t = 1 q 2 s t b b r k )
Constraints:
s t . j = 1 , j k n λ j x i j s i x i k ;
j = 1 , j k n λ j y r j + s r + y r k ;
j = 1 , j k n λ j y b t j s t b b t k ;
1 1 q 1 + q 2 ( r = 1 q 1 s r + y r k + t = 1 q 2 s t b b r k ) > 0 ;
λ j , s i , s r + , s t b 0;
i = 1,2 , 3 , m ;   j = 1,2 , 3 , , n j k ;
r = 1,2 , 3 , , q 1 ;   t = 1,2 , 3 , · · · · · · , q 2 .
Here, i represents the number of input variables, j denotes the number of production units or producers, r is the number of outputs, x i j is the i-th input variable of the j-th producer, y r j is the r-th output of the j-th producer. m, q 1 , q 2 respectively represent the number of input indicators, desired output indicators, and undesirable output indicators. s i , s r + , s t b are slack variables for inputs, desired outputs, and undesirable outputs, respectively. λ j are the weight variables. xj, yj, bj are the m-dimensional input vectors for the j-th firm, and xk, yk, bk are the input, output, and undesirable output variables for the producer under evaluation. φ represents the minimum distance of the production state of the evaluated producer from the production frontier constituted by all producers’ production states. If φ is less than 1, there is efficiency loss; if φ is greater than or equal to 1, the production is efficient, and the larger the value of φ , the higher the efficiency. The objective function max φ seeks the optimal solution φ * , which is the technical efficiency (TE). If variable returns to scale are assumed by adding the constraint j = 1 , j k n λ j = 1 , the super-efficiency model with variable returns to scale (VRS) can be obtained, which is not further elaborated here. The CRS-DEA super-efficiency model assumes constant returns to scale for all producers, meaning they have all reached optimal production scale. The technical efficiency calculated in this way includes the part of scale efficiency and is, therefore, comprehensive technical efficiency. In contrast, the VRS-DEA super-efficiency model relaxes the assumption of constant scale and measures technical efficiency that excludes the impact of scale; thus, it is referred to as PTE. For reasons of space, we cannot provide further details here, and please refer to our previous publications and the relevant literature [3,8,12].
(2) Allocation Efficiency
The term ‘allocation efficiency’ encompasses several interrelated concepts, including cost efficiency (CE), input allocation efficiency (IAE), revenue efficiency (RE), and profit efficiency (PE). In this study, we use the DEA method to measure these efficiencies. We construct three models: New Cost Efficiency Model, New Revenue Efficiency Model, and the New Cost Profit Model [7,39]. Please to the model (1), model (2), and model (3) below. Let p P denote the vector of prices, where X and Y represent the vectors of inputs and outputs, respectively. The vectors xx and yy correspond to the column vectors of x and y , and λλ serves as the vector of weights. The production possibility set is defined as P = { ( x , y ) | x X λ , y Y λ , λ 0 } , and the cost production possibility set is P c = { ( x ¯ , y ) | x ¯ X ¯ λ , y Y λ , λ 0 } , where X ¯ = x ¯ 1 , x ¯ 2 x ¯ n ,   x ¯ n = ( c 1 j x ¯ 1 j , c 2 j x ¯ 2 j , c n j x ¯ n j ) T . The New Cost Efficiency Model is articulated as follows:
New Cost Efficiency Model:
C E = c x ¯ * c x ¯ k
Objective Function: c x ¯ k * = min c x ¯
Subject To: s t . x ¯ X ¯ λ ,
y k Y λ ,
λ 0 .
The cost-efficiency model integrates price into the efficiency calculation, thereby fully considering the impact of price on efficiency. Technical efficiency, which is measured based on physical inputs, provides a foundation for calculating AE. The relationship between CE, TE, and AE is given by CE = TE × AE. To enhance the discriminative power of the calculated efficiencies, this study utilizes a non-radial super-efficiency model to compute the comprehensive technical efficiency, which is taken as the measure of technical efficiency [7,39]. RE can be determined when product prices are known. Let Y ¯ = { y ¯ 1 , y ¯ 2 y ¯ n } , y ¯ n = ( p 1 j y ¯ 1 j , p 2 j y ¯ 2 j , p n j y ¯ n j ) . The linear programming model for RE used in this section is presented below.
New Revenue Efficiency Model:
R E = r y ¯ k r y ¯ k *
Objective Function: r y ¯ k * = max r y ¯
Subject To: s t . x k X λ
y ¯ Y ¯ λ ,
L r λ U ,
λ 0 .
To accommodate various returns to scale assumptions, an additional constraint L r λ U is incorporated. This represents the RE model. When the prices of both the input and output variables are known, we can calculate PE. The PE model is formulated as follows:
New Profit Efficiency Model:
P E = r y ¯ k c x ¯ r y ¯ k * c x ¯ k *
Objective Function: r y ¯ k * c x ¯ k * = max r y ¯ c x ¯
Subject To: s t . x = X λ x k
y = Y λ y k ,
L r λ U ,
λ 0 .

3.1.2. Evaluation Model of the Influencing Factors: Tobit Regression Model

Researchers have questioned some of the problems of the Tobit model, such as for high-dimensional data, the Tobit regression model having overfitting problems, and the dependence on the data distribution being considerably strong, resulting in the regression results may not being sufficiently robust. However, researcers have also proposed numerous measures to avoid the above problems [40,41,42]. Until better ones are available, Tobit remains a good method for addressing the problem of the regression of discontinuous variables. In the examination of scenarios characterized by discontinuous data and variables that are limited in their dependency, this study employs the Tobit model to elucidate the mechanisms by which factors external to the efficiency measurement itself exert influence on technical efficiency. A Tobit regression model was constructed meticulously following the determination of production efficiency. Within this framework, efficiency is delineated as the dependent variable, with a spectrum of influencing factors serving as independent variables. The use of the Tobit method has been well documented in the literature concerning the determinants of production efficiency [12]. As articulated in this study, the Tobit model is mathematically represented as follows:
Y i = α i + β X i + γ C j + ε ,   α i + β X i + γ C j + ε > 0   0 ,      o t h e r w i s e s
In this model, X i represents a set of explanatory variables that encapsulate the factors influencing efficiency. C j are the control variables. The explained variable Y i , represents the production efficiency. The coefficient β denotes the regression coefficient, which quantifies the sensitivity of the dependent variable to changes in the independent variables. The term ϵϵ embodies the stochastic disturbance, which is assumed to be normally distributed with a mean of zero and constant variance, ε ~ N ( 0 , σ 2 ) .

3.2. Materials

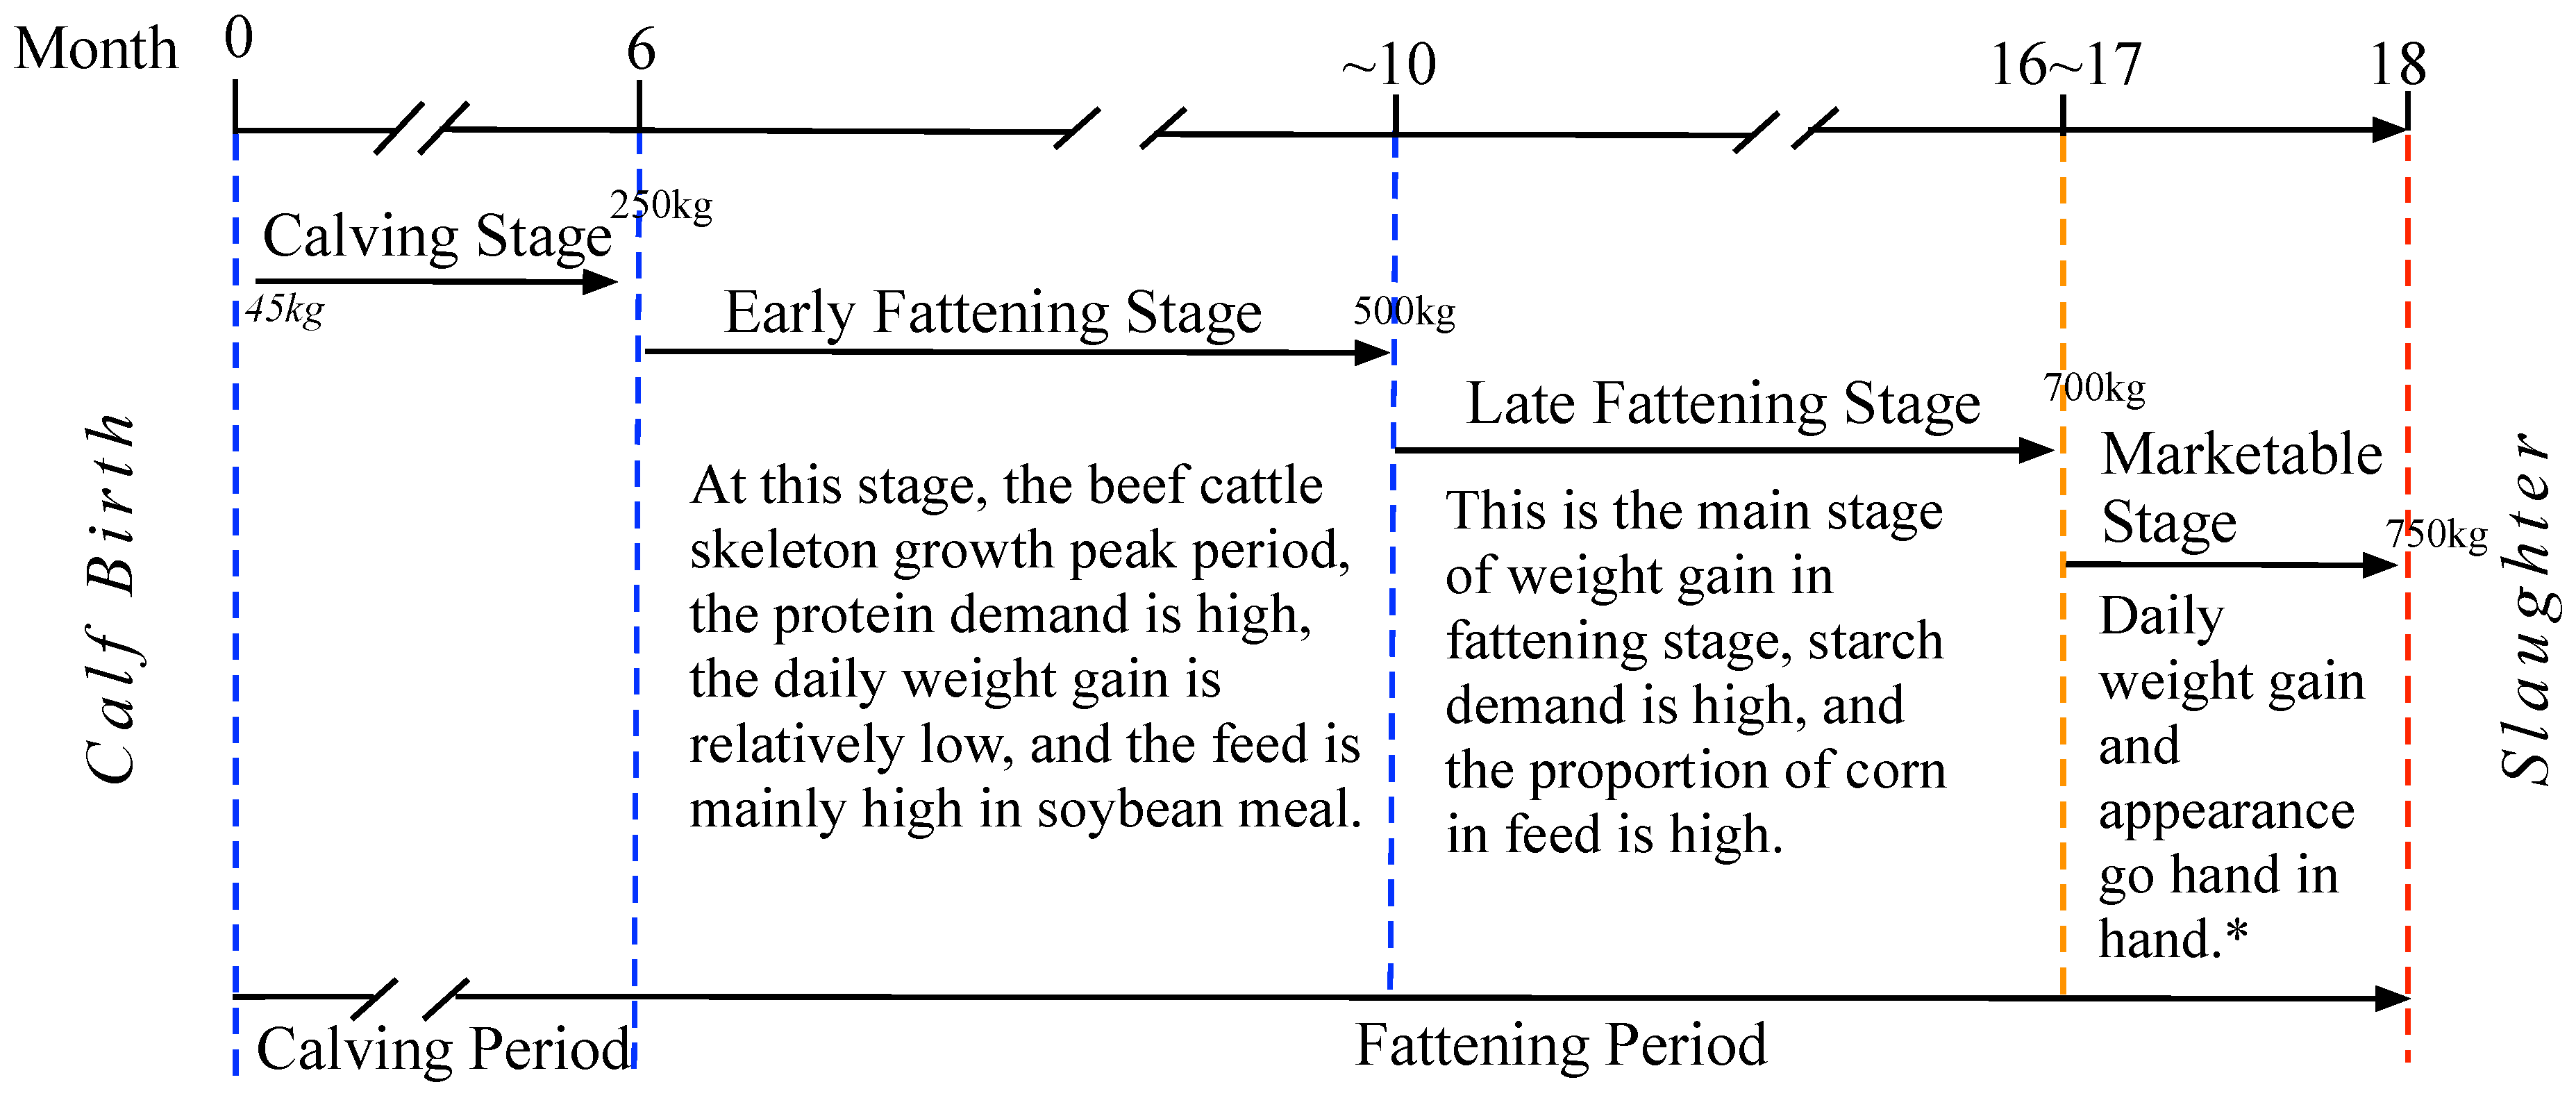
3.2.1. Beef Cattle Professional Fattening in China

(1) Beef Cattle in China
Different breeds of beef cattle exhibit significant variations in growth performance. Breeding technology is universally acknowledged as the core method for optimizing beef production performance and enhancing economic benefits [17,43]. Before delving into related topics, it is imperative to provide an overview of beef cattle fattening breeds in China.
Historically, cattle have played a crucial role in Chinese agricultural production, with early regulations prohibiting the slaughter of cattle, highlighting their irreplaceable role in the labor force [44]. However, as history progressed, the use of cattle underwent significant changes and is now categorized into dairy, beef, and working cattle. The concept of “beef cattle” in China is not ancient but emerged with the economic reforms initiated in 1978 [45]. Local breeds with meat quality and flavor more aligned with the taste preferences of the Chinese population have a notable economic advantage and have shown an increasing trend in breeding volumes in recent years. These local breeds, having adapted and evolved over thousands of years, possess genetic advantages that cannot be overlooked and urgently need effective conservation [12]. China has about 25 local yellow cattle breeds, among which the Xia’nan cattle from Henan, the Luxi cattle from Shandong, the Yanbian cattle from the Northeast, the Qinchuan cattle from Shaanxi, and the Jinnan cattle from Shanxi are referred to as the five excellent yellow cattle breeds. They are famous for their rapid growth, good economic return, and large breeding scale. Additionally, the Inner Mongolia Grassland Red Cattle is an excellent local breed, albeit on a smaller breeding scale [37].
Currently, the main breeds used in Chinese beef cattle fattening are crossbred cattle, that is, the offspring of local breeds crossed with foreign breeds. Simmental, originating from Switzerland, is renowned for its majestic physique, rapid growth rate, abundant muscle tissue, meat quality, tenderness, fine texture, and elasticity with evenly distributed fat, making it an excellent breed with both dairy and beef functions. Introduced in China from the late 1960s to the early 1970s, it has a history of half a century and is primarily used to improve the quality of local cattle breeds [12]. Today, the widely distributed offspring of Simmental crosses with local yellow cattle have become the most common beef cattle breed in China and exhibit excellent environmental adaptability, growth rate, and meat production capacity. In addition, in recent years, newly introduced foreign breeds such as Limousin, Angus, Charolais, and Japanese Wagyu have gradually increased in domestic breeding volume, with provinces such as Hebei conducting crossbreeding research on new breeds such as Belgian Blue [12].
Whether yaks, dairy bulls, or culled dairy cows should be classified as beef cattle has been a topic of academic debate. Yaks were once the main livestock resource of the Qinghai-Tibet Plateau but have now mainly shifted towards beef purposes, becoming the focus of the local beef cattle industry [37]. For example, in 2022, yak meat production reached 399,000 tons, with a production value of about 27 billion, occupying an important position in beef market [46,47]. Approximately 44% of the world’s beef comes from culled cows and male calves. The fattening of dairy bulls is thriving in some regions, with larger farms already categorizing them as beef cattle. Research data show that in beef cattle slaughterhouses in Hebei Province, over 50% of the cattle waiting to be slaughtered were culled dairy cows that had been fattened [44,48]. Professional institutions and scholars have also conducted in-depth research on the fattening of dairy cows.
(2) The professional fattening cycles in Chinese beef cattle
In an in-depth analysis of the beef cattle fattening process, we identified that the conventional culturing cycle (including calving period and fattening period) for beef cattle in China spans approximately 18 months from birth to maturity for market readiness. Please refer to the Figure 1. The first six months are defined as the calf phase, after which, apart from a select few designated as breeding bulls, the majority enter the critical fattening stage. It commences after the calf phase and continues for approximately 12 months. This represents the period during which cattle transition from juveniles to adults and is commonly referred to in the Chinese beef fattening industry as the frame-cattle fattening period. During this phase, feed utilization efficiency peaks and daily weight gains are maximized, thereby achieving an optimal feed-to-meat ratio and yielding higher economic returns. Typically, cattle reach a slaughter weight of approximately 750 kg by the end of the fattening stage and are sent for slaughter and processing.
In practical production, farms with a higher level of specialization and precision management adopt segmented breeding strategies based on the varying stages of cattle growth, enhancing feed utilization efficiency and representing a further subdivision of the fattening phase. Drawing from various farm practices, the fattening stage can be subdivided into early fattening, late fattening, and finishing periods, with each phase necessitating adjustments based on the cattle growth rate, dietary nutritional needs, and market supply considerations for slaughter. When cattle weight increases from 250 to 500 kg, this is known as the early fattening stage, during which there is a relatively higher demand for protein, thus requiring a slightly higher proportion of soybean meal in the feed compared to other stages. As the weight of cattle increases from 500kg to 700 kg, the focus of breeding shifts from the marketable stage, which occurs in the final month before slaughter, to optimizing the body condition, conformation, and coat color of cattle. This is done to improve the market performance and slaughter yield, which ultimately increases the sales value. In the late fattening stage, the feed formulation for beef cattle breeding also changes considerably. There is a notable increase in the demand for starch for beef cattle growth, particularly in the quantity of corn present in the feed.
China, through its long-term practice in beef cattle fattening, particularly within professional fattening farms, has developed standardized processes for precise management of the fattening period.

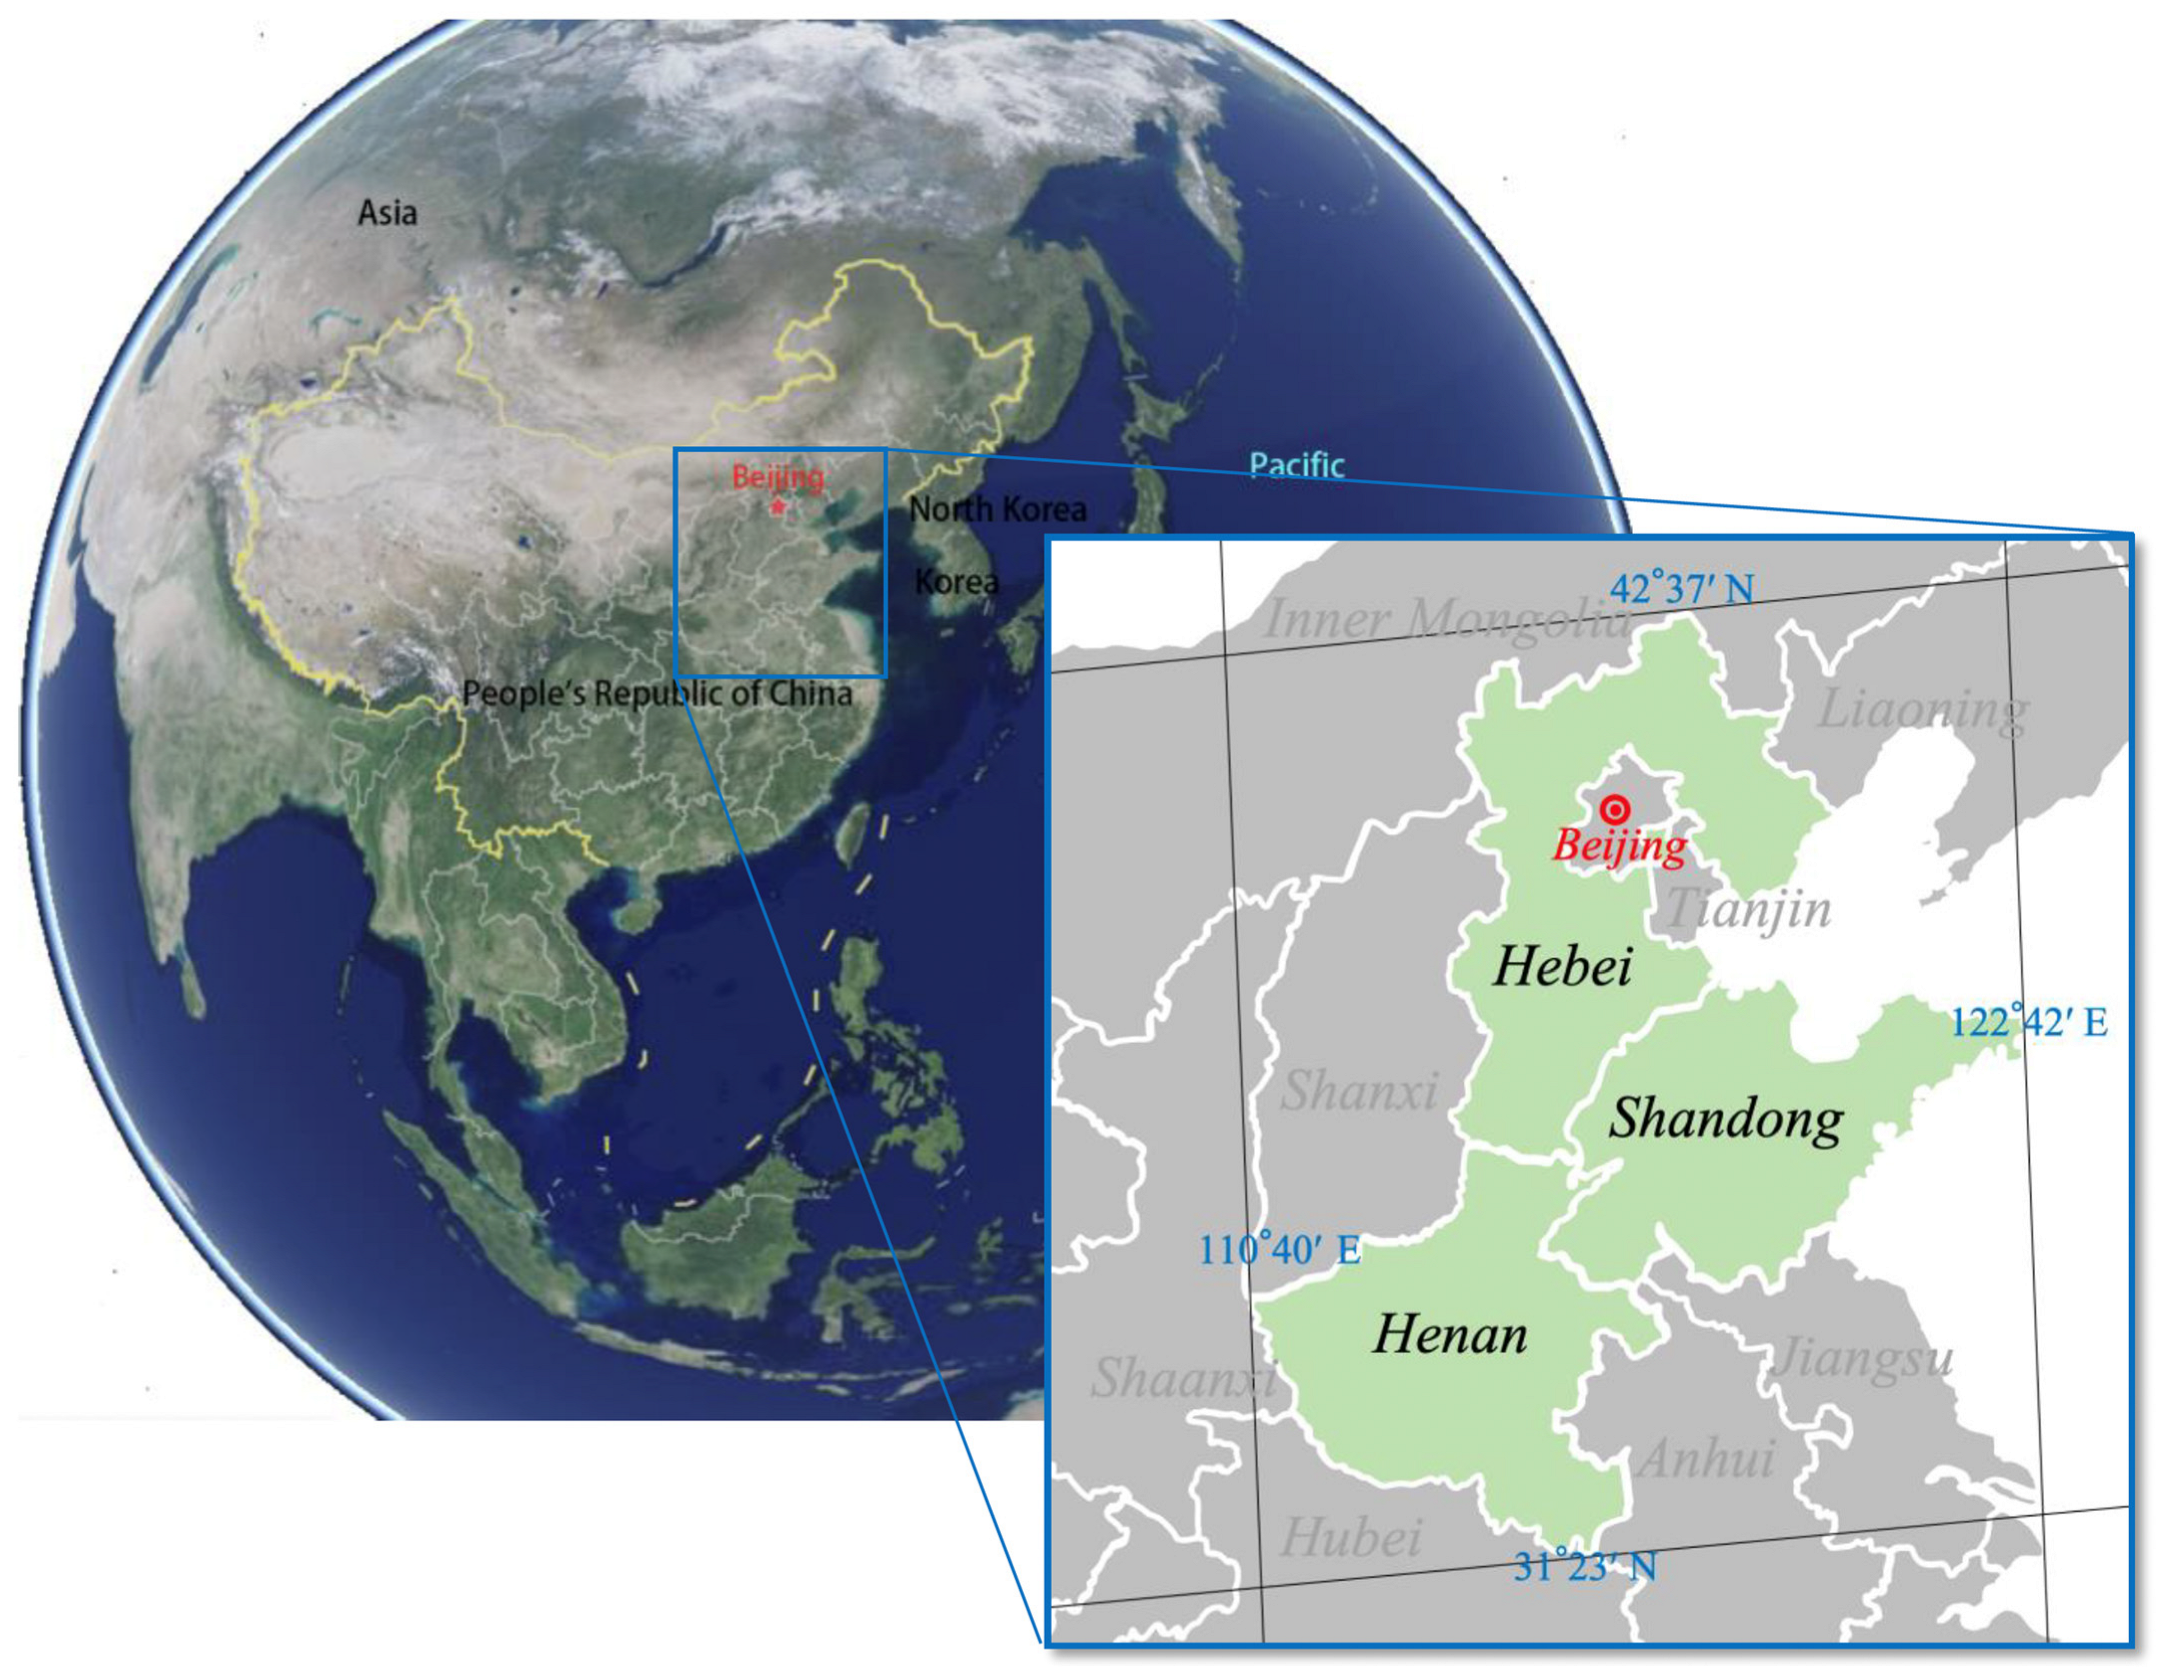
3.2.2. Areas of Survey

From September 2022 to July 2023, our research team conducted a comprehensive field study in the Hebei, Shandong, and Henan provinces, as shown in Figure 2. We collected 216 valid questionnaires from small-scale beef fattening farms: 105 from Hebei, 83 from Shandong, and 28 from Henan. Concurrently, for medium-scale fattening farms, we obtained 139 questionnaires: 57 from Hebei, 22 from Shandong, and 60 from Henan. Moreover, in the context of large-scale fattening facilities, we surveyed 155 questionnaires, with 60 contributions from Hebei, 47 from Shandong, and 48 from Henan.
The survey regions displayed exceptional representativeness in this sector. The region from which the samples were taken is typical and representative, encompassing the arid and semi-arid regions of China. These regions constitute the country’s agricultural and pastoral demarcation zones. In terms of agricultural categories, the area under study encompasses agricultural, semi-agricultural, and pastoral zones. All of China’s agricultural types are found in this region. It is also noteworthy that the region is China’s primary grain-producing area (such as corn, storage feed, and soybean) [49]. The natural environment, the development of the agricultural industry, and other social and economic conditions have collectively rendered this area particularly conducive to beef cattle fattening. The fattening models within these regions indicate the predominant fattening characteristics in China. As demonstrated by the comprehensive data in Table 1, approximately 2.4 million head of cattle were sold from these three provinces between 2020 and 2022, accounting for 18% of the national total output. Concurrently, the total beef production is approximately 360,000 tons, representing 22% of the country’s total beef yield. These metrics, reflecting key aspects such as throughput and beef output, significantly underscore the representativeness of the areas examined in this study for China’s beef cattle fattening industry.

3.2.3. Variable Selection and Data Description

Our objective was to delve into the critical factors affecting the efficiency of beef cattle fattening, with a particular emphasis on the importance of setting both input and output variables, as well as the calculation of production efficiency.
Input variables primarily encompass the weight of calf, quantities of concentrated feed and roughage feed, labor inputs, and others (the allocation of material costs). Because frame cattle transactions are typically priced per head rather than directly based on weight and price, the costs of feed and other production inputs require appropriate price adjustments based on specific circumstances. The adjusted prices in this study include the purchase cost of fattening cattle, adjusted prices for concentrate and roughage, labor costs, and sharing of material costs (price of calves, concentrated feed, roughage, labor, and others). The final category (the allocation of material costs) encompasses all inputs not included in the preceding three categories. These include fuel, power costs, farm utilities, maintenance of machinery and equipment, maintenance of barns and pens, and so forth, which are measured in monetary terms. This section also includes the portion of losses from mortality. It is necessary to further clarify that the indicators in each category represent actual quantities incurred, excluding unincurred inventory. However, warehouse costs that have been incurred are included in the rent, and interest on purchased feed has also been calculated. These costs are then equally apportioned to each cow. Once this process has been completed, it can be stated with confidence that all inputs to beef cattle fattening have been fully and accurately accounted for.
The output variables mainly considered the total weight gain (weight of beef cattle) and accounted for the effect of mortality losses. Given that relying solely on the market sale price of beef cattle may not afford sufficient accuracy, this study employs adjustments based on the market sale price (price of beef cattle), weight at the time of sale, and mortality loss. Additionally, the fermentation and excretion of beef cattle byproducts, including feces and urine, produce a considerable quantity of greenhouse gases, including methane and nitrous oxide. According to estimates from the Food and Agriculture Organization (FAO), the production of 1 kg of beef in EU countries releases 22 kg of carbon dioxide equivalent, a figure that is higher than that of mutton, pork, and poultry. Chinese scholars have identified a positive correlation between carbon emissions and aquaculture [50]. The breeding of beef cattle results in the production of chemical oxygen demand (COD), nitrogen, phosphorus, and other pollutants, which contribute to the pollution of both air and water [12]. Therefore, non-desired outputs such as carbon emissions and the amount of pollutants produced are also considered. The pollutants produced by beef cattle breeding in different breeding environments, different breeding methods, different forage formulations, and different breeding scales vary. Accordingly, in this study, pollutant production in the beef cattle industry was calculated according to the differences between regions, years, and methods of beef cattle fattening (for specific calculations, please refer to the work of Xue et al. from 2022 [12]). The data is from the China Agricultural and Rural Yearbook, the Manual of the First National Pollution Source Census and Pollutant Discharge Coefficient and the Pollutant Discharge Coefficient of Livestock and Poultry Industry, the Manual of the Second National Pollution Source Census (Evaluation Edition), and relevant provincial statistical yearbooks.
Factors influencing the efficiency of beef cattle fattening are multifaceted, with the technical and management levels of the operator and the individual characteristics of the farm being the most significant. Beef cattle fattening demands substantial quantities of feed grains such as corn and soybean. Concurrently, the development of the sheep, pork, and poultry industries has promoted the industrialization of local breeding industries and also intensified competition for resources. The establishment of agricultural organizations, such as cooperatives, has facilitated the sharing of technology and experiences. Moreover, the local socioeconomic environment and government policies have also impacted the development of the beef cattle-fattening industry. Although the Chinese government has supported industrial development through policy subsidies and technical training in recent years, stringent green agriculture and environmental protection policies have directly influenced production.
To conduct an in-depth analysis, this study sets variables affecting factors, including individual characteristics of farms and managers, social and economic characteristics, and the surroundings of local policy. Individual characteristics of farm and manager variables included the Age of Farm Manager (AGE), educational level of managers (EDU), years of professional fattening (YEA), social/government part-time (CAD), fattening scale (SCA), and Management Level (MAG). Social and economic characteristic variables comprise the main source of feed (FED), number of competitors (COM), beef cattle being the leading agricultural Industry Locally (DOC), and cooperative members (COO). Surrounding Local Policy variables include subsidies by policy (SUB), environmental regulatory policies (POL), and Received Fattening training organized by the local government (TRA). It’s worth noting that The Management Level (MAG) variable represents the level of farm management. During the study, it was observed that large farms are familiar with each other across the regions. Therefore, the first step was to visit large farms in the study area and request that they score each other on the management level to obtain the score of the large farms. Subsequently, visits were made to medium-sized farms. Medium-sized farms in the same area are familiar with each other and with the large farms in the area. Therefore, we utilized the scores of the large farms as a reference point, and we permitted the medium-sized farms in the area to assess each other to obtain the scores of the medium-sized farms. Finally, visits were conducted to small-scale farms, which were also familiar with each other within the same area. Each farm was asked to score the other farms in the area using the large and medium-scale farm scores as a reference. This resulted in a set of scores for the management level of the small-scale farms, which were obtained by asking each farm to score the other farms in the research questionnaire.

3.2.4. Data Description

From April to September 2022 and July to September 2023, the research team conducted field surveys and successfully collected 510 questionnaires from fattening farms and 31 questionnaires from government-related interviews. To meet the research requirements, farms with an annual turnout of 0–49 cattle were categorized as small-scale fattening farms, those with 50–199 cattle were classified as medium-scale farms, and farms with an annual output of 200 or more cattle were considered large-scale fattening farms. Based on this classification, 216 questionnaires were collected from small-scale, 139 from medium-scale, and 155 from large-scale fattening farms. A detailed statistical description of the sample is presented in Table 2.

4. Results

4.1. Technical Efficiency of Beef Cattle Fattening

To facilitate a meaningful comparison of the measured production efficiencies of the three sizes of fattening farms—large, medium, and small—all the samples in this study were combined to construct a unified production frontier for the efficiency measurements. Table 3 shows the performance of beef fattening farms of varying sizes in terms of TE, as well as the decomposed dimensions of PTE and SE. An analysis of the efficiency distribution characteristics of the sample indicates that, whether it be TE or PTE, the fattening farms of all three sizes generally follow a normal distribution. Specifically, the peak values of the overall sample in TE and PTE are mainly concentrated within the [0.8, 0.9) interval, with average values reaching 0.8866 and 0.9157, respectively, whereas the peak values of SE are primarily focused in the [0.9, 1.0) interval, with a high average value of 0.9667.
Table 3 shows the differences and characteristics of fattening farms of different sizes for each TE dimension of efficiency. From the perspective of the average value of TE, large-, medium-, and small-scale fattening farms exhibited clear gradient differences, among which large-scale farms were significantly superior in terms of TE compared to other sizes. In terms of PTE, medium-scale fattening farms stood out the most, with an average value of 0.9555 and a relatively small standard deviation, indicating that medium-scale fattening farms present higher uniformity in PTE and generally surpass other sizes. In SE, large-scale fattening farms had an average value of 0.9916; however, their higher standard deviation indicated that there was a significant variation in SE among the large-scale farms.
Notably, medium-scale fattening farms exhibited a distinct right-skewed distribution of TE with a standard deviation of 0.2842, reflecting significant differentiation in the technical level of fattening farms within this scale range. In contrast, small-scale fattening farms showed a relatively concentrated distribution of SE, mainly within the [0.8, 1.0) interval, with a standard deviation of only 0.0299. This indicates that small-scale fattening farms in North China have minor differences in SE, displaying a relatively consistent level of efficiency.

4.2. Efficiency of Input Allocation in Beef Cattle Fattening

4.2.1. Cost Efficiency (CE) and Input Factor Allocation Efficiency (IAE)

Employing the New Cost Efficiency Model established in Section 3, this study calculated the CE of beef cattle farming. By considering the interrelations among CE, TE, and AE, we computed the IAE, as presented in Table 4.
The findings suggest that the distributions of both CE and IAE exhibit characteristics that closely align with a normal distribution, where the mean value for CE is 0.8071, with a minimum of 0.6774 and a maximum of 1.0523. Notably, the samples with CE in the range of [0.7, 0.8) total 267, accounting for 52.35%, indicating that there is room for improvement in the overall CE. The mean value for IAE is 0.9170, with the distribution of samples within the [0.9, 1.0) interval totaling 232, representing 45.49%, suggesting that the overall IAE is relatively ideal.
The distribution trends of the CE and IAE reveal a high level of resource AE within the beef cattle fattening industry. However, producers’ responses to fluctuations in input factor prices are not sufficiently sensitive, significantly affecting the improvement in CE. This indicates that the role of the law of values has not been fully actualized in optimizing the input factors.
From the perspective of economies of scale, fattening farms of different sizes exhibit significant disparities in CE. Specifically, the mean CE of small-scale fattening farms is only 0.7791, which is significantly lower than that of medium (0.9029) and larger-scale fattening farms (0.9047). This gap highlights the disadvantages of small-scale fattening farms in terms of cost management. Observing the specific distribution of CE, small-scale fattening farms had a sample proportion of 71.3% in the [0.7, 0.8) interval, medium-scale farms mainly fell within the [0.8, 0.9) interval, and more than half of larger-scale farms fell within the [0.9, 1.0) interval, indicating that CE increases with the scale of fattening.
Regarding IAE, the three fattening farm sizes showed consistency in their maximum and minimum values, with a minimum of approximately 0.7154 and a maximum of 1.1638. The average IAE of the small-scale farms (0.8987) was slightly higher than that of the medium- and large-scale farms. However, in terms of the efficiency value distribution, all fattening farm sizes were mainly concentrated in the [0.8, 0.9) interval. Notably, larger-scale farms have a proportion of 23% in the super-efficiency interval (efficiency value ≥1.0), which is significantly higher than that of medium-(8.63%) and small-scale farms (7.87%), indicating generally higher IAE in larger-scale farms, followed by medium-scale farms.
In summary, the research findings suggest that scaling up has positive implications for enhancing the economic efficiency of the beef cattle-fattening industry, particularly in terms of cost control and resource allocation optimization. However, sensitivity to price changes and their impact on CE should not be overlooked. Producers must strengthen cost monitoring and management in the face of market fluctuations and enhance their responsiveness to market signals to achieve optimal resource allocation.

4.2.2. Revenue Efficiency (RE) and Profit Efficiency (PE)

This study calculates the RE by substituting input quantities, output quantities, and product prices into the New Revenue Efficiency Model. Subsequently, the PE was determined by incorporating input quantities, prices, output quantities, and product prices into the New Profit Efficiency Model. The results are summarized in Table 5.
The overall distributions of RE and PE among the samples fundamentally adhered to a normal distribution. RE demonstrated a high degree of concentration, with a minimum value of 0.7259, a maximum value of 1.0838, and an average value of 0.9254. Samples distributed within the [0.8, 1.0] interval exceeded 80%, with 65 samples (12.75% of the total) identified as super-efficient. In terms of PE, the minimum value was 0.6835, the maximum value was 1.1100, and the mean was 0.9161, with the most concentrated sample distribution within the [0.8, 0.9) interval, accounting for 41.37% of the total. The distribution of both RE and PE was relatively even, with a significant proportion of high-efficiency samples, indicating the overall good RE and PE of beef cattle fattening in North China.
Looking at the scale of farms, the RE is roughly equivalent, with small-to medium-sized farms at 0.9029 and larger farms near 0.9216. However, in terms of distribution, small-scale farms had the highest proportion of samples within the [0.8, 0.9) interval, at 48.61%, while more than 50% of the samples from medium to large farms were concentrated within the range of [0.9, 1.0). The proportion of super-efficient samples on larger farms was 18.71%, 15.74% on medium-sized farms, and 5.56% on small farms. Overall, large-scale farms had an advantage in terms of RE, followed by medium-scale farms. Regarding PE, all three farm scales predominantly clustered within the [0.8, 0.9) interval, but a larger proportion of small-to medium-scale farms fell into the lower efficiency range. Medium-to large-scale farms extended towards higher efficiency intervals. Moreover, from the perspective of average efficiency values, larger-scale farms had an average PE above 0.9, while small-to-medium-scale farms hovered at approximately 0.85. Thus, the rankings of PE and RE across the three fattening scales were consistent, with larger-scale fattening farms performing the best, followed by medium-scale farms.

4.3. Estimation Results of Influencing Factors on the Efficiency of Beef Cattle Fattening

4.3.1. Estimation Results of Influencing Factors on the TE

Drawing on research on agricultural production, particularly on factors affecting livestock production efficiency, this study constructs a Tobit model for regression estimation. It uses various influencing factors as explanatory variables, production efficiency as the dependent variable, and beef cattle breed as the control variable. Table 6 presents the results.
(1) Individual Characteristics of Farms and Managers
The TE and PTE of farms of different sizes exhibited similar characteristics. Each indicator has varying degrees of significant impact on the PTE of medium-sized fattening farms. Conversely, for small-scale fattening farms, only AGE has a certain impact, while the EDU positively affects the TE of small-scale fattening farms at a 10% significance level. However, AGE has inconsistent effect on fattening farms of different sizes, negatively affecting on TE of small-to medium-scale fattening farms at the 1% significance level and having a positive effect on larger-scale fattening farms at the 10% level. YEA had no significant effect on small-scale fattening farms but showed a significant positive impact on medium-to large-scale fattening farms at the 1% level on TE and PTE. EDU had a significant positive impact on medium-to large-scale fattening farms at the 1% significance level. Moreover, CAD had a negative effect on medium-sized fattening farms at the 1% significance level. SCA and MAG had a significant positive effect on the PTE of medium-sized fattening farms, and MAG had a significant positive effect on the TE of large-scale fattening farms at the 5% level. Notably, the MAG coefficients for the PTE of medium- and large-scale fattening farms were relatively high, at 0.4589 and 0.2278, respectively.
(2) Social and Economic Characters
FED has different levels of significance on the TE and PTE of medium-to large-scale fattening farms, although the coefficients were small; it had no significant effect on small-scale fattening farms. DOC significantly affected TE of fattening farms of all sizes at different levels of significance. COM had a significant positive effect on the PTE of small-to medium-sized fattening farms at the 1% significance level. COO had no significant impact on the TE of small-scale fattening farms but had negative effect on medium-to large-scale fattening farms at different levels of significance, which is noteworthy.
(3) Surroundings of Local Policy
From the perspective of the local policy environment, SUB had a significant positive effect on the TE and PTE of both small- and large-scale fattening farms while showing a significantly negative effect on medium-scale fattening farms, which may be related to the focus of government subsidy policies. Furthermore, POL have a significant positive effect on the TE and PTE of larger-scale fattening farms at the 1% significance level but have no apparent effect on other fattening farms. Additionally, the TRA exerts a significantly positive influcence on the TE of fattening farms of all sizes, and a similarly pronounced positively impact on the PTE of small-scale fattening farms at the 5% level.

4.3.2. Estimation Results of Influencing Factors on the Allocation Efficiency

Using various influencing factors as explanatory variables, and CE and factor input allocation efficiency as dependent variables, a regression estimation was conducted to measure how these factors affect different farms through economic efficiency. The estimation results are presented in Table 7, Table 8 and Table 9.
The results indicate that, within medium-to-large-scale fattening farms, MAG has a statistically significant positive impact on CE, particularly at the 1% and 5% significance levels, where the impact coefficient is notably larger. Moreover, the CE of small-scale fattening farms is significantly affected by the social and economic characteristics and surroundings of the local policy, whereas the CE of large-scale fattening farms is primarily influenced by the EDU, ML, and DOC, particularly at the 1% significance level.
Moreover, the analysis of IAE revealed a significant positive relationship with AGE, EDU, and MAG, especially in small-to-medium-scale fattening farms, a result that is particularly significant at the 1% level. Small-scale fattening farms were also positively affected by the TRA. Meanwhile, the IAE of larger-scale fattening farms was significantly positively influenced by SUB and negatively affected by POL, with these impacts verified at the 1% significance level.
Regarding RE and PE, the analysis shows that the RE and PE of small-scale fattening farms are positively influenced at the 1% significance level by EDU and whether they are leading local industries. Conversely, the RE of larger-scale fattening farms was mainly influenced by the significant positive impact of ML and the significant negative impact of CAD. Additionally, the PE of small-scale fattening farms is positively affected at the 1% significance level by whether it is a leading local industry and participates in the cooperative. For medium-scale fattening farms, the ML and whether the farm is a leading local industry are also significant positive influencing factors on PE, as confirmed at the 1% significance level.
This reveals the key factors affecting CE, IAE, RE and PE of fattening farms of different sizes and also emphasizes the important role of ML, EDU, and POL in enhancing the economic benefits of fattening farms. These findings have significant management and policy implications for agricultural production practices, particularly for improving the economic efficiency and sustainable development capabilities of fattening farms.

5. Discussion

The consumption of beef has assumed an increasingly significant position within Chinese dietary culture, yet the inadequacy of domestic production capabilities has deepened the reliance on external sources. Although breeding techniques such as hybridization and embryo transfer have been widely acknowledged in the industry to enhance beef quality and production, technological advancements in breed development remain sluggish owing to inherent biological characteristics such as the natural growth cycle of beef cattle. The exploration of alternative approaches to enhance productivity is crucial, as various factors, such as management and the macroeconomic environment, can serve as significant impediments to constraining output across different scenarios.
In this study, we assessed the technical efficiency (TE, PTE, and SE) and allocator efficiency (CE, IAE, RE, and PE) of beef cattle fattening at various scales. Furthermore, we identify the specific factors that contribute to the observed differences in economic efficiency. A comprehensive examination of the impact of farmer characteristics, social environment, and government policies has revealed that these factors exert disparate and, at times, opposing effects on the efficiency of farms of varying sizes. For instance, the AGE on small-scale farms demonstrated a significant negative correlation with TE and PTE. However, on medium-sized farms, it exhibited a significant positive impact. Although this is the first instance of such a definitive conclusion being reached in the beef cattle fertilizer industry, previous studies have identified similar trends. For instance, research indicates that small- and medium-sized farmers exhibit lower productivity levels than large-scale farms during beef cattle fattening [12,14]. This phenomenon reflects the fact that small-scale farm operators often rely on traditional farming methods and display a negative attitude towards modern management concepts and technology adoption. This leads to the further entrenchment of traditional methods with age, making them difficult to change. In contrast, operators of medium-sized farms, who are more likely to have background in agricultural modernization, actively embrace modern management concepts, focusing on technology and efficiency. This represents a new direction for China’s agricultural development. Previous scholars have proposed similar advice, yet have not provided clear evidence to support their assertions [14,15].
Furthermore, government subsidy policies have demonstrated a positive impact on the technical efficiency of large-scale farms. However, they may have a countervailing effect on allocation efficiency, although to a lesser degree. This indicates that, although these subsidies contributer to enhanced overall farm productivity, they may not directly result in substantial improvements in firm profits or income in the short term, as enterprises must make substantial initial investments. The existing literature posits that government environment environmental regulation policies incorporate a technology incentive mechanism [32]. Concurrently, in the event that the government provides technological support, enterprises are able to achieve sustainable development while simultaneously enhancing their economic efficiency [26,34]. These findings align with those of previous studies. The implementation effect of government policies should be further differentiated in the assessment of enterprise scale, and the same policy may have different effects on farms of different scales. This is due to the significant differences in the operational philosophy and management level of farms of different scales in China. Further analysis of the impact of management level on economic efficiency revealed that for medium-sized farms, management level mainly affected IAE and PE, whereas for large-scale farms, the impact of ML was primarily observed on RE. In contrast, the impact of the ML on efficiency was not significant in small-scale farms, which differs from the existing literature. Nevertheless, this finding does not contradict previous research results, as earlier studies often failed to analyze small-scale farmers as independent groups [13,28,34]. The quality of small-scale farm operators determines their focus on returns. The larger the scale, the more apparent their bargaining power in the factor market and the scale economy effect of product marketing. Operators of large-scale farms generally possess stronger professional economic qualities, and their market perceptions and forecasting abilities are generally superior to those of small-scale fattening farms. Consequently, we posit that bargaining power in factor and product markets, as well as market sensitivity are pivotal determinants for large-scale farms to attain high RE and PE.
This study advances our comprehension of the impact of socioeconomic and governmental policy variables on the discrepancies in economic efficiency between small- and medium-to-large-scale fattening farms. In comparison to other size of fattening farms, small-scale farms are demonstrably more significantly influenced by socioeconomic and government policy variables. Conversely, the economic efficiency of medium-to-large-scale fattening farms should be more attention to the ML and POL. Previous studies have confirmed the positive role of COO [51]. This study contributes to the growing body of knowledge on the positive role of cooperatives, specifically the role of fattening farmers participating in cooperatives in improving economic efficiency. The presence of leading local industries, government subsidy policies, and government-provided training activities significantly influenced the TE and PTE of small-scale fattening farms. Moreover, the participation of small-scale fattening farms in cooperative activities significantly enhanced their CE, RE, and PE, indicating that the advantages of participation in cooperatives are limited to medium-to-large-scale fattening farms. Small-scale farms may gain bargaining power in the markets for means of production and products, as well as the capacity for dialogue with the government through joint actions, such as participation in cooperatives. This may compensate for individual deficiencies, such as their management level.
In the context of medium- and large-scale fattening farms, the professional level of entrepreneurs, including EDU and YEA, exerts a significant impact on TE and PTE. This finding reinforces the understanding of the relationship between the degree of specialization and demand for entrepreneurial skills, as previously identified in research [12]. As the scale of fattening farms increases, their dependence on government industrial policies becomes more significant [50]. Additionally, we discovered that in regions where the beef industry is highly valued, large-scale fattening farms frequently participate in local government projects for green production and beef breed improvement. This involves the provision of technical support through collaboration with scientific research institutions, although this may have an impact on PE in the short term [14].
Additionally, the applicability of Porter’s theory of environmental constraints in the context of Chinese agricultural enterprises was examined [52]. In Comparison to the United States, Chinese beef-fattening farms primarily rely on operators’ capital accumulation and lack external capital support, which results in a weaker capacity to withstand external pressures. Given the length of the beef fattening cycle, Chinese agricultural enterprises would be well advised to focus more on short-term benefits in order to ensure their survival and development.
In light of these findings, it can be reasonably concluded that the current stratified measures adopted by local Chinese governments in the beef cattle fattening sector, categorized by the size of their operations, are appropriate. For small-scale farms, inclusive policies can enhance enthusiasm for beef fattening, with improvements in production efficiency serving as evidence for this effect. Ultimately, this approach increases beef supply and also boosts income in the short term, which may have a positive impact on addressing China’s current beef supply shortages and the shared prosperity challenges it faces. Although small-scale fattening farms are currently constitute the backbone of China’s beef fattening industry, it is also important to recognize that these measures do not fundamentally alter the essence of the problem and are not comprehensive solutions for the development of China’s beef cattle industry. A review of the literature indicates that the individual characteristics of small-scale fattening farms have a significant impact on economic efficiency, with most current research treats socio-economic conditions and policy variables as independent rather than dependent variables [15,36]. However, as the industry evolves, the characteristics of socioeconomic variables as either independent or dependent variables become increasingly unclear, and often exhibit a causal relationship. In such circumstances, the impact of individual characteristic variables on economic efficiency becomes more pronounced. Small-scale fatteners, representing declining farmers and embodying the traditional Chinese farmer ethos of modest prosperity, even if it is a commendable tradition, also act as a shackle on the development of the agricultural economy [12]. Consequently, the economic efficiency of small-scale fattening farms is likely to undergo a slightly change. In contrast, operators of medium-to-large-scale fattening farms represent new farmers, or so-called new operational entities [53], with technical efficiency and allocation efficiency, among other aspects, indicating that they are the future of China’s agricultural development. Cultivating new farmers at the governmental level may be a critical direction for future efforts. Research in Japan has also shown that it is important to pay attention to entities, and the Japanese government has increased subsidies for beef cattle farmers in recent years [31,54]. In terms of policy, it would be beneficial to enhance the professional skills of these farms. One possible avenue for achieving this would be to provide technical personnel to improve technical efficiency, as well as to enhance their operational and management capabilities, thereby increasing their allocation efficiency. Furthermore, in case of technology R&D activities with external effects, it would be advisable to increase reliance on the government or public welfare organizations to reduce the burden on enterprises, thereby reducing their short-term pressure and enhancing their allocation efficiency. In the process of policy formulation and implementation, local governments should priority the attraction of talent offering preferential treatment to capable individuals and respected figures within larger-scale farms and breeding enterprises. Such an approach would stabilize operators’ expectations of government policies, enhance the transparency of policymaking and implementation, and create a conducive environment for industry development.
In this study, we employed a super-efficiency DEA model to calculate economic efficiency and utilized the Tobit model to investigate the impact of individual characteristics, socioeconomic environments, and government policies on the production efficiency of beef cattle fattening farms of different sizes. This approach enables the decomposition of the combined effects of various factors on production efficiency, thereby demonstrating the scientific rigor of our research methodology. The survey samples were drawn from the provinces of Hebei, Shandong, and Henan in North China. Although a significant proportion of calves in areas such as Anhui and Hunan also originate from northern provinces such as Hebei and Henan, it is important to acknowledge the potential for differences in beef cattle fattening production efficiency under different environmental conditions. Furthermore, it is possible that the mechanisms through which various factors exert their influence may differ [55]. Due to the nature of our sample, this study did not fully explore these issues. The research presented here focuses on the economic efficiency related to scale and the role of influencing factors. The findings of this study extend previous studies in this area and yield new insights. Nevertheless, this study did not examine the distinction between regions of comparable scale in sufficient depth to yield insights that could inform the formulations of policy by various local governments. Such an exploration can be pursued further based on the results of this study.

6. Conclusions

This study offered a comprehensive appraisal of TE and AE in the beef cattle-fattening industry in China, elucidating the complex array of efficiency determinants and their disparate influences contingent upon the scale of operation. Empirical evidence indicated marked disparities in economic efficiency in conjunction with breeding scale, with medium-to-large enterprises demonstrating superior TE and AE, albeit exhibiting significant variations in SE. By contrast, smaller establishments exhibit suboptimal AE and are notably deficient in CE, underscoring the need for tailored enhancement strategies.
The study accentuated two critical insights. First, the economic efficiency of beef cattle fattening operations of divergent scales may be subject to differential, or in certain cases, antithetical impacts by identical factors. This necessitates precision in policy formulation by local governments, analogous to the stratified approaches prevalent in Japan’s beef cattle breeding industry, a methodology that has not garnered adequate consideration or extensive discourse within the Chinese context, thereby enriching and broadening the current scholarly dialogue. Second, despite the plausibility of Porter’s hypothesis concerning environmental regulation, its applicability is not universally extensible across Chinese beef cattle-fattening farms because of the nation’s unique conditions and the extant status of these farms. Here, the focus should be primarily on augmenting production, with technological innovation delegated to specialized R&D entities and larger agribusinesses, thus furnishing a substantive addendum and expansion to the extant body of research. This study uses the survey data of North China to measure the economic efficiency (including TE and AE) of beef cattle breeding in China, conduct in-depth research on its influencing factors, and explore the effects of different influencing factors on different-scale beef cattle fattening farms, which can enrich the academic research on the economic efficiency of beef cattle fattening. Simultaneously, such research is closer to beef cattle fattening production, and will also provide a basis for relevant countermeasures and suggestions to improve the efficiency of beef cattle fattening production. It will provide a reference for beef cattle fattening production in other regions of the world.
While this study provides substantial insights, it is limited by the representational breadth of the sample and the potential implicit predisposition within the survey-derived data. Prospective studies should broaden the sampling matrix to include a more extensive territorial range and facilitate comparative analyses that amplify the representativeness and generalizability of the outcomes. Owing to the limitations of the data, it was impossible to control for environmental variables in the research process, such as regional differences and breed characteristics. This lack of control may be a limitation of this study, and it is an unavoidable shortcoming of this study. Simultaneously, an inquiry into the dynamic efficiency within farms and the burgeoning impact of specialized agriculturalists on the trajectory of the beef cattle industry remains an area for exploration. Furthermore, a deeper understanding of the mechanisms that precipitate efficiency variances, particularly among large- and medium scale enterprises, would yield considerable academic and practical value.

Author Contributions

Conceptualization, Y.X., H.Z. (Huifeng Zhao) and J.Y.; Methodology and Software, Y.X. and D.L.; Validation, J.Y. and H.Z. (Haijing Zheng); Formal Analysis, Y.X. and J.Y.; Investigation, Y.X., Z.Q. and H.Z. (Haijing Zheng); Resources, Z.Q.; Data Curation, H.Z. (Haijing Zheng); Writing—Original Draft Preparation, Y.X. and J.Y.; Writing—Review & Editing, J.Y. and D.L.; Visualization, H.Z. (Haijing Zheng); Supervision, Project Administration and Funding Acquisition, J.Y. and H.Z. (Huifeng Zhao). All authors have read and agreed to the published version of the manuscript.

Funding

This research was funded by the Social Science Development Research Project of Hebei Province: Study on the macro-characteristics and micro-mechanism of the urban-rural integration in Hebei Province, grant number 20230302013, the Modern Agricultural Industrial Technique System of Hebei Province: Industrial Economic Position of Innovation Team Focusing on Beef Cattle and Sheep, grant number HBCT2023190301, the Social Science Fund of Hebei: Study on path selection and policy guarantee system of green circular animal husbandry in Hebei Province under dual carbon target, grant number HB22YJ024,and the High-level Talents Foundation of Shandong Women’s University grant number 20203RCYJ04.

Institutional Review Board Statement

Not applicable.

Data Availability Statement

The data are not publicly available due to the fact that the research is based on survey data, which involves the disclosure of many farm secrets and the invasion of personal privacy. Consequently, the data is not publicly available in accordance with China’s national data security regulations.

Conflicts of Interest

The authors declare no conflicts of interest.

References

  1. Farrell, M.J. The measurement of productive efficiency. J. R. Stat. Soc. Ser. A 1957, 120, 253–281. [Google Scholar] [CrossRef]
  2. Frenkel, J.A.; Razin, A. Variable Factor Supplies and the Production Possibility Frontier. S. Econ. J. 1975, 41, 410–419. [Google Scholar] [CrossRef]
  3. Cheng, G. Date Envelopment Analysis: Methods and Maxdea Softwave; Intellectual Property Publishing House: Beijing, China, 2014. [Google Scholar]
  4. Shi-quan, W.; Chang, Q.; Li, B.-l. Production Efficiency and Influencing Factors of Scale Farmers: Empirical Evidence from Mutton Sheep Aggregation Region. J. Agro-For. Econ. Manag. 2017, 16, 230–239. [Google Scholar]
  5. Leibenstein, H. Allocative efficiency vs. “X-efficiency”. Am. Econ. Rev. 1966, 56, 392–415. [Google Scholar]
  6. Coelli, T.J.; Rao, D.S.P.; O’Donnell, C.J.; Battese, G.E. An Introduction to Efficiency and Productivity Analysis; Springer Science & Bussiness Media: New York, NY, USA, 2005. [Google Scholar]
  7. Färe, R.; Grosskopf, S.; Lovell, C.K. The Measurement of Efficiency of Production; Springer Science & Business Media: New York, NY, USA, 2013; Volume 6. [Google Scholar]
  8. Cooper, W.W.; Seiford, L.M.; Tone, K. Data Envelopment Analysis: A Comprehensive Text with Models, Applications, References and DEA-Solver Software; Springer: New York, NY, USA, 2007. [Google Scholar]
  9. Färe, R.; Grosskopf, S.; Norris, M.; Zhang, Z. Productivity growth, technical progress, and efficiency change in industrialized countries. Am. Econ. Rev. 1994, 84, 66–83. [Google Scholar]
  10. Fare, R.; Grosskopf, S.; Lovell, C.K. Production Frontiers; Cambridge University Press: Cambridge, UK, 1994. [Google Scholar]
  11. Balk, B.M. Industrial Price, Quantity, and Productivity Indices: The Micro-Economic Theory and an Application; Springer Science & Business Media: New York, NY, USA, 2013. [Google Scholar]
  12. Xue, Y.; Yan, J.; Cui, Y.; Zhao, H.; Zhang, Y.n.; Ma, C.; Zheng, H. The Technical Efficiency of Beef Calf Production Systems: Evidence from a Survey in Hebei, China. Agriculture 2022, 12, 1604. [Google Scholar] [CrossRef]
  13. Ma, X.; Wang, M. Comparison of Economic Efficiency of Beef CattleProduction in Typical Countries and Its Enlightenment to China. J. Northwest AF Unvi. 2023, 23, 138–152. [Google Scholar] [CrossRef]
  14. Zhao, H.; Ma, C.; Gao, Y. Economic Study on Beef Cattle Industry in Hebei Province; China Agriculture Press: Beijing, China, 2021. [Google Scholar]
  15. Haixiu, G.; Mingli, W.; Zizhong, S. Analysis on eco-efficiency and influencing factors of beef cattle in China. Chin. J. Agric. Resour. Reg. Plan. 2021, 42, 153–159. [Google Scholar]
  16. Cao, B.; Zhang, Y.; Li, J.-y.; Wang, Z.; Guo, A.-z.; Liu, J.; Sun, B.-z. Beef Cattle and Yak Industry Technology Development Report of 2021. Chin. J. Anim. Sci. 2022, 58, 245–250. [Google Scholar]
  17. Xue, Y.J.; Yan, J.L. Breeding efficiency of beef cattle in Chinese suitable areas. J. Anim. Plant Sci. 2019, 29, 1413–1423. [Google Scholar]
  18. Yue, l.; Wang, X. Analysis of Agricultural technical efficiency and Total factor Productivity in China from the perspective of environmental regulation: Based on distance function method. Jilin Univ. J. Soc. Sci. Ed. 2013, 53, 85–92. [Google Scholar] [CrossRef]
  19. Martins, M.M.; Spolador, H.F.; Njuki, E. Production environment and managerial techniques in explaining productivity growth in Brazilian beef cattle production. Agribusiness 2022, 38, 371–385. [Google Scholar] [CrossRef]
  20. Li, L.; Liu, J. Analysis on Cost Efficiency and Influencing Factors of Free-Range Beef Cattle Breeding in China. Ph.D. Thesis, Beijing Technology and Business University, Beijing, China, 2019. Available online: https://link.cnki.net/doi/10.19463/j.cnki.sdjm.2019.22.022 (accessed on 20 July 2023).
  21. Oduniyi, O.S.; Rubhara, T.T.; Antwi, M.A. Sustainability of livestock farming in South Africa. Outlook on production constraints, climate-related events, and upshot on adaptive capacity. Sustainability 2020, 12, 2582. [Google Scholar] [CrossRef]
  22. Visser, C.; Van Marle-Köster, E.; Myburgh, H.C.; De Freitas, A. Phenomics for sustainable production in the South African dairy and beef cattle industry. Anim. Front. 2020, 10, 12–18. [Google Scholar] [CrossRef]
  23. Arelovich, H.M.; Bravo, R.D.; Martínez, M.F. Development, characteristics, and trends for beef cattle production in Argentina. Anim. Front. 2011, 1, 37–45. [Google Scholar] [CrossRef]
  24. Xue, Y.; Yan, J.; Zhao, H.; Zheng, H.; Ma, C. Can domestic animal husbandry develop independently? An empirical study of China’s beef cattle industry. Pak. J. Zool. 2022, 54, 1001–1500. [Google Scholar] [CrossRef]
  25. Krisztián, K.; Ratnesh, P. Hungarian dairy and beef production sector technical efficiency comparsion using DEA. Apstract Appl. Stud. Agribus. Commer. 2017, 11, 131–140. [Google Scholar]
  26. Zhang, C. A Study on The Competitiveness of Chinese Rice Sector and Its Determants. Ph.D. Thesis, Chinese Academy of Agricultural Sciences, Beijing, China, 2018. [Google Scholar]
  27. Zhong, P.; Lu, W.; Xu, Z. Is rural labor migration bad for grain production? Analysis of farmers’ factor substitution and planting structure adjustment behavior and constraints. Chin. Rural Econ. 2016, 36–47. [Google Scholar]
  28. Mlote, N. Estimating technical efficiency of small scale beef cattle fattening in the lake zone in Tanzania. J. Dev. Agric. Econ. 2013, 5, 197–207. [Google Scholar] [CrossRef]
  29. Yu, L. The Impact of Environmental Regulation on Green Total Factor Productivity of Pig Breeding Industry. Ph.D. Thesis, Southwest University, El Paso, TX, USA, 2020. [Google Scholar]
  30. Khunchaikarn, S.; Mankeb, P.; Suwanmaneepong, S. Economic efficiency of beef cattle production in Thailand. J. Manag. Inf. Decis. Sci. 2020, 25, 1–9. [Google Scholar]
  31. Xue, Y.; Yan, J.; Zhao, H.; Zheng, H. Japan’s beef cattle industry and supporting policies under the COVID-19 epidemic. World Agric. 2021, 28–37+129. [Google Scholar]
  32. Porter, M.E. America’s green strategy. Sci. Merican 1991, 264, 168. [Google Scholar]
  33. Liu, W.; Tang, D. Environmental Regulation, Technological Efficiency and Total Factor Productivity Growth. Ind. Econ. Res. 2012, 27–35. [Google Scholar] [CrossRef]
  34. Xu, D.-l.; Dong, B. Empirical Analysis of the Impact of Environmental Regulations on Technical Efficiency and Productivity Loss. China Popul. Resour. Environ. 2009, 19, 91–96. [Google Scholar]
  35. Jiang, X.-l.; Chen, C.-b. The Efficiency Analysis on the New Direct Agricultural Subsidy Based on the Factor Allocation Model of Farmers. Econ. Surv. 2013, 22–26. [Google Scholar] [CrossRef]
  36. Wang, X. Research on Economic Efficiency of Mutton Sheep Production in China; China Agricultural University: Beijing, China, 2018. [Google Scholar]
  37. CARS-38; Research on Sustainable Development Strategy of Modern Agricultural Industry in China: Beef Cattle Yak Strategy Research Volume. China Agriculture Press: Beijing, China, 2016.
  38. Tone, K. Dealing with undesirable outputs in DEA: A slacks-based measure (SBM) approach. GRIPS Discuss. Pap. 2015, 1. [Google Scholar]
  39. Cooper, W.W.; Seiford, L.M.; Zhu, J. Handbook on Data Envelopment Analysis, 2nd ed.; Springer: New York, NY, USA, 2011. [Google Scholar] [CrossRef]
  40. Simar, L.; Wilson, P.W. Two-stage DEA: Caveat emptor. J. Product. Anal. 2011, 36, 205–218. [Google Scholar] [CrossRef]
  41. Johnson, A.L.; Kuosmanen, T. One-stage and two-stage DEA estimation of the effects of contextual variables. Eur. J. Oper. Res. 2012, 220, 559–570. [Google Scholar] [CrossRef]
  42. Badunenko, O.; Tauchmann, H. Simar and Wilson two-stage efficiency analysis for Stata. Stata J. 2019, 19, 950–988. [Google Scholar] [CrossRef]
  43. Terry, S.A.; Basarab, J.A.; Guan, L.L.; McAllister, T.A. Strategies to improve the efficiency of beef cattle production. Can. J. Anim. Sci. 2020, 101, 1–19. [Google Scholar] [CrossRef]
  44. Lv, W.; Zhang, X.; Wang, W. Agricultural machinery purchase subsidy, agricultural production efficiency and rural labor transfer. Chin. Rural Econ. 2015, 22–32. [Google Scholar]
  45. Liu, G.; Luo, Q.; Zhang, L. 40th anniversary of animal husbandry reform and opening up: Achievements, challenges and countermeasures. Chin. Rural Econ. 2018, 19–36. [Google Scholar]
  46. Cao, B.; Cao, J.; Lee, J.; Guo, A.; Wang, Z.; Sun, B.; Chen, Z. 2023 Beef yak Industry and Technology development Report. Chin. J. Anim. Sci. 2024, 60, 335–338. [Google Scholar] [CrossRef]
  47. Cao, B.; Lee, J.; Wang, Z.; Guo, A.; Chen, Z.; Sun, B.; Cao, J. Development trend and policy suggestions of beef yak industry in 2023. Chin. J. Anim. Sci. 2023, 59, 323–329. [Google Scholar] [CrossRef]
  48. Bascom, S.; Young, A. A summary of the reasons why farmers cull cows. J. Dairy Sci. 1998, 81, 2299–2305. [Google Scholar] [CrossRef]
  49. Yan, J.; Xue, Y.; Quan, C.; Wang, B.; Zhang, Y. Oligopoly in grain production and consumption: An empirical study on soybean international trade in China. Econ. Res.-Ekon. Istraživanja 2022, 36, 2142818. [Google Scholar] [CrossRef]
  50. Shi, S.; Li, C.; Li, M. Review of research from carbon emissions to carbon footprint in livestock husbandry. China Popul. Resour. Environ. 2017, 27, 36–41. [Google Scholar]
  51. Chen, X.; Kai, F. An Analysis on the Influencing Factors of Farmers Participating in Specialized Cooperative and Their Economic Benefits Empirical Analysis Based on 207 waterfowl farmers of Guangdong Province. Prices Mon. 2016, 80–86. [Google Scholar] [CrossRef]
  52. Porter, M.E. Competitive Strategy. Meas. Bus. Excell. 1997, 1, 12–17. [Google Scholar] [CrossRef]
  53. Huang, W.; Yang, C.; Min, R. Impact of new-type agricultural operating entities on green transformation of smallholders’ production. J. Arid Land Resour. Environ. 2024, 38, 69–78. [Google Scholar] [CrossRef]
  54. Gotoh, T.; Nishimura, T.; Kuchida, K.; Mannen, H. The Japanese Wagyu beef industry: Current situation and future prospects—A review. Asian Austral. J. Anim. 2018, 31, 933. [Google Scholar] [CrossRef] [PubMed]
  55. Wang, G.-g.; Wang, M.-l.; Yang, C. Development Stage and Its Patio-Temporal Evolution of Beef Cattle Industry in China. Econ. Geogr. 2014, 34, 131–136+170. [Google Scholar] [CrossRef]
Figure 1. Beef Cattle Fattening Period in China. Note: * This stage pays attention to the balance of nutrition, the proportion of protein and starch is moderate, and in addition to paying attention to daily gain, it also focuses on the appearance of body and hair color.
Agriculture 14 01007 g001
Figure 2. The Areas of Survey.
Agriculture 14 01007 g002
Table 1. Annual Beef Production and Slaughtered Fattened Cattle in the Survey Area.
10,000 TonsNationwideHebeiShandongHenanTotal Proportion (%)
10,000 HeadsSlaughtered Fattened CattleOutput of BeefSlaughtered Fattened CattleOutput of BeefSlaughtered Fattened CattleOutput of BeefSlaughtered Fattened CattleOutput of BeefSlaughtered Fattened CattleOutput of Beef
20204565.45672.4335.255.57275.7159.7241.2536.7118.67%22.60%
20214707.43697.51339.955.85280.0361.3235.9435.5318.18%21.89%
20224839.91718.26353.258.08275.660.4243.78 36.7118.03%21.61%
Table 2. Description Statistical Analysis of Economic Efficiency and Its Influencing Factors (N = 510).
TypeVariablesUnitSmall-Scale FarmMedium-Scale FarmLarge-Scale Farm
MeanVarianceMeanVarianceMeanVariance
Input
variables
Weight of CalfKg307.3352.82265.567.15293.1363.39
Price of Calfyuan/Kg45.943.6646.323.8647.745.11
Concentrated feedKg1995.86259.471834.93299.191676.97264.49
Price of concentrated feedyuan/Kg2.80.652.950.462.760.35
RoughageKg4777.15665.555154.9901.75021.25891.22
Price of roughageyuan/Kg0.430.040.540.070.530.08
Laborhour38.662031.1818.4335.1616.01
Price of Laboryuan/hour14.014.1114.444.36154.29
Others yuan/head113.8757.99151.2682.28218.1780.34
Output
variables
Weight of beef cattleKg746.6645.51702.1550.9733.2555.1
Price of beef cattleyuan/Kg33.33334.172.6634.212.15
Amount of pollutionkg/head103.1113.3290.0512.5289.2213.76
Carbon emissionkg CO2e/head32.725.4534.225.6635.968.13
Individual
characteristics
of farms and
Managers
Age of Farm Manager (AGE)years old47.2910.7445.218.1343.86.86
Educational level of managers (EDU)2.450.732.780.933.992.01
Years of professional fattening (YEA)Year7.114.157.125.1184.01
Social/Government part-time (CAD)yes = 1, no = 00.070.310.40.360.170.25
Fattening scale (SCA)head32.3212.44152.2555.98355.63323.87
Management Level (MAG) Scores1.340.041.350.051.40.07
Social and Economic CharactersMain source of feed (FED)Local = 1, others = 00.570.50.420.350.320.43
Number of competitors (COM) Number1.580.481.920.611.70.81
Beef cattle are the Leading agricultural Industry Locally (DOC)yes = 1, no = 00.670.470.410.510.230.55
Cooperative member (COO)yes = 1, no = 00.470.50.680.490.720.5
Surroundings of Local PolicySubsidized by policy (SUB)yes = 1, no = 00.420.50.650.50.670.5
Be impacted by Environmental regulatory policies (POL)yes = 1, no = 00.410.480.370.490.530.55
Received Fattening training organized by the local government (TRA)yes = 1, no = 00.490.50.60.50.830.38
Note: ① This component of the variable encompasses the cost of fuel for farm machinery and equipment, maintenance of cowsheds and pens, and various other costs that are not included in the inputs. Note that mortality losses in beef cattle farming are measured in monetary terms and are equally apportioned to the same batch of cows that are slaughtered as an input variable; ② Primary or below = 1, Junior high school = 2, Senior high school = 3, College or above = 4; ③ The score is derived from a peer review of farms. The assessment is comprised of three components: farming techniques, farm management, and marketability. Each component is assigned a value of 0.5 points, with a total score of 1.5. ④ Number of competitors refers to the number of other livestock and poultry industries.
Table 3. TE, PTE and SE of Beef Cattle Fattening in China.
GroupPopulation (N = 510)Small-Scale Farm (N = 216)Medium-Scale Farm (N = 139)Large-Scale Farm (N = 155)
TEPTESETEPTESETEPTESETEPTESE
[0.5, 0.6)300000300000
[0.6, 0.7)21160440940880
[0.7, 0.8)1141000574602942028120
[0.8, 0.9)1911792429273204344921655717
[0.9, 1.0)12413223945691249251063038121
[1.0, 1.1)4056221612081612162810
[1.1, 1.2)10204290530384
[1.2, 2.0)671030200441
[2.0, 3.0)102000000102
Mean0.88660.91570.96670.84960.89020.95510.90790.95050.95550.91980.92230.9916
Std. err.0.18450.12090.12380.10070.10810.02990.11260.10350.05680.28420.14120.2098
Maximum2.37501.46742.23341.14041.24490.99961.28861.13901.16812.37501.46742.2334
Minimum0.64380.65980.84140.65550.65980.85590.72830.79550.84140.64380.68250.8426
Table 4. Scores of CE, IAE in Beef Cattle Fattening in China.
GroupPopulation (N = 510)Small-Scale Farm (N = 216)Medium-Scale Farm (N = 139)Large-Scale Farm (N = 155)
CEIAECEIAECEIAECEIAE
[0.6, 0.7)48 (9.41)5 (0.98)25 (11.57)0 (0.00)0 (0.00)0 (0.00)0 (0.00)12 (9.26)
[0.7, 0.8)267 (52.35)39 (7.65)154 (71.3)25 (11.57)16 (7.41)74 (34.26)8 (6.02)27 (19.44)
[0.8, 0.9)122 (23.92)158 (30.98)25 (11.57)91 (42.13)99 (45.83)105 (48.61)38 (27.31)54 (38.89)
[0.9, 1.0)52 (10.20)232 (45.49)12 (5.56)83 (38.43)89 (41.2)25 (11.57)71 (50.93)23 (16.2)
[1.0, 1.1)21 (4.12)51 (10.00)0 (0.00)12 (5.56)9 (4.17)12 (8.63)22 (15.74)23 (16.2)
[1.1, 1.2)0 (0.00)25 (4.90)0 (0.00)5 (2.31)3 (1.39)0 (0.00)0 (0.00)0 (0.00)
Mean0.8071 0.9170 0.7791 0.8987 0.9029 0.8444 0.9047 0.8569
Std. err.0.0895 0.0855 0.0634 0.0754 0.0818 0.0868 0.0934 0.1086
Maximum1.0523 1.1638 0.9759 1.1021 1.1931 1.0939 1.0806 1.0686
Minimum0.6774 0.7154 0.6866 0.7532 0.7606 0.7116 0.7259 0.6724
Note: Numbers in parentheses indicate the proportion of the sample size to the total sample.
Table 5. Revenue efficiency (RE) and Profit Efficiency (PE) in Beef Cattle Fattening in China.
GroupPopulation (N = 510)Small-Scale Farm (N = 216)Medium-Scale Farm (N = 139)Large-Scale Farm (N = 155)
REPEREPEREPEREPE
[0.6, 0.7)0 (0.00)19 (3.73)0 (0.00)0 (0.00)0 (0.00)12 (9.26)0 (0.00)4 (2.58)
[0.7, 0.8)24 (4.71)115 (22.55)16 (7.41)74 (34.26)8 (6.02)27 (19.44)0 (0.00)20 (12.9)
[0.8, 0.9)182 (35.69)211 (41.37)99 (45.83)105 (48.61)38 (27.31)54 (38.89)48 (30.97)57 (36.77)
[0.9, 1.0)239 (46.86)82 (16.08)89 (41.2)25 (11.57)71 (50.93)23 (16.2)78 (50.32)32 (20.65)
[1.0, 1.1)62 (12.16)77 (15.1)9 (4.17)12 (5.56)22 (15.74)23 (16.2)29 (18.71)37 (23.87)
[1.1, 1.2)3 (0.59)6 (1.18)3 (1.39)0 (0.00)0 (0.00)0 (0.00)0 (0.00)5 (3.23)
Mean0.9254 0.9161 0.9029 0.8444 0.9047 0.8569 0.9216 0.9068
Std. err.0.0839 0.1074 0.0818 0.0868 0.0934 0.1086 0.0765 0.1058
Maximum1.0838 1.1100 1.1931 1.0939 1.0806 1.0686 1.0838 1.1100
Minimum0.7259 0.6835 0.7606 0.7116 0.7259 0.6724 0.7861 0.6938
Table 6. Estimation Results of The Influencing Factors on TE&PTE.
TypeVariableSmall-Scale Farm Medium-Scale Farm Large-Scale Farm
TEPTETEPTETEPTE
Coeff.tCoeff.tCoeff.tCoeff.tCoeff.tCoeff.t
Ccons0.6434 *2.210.50631.381.2276 ***3.841.1417 ***3.370.15811.010.19441.32
Individual characteristics of farms and ManagersAGE−0.0035 ***−2.87−0.0026 *−1.72−0.0152 ***−4.42−0.0205 ***−5.610.0042 *1.870.0039 *1.84
EDU0.0343 *1.840.03001.280.0701 ***−7.40.1697 ***6.970.1525 ***4.430.1600 ***5.36
YEA0.0013−0.74−0.0003−0.130.0263 ***4.820.0287 ***4.990.0088 ***4.410.0077 ***4.09
CAD−0.0335−1.49−0.0192−0.68−0.1297 ***−3.75−0.1257 ***−3.43−0.0054−0.23−0.0120−0.55
SCA−0.0002−0.38−0.0003−0.490.00081.310.0014 **2.290.0000−0.350.0001 **2.78
MAG0.27231.330.33221.290.22230.940.4589 *1.840.2278 **2.350.19582.14
Social and Economic CharactersFED0.01481.14−0.0036−0.220.0718 **2.38−0.0681 *−2.12−0.0211−1.4−0.0315 **−2.21
COM0.0370 **2.730.074 ***4.320.1259 ***5.420.1223 ***4.970.01180.90.01351.09
DOC0.0205 ***1.210.03211.50.0613 **2.450.0774 **2.930.0389 *1.770.01920.93
COO0.02331.440.03341.63−0.0074 ***−3.03−0.0938 **−3.59−0.0047 **−2.84−0.0025 *−1.77
Surroundings of Local PolicySUB0.0601 ***4.30.0433 **2.45−0.0568 **−2.21−0.0621 **−2.280.0394 **2.390.0004 *0.03
POL−0.0183−1.43−0.0112−0.70.01350.710.01820.910.1011 ***6.990.0843 ***6.18
TRA0.1534 ***2.980.1359 **2.690.0991 ***3.010.12573.610.0545 **2.760.08514.57
Note: ① ***, **, and * are coefficient estimates significant at the 1%, 5%, and 10% levels, respectively. ② A series of independent regressions was conducted for each farm with a specific production size to calculate every efficiency.
Table 7. Estimation Results of The Influencing Factors on AE in Small-scale Fattening Farm.
TypeVariableCEIAEREPE
Coef.tCoef.tCoef.tCoef.t
Ccons0.8146 ***4.561.4244 ***5.880.5954 *1.891.0365 ***3.14
Individual
characteristics
of farms and
Managers
AGE−0.0004−0.780.0021 ***3.02−0.0005−0.59−0.0011−1.18
EDU0.0024 ***2.580.0510 ***0.760.0055 ***3.30.00050.29
YEA−0.0004−0.360.00100.74−0.0011−0.6−0.0018−0.96
CAD0.0125 ***2.320.0248 ***3.41−0.0102−1.080.01281.29
SCA0.00010.310.00030.08−0.0002−0.37−0.0004−0.74
MAG−0.1155−0.870.5116 ***2.840.18220.78−0.1866−0.76
Social and Economic CharactersFED0.0245 ***2.960.0266 **2.37−0.0083−0.570.01551.01
COM0.0431 ***5.160.01711.510.0291 *1.970.01711.1
DOC0.0198 *1.76−0.0015−0.10.0581 ***2.930.0732 ***3.51
COO0.0257 ***2.69−0.0017−0.130.0414 **2.460.0649 ***3.68
Surroundings of Local PolicySUB0.0319 ***3.55−0.0261 **−2.140.00780.490.024 *1.44
POL−0.0208 ***−2.510.00420.380.00030.020.00350.23
TRA0.0163 *1.910.0657 ***5.66−0.01−0.66−0.0004−0.02
Note: ① ***, **, and * are coefficient estimates significant at the 1%, 5%, and 10% levels, respectively. ② A series of independent regressions was conducted for each farm with a specific production size to calculate every efficiency.
Table 8. Estimation Results of Influencing Factors of AE in Medium-scale Fattening Farm.
TypeVariableCEIAEREPE
Coef.tCoef.tCoef.tCoef.t
Ccons0.7724 **2.311.1812.210.866 **2.510.52791.47
Individual
characteristics
of farms and
Managers
AGE−0.0001−0.03−0.0018−0.37−0.0054−1.7−0.0045−1.36
EDU0.0045 *1.960.0017 ***0.530.0010.480.00351.61
YEA0.0012 *0.220.0018 **−0.220.0096 **1.760.00330.58
CAD−0.0109−1.270.0138 **−1.01−0.0045−0.510.00110.12
SCA−0.0001−0.18−0.0001−0.040.00020.280.00020.25
MAG0.5177 **1.290.8214 ***3.380.09590.470.3182 ***1.49
Social and Economic CharactersFED−0.0166−0.480.02990.540.05641.58−0.0885 **−2.37
COM0.00780.3−0.0298−0.710.00720.27−0.036−1.27
DOC0.0552 *1.78−0.0435−0.880.0484 **1.510.1399 ***4.18
COO0.0641 **2.520.04471.10.03431.310.04131.51
Surroundings of Local PolicySUB0.0483 *1.840.0311 **0.740.00950.350.04631.63
POL0.0054 *0.21−0.0654−1.580.0418 **1.570.0458 *1.65
TRA0.0866 **2.290.09791.62−0.0822 **−2.10.0925 **2.27
Note: ① ***, **, and * are coefficient estimates significant at the 1%, 5%, and 10% levels, respectively. ② A series of independent regressions was conducted for each farm with a specific production size to calculate every efficiency.
Table 9. Estimation Results of Influencing Factors on AE in Large-scale Fattening Farm.
TypeVariableCEIAEREPE
Coef.tCoef.tCoef.tCoef.t
Ccons−0.0611−0.271.2441 ***30.7592 ***4.140.38421.1
Individual
characteristics
of farms and
Managers
AGE0.0061 **2.22−0.0113 **−2.24−0.0062 **−2.81−0.0032 **−2.75
EDU0.0559 ***3.18−0.0003−1.05−0.013−0.920.00810.30
YEA0.0010.350.0103 **2.110.00050.220.00000.01
CAD−0.0207−0.540.01690.24−0.0773 **−2.52−0.1214 **−2.08
SCA0.00011.480.00010.670.00012.280.00000.66
MAG0.2866 ***1.990.1569 *0.600.3447 ***2.980.432 *1.97
Social and Economic CharactersFED0.02130.980.0641.620.00220.120.0081 *0.24
COM−0.0094−0.57−0.0443−1.48−0.0145 **−1.06−0.0009 **−0.04
DOC0.0732 ***2.77−0.1093 **−2.28−0.0004−0.020.0621.54
COO0.00420.210.1036 **2.88−0.0371 **−2.33−0.0402−1.33
Surroundings of Local PolicySUB−0.0015−0.060.0754 ***1.740.0492 **2.570.02510.69
POL0.01530.69−0.1364 ***−3.36−0.0107−0.6−0.0002 **0.01
TRA0.0379 *1.270.01960.360.0154 *0.640.0307 *0.67
Note: ① ***, **, and * are coefficient estimates significant at the 1%, 5%, and 10% levels, respectively. ② A series of independent regressions was conducted for each farm with a specific production size to calculate every efficiency.
Disclaimer/Publisher’s Note: The statements, opinions and data contained in all publications are solely those of the individual author(s) and contributor(s) and not of MDPI and/or the editor(s). MDPI and/or the editor(s) disclaim responsibility for any injury to people or property resulting from any ideas, methods, instructions or products referred to in the content.

