Abstract
Combining inorganic and organic soil amendments with mineral fertilizers is promising for soil quality enhancement in modern agronomy systems. In this research, four main organic components were used in fertilizer formulations: coconut coir, biochar, lignite, and leonardite (enriched with microelements, tryptophan, and bacterial metabolic products). The treatments were assigned to the completely randomized design with a control object, without any soil amendments, and with only mineral fertilization. Aboveground biomass and root characteristics of maize (root length density, mean root diameter, root surface area density, specific root length, root volume density, and root dry matter) and water retention and characteristics of soil pores were determined. Compared to the control, all fertilizer formulations applied deteriorated the water retention properties of the soil. The highest plant available water content value was obtained for the control without any fertilizers. The addition of organic fertilizer formulations consisting of coconut coir, biochar, lignite, leonardite, microelements, tryptophan, and metabolic products of Pseudomonas sp. and Bacillus subtilis did not play a significant role in improving soil physical characteristics. The lowest productivity was characterized for maize without any fertilizers and amendments. All soil organic amendments resulted in lower yields than the one with only mineral fertilization. The highest root dry matter was obtained when lignite and leonardite were used as main components. Organic amendments can be recommended for soil bioregeneration, but their main effect on maize productivity is attributed to the mineral component.
1. Introduction
Soil degradation is a global problem caused by many factors, e.g., urban sprawl; industrial activities; and inadequate agriculture, such as excessive tillage, inappropriate crop rotations, excessive grazing, or crop residue removal [1]. Soil degradation refers to a decline in soil quality, resulting in a loss of ecosystem and agricultural functions. There are main types of soil degradation: physical, chemical, and biological [2,3]. Soil physical degradation is caused by soil structure and pore system deterioration [4]. Soil chemical degradation is usually characterized by acidification, salinization, nutrient depletion, reduced cation exchange capacity, or toxic contamination. Soil biological degradation reflects the depletion of the soil organic carbon (SOC) pool and the loss of soil biodiversity. One of the most severe consequences of soil biological degradation is that soil becomes a net source of greenhouse gas emissions [5]. The depletion of SOC has a negative impact on soil quality and the balance between nutrients. This decline in soil quality negatively influences productivity and lowers the quality and quantity of produced plant biomass [6,7].
SOC is the most important soil quality indicator for all soils throughout the world [8]. Lal [3] stressed the importance of managing SOC because it influences numerous chemical, physical, and biological properties and processes. Thus, an increase in SOC stocks has a beneficial effect on crop yields as a result of increased mineralization and higher nutrient availability, but also due to improved soil physical properties [9]. Long-term field studies in European conditions showed that the improvement of SOC content increased crop yield by up to 6–10% depending on soil texture [9,10].
The main methods for the improvement of SOC content are applying conservation tillage systems, crop residues, organic fertilizers, and soil amendments. Two categories of materials are used as soil amendments: organic (straw, manure, biochar, lignite, leonardite, etc.) and inorganic (zeolite, vermiculite, gypsum, sand, etc.) [11]. Recycling organic by-products, used as soil organic amendments, is recognized as a useful strategy to improve degraded soils, especially since the production of urban and industrial organic waste materials is widespread [12,13].
Lignite is a natural humic amendment characterized by high cation exchange capacity, which provides greater NH4+ retention and, thus, a less potentially leachable loss of NO3¬. Lignite positively influences the physical-chemical characteristics of soil in the long term [14,15]. Leonardite is a highly oxidized lignite composed of a mixture of humic and fulvic acids with a high humic acid content. These coal-derived amendments increase the microbial activity and enzymatic activity of amended soil, which results in higher nutrient availability. Thus, the lignite and leonardite positively affect crop growth [16,17,18]. A similar effect can be obtained by using soil amendments, such as biochar and coconut coir.
Biochar is the product of organic material pyrolysis in the absence of oxygen at high temperatures. Biochar has been shown to affect the soil’s physical, chemical, and biological properties [19,20,21]. Biochar application improves the yield of cereals, root crops, and fiber crops in tropical, subtropical, and temperate regions [22]. However, crop productivity responses to biochar may also be affected by different factors, such as biochar feedstock, application rate, crop species, and soil properties [4,23].
Coconut coir is widely used as a hydroponic growing medium [24]. However, post-production coconut coir, as a soil amendment, has not been investigated or described in the current literature. According to the European Commission Biodiversity Strategy 2030, Farm to Fork and European Climate Law, a circular economy of waste streams is promoted [25]. Therefore, the usage of coconut coir as biodegradable waste (as a resource of soil organic matter) is recommended to increase crop productivity and soil quality [2].
Combining organic soil amendments with mineral fertilizers is highly promising in modern agronomy systems. One of the advantages of mineral and organic fertilizer mixtures is the sequential release of nutrients according to plant demand. These benefits are particularly important for soils with low SOC content or those threatened by organic matter decomposition [26]. Using a soil amendment with high carbon content also plays a significant role in the reduction of carbon dioxide (CO2) emissions through carbon sequestration [6].
The positive effect of organic soil amendments with mineral fertilizers is widely reported in the literature. However, the interaction between soil organic amendments and mineral fertilizers may disturb this effect. Głąb et al. [27] reported no effect of biochar application with mineral fertilization on perennial plant yields. It was observed that mineral fertilizers covered the effect of soil organic amendments in a short period [28]. This effect might be due to a different level of organic amendment application, a different crop response related to various soil types, and the C:N ratio [29]. Thus, studies on the effects of mineral and organic fertilizer formulations on biomass production and root morphology are still scarce. There is also little information about the role of coconut coir as an organic component.
We hypothesize that bioregeneration organic soil amendments might affect the biomass productivity of maize and the physical quality of loamy sandy soil. The objective of this study was to determine the effect of different amendment formulations with a different proportion of coconut fibers, biochar, lignite, and leonardite on the physical quality of loamy sandy soil, with a special focus on water retention properties and root morphometric characteristics.
2. Materials and Methods
2.1. Site Description
A pot experiment was conducted at the experimental station of the Faculty of Agriculture and Economics of the University of Agriculture, in Kraków-Mydlniki, in the south of Poland (50°04′ N, 19°51′ E, 280 m a.s.l), in 2021. The climate of the experimental site was temperate, with an average annual temperature of 7.7 °C during the study period. The pots were placed in a rainfall shelter without walls and with a transparent glass roof to exclude precipitation but ensure natural light and ventilation. The pots (diameter 0.22 m, volume 0.009 m3) were filled with loamy sandy soil. The physical and chemical characteristics of the soil are presented in Table 1.

Table 1.
Basic soil physical and chemical properties. Methods: soil particle density—picnometric method; soil granulometric composition (sand/silt/clay content)—aerometric method; soil pH—potentiometrically; electrolytic conductivity (EC)—conductometrically; total content of N, P, K, Ca, and Mg—optical emission spectrometry (ICP-OES).
2.2. Experimental Design
The pots were arranged according to a completely randomized design with four replications. The experiments consisted of forty pots with the eight treatments with organic fertilizer formulations, control (CTR) without any fertilization, and object with only mineral fertilization (MF). All treatments T1–T8 (Table 2) were supplemented with mineral fertilization (MF).
Table 2.
Composition of organic fertilizer formulation used in the experiment (% in dry matter).
Mineral fertilization (MF) was applied at the following rates: 0.20 g kg−1 NH4NO3; 0.10 g kg−1 Ca(H2PO4)2 H2O; 0.25 g kg−1 KCl (Avantor Performance Materials Poland S.A., Gliwice, Poland). Fertilizer formulations were mixed with soil at a rate of 0.35 g kg−1 of soil.
Coconut coir was a post-production waste material of the soilless horticultural system. Biochar was produced from coniferous tree biomass at a temperature of 500 °C for 15 min. Before pyrolysis, the biomass was crushed (1 cm wood chips) and dried at a temperature of 60 °C. The lignite was mined at the Sieniawa coal mine, west of Poland. The leonardite was mined in Kyiv, Ukraine (the Energy Investment Company Ltd.). The chemical properties of the mineral and organic fertilizer formulation components are presented in Table 3. Organic feedstock was ground into particles of 3–5 mm. Microelement salts (Cu, Zn, Fe, Mn), tryptophan, and metabolic products of Pseudomonas sp. and Bacillus subtilis (produced by the Department of Environmental Microbiology and Biotechnology, University of Warsaw, Poland) were added to all fertilizer formulations.
Table 3.
Chemical properties of components used for organic fertilizers formulation. Methods: total N and organic C–CNS analyzer; total content of P, K, Ca, and Mg—optical emission spectrometry (ICP-OES); ash content–muffle furnace.
After applying soil amendments, maize (Zea mays L., Lokata cultivar) seeds were sown (six plants per pot) in April 2021 and 2022. Soil moisture during plant vegetation was maintained at 40–60% of maximum soil water capacity using the Rain Bird sprinkler system (Rain Bird Inc., Tucson, Arizona, USA).
2.3. Measurements of Root Morphology
The maize was harvested in September 2021 and 2022 (120 days after sowing). Aboveground biomass samples were taken from each pot and dried for 48 h at 65 °C for dry matter yield determination. The root samples were collected using the soil-core method with a core diameter of 80 mm. Samples were taken in three replications per pot. The root samples were prepared for analysis using a hydro-pneumatic washing system [30]. Organic debris was removed manually. The images of root samples were obtained with an Epson Expression 12000XL PRO scanner (Seiko Epson Corp., Owa Suwa, Japan) and saved as tiff at a resolution of 1200 dpi. The image analysis was performed using Aphelion Dev 4.2.0 software (ADCIS S.A. and Amerinex Applied Imaging, Herouville, Saint-Clair, France). The images were analyzed using the method described by Bauhus and Messier [31]. The roots were divided into the following diameter classes: <0.02, 0.02–0.05, 0.05–0.1, 0.1–0.2, 0.2–0.5, 0.5–1.0, 1.0–2.0, and >2.0 mm. The root morphometric parameters were calculated by methods described by Głąb et al. [32], i.e., root length density (RLD), mean root diameter (MRD, root surface area density (RSAD), specific root length (SRL), and root volume density (RVD). The roots were dried at a temperature of 80 °C to determine the root dry matter density (RDMD).
2.4. Measurements of Soil Physical Parameters
Soil samples were collected in September 2021 and 2022 after maize harvesting using steel cylinders with a capacity of 100 cm3 in six replications per pot. The bulk density (BD) of the soil was determined by the thermogravimetric method of soil being dried at 105 °C and the soil particle density was determined using the picnometric method.
The soil water retention curve (SWRC) was determined using pressure plates (Soil Moisture Equipment Corp., Santa Barbara CA, USA) according to Richards’ method [33]. The soil samples were saturated with water for 24 h. After saturation, suction was successively applied to establish seven matric potentials, namely, −4, −10, −33, −100, −200, −500, and −1500 kPa. Van Genuchten [34] parameters were fitted to the SWRC experimental data with the Mualem constraint [35]. The SWRC models were fitted to the experimental water retention data using the non-linear least-squares procedure in the statistical software package Statistica v. 13.3 (StatSoft Inc., Tulsa OK, USA). Based on this method, the following soil physical parameters were calculated: total porosity (TP, calculated from the soil particle density and BD), field capacity (FC, defined as the equilibrium volumetric soil water content at −10 kPa matric potential), permanent wilting point (PWP, volumetric soil water content at −1500 kPa matric potential), relative field capacity (RFC, defined by Reynolds et al. [36] as the proportion between FC and TP), available water content (AWC, defined as the difference between FC and PWP), productive water content (PWC, defined as the difference between the water content at the FC and the water content at −490 kPa), and a slope (S) at the inflection point of the SWRC (according to the S theory by Dexter [37], with the Mualem constraint). The large value of the S indicates the presence of structural pores and is characteristic of good soil quality.
The SWRC models were also used to estimate the pore size distribution [38]. The volume of different pore categories was determined according to the pore classification developed by Greenland [39], which characterizes pores as a bonding space (<0.005 μm), residual pores (0.005–0.5 μm), storage pores (0.5–50 μm), transmission pores (50–500 μm), and fissures (>500 μm).
2.5. Statistics
The experiment was carried out in a completely randomized design. A two-way analysis of variance was performed using Statistica 13.3 (TIBCO Software Inc., Palo Alto, CA, USA) to test the effect of the type of main component and its rate in the fertilizer formulations. The data were checked for normality of distribution using the Shapiro–Wilk test and for homogeneity of variance using Levene’s test. The significance of differences between the means was conducted using a Bonferroni test with a level of significance of p < 0.05. Pearson’s correlation analysis was used to analyze the correlation between soil physical parameters, root morphometric parameters, and aboveground yield and fertilizer main components. For data where significant values of correlation coefficients (r) were observed, the results of regression models are presented in graphical form, together with regression equations and coefficients of determination (R2).
3. Results
3.1. Soil Pore Characteristics
Total soil porosity was significantly affected by fertilization treatments (Table 4). The lowest TP value was obtained for the CTR treatment (0.451 cm3 cm−3), soil without fertilization. Higher TP values were noted for all treatments where mineral fertilization was applied, i.e., MF and T1–T8. TP depends on organic components in relation to its rate. T3 and T7 with a 25% rate of the main component resulted in lower TP than other treatments. The highest TP values were obtained for T6 and T8 with a 75% rate. Thus, the rate of the main component was a statistically significant factor. The lower rate resulted also in lower TP values than this at 75%. For BD, the opposite effect was observed compared to the data acquired for TP, which is due to the way BD was calculated. The highest BD value was obtained for the CTR treatment (1.454 g cm−3).
Table 4.
Physical quality parameters of soil amended with different organic fertilizer formulations (means of 2021 and 2022). Bulk density (BD), total porosity (TP), field capacity (FC), permanent wilting point (PWP), relative field capacity (RFC), the slope at the inflection point of retention curve (S), available water content (AWC), productive water content (PWC).
Changes in the TP were due to the variations in soil porosity. Pores with a diameter below 0.005 μm accounted for only 1.9% of the total pore volume (Table 5). The lowest bounding space was characterized for the control (0.0080 cm3 cm−3). Mineral fertilization did not increase the volume of this pore fraction. Significantly higher bounding space was the result of leonardite and lignite applications. (0.0118 cm3 cm−3 on average). Pores with a diameter of 0.005–0.5 μm represented 7.4% of the TP. The highest volume of these residual pores was the result of leonardite application as the main organic component. The most common pore fractions for all treatments were those with diameters in the 0.5–500 μm range. These pores accounted for 76.1% of total porosity and corresponded to the pore fractions classified by Greenland (1981) as storage and transmission pores. These pores are involved in water movement and water retention capability. The highest volume of storage pores was observed for the CTR object (0.214 cm3 cm−3) while the lowest was for the T6 and T8 treatments (0.164 cm3 cm−3 on average) where lignite and leonardite were applied at a 75% rate. Transmission pores, 50–500 μm, were affected by MF and all fertilizer formulations were applied. Regarding the CTR, the volume of transmission pores was 0.163 cm3 cm−3, whereas after applying mineral fertilization (MF), this value increased to 0.200 cm3 cm−3. The application of leonardite at a 75% rate reduced the volume of these pores to 0.176 cm3 cm−3. The largest pores with diameters above 500 μm represented 14.7% of the total soil porosity. The lowest fissure volume value was observed for the control object (0.028 cm3 cm−3). Fertilizers increased the volume of fissures with the highest value for the T8 treatment (0.134 cm3 cm−3). The high TP for the T6 and T8 treatments, with high lignite and leonardite content, corresponded to the high pore content of diameter < 0.5 and >500 μm. However, the T6 and T8 treatments were characterized by low pore content in the range of 0.5–500 μm, storage, and transmission pores, thus resulting in low water retention capabilities (Table 4).
Table 5.
Pore size distribution of the soil amended with different organic fertilizer formulations (means of 2021 and 2022).
Mineral fertilizers (MFs) and fertilizers with organic components (T1–T8) mainly increase the volume of large pores above 50 μm in diameter, in comparison to the CTR. However, these treatments reduced the volume of smaller pores with a diameter of 0.005–50 μm. This effect was reflected in the soil’s hydraulic properties.
3.2. Soil Water Retention
The water retention curves are presented in Figure 1. Estimated parameters (θs, α, and n) of the van Genuchten model and coefficients of determination are shown in Table 6. The differences between the SWRC of the treated soil appeared not only in a high matric potential range but also in a low range below 100 kPa. The application of mineral and organic fertilizers deteriorated the water retention properties of the soil compared to the CTR. The highest FC value was observed in the CTR object (0.216 cm3 cm−3) (Table 4). Upon applying any fertilizers, FC decreased on average to 0.194 cm3 cm−3. The lowest FC value was noted for the T1 treatment (0.178 cm3 cm−3). None of the treatments used in this study significantly affected the PWP. This effect was attributable to minor differences between treatments in porosity ranging 0.005–0.5 μm in diameter. The changes in FC and PWP were reflected in the AWC values. The highest AWC value was obtained for the control without fertilizers (0.183 cm3 cm−3). Mineral fertilization (MF) reduced the AWC to 0.162 cm3 cm−3. However, the lowest AWC values were obtained when lignite and leonardite were used as the organic main components. A similar effect was also observed for the PWC parameter. The CTR had the highest value (0.166 cm3 cm−3), whereas the T6 and T8 treatments had the lowest value (0.127 cm3 cm−3 on average).
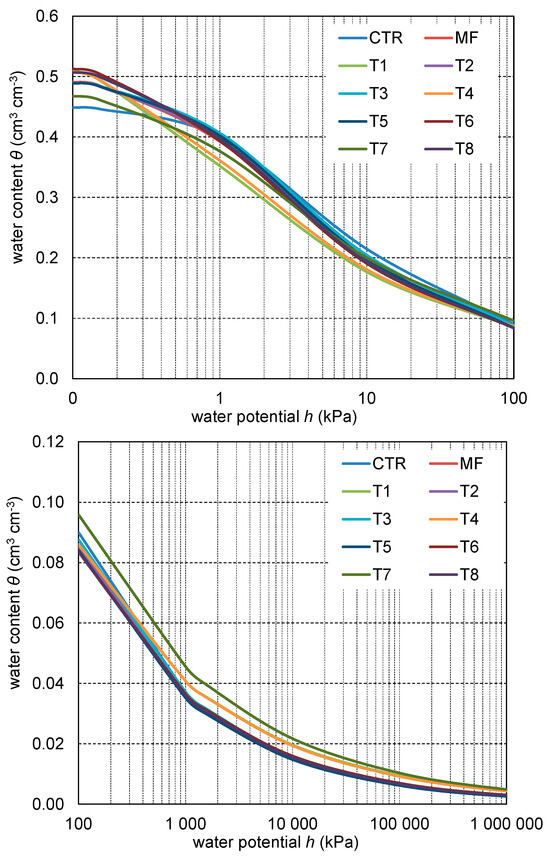
Figure 1.
The soil water retention curves based on the van Genuchten equation for the investigated organic fertilizer formulation.
Table 6.
Parameter values (θs, α, and n) of the van Genuchten model for the soil hydraulic properties fitted for the different organic fertilizer formulations.
Various fertilizer formulations also affected the soil quality indices, such as the S slope and RFC (Table 4). The lowest S index was obtained for the CTR (0.089). MF and organic fertilizer formulations increased the S value to 0.094, indicating good soil quality. The opposite effect was recorded for the RFC parameter. The highest RFC value was obtained for the CTR (0.479), which decreased with the application of any fertilization, mineral, or organic formulation. It indicates that mineral and organic fertilization application resulted in a reduction in the soil water condition. The lowest RFC values were calculated for the T6 and T8 treatments, where lignite and leonardite had higher concentrations.
Fertilizer formulations T1–T8 contained different proportions of biochar, coconut coir, lignite, and leonardite. Soil hydraulic properties were significantly correlated mainly with the lignite content (Figure 2). Higher lignite content in the investigated fertilizer formulations increased the volume of pores <0.005 μm and >500 μm. In contrast, lignite reduced pore volume in the 0.5–50 μm range. Leonardite content was significantly correlated only with pores of 0.5–50 μm (Figure 2). However, it did not result in a relationship with other soil hydraulic properties.
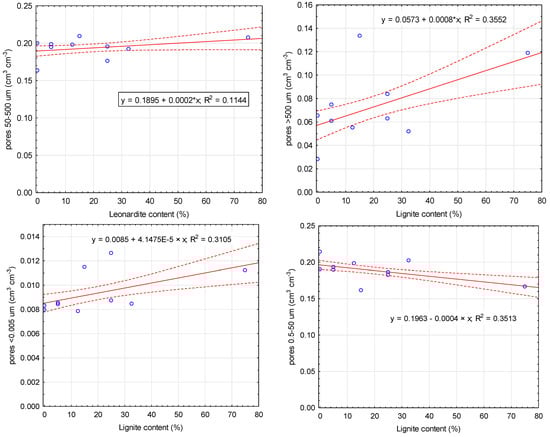
Figure 2.
Relationship between lignite and leonardite content and differential porosity. Solid line: fitted linear regression; dotted lines: 0.95 confidence interval.
3.3. Soil Bioregeneration Amendments Affect Maize Yield and Root Biomass
Above- and below-ground maize biomass was significantly affected by soil bioregeneration amendments used in this experiment. The lowest maize yield was obtained for the CTR treatment (3.87 g DM m−2), where no fertilization was applied (Table 7). Mineral fertilization increased maize yield to 13.15 g DM m−2. This treatment was characterized by the highest yield. Any additional bioregeneration soil amendments resulted in lower productivity, 11.81 g DM m−2 on average. The aboveground biomass of maize depended on the main component of amendment formulations. Leonardite as a main component resulted in a yield of 12.50 g DM m−2. Lower yield was observed when lignite was used as a main component (11.83 g DM m−2). However, coconut coir and biochar resulted in even lower maize yields, 11.43 and 11.49 g DM m−2, respectively. The main components were applied in two rates of fertilizer formulations, 25 and 75%. However, these proportions did not significantly affect the aboveground biomass of maize. The aboveground biomass of maize was positively correlated with leonardite content in soil bioregeneration amendments (r = 0.69, p < 0.05). The non-linear regression model for the relationship between aboveground biomass and leonardite content is presented in Figure 3.
Table 7.
Aboveground and root dry matter (RDM) biomass productivity and root:shoot ratio (RSR) for organic fertilizer formulation (means of 2021 and 2022). Different letters indicate significant differences by the Bonferroni test (p < 0.05) (superscripts used only for significant differences according to ANOVA). Asterisks indicate significant differences between the controls (CTR and MF) and means of other treatments.
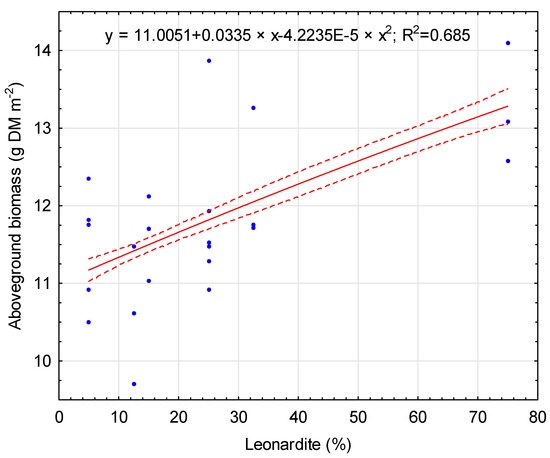
Figure 3.
Relationship between leonardite content and aboveground biomass. Solid line: fitted linear regression; dotted lines: 0.95 confidence interval.
Similarly to aboveground yield, the lowest root biomass was obtained for the CTR treatment (0.367 mg cm−3). Mineral fertilization (MF) resulted in substantially higher root biomass (1.266 mg cm−3). Additional soil bioregeneration amendments increased RDM values, particularly noticeably when main components were used in a higher proportion. The highest RDM values were characterized for lignite and leonardite as main components, 1.466 and 1.488 mg cm−3, respectively. Coconut coir and biochar as the main components of fertilizer formulations resulted in RDM at a similar level to the one for the MF treatment (1.266 and 1.273 mg cm−3, respectively). Contrary to aboveground yield, RDM also depended on the main component proportion in the soil amendment formulation. The rate of 25% resulted in a RDM of 1.283 mg cm−3. However, when the participation of the main component increased to 75%, RDM values reached 1.468 mg cm−3.
Changes in maize yields and RDM in consequences resulted in a root:shoot biomass ratio. The RSR for the CTR was 0.107 and decreased when mineral fertilization was applied. The application of soil bioregeneration amendments resulted in a lower RSR. The interaction between the material of the main component and its rate was observed. The highest RSR value was characterized for the T7 treatment (0.111), where lignite was applied at a rate of 25%. Any other treatments resulted in a lower RSR, with the lowest RSR for the T3 treatment (0.092). Generally, lower main component participation resulted in a lower RSR (0.096) in relation to higher participation (0.099). In addition, the correlation between aboveground biomass and root biomass was statistically significant (r = 0.72, p < 0.05). The non-linear regression model for the root:shoot ratios is presented in Figure 4. Higher RDM values increase the aboveground biomass of maize, with the optimum value at the root biomass of 1.5 g DM m−2. RDM was also correlated (r = 0.65, p < 0.05) with soil porosity. However, only a volume of <500 um pores was significantly correlated with RDM values, with an optimum value of 0.09 cm3 cm−3 (Figure 5).
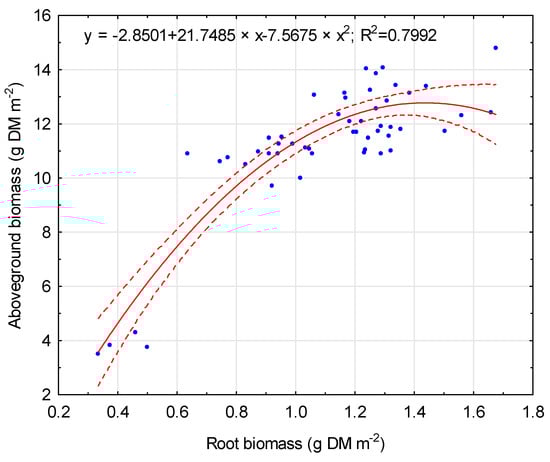
Figure 4.
Relationship between root biomass and aboveground biomass. Solid line: fitted linear regression; dotted lines: 0.95 confidence interval.
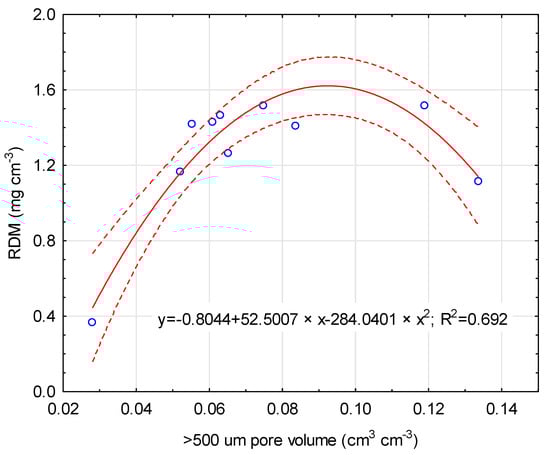
Figure 5.
Relationship between >500 um pore volume and root dry matter. Solid line: fitted linear regression; dotted lines: 0.95 confidence interval.
3.4. Root Morphometric Parameters
Root morphometric parameters of maize were significantly modified by soil bioregeneration amendments used in this experiment. Similarly to root dry matter, the lowest root length was obtained for the CTR treatment (14.98 mm cm−3) (Table 8). When the soil was amended with mineral fertilizers, RLD increased to 20.53 mm cm−3. The application of soil bioregeneration amendments significantly affected RLD values. When leonardite as a main component was used, the RLD increased to 21.49 mm cm−3. However, other amendments resulted in lower RLDs in comparison with MF treatment. Biochar and lignite resulted in RLD values of 19.67 and 19.33 mm cm−3, respectively. The lowest values of RLD were obtained when coconut coir as a main component was used (17.15 mm cm−3). The rate of the main component also significantly affected the root length of maize. Higher RLD values were characterized when the participation of the main component was 75%.
Table 8.
Root morphometric characteristics for organic fertilizer formulation (means of 2021 and 2022). Different letters indicate significant differences by the Bonferroni test (p < 0.05) (superscripts used only for significant differences according to ANOVA). Asterisks indicate significant differences between the controls (CTR and MF) and means of other treatments.
The results for RSAD and RVD correspond to the relationships observed in RLD. The lowest value of RSAD was obtained for the CTR treatment (0.203 cm2 cm−3) and increased to 0.304 cm2 cm−3 when mineral fertilization was applied. Treatments with biochar, lignite, and leonardite as main components of the fertilizer formulation did not change RSAD values in relation to MF treatment. Coconut coir reduced root surface area to 0.257 cm2 cm−3. The higher participation of the main component resulted in higher RSAD values. The RVD followed the RSAD response to soil bioregeneration amendments. The lowest RVD value characterized the CTR treatment and it increased when mineral fertilization was applied. Biochar, lignite, and leonardite application increased RVD but coconut coir decreased in comparison with MF treatment.
The highest value of the SRL parameter was obtained for the CTR treatment (45.09 mm mg−1). When organic fertilizer formulations were applied, SRL decreased to values in the range of 13.59–17.10 mm mg−1. However, any component of bioregeneration amendments did not significantly affect SRL.
The most frequent root diameter fraction at every treatment was 0.1–0.2 mm (Figure 6). MRD was significantly affected by soil bioregeneration amendments. The lowest MRD value was characterized by maize roots when no fertilization was used (0.439 mm). The highest MRD was obtained when biochar was used as the main component of fertilization formulation (0.510 mm). There were no differences in MRD between coconut coir, lignite, and leonardite as main components. The participation of the main component did not significantly affect MRD.
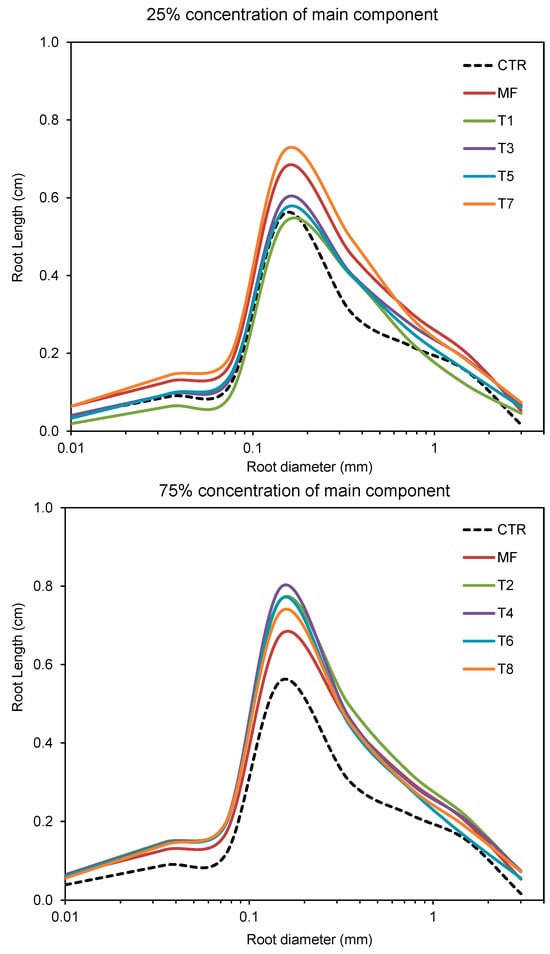
Figure 6.
Root length density (RLD) distribution at the different root diameter values for treatments with organic fertilizer formulation.
4. Discussion
4.1. Effects of Fertilizer Formulations on Soil Physical Properties
The results obtained in this pot experiment indicated that fertilizer formulations with organic components, microelements, and metabolic products of Pseudomonas and Bacillus significantly affected the soil pore system. These changes in the soil’s differential porosity resulted in the deterioration of its hydraulic quality compared to the control treatment. This effect was also noticed for treatment with only mineral fertilization and without organic fertilizer formulations. It means that soil hydraulic deterioration mainly responds to mineral fertilization. Organic components did not improve these features.
In the literature, many studies have demonstrated that organic substrates added to degraded soil improve its quality, primarily resulting in increased organic matter content and soil structure stabilization [2]. The consensus among researchers has been that organic matter content increases the soil water retention capacity and availability [4,40]. This positive effect on water retention characteristics has been clearly identified in some studies on fine-textured soils [41] and course-textured soils [42]. The effect is particularly noticeable in degraded sandy soils [2]. However, a study by Głąb et al. [43] found no effects of fertilization, either mineral or organic, on Fluvisol silty loam. They ascribe this effect to the low rate of compost used and the high initial porosity of the silty loam soil.
In the present research, the initial TP was 0.451 cm3 cm−3 and increased after fertilization treatment. Unfortunately, the increase in TP was in the bonding space, transmission pores, and fissures. Fertilizers used in this research reduced porosity in the range corresponding to the water retention capacity. Zaleski and Kopeć [44] reported an adverse effect of NPK mineral fertilization on the soil water retention of mountain meadows. On the other hand, Głąb and Gondek [45] reported that mineral fertilization did not affect any physical parameters of sandy loam Mollic Fluvisol under red clover/grass sward. According to soil classification for available water content [46], all fertilization formulations resulted in AWC being in the medium class (0.121–170 cm3 cm−3). Soil without any treatment (CTR) with the highest AWC value was classified in the high class (0.171–0.210 cm3 cm−3). According to Dexter et al. [37], AWC in the range of 0.15–0.20 cm3 cm−3 is considered good for maximal root growth and function. In this study, the CTR and other treatments fell within this range. Only treatments with high lignite and leonardite content, with the AWC value of 0.145 cm3 cm−3, were in the limited range for maximal root growth.
The changes in the soil pore system and AWC are usually associated with soil quality indicators, namely, the RFC and S slope. According to S theory [37], an S value > 0.05 indicates excellent physical or structural soil quality. The S value for all fertilized treatments (MF and T1–T8) averaged 0.093 and, for the CTR, it was 0.089. In the present study, the RFC value was in the range of 0.344–0.479, which may indicate soil water depletion for microbial activity. The organic fertilizer formulation used in this study did not influence the RFC values. According to Reynolds et al. [36], the optimal balance between soil water capacity in the root zone and soil air capacity may be achieved when 0.6 ≤ RFC ≤ 0.7. Lower RFC values (below 0.6) result in reduced microbial activity because of insufficient soil water. Greater RFC values (above 0.7) result in reduced microbial activity because of insufficient soil air [47]. Pranagal and Podstawka-Chmielewska [48] concluded that the optimum balance in air–water relations takes place when RFC = 0.66.
Lignite and leonardite as two of the investigated fertilizer formulation components had a higher impact on soil physical properties than the others, coconut coir and biochar. Lignite as a soil amendment has a beneficial effect on plant growth in degraded soil because of its ability to reduce soil toxicity [49] and its positive effect on microbial communities [50]. It has been reported that lignite-based amendments have a complex intrapore structure with numerous micropores, resulting in a large surface area and, thus, a high number of active sites [51]. Kołodziej et al. [52], in a long-term experiment, observed that lignite dust added to soil as an amendment increased the volume of mesopores 1–6 μm in size. Lignite dust also increased micropore volume related to unavailable water but it did not change the macropore content. In our study, the fertilizer formulation with the highest lignite content increased the volume of micropores < 0.005 μm and macropores > 500 μm. In contrast to the research by Kołodziej et al. [52], lignite decreased the volume of mesopores with a diameter in range from 0.5–50 μm. Kołodziej et al. [52] concluded that the water and air properties of the lignite-treated soil should be considered beneficial for plant growth and development. Our study did not confirm this statement since lignite deteriorates the soil’s physical quality. According to Li et al. [50], differences in reported effects of lignite as a soil amendment might be ascribed to the origin of the source material, environmental and geological factors, and stage of coalification.
In this study, leonardite as a fertilizer component reduced water availability for plants. In the research of Shaykewich [53], leonardite was also recognized as ineffective in altering soil porosity, soil strength, and water-stable aggregation. This effect was ascribed to the hydrophobicity of leonardite and the lack of active functional groups on its surface. The results obtained by Głąb et al. [21] in a short-term study indicated that biochar application significantly improved the physical properties of sandy soil. Biochar as soil amendment reduced the volume of soil pores with a diameter below 0.5 μm but increased the volume of larger pores with a diameter ranging from 0.5 to 500 μm. This resulted in improving the soil water characteristics by increasing the AWC. This characteristic of biochar is mainly ascribed to its physical features, such as its highly porous structure and large surface area [54]. However, this beneficial effect of biochar application as a soil amendment was not confirmed in this study. The effect of fertilizer formulations on soil physical properties was not dependent on the percentage of biochar. Coconut coir used in this experiment did not significantly affect the differential porosity and hydraulic characteristics of soil amended with various fertilizer formulations. A one-year study by Koyama et al. [55] suggests that the coir medium used in 20 Mg hm−2 can be reused as a soil amendment to enhance porosity. Coconut coir as a soil amendment and its effect on soil physical parameters have not been widely investigated. In the research with a hydroponic growing medium, Hongpakdee and Ruamrungsri [56] found that coconut coir dust at a high rate of up to 75% v/v can improve the physical properties of the medium by decreasing bulk density and increasing the total porosity and water-filled pores. One could expect coconut coir as a soil amendment to inherit these features from a soilless hydroponic medium. However, the present study did not confirm this thesis, probably due to the lower rate (approx. 1 Mg hm−2) used as a soil amendment.
4.2. Impact of Soil Organic Amendments on Maize Productivity and Root Morphology
Organic fertilizer formulations affected the productivity of maize, both aboveground and the root biomass. Obviously, non-fertilized control treatment resulted in very low productivity. The greatest increase in maize yield was observed when mineral fertilization without soil organic amendments was applied. Soil organic amendments resulted in slightly lower yields than with only mineral fertilization. However, some treatments with soil amendments resulted in significantly higher RDM levels in relation to treatment with only mineral fertilization.
The explanation for the results could also be found in the root:shoot ratio parameter. The RSR was significantly higher in the control without fertilization and soil amendments. Mineral fertilization increased the RSR but the lowest value was after organic soil amendment application. This phenomenon can be explained with the optimal partitioning theory. Plants allocate their biomass to the organ that has the most limited resource [57]. The expression of such optimization is the change in allocation between the biomass of shoots and roots in response to nutrient availability. When water supply or nutrient availability increases, plants allocate less mass to their roots because less effort is required to acquire these resources. This effect was reported by Głąb et al. [58] for perennial ryegrass after biochar and straw application as soil amendments.
Some organic fertilizer formulations affected maize biomass production and root system morphology. However, some treatments did not increase maize aboveground and root productivity but even resulted in lower productivity than this with mineral fertilization alone. The beneficial effect of organic soil amendment applications, such as leonardite, for crop production is widely reported in research reports [59]. Akinremi et al. [60] reported an increase in canola (Brassica napus L.) yield after leonardite application at a rate of 10 g per 1 kg of soil. This effect was ascribed to supplying sulfur by leonardite. Thus, the lack of response of wheat (Triticum aestivum L.) and green beans (Phaseolus vulgare L.) to leonardite was attributed to their lack of response to sulfur. The increase in maize yield in relation to leonardite application at a rate of 1.3 Mg hm−2 was also observed by Kaya et al. [61] under a drought and a phosphorus deficiency stress situation. Current research with a similar rate of application confirms these observations. Leonardite application resulted in significantly higher maize yield than other organic components and mineral fertilization alone.
In recent years, researchers have pointed to lignite as a potential soil conditioner in crop production. Lignite improves SOC content, which increases nutrient holding, water retention capability, crop yield, and nitrogen use efficiency [62,63]. Ehsani et al. [64] reported that the lignite application of 3.75% significantly improved the soil properties and increased the morphology of the nitrebush (Nitraria schoberi L). In studies of Chen et al. [63], the results showed that lignite at a rate above 4.5 Mg hm−2 improved sunflower (Helianthus annuus L.) height, leaf area index, and dry biomass. They also reported that lignite at a rate of 3.0 Mg hm−2 has a beneficial effect on root length, root surface area, and root volume. In our study, lignite, as a main component, resulted in lower maize yield than maize with mineral fertilization alone but significantly higher than the control. Lignite had a very beneficial effect on root development, which resulted in the highest RDM values. Thus, the highest RSR was also noted for lignite treatments. A similar effect was reported by Baumann et al. [65] when lignite addition to sandy soil had no effect on the shoot dry weight of pine (Pinus sylvestris L.) but increased root dry weight. They observed that roots grow preferentially towards lignite fragments even if the surrounding sand is enriched with nutrients.
Research on crop response to biochar as a soil amendment is mainly focused on aboveground biomass and crop yields. However, plant responses to biochar addition may be through direct interaction between biochar particles and roots. Fine roots and root hairs take up nutrients and water from internal biochar pores [66]. In this research, biochar as a main component of organic soil amendments did not result in higher biomass production than MF treatment. Biochar application resulted in the highest root diameter, but other root characteristics were at a lower level than when only mineral fertilization was used. In a meta-analysis by Xiang et al. [67], biochar application increased root biomass, root volume, and surface area. However, biochar-induced increases in root length and the number of root tips were much larger than the increase in root diameter. This suggests that biochar application benefits root morphological development to alleviate plant nutrient and water deficiency rather than to maximize biomass accumulation. Głąb et al. [27] noticed that biochar in rate of 15 Mg hm−2 as a soil amendment did not affect most root morphometric parameters of perennial grass. The application of biochar only slightly reduced the root diameter of cocksfoot. Straw and biochar as soil amendments applied at grassland resulted in higher root length, surface area, volume, and mean root diameter. However, the differences for most of the root morphometric parameters were mainly noticed between the control, which did not have any amendments, and other treatments, where biochar produced from miscanthus or wheat was applied [58].
The effects of biochar application on crop production are sometimes contradictory. The results depend on the feedstock used for biochar production and the parameters of the pyrolysis process, as well as soil and climate conditions [67,68,69]. Biochar application affects plant growth mainly by improving the soil environment, such as the nutrient availability, pH, and cation exchange capacity [70]. Thus, the responses of root characteristics to biochar application depend mainly on soil properties [67,71]. In most research, biochar is applied with mineral fertilizers. This application may also interact and affect root growth [72].
Soil amendments promote plant growth either with a direct mechanism (e.g., supplying mineral nutrients to the plant) or an indirect mechanism (e.g., improving soil properties) [27,73]. However, the different characteristics of soil organic amendments, such as raw materials and production conditions, caused different effects of soil organic amendments on crop growth. Moreover, the soil texture, nutrient and water availability, and crop species also resulted in different impacts of soil organic amendments on soils and crops [63,74]. According to a meta-analysis by Amoah-Antwi et al. [62], long term studies on the effects of manures and fertilizers on soil quality and productivity suggested that improvement is only possible after many years of OM accumulation.
5. Conclusions
Organic amendments, such as coconut coir, biochar, lignite, and leonardite, enriched with microelements and bacterial products, do not significantly improve soil physical properties and sometimes worsen them, particularly with higher lignite and leonardite content.
Mineral fertilization alone has the greatest effect on maize biomass production, resulting in higher yields compared to soil organic amendments or no fertilization. The lowest productivity characterizes maize without any fertilizers and amendments. Organic treatments exhibit slightly lower performance compared to mineral fertilization. Although lignite and leonardite increased root biomass, mineral fertilization had a more substantial impact. Root morphology was notably altered by organic amendments. However, the correlation between root morphology and fertilizer components is not straightforward, suggesting complex interactions between soil properties and plant response. Organic amendments can be recommended for soil bioregeneration but their main effect on maize productivity is attributed to the mineral component.
Further long-term field trials are needed to explore the interactions between organic and mineral components in soil amendments and their effects on crop productivity and soil quality. Moreover, variability in soil properties, particularly degraded soils, and climatic conditions should be considered. Understanding the complex interactions between soil, amendments, and crops will be crucial for maximizing the benefits of organic bioregeneration in modern agronomy systems.
Author Contributions
Conceptualization, K.G.; Methodology, K.G.; Supervision, K.G.; Funding acquisition, M.M.-H.; Writing—original draft, T.G.; Investigation, K.G., T.G. and M.M.-H. Project administration, M.M.-H. All authors have read and agreed to the published version of the manuscript.
Funding
This study was financed by the project entitled “SoilBioregener—an innovative fertilizer with HydroBioMicroActive properties for regeneration of productive soils”, funded by the TANGO Joint Undertaking of The National Centre for Research and Development and the National Science Centre under contract no. TANGO-IV-A/0006/2019-00.
Data Availability Statement
The data presented in this study are available on request from the corresponding author.
Conflicts of Interest
The authors declare no conflicts of interest. The funders had no role in the design of this study; in the collection, analyses, or interpretation of data; in the writing of the manuscript; or in the decision to publish the results.
References
- Karlen, D.L.; Rice, C.W. Soil Degradation: Will humankind ever learn? Sustainability 2015, 7, 12490–12501. [Google Scholar] [CrossRef]
- Kacprzak, M.; Kupich, I.; Jasinska, A.; Fijalkowski, K. Bio-based waste’ substrates for degraded soil improvement-advantages and challenges in European context. Energies 2022, 15, 385. [Google Scholar] [CrossRef]
- Ferreira, C.S.S.; Seifollahi-Aghmiuni, S.; Destouni, G.; Ghajarnia, N.; Kalantari, Z. Soil degradation in the European Mediterranean region: Processes, status and consequences. Sci. Total Environ. 2022, 805, 150106. [Google Scholar] [CrossRef]
- Głąb, T.; Żabiński, A.; Sadowska, U.; Gondek, K.; Kopeć, M.; Mierzwa-Hersztek, M.; Tabor, S.; Stanek-Tarkowska, J. Fertilization effects of compost produced from maize, sewage sludge and biochar on soil water retention and chemical properties. Soil Tillage Res. 2020, 197, 104493. [Google Scholar] [CrossRef]
- Lal, R. Restoring Soil Quality to Mitigate Soil Degradation. Sustainability 2015, 7, 5875–5895. [Google Scholar] [CrossRef]
- Hussain, S.; Hussain, S.; Guo, R.; Sarwar, M.; Ren, X.; Krstic, D.; Aslam, Z.; Zulifqar, U.; Rauf, A.; Hano, C.; et al. Carbon sequestration to avoid soil degradation: A review on the role of conservation tillage. Plants 2021, 10, 2001. [Google Scholar] [CrossRef]
- Lal, R. Soil carbon sequestration to mitigate climate change. Geoderma 2004, 123, 1–22. [Google Scholar] [CrossRef]
- Lehman, R.M.; Cambardella, C.A.; Stott, D.E.; Acosta-Martinez, V.; Manter, D.K.; Buyer, J.S.; Maul, J.E.; Smith, J.L.; Collins, H.P.; Halvorson, J.J.; et al. Understanding and enhancing soil biological health: The solution for reversing soil degradation. Sustainability 2015, 7, 988–1027. [Google Scholar] [CrossRef]
- Lorenz, K.; Lal, R.; Ehlers, K. Soil organic carbon stock as an indicator for monitoring land and soil degradation in relation to United Nations’ Sustainable Development Goals. Land Degrad. Dev. 2019, 30, 824–838. [Google Scholar] [CrossRef]
- Körschens, M.; Albert, E.; Armbruster, M.; Barkusky, D.; Baumecker, M.; Behle-Schalk, L.; Bischoff, R.; Čergan, Z.; Ellmer, F.; Herbst, F.; et al. Effect of mineral and organic fertilization on crop yield, nitrogen uptake, carbon and nitrogen balances, as well as soil organic carbon content and dynamics: Results from 20 European long-term field experiments of the twenty-first century. Arch. Agron. Soil Sci. 2013, 59, 1017–1040. [Google Scholar] [CrossRef]
- Chatzistathis, T.; Papaioannou, E.; Giannakoula, A.; Papadakis, I.E. Zeolite and vermiculite as inorganic soil amendments modify shoot-root allocation, mineral nutrition, photosystem ii activity and gas exchange parameters of chestnut (Castanea sativa Mill) plants. Agronomy 2021, 11, 109. [Google Scholar] [CrossRef]
- Abiven, S.; Menasseri, S.; Chenu, C. The effects of organic inputs over time on soil aggregate stability. Soil Biol. Biochem. 2008, 41, 1–12. [Google Scholar] [CrossRef]
- Diacono, M.; Montemurro, F. Long-term effects of organic amendments on soil fertility. A review. Agron. Sustain. Dev. 2010, 30, 401–422. [Google Scholar] [CrossRef]
- Clouard, M.; Criquet, S.; Borschneck, D.; Ziarelli, F.; Marzaioli, F.; Balesdent, J.; Keller, C. Impact of lignite on pedogenetic processes and microbial functions in Mediterranean soils. Geoderma 2014, 232–234, 257–269. [Google Scholar] [CrossRef]
- Paramashivam, D.; Clough, T.J.; Carlton, A.; Gough, K.; Dickinson, N.; Horswell, J.; Sherlock, R.R.; Clucas, L.; Robinson, B.H. The effect of lignite on nitrogen mobility in a low-fertility soil amended with biosolids and urea. Sci. Total Environ. 2015, 543 Pt A, 601–608. [Google Scholar] [CrossRef]
- Ciarkowska, K.; Sołek-Podwika, K.; Filipek-Mazur, B.; Tabak, M. Comparative effects of lignite-derived humic acids and FYM on soil properties and vegetable yield. Geoderma 2017, 303, 85–92. [Google Scholar] [CrossRef]
- Arjumend, T.; Abbasi, M.K.; Rafique, E. Effects of lignite-derived humic acid on some selected soil properties, growth and nutrient uptake of wheat (Triticum aestivum L.) grown under greenhouse conditions. Pak. J. Bot. 2015, 47, 2231–2238. [Google Scholar]
- Akimbekov, N.; Qiao, X.; Digel, I.; Abdieva, G.; Ualieva, P.; Zhubanova, A. The effect of leonardite-derived amendments on soil microbiome structure and potato yield. Agriculture 2020, 10, 147. [Google Scholar] [CrossRef]
- Mukherjee, A.; Lal, R. Biochar impacts on soil physical properties and greenhouse gas emissions. Agronomy 2013, 3, 313–339. [Google Scholar] [CrossRef]
- Herath, H.M.S.K.; Camps-Arbestain, M.; Hedley, M. Effect of biochar on soil physical properties in two contrasting soils: An Alfisol and an Andisol. Geoderma 2013, 209–210, 188–197. [Google Scholar] [CrossRef]
- Głąb, T.; Palmowska, J.; Zaleski, T.; Gondek, K. Effect of biochar application on soil hydrological properties and physical quality of sandy soil. Geoderma 2016, 281, 11–20. [Google Scholar] [CrossRef]
- Zhu, X.; Chen, B.; Zhu, L.; Xing, B. Effects and mechanisms of biochar-microbe interactions in soil improvement and pollution remediation: A review. Environ. Pollut. 2017, 227, 98–115. [Google Scholar] [CrossRef] [PubMed]
- Kavitha, B.; Reddy, P.V.L.; Kim, B.; Lee, S.S.; Pandey, S.K.; Kim, K.H. Benefits and limitations of biochar amendment in agricultural soils: A review. J. Environ. Manag. 2018, 227, 146–154. [Google Scholar] [CrossRef] [PubMed]
- Vinci, G.; Rapa, M. Hydroponic cultivation: Life cycle assessment of substrate choice. Br. Food J. 2019, 121, 1801–1812. [Google Scholar] [CrossRef]
- Commission of the European Communities (CEC). Communication from the Commission to the Council, the European Parliament, the European Economic and Social Committee and the Committee of the Regions. EU Biodiversity Strategy for 2030 Bringing Nature Back into our Lives; COM 380 Final; European Commission: Brussels, Belgium, 2020. [Google Scholar]
- Pal, D.K. Organic carbon sequestration and ecosystem service of Indian tropical soils. In Ecosystem Services and Tropical Soils of India; Springer: Cham, Switzerland, 2019. [Google Scholar] [CrossRef]
- Głąb, T.; Gondek, K.; Mierzwa–Hersztek, M. Biological effects of biochar and zeolite used for remediation of soil contaminated with toxic heavy metals. Sci. Rep. 2021, 11, 6998. [Google Scholar] [CrossRef] [PubMed]
- Zhang, F.B.; Xu, P.Z.; Tang, S.H.; Chen, J.S.; Xie, K.Z.; Huang, X. Effects of chemical fertilizer and composts produced from chicken, swine and cattle manures on yields and quality of leaf vegetables. Chin. Agric. Sci. Bull. 2008, 24, 283–286. [Google Scholar]
- Luo, G.; Li, L.; Friman, V.-P.; Guo, J.; Guo, S.; Shen, Q.; Ling, N. Organic amendments increase crop yields by improving microbe-mediated soil functioning of agroecosystems: A meta-analysis. Soil Biol. Biochem. 2018, 124, 105–115. [Google Scholar] [CrossRef]
- Smucker, A.J.M.; McBurney, S.L.; Srivastava, A.K. Quantitative separation of roots from compacted soil profiles by the hydropneumatic elutriation system. Agron. J. 1982, 74, 500–503. [Google Scholar] [CrossRef]
- Bauhus, J.; Messier, C. Evaluation of fine root length and diameter measurements obtained using RHIZO image analysis. Agron. J. 1999, 91, 142–147. [Google Scholar] [CrossRef]
- Głąb, T.; Gondek, K.; Mierzwa-Hersztek, M. Pyrolysis improves the effect of straw amendment on the productivity of perennial ryegrass (Lolium perenne L.). Agronomy 2020, 10, 1455. [Google Scholar] [CrossRef]
- Klute, A.; Dirksen, C. Water retention. Laboratory methods. In Methods of Soil Analysis. Part 1. Physical and Mineralogical Methods; SSSA Book, Series; Klute, A., Ed.; Wiley: Hoboken, NJ, USA, 1986; Volume 9, pp. 663–686. [Google Scholar]
- Van Genuchten, M.T. A closed-form equation for predicting the hydraulic conductivity of unsaturated soils. Soil Sci. Soc. Am. J. 1980, 44, 892–898. [Google Scholar] [CrossRef]
- Mualem, Y. Hydraulic conductivity of unsaturated soils: Prediction and formulas. In Methods of Soil Analysis. Part 1. Physical and Mineralogical Methods; SSSA Book, Series; Klute, A., Ed.; Wiley: Hoboken, NJ, USA, 1986; Volume 9, pp. 799–823. [Google Scholar]
- Reynolds, W.D.; Drury, C.F.; Yang, X.M.; Tan, C.S. Optimal soil physical quality inferred through structural regression and parameter interactions. Geoderma 2008, 146, 466–474. [Google Scholar] [CrossRef]
- Dexter, A.R. Soil physical quality: Part I. Theory, effects of soil texture, density, and organic matter, and effects on root growth. Geoderma 2004, 120, 201–214. [Google Scholar] [CrossRef]
- Ahuja, L.R.; Fiedler, F.; Dunn, G.H.; Benjamin, J.G.; Garrison, A. Changes in soil water retention curves due to tillage and natural reconsolidation. Soil Sci. Soc. Am. J. 1998, 62, 1228–1233. [Google Scholar] [CrossRef]
- Greenland, D.J. Soil management and soil degradation. J. Soil Sci. 1981, 32, 301–322. [Google Scholar] [CrossRef]
- Hargreaves, J.C.; Adl, M.S.; Warman, P.R. A review of the use of composted municipal solid waste in agriculture. Agric. Ecosyst. Environ. 2008, 123, 1–14. [Google Scholar] [CrossRef]
- Günal, E.; Erdem, H.; Çelik, I. Effects of three different biochars amendment on water retention of silty loam and loamy soils. Agric. Water Manag. 2018, 208, 232–244. [Google Scholar] [CrossRef]
- Głąb, T.; Żabiński, A.; Sadowska, U.; Gondek, K.; Kopeć, M.; Mierzwa–Hersztek, M.; Tabor, S. Effects of co-composted maize, sewage sludge, and biochar mixtures on hydrological and physical qualities of sandy soil. Geoderma 2018, 315, 27–35. [Google Scholar] [CrossRef]
- Głąb, T.; Zaleski, T.; Erhart, E.; Hartl, W. Effect of biowaste compost and nitrogen fertilization on macroporosity and biopores of Molli-gleyic Fluvisol soil. Int. Agrophys. 2008, 22, 303–311. [Google Scholar]
- Zaleski, T.; Kopeć, M. The influence of long-term fertilization on the water retention of the mountain meadow. In Proceedings of the 11th Lysimetertagung‚ Lysimetrie im Netzwerk der Dynamik von Oekosystemen, BAL, Gumpenstein, Austria, 29–30 April 2003; pp. 237–238. [Google Scholar]
- Głąb, T.; Gondek, K. The influence of soil compaction and N fertilization on physico-chemical properties of Mollic Fluvisol soil under red clover/grass mixture. Geoderma 2014, 226–227, 204–212. [Google Scholar] [CrossRef]
- Paluszek, J. Criteria of evaluation of physical quality of Polish arable soils. Acta Agrophys. 2011, 191, 1–139. [Google Scholar]
- Reynolds, W.D.; Drury, C.F.; Tan, C.S.; Fox, C.A.; Yang, X.M. Use of indicators and pore volume-function characteristics to quantify soil physical quality. Geoderma 2009, 152, 252–263. [Google Scholar] [CrossRef]
- Pranagal, J.; Podstawka-Chmielewska, E. Physical properties of a Rendzic Phaeozem during a ten-year period of fallowing under the conditions of south-eastern Poland. Geoderma 2012, 189, 262–267. [Google Scholar] [CrossRef]
- Farhangi-Abriz, S.; Nikpour-Rashidabad, N. Effect of lignite on alleviation of salt toxicity in soybean (Glycine max L.) plants. Plant Physiol. Biochem. 2017, 120, 186–193. [Google Scholar] [CrossRef] [PubMed]
- Li, C.; Xiong, Y.; Zou, J.; Dong, L.; Ren, P.; Huang, G. Impact of biochar and lignite-based amendments on microbial communities and greenhouse gas emissions from agricultural soil. Vadose Zone J. 2021, 20, e20105. [Google Scholar] [CrossRef]
- Tran, C.K.T.; Rose, M.T.; Cavagnaro, T.R.; Patti, A.F. Lignite amendment has limited impacts on soil microbial communities and mineral nitrogen availability. Appl. Soil Ecol. 2015, 95, 140–150. [Google Scholar] [CrossRef]
- Kołodziej, B.; Bryk, M.; Otremba, K. Effect of rockwool and lignite dust on physical state of rehabilitated post-mining soil. Soil Tillage Res. 2020, 199, 104603. [Google Scholar] [CrossRef]
- Shaykewich, J.A. Impact of Leonardite Amendments on Soil Physical Properties of Two Soils Related to Grain Production. Master’s Thesis, University of Manitoba, Winnipeg, MB, Canada, 2000. [Google Scholar]
- Atkinson, C.J.; Fitzgerald, J.D.; Hipps, N.A. Potential mechanisms for achieving agricultural benefits from biochar application to temperate soils: A review. Plant Soil 2010, 337, 1–18. [Google Scholar] [CrossRef]
- Koyama, S.; Urayama, H.; Karunaratne, K.M.P.D.; Yamashita, T. Effects of coir application on soil properties and cucumber production as a reuse model of organic medium used in soilless culture. Trop. Agric. Dev. 2009, 53, 7–13. [Google Scholar] [CrossRef]
- Hongpakdee, P.; Ruamrungsri, S. Water use efficiency, nutrient leaching, and growth in potted marigolds affected by coconut coir dust amended in substrate media. Hortic. Environ. Biotechnol. 2015, 56, 27–35. [Google Scholar] [CrossRef]
- McCarthy, M.C.; Enquist, B.J. Consistency between an allometric approach and optimal partitioning theory in global patterns of plant biomass allocation. Funct. Ecol. 2007, 21, 713–720. [Google Scholar] [CrossRef]
- Głąb, T.; Gondek, K.; Mierzwa-Hersztek, M.; Szewczyk, W. Effects of straw and biochar amendments on grassland productivity and root morphology. Agronomy 2020, 10, 1794. [Google Scholar] [CrossRef]
- Sariyildiz, T. Effects of leonardite and mineral fertilizer applications on plant growth and soil quality of garlic (Allium sativum L.). Turk. J. Agric. Food Sci. Technol. 2020, 8, 1763–1772. [Google Scholar] [CrossRef]
- Akinremi, O.O.; Janzen, H.H.; Lemke, R.L.; Larney, F.J. Response of canola, wheat and green beans to leonardite additions. Can. J. Soil Sci. 2000, 80, 437–443. [Google Scholar] [CrossRef]
- Kaya, C.; Şenbayram, M.; Akram, N.A.; Ashraf, M.; Alyemeni, M.N.; Ahmad, P. Sulfur-enriched leonardite and humic acid soil amendments enhance tolerance to drought and phosphorus deficiency stress in maize (Zea mays L.). Sci. Rep. 2020, 10, 6432. [Google Scholar] [CrossRef] [PubMed]
- Amoah-Antwi, C.; Kwiatkowska-Malina, J.; Thornton, S.F.; Fenton, O.; Malina, G.; Szara, E. Restoration of soil quality using biochar and brown coal waste: A review. Sci. Total Environ. 2020, 722, 137852. [Google Scholar] [CrossRef] [PubMed]
- Chen, Z.; Li, Y.; Zhang, X.; Xiong, Y.; Huang, Q.; Jin, S.; Sun, S.; Chi, D.; Huang, G. Effects of lignite bioorganic product on sunflower growth, water and nitrogen productivity in saline-sodic farmlands at Northwest China. Agric. Water Manag. 2022, 271, 107806. [Google Scholar] [CrossRef]
- Baumann, K.; Schneider, B.; Marschner, P.; Huttl, R.F. Root distribution and nutrient status of mycorrhizal and non-mycorrhizal Pinus sylvestris L. Seedlings growing in a sandy substrate with lignite fragments. Plant Soil 2005, 276, 347–357. [Google Scholar] [CrossRef]
- Ehsani, S.M.; Niknahad-Gharmakher, H.; Motamedi, J.; Akbarlou, M.; Sheidai-Karkaj, E. The impact of lignite and wheat straw biochar application on structural traits of pot-grown Nitraria schoberi L. and soil properties. J. Soil Sci. Plant Nutr. 2021, 21, 1191–1200. [Google Scholar] [CrossRef]
- Prendergast-Miller, M.T.; Duvall, M.; Sohi, S.P. Biochar–root interactions are mediated by biochar nutrient content and impacts on soil nutrient availability. Eur. J. Soil Sci. 2014, 65, 173–185. [Google Scholar] [CrossRef]
- Xiang, Y.; Deng, Q.; Duan, H.; Guo, Y. Effects of biochar application on root traits: A meta-analysis. GCB Bioenergy 2017, 9, 1563–1572. [Google Scholar] [CrossRef]
- Reibe, K.; Götz, K.P.; Roß, C.L.; Döring, T.F.; Ellmer, F.; Ruess, L. Impact of quality and quantity of biochar and hydrochar on soil Collembola and growth of spring wheat. Soil Biol. Biochem. 2015, 83, 84–87. [Google Scholar] [CrossRef]
- Oram, N.J.; van de Voorde, T.F.J.; Ouwehand, G.J.; Bezemer, T.M.; Mommer, L.; Jeffery, S.; Van Groenigen, J.W. Soil amendment with biochar increases the competitive ability of legumes via increased potassium availability. Agric. Ecosyst. Environ. 2014, 191, 92–98. [Google Scholar] [CrossRef]
- Vanek, S.J.; Lehmann, J. Phosphorus availability to beans via interactions between mycorrhizas and biochar. Plant Soil 2015, 395, 105–123. [Google Scholar] [CrossRef]
- Olmo, M.; Villar, R.; Salazar, P.; Alburquerque, J.A. Changes in soil nutrient availability explain biochar’s impact on wheat root development. Plant Soil 2016, 399, 333–343. [Google Scholar] [CrossRef]
- Alburquerque, J.A.; Cabello, M.; Avelino, R.; Barrón, V.; del Campillo, M.C.; Torrent, J. Plant growth responses to biochar amendment of Mediterranean soils deficient in iron and phosphorus. J. Plant Nutr. Soil Sci. 2015, 178, 567–575. [Google Scholar] [CrossRef]
- Agbna, G.; Ali, A.; Bashir, A.; Eltoum, F.; Hassan, M. Influence of biochar amendment on soil water characteristics and crop growth enhancement under salinity stress. Int. J. Eng. Work. 2017, 4, 49–53. [Google Scholar] [CrossRef]
- Erktan, A.; Or, D.; Scheu, S. The physical structure of soil: Determinant and consequence of trophic interactions. Soil Biol. Biochem. 2020, 148, 107876. [Google Scholar] [CrossRef]
Disclaimer/Publisher’s Note: The statements, opinions and data contained in all publications are solely those of the individual author(s) and contributor(s) and not of MDPI and/or the editor(s). MDPI and/or the editor(s) disclaim responsibility for any injury to people or property resulting from any ideas, methods, instructions or products referred to in the content. |
© 2024 by the authors. Licensee MDPI, Basel, Switzerland. This article is an open access article distributed under the terms and conditions of the Creative Commons Attribution (CC BY) license (https://creativecommons.org/licenses/by/4.0/).