Article

Analysis of Film Unloading Mechanism and Parameter Optimization of Air Suction-Type Cotton Plough Residual Film Recovery Machine Based on CFD—DEM Coupling

1
School of Agricultural Engineering, Jiangsu University, Zhenjiang 212013, China
2
School of Mechanical Engineering, Jiangsu University, Zhenjiang 212013, China
*
Author to whom correspondence should be addressed.
Agriculture 2024, 14(7), 1021; https://doi.org/10.3390/agriculture14071021
Submission received: 13 May 2024 / Revised: 7 June 2024 / Accepted: 25 June 2024 / Published: 27 June 2024
(This article belongs to the Section Agricultural Technology)

Abstract

:
The optimization of film-unloading and film–soil separation components can effectively improve the residual film unloading rate and reduce impurity content. So, the DEM models of soil and residual film were established and the suspension and flow characteristics under fluid action were analyzed based on the CFD—DEM coupling simulation in this article. The matching parameters of the film-unloading and film-lifting device were optimized with the Box–Behnken test. When the wind velocity was between 1.65 and 10.54 m · s 1 , the film–soil separation effect was the best, with a film–impurity separation rate of 96.6%. The optimized parameter combination of the film-unloading device and film-lifting device is A = 9°, B = 40 mm, and C = 40 mm (A, B, and C represent the angle between the teeth and the normal of the air inlet, the minimum distance between the teeth and the air inlet, and the width of the air inlet, respectively). With the optimized parameter, the best film unloading effect is achieved, the minimum wind velocity of film unloading is 2.6 m · s 1 . This article provides theoretical and simulation methods for assessing the flow characteristics of flexible particles and parameter optimization of air suction devices, which is conducive to the high-purity recovery of residual film.

1. Introduction

The use of plastic film can effectively improve the planting effect of cotton, but also causes residual film pollution [1]. The use of pneumatic film unloading can effectively remove impurities and reduce design costs. The air suction film unloading method can reduce the coordination and transmission between mechanical components; efficient film unloading can be achieved within the appropriate range of wind velocity. The suspension velocity of residual film and soil needs to be obtained to better optimize the parameters of the air suction device. However, there is lack of complete research on theoretical analysis, simulation tests, and validation tests of pneumatic film unloading. Therefore, it is urgent to study the suspension characteristics of residual film–soil and the analysis of pneumatic film-unloading devices for film unloading.
When using pneumatic conveying, the velocity of the airflow has the greatest impact on the conveying effect [2,3,4]. The analysis of the impact of airflow on particle flow performance can significantly improve the separation between different particle components [5,6]. The forward velocity, rotational velocity, and particle diameter of gas conveying are common parameters that affect the energy consumption and design of pneumatic conveying systems under aerodynamics. A CFD—DEM coupling simulation can be used to effectively analyze these parameters [7,8], it can also be used to simulate the movement of particles in the flow field [9,10,11,12,13,14]. During pneumatic conveying device designing, the use of reasonable minimum airflow velocity can achieve both energy-saving and good conveying effects [15]. Recently, the CFD—DEM coupling simulation has been used for material pneumatic separation and parameter optimization analysis of pneumatic separation devices. For example, the suspension velocities of linseed, capsule, short stem, and capsule shell were measured by the CFD—DEM coupling simulation, and the accuracy of the simulation results was verified with experiments [16,17]. The CFD—DEM coupling simulation was used to simulate the separation of various components of flax threshing material, and the simulation and test results were compared and analyzed [18,19]. The wind velocity required for different materials to reach a suspended state varies [20]. Therefore, materials with different suspension characteristics are suitable for using pneumatic separation for material separation [21,22]. Based on this, the separation of flax and impurities can be analyzed to optimize the parameters of the gas suction separation device [23,24,25,26,27]; for example, an air suction jujube picker was designed, and the suction generated by a centrifugal fan was utilized to pick up red dates [28,29,30]. There is a significant difference in the material characteristics between residual film and soil, with a small density and large windward area of residual film, while the particles of soil and other debris are relatively small and have a high density. During a DEM simulation, flexible particles (such as residual films) can be established through bonds between particles [31,32,33,34,35]. Therefore, the separation of residual film and soil can be simulated using CFD—DEM [36,37]. The CFD—DEM coupling simulation can be used to predict the optimization effect of mechanical components by observing the flow characteristics of particles [38,39]. For example, the parameter optimization of a corn kernel cleaning device resulted in a cleaning rate of 98.47% for corn kernels [40]. Therefore, the use of air suction for film unloading and film–impurity separation can achieve good results.
In this paper, theoretical research and simulation analysis of residual film and soil suspension characteristics were carried out, and a CFD—DEM coupling simulation model of film–impurity separation was established. The reliability of the analysis of residual film and soil suspension characteristics was verified through experiments, and it was confirmed that the established simulation model and parameters can be used for subsequent analysis of film unloading simulation models. After analyzing the suspension characteristics of materials, a simulation model for film unloading was established. Box– Behnken simulation experiments were conducted to optimize the parameters of the air suction film unloading device. An experimental verification of the optimized film-unloading device was conducted to verify the reliability of the designed film-unloading device.

2. Materials and Methods

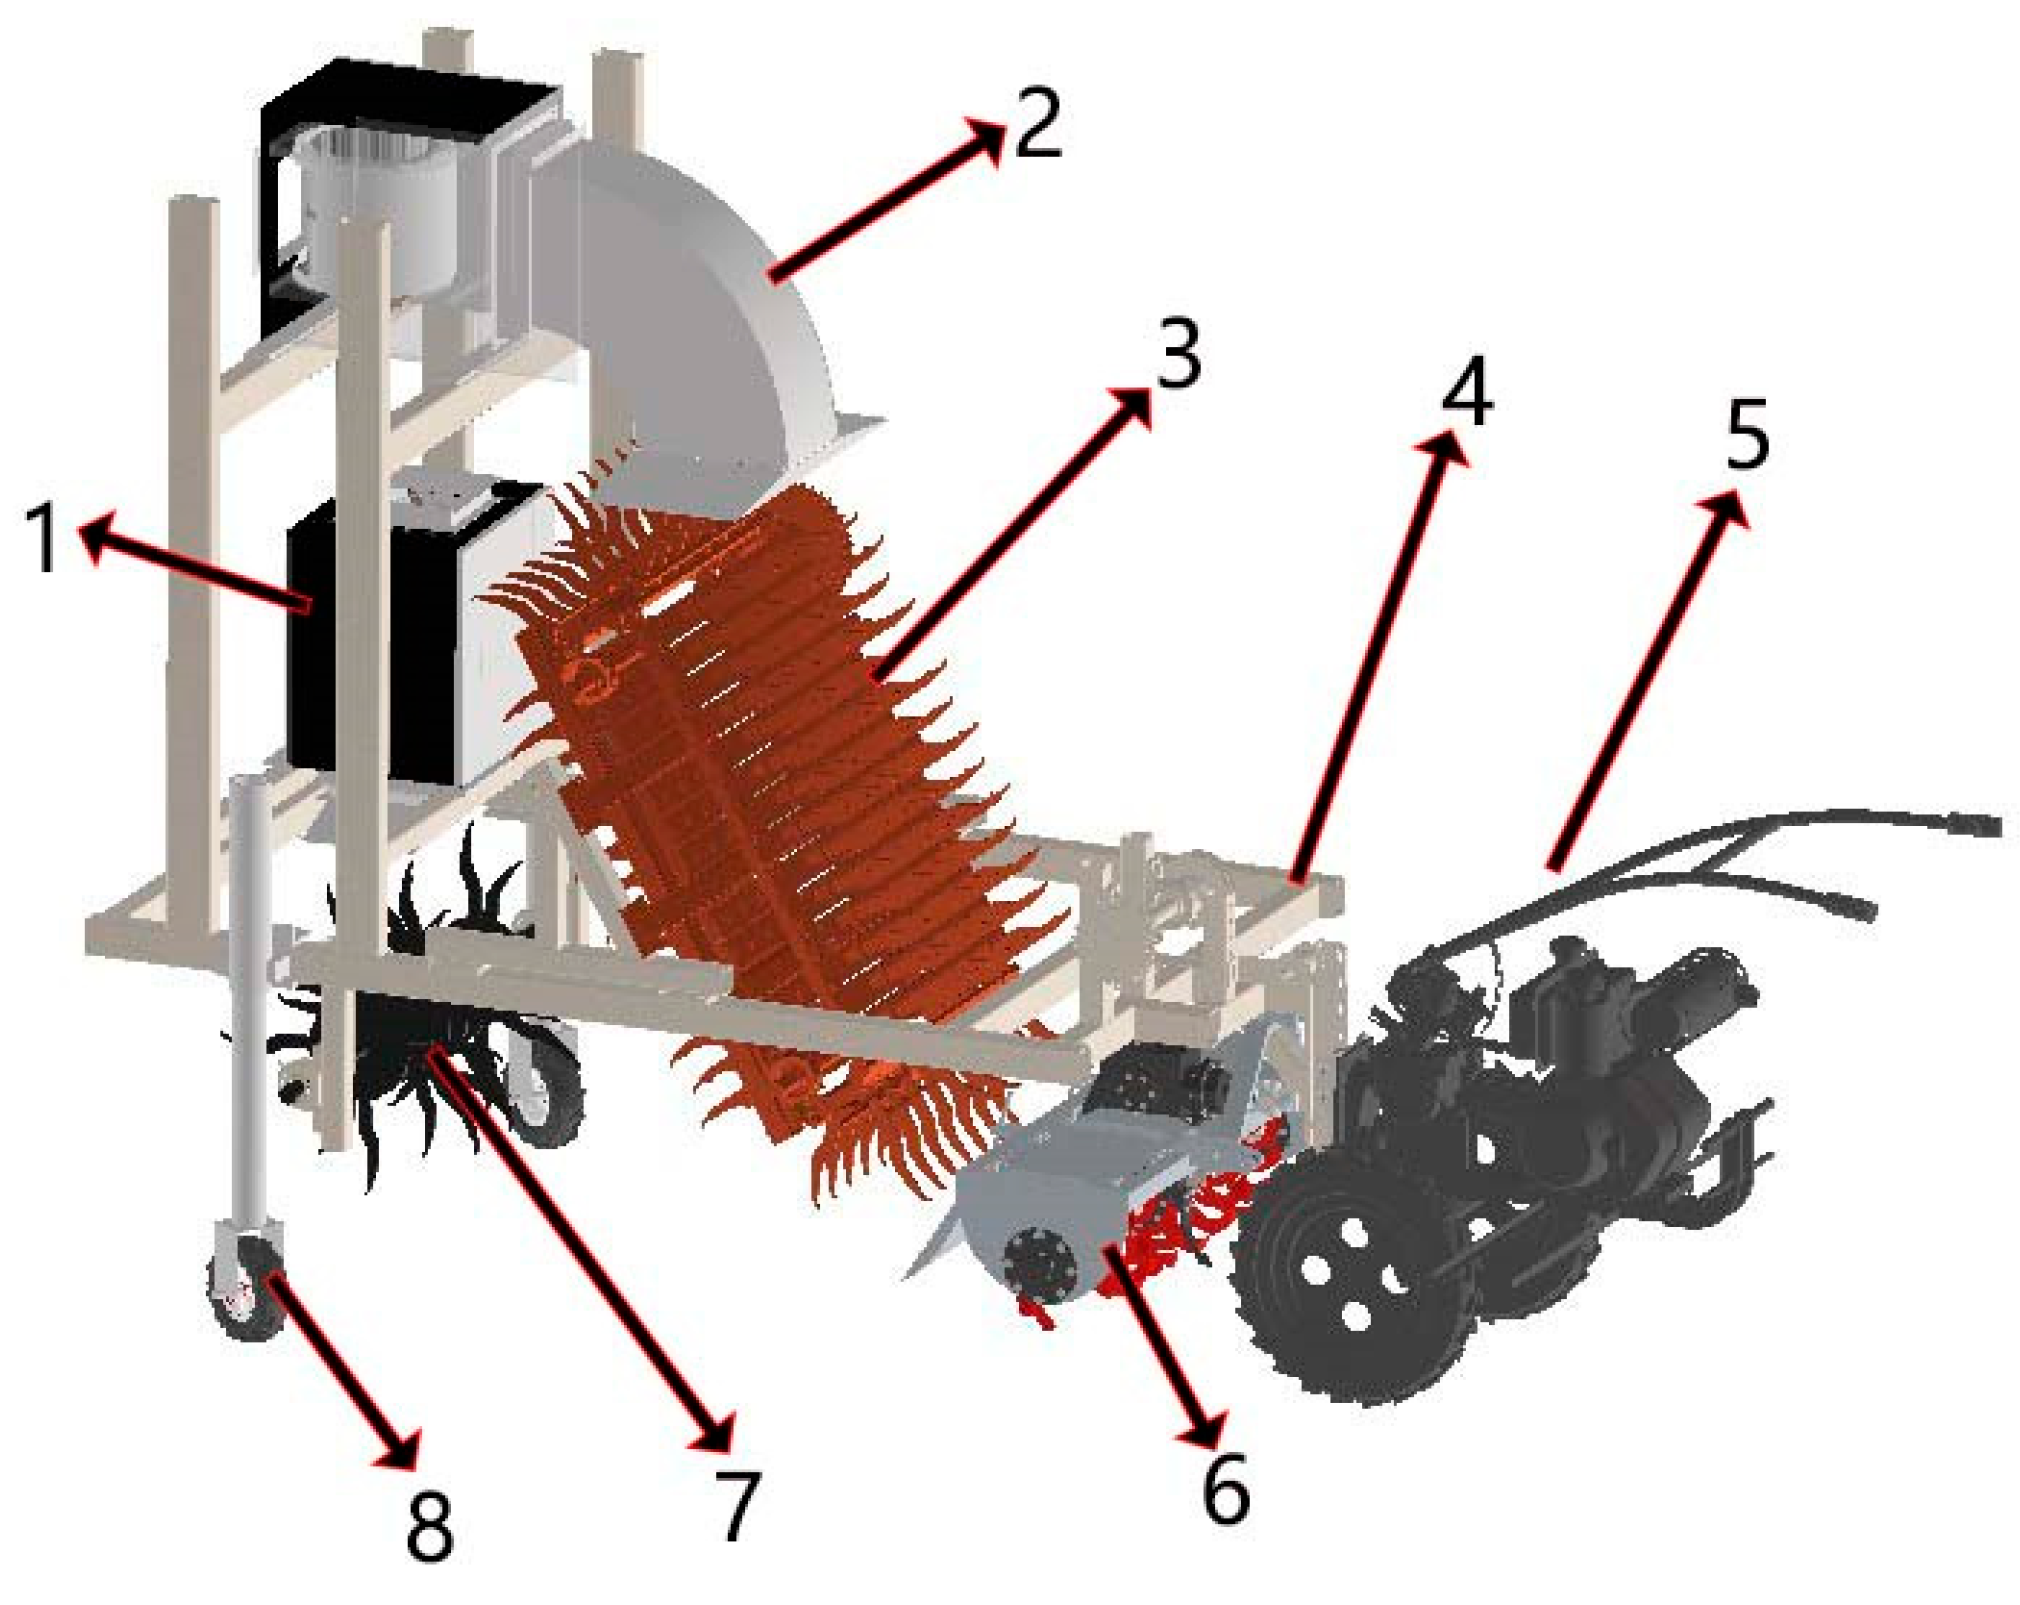
2.1. Design of Air Suction and Film-Lifting Devices

The key part of the cultivation layer of a residual film recycling machine consists of the parts shown in Figure 1. This article focuses on the research of the air suction and film-unloading components, key components required for the research, which are shown in Figure 2. The residual film is lifted from the film-lifting tine to the air inlet, and the air suction device sucks the residual film into the air inlet, ultimately reaching the film collection device. This article does not involve the film picking part, so the film picking part was simplified as tine assembly, and the conveyor chain and installation bracket that do not affect the analysis were omitted, only reflecting the key tine device and air suction device analyzed in this article. The velocity of the variable velocity motor can be adjusted through a frequency converter to adapt to the testing of suspension characteristics and film unloading and cleaning characteristics. There are three factors that affect the unloading effect of the air suction film-unloading device, namely A (the angle between the teeth and the normal of the air inlet), B (the air inlet, and the width of the air inlet), and C (the minimum distance between the teeth), which are marked in Figure 2b.

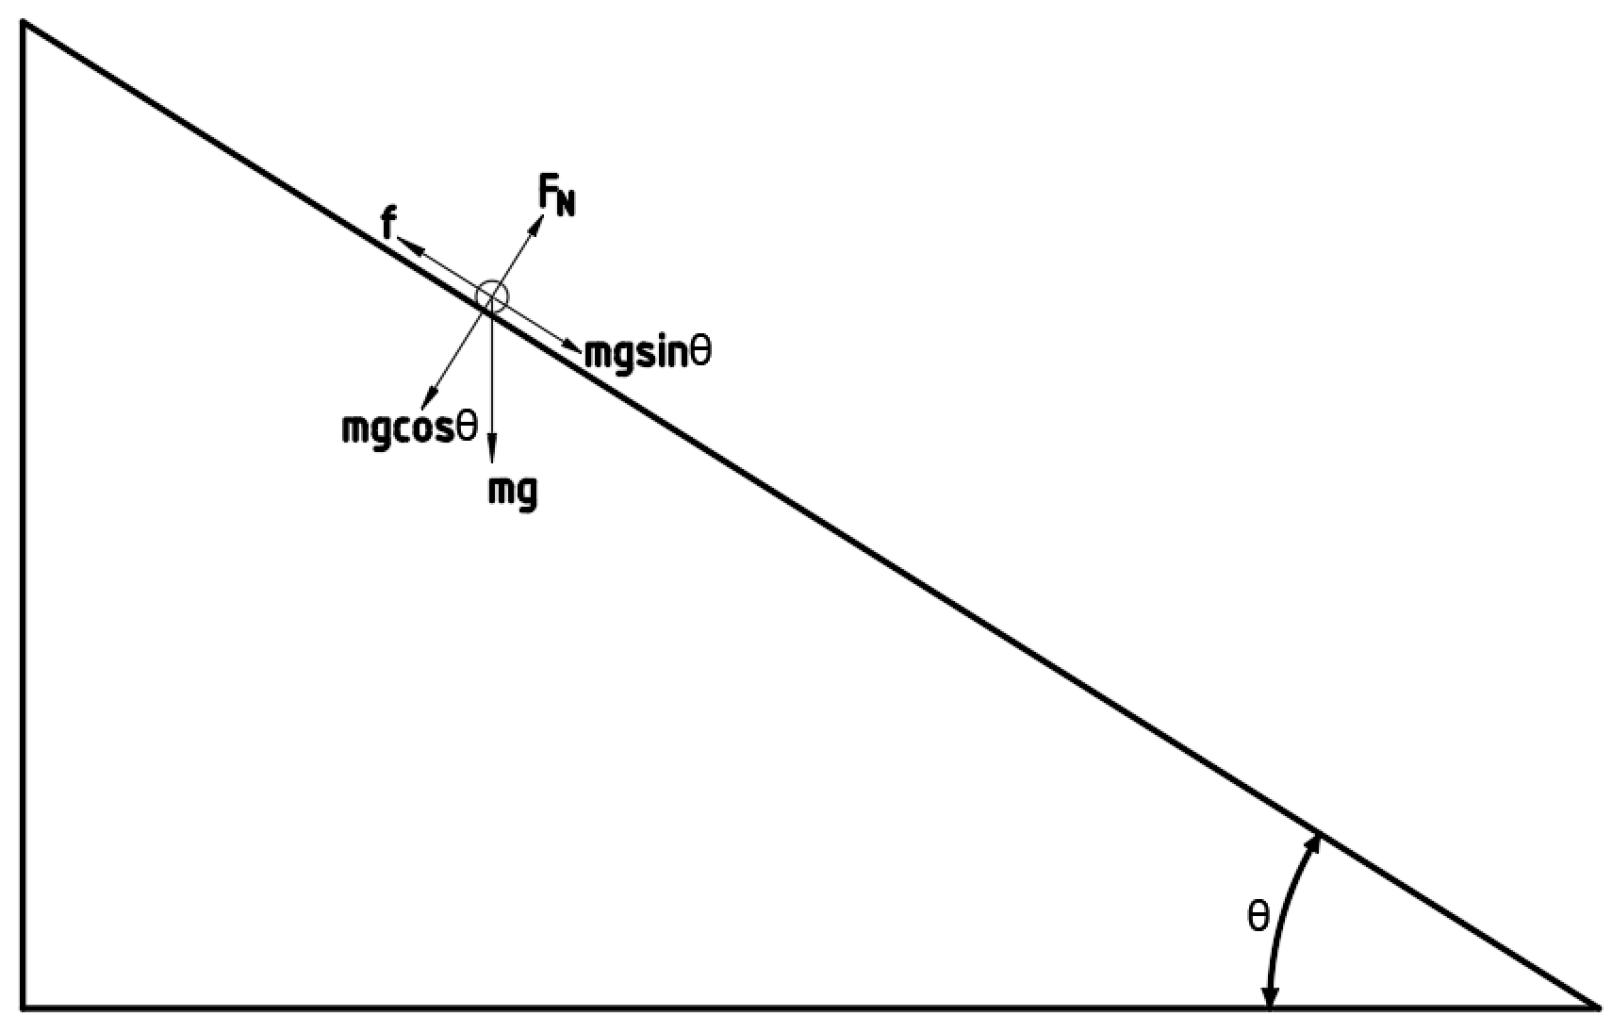
2.2. Calculation of Residual Film Suspended Velocity and Force Analysis of Residual Film at the Suction Port

The separation of residual film and soil involves the suspension characteristics of both, and the calculation formula for suspension velocity is shown in Equations (1)–(3) [41].
G m = F a + F m f F a = 1 2 C a ρ a S m v m f 2
v m f = 2 ( G m F f ) C a ρ a S m
G m = ρ m r 1 r 2 h g F m f = r 1 r 2 h ρ q g S m = r 1 r 2
v m f = 2 h S m g × ( ρ m ρ q ) C q ρ q S m = k r 2 h g × ( ρ m ρ a ) C q ρ q
F t = u ρ m g S m h cos α
F y = F a + F m f G m F t cos α sin α
v n a = 2 h S m g × ( ρ m + μ m sin α cos α ρ a ) C q ρ q S m
where the following are defined: G m —residual film gravity, N; F a —material air drag force, N; F m f —material air buoyancy, N; C a —air resistance coefficient (0.75); ρ a —air density ( 1.21   k g · m 3 ); S m —actual windward area of residual film, m 2 ; v m f —suspension velocity, m · s 1 ; ρ m —residual film density, ( 0.915 × 10 3   k g · m 3 ) ; r 1 —residual film length, m; r 2 —residual film width, m; h—residual film thickness, 1.5 × 10 5 m; g —gravitational acceleration, 9.81   m · s 2 ;   S m —theoretical windward area of residual film, m 2 ;   F t —the component of frictional force acting on the tine in the vertical direction, N; F y —the combined force on the residual film in the vertical direction, N; v n a —minimum wind velocity for film unloading, m · s 1 ; u —static friction coefficient between tine and residual film, 0.45; and α —the angle between the tangent line of the tine and the horizontal direction. The angle between the normal and horizontal lines in this article is 60° [40].
The suction zone refers to the area where negative-pressure airflow is generated between the suction port and the tine. The minimum film unloading wind velocity is calculated as shown in Equations (4)–(7); mechanical analysis is shown in Figure 3 [42]. The minimum film unloading wind velocity calculated is 0.94   m · s 1 v n m 5.18   m · s 1 . This parameter serves as the basic validation parameter for simulation and testing. During simulation and testing, the shape of the residual film in the wind field will change, so the required wind velocity for film unloading during the simulation and testing process is within the theoretical calculation range.
The residual film is a flexible object that will be in a curly state in the wind. The windward area of the residual film is often much smaller than the actual area of the residual film, so k r = S m / S m is the correction coefficient (the ratio of the theoretical windward area of the residual film to the actual windward area is 0.1~0.8, so S m S m = 1.11 ~ 3.16 ). The minimum suspension velocity of the residual film calculated is 0.60~1.72 m · s 1 .

2.3. Determination of Basic Parameters for CFD—DEM Simulation

2.3.1. Measurement of Simulation Parameters Related to Residual Film and Soil

(1)
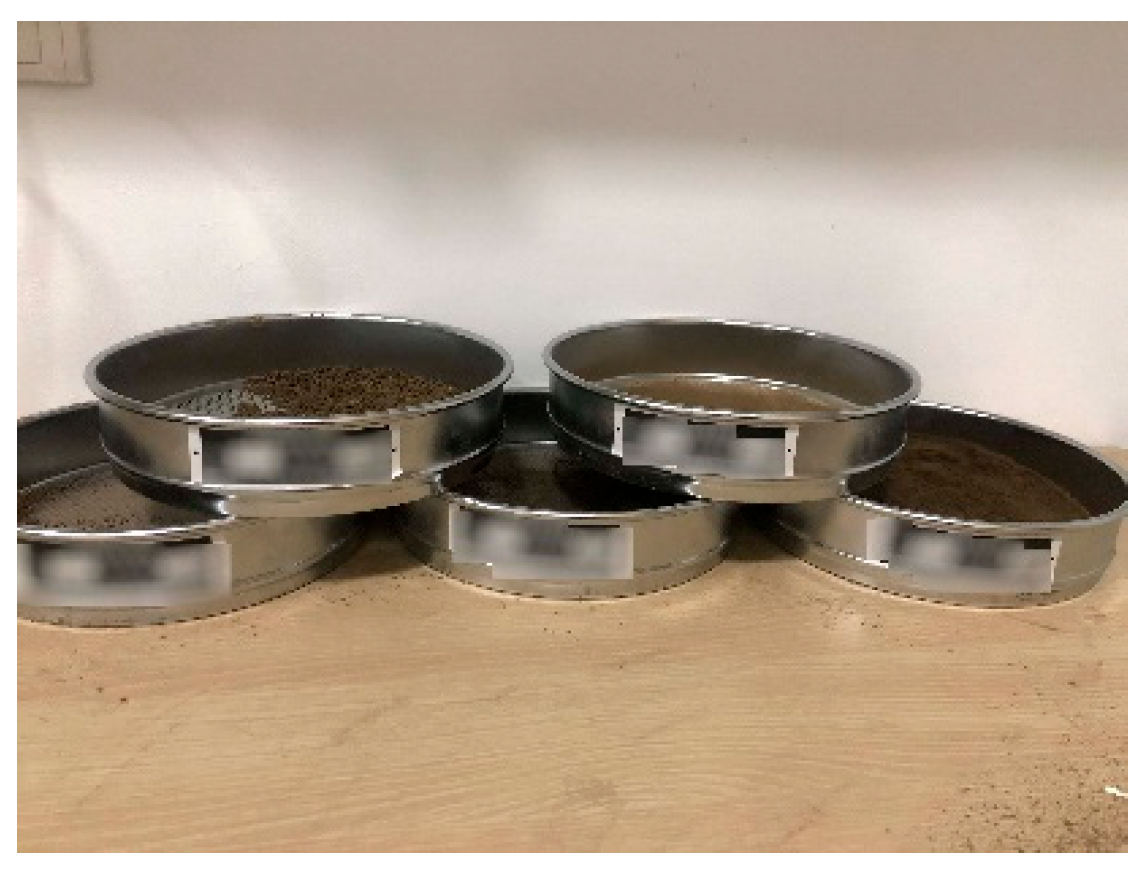
Particle density and granularity measurement
The soil samples were taken from Tacheng Prefecture, Xinjiang, and were sandy soil. Soil samples were obtained from cotton fields within a depth range of 0–15 cm by a five-point sampling method. The soil samples were divided into five parts for storage. The soil moisture was measured during sampling. During each measurement, a dedicated soil temperature and humidity measuring sensor was used for humidity measurement, with a soil moisture content of 9.2%. Under this humidity condition, soil density was measured five times using a ring knife (100 c m 3 ) and a high-precision balance (0.01 g). The average value of 1.61 g · c m 3 was taken as the sample density value. The national standard soil sieves (0.075 mm, 0.25 mm, 0.5 mm, 1 mm, and 2 mm) were used to screen the soil granularity five times (see Figure 4), and the average value was taken to obtain the percentage of each particle size, as shown in Table 1.
(2)
Inherent parameters of residual film and soil
Residual film density is 0.915 × 10 3   k g · m 3 [36]. The Poisson’s ratio and shear modulus of the residual film were measured through the tensile testing [43]. The measurement results of the intrinsic parameters of the soil and residual film are shown in Table 2 [44]. The static friction coefficient between residual film and steel was measured by the inclined plane method, and the result obtained is 0.45 (the principle is shown as Figure 5). Due to the small correlation between other parameters and this study, a detailed description will not be provided here. As shown in Figure 6, the accuracy of residual film parameters was verified by comparing the simulated and experimental values of the stacking angle of residual film particles (the simulation stacking angle is 43° and the actual test stacking angle is 43.7°); the contact parameters of residual film–soil–tooth are shown in Table 3 [45].

2.3.2. Obtaining Soil Content and Statistics of Residual Film Area in the Cultivated Layer

The five-point sampling method was used to measure the residual film content in the topsoil of cotton fields. The length, width, and height of each sampling point were 1 m, 1 m, and 0.15 m, respectively (see Figure 7). The excavated residual film–soil mixture was screened at each sampling point to obtain the fragmented residual film contained in the soil, and then the residual film sample was cleaned and air dried, and its weight was measured. An electronic measuring instrument with an accuracy of 0.01 g was used to measure the residual film mass, and the average value was taken as the residual film content per unit volume. The obtained residual film was statistically analyzed using python-opencv image processing technology, and over 95% of the residual film area was 25 ~ 80   c m 2 . The residual film area was taken as 25   c m 2 , and it was regularized into a square, such as a square film with a side length of 5 cm.

2.4. Test Method for Film–Soil Suspension Velocity and Film–Impurity Separation

2.4.1. Simulation and Experimental Methods for Material Properties

During simulation, the inlet was set as the pressure inlet and the outlet was set as the velocity outlet. The specific value of the outlet velocity was adjusted according to the required wind velocity during simulation. In EDEM, the first step is to establish a particle factory to produce soil and residual film particles, and a result file was outputted in “. dem” format. The start time of the output file was set to 0 s. The output file was opened using EDEM and clicking on “Simulator settings”. The time step was set to 2 × 10 5 s and the grid size to “3R” (can be increased appropriately to reduce calculation time). When the EDEM parameters have been set, “coupling server” should be clicked and Fluent should be opened to set the coupling “API” interface. In Fluent, during meshing, 1 mm was set as the maximum size of the grid. After completing the regular parameter settings, the time step of was set as 0.001 s. After clicking “start calculation”, EDEM will perform calculations simultaneously.
The wind velocity instrument was placed at the air inlet, and the centrifugal fan air volume was adjusted continuously, until the air velocity at the inlet was near to the suspension velocity of the residual film in the simulation. During the experiment, the wind velocity was adjusted from 1 m · s 1 , until the residual film was in an upward state. The actual suspension velocity of the residual film in an upward state is the suspension velocity. The experiment was repeated 5 times and the average value was taken. The experimental results were compared with the simulation results for error analysis. The testing methods for the suspension characteristics of residual film and soil are the same, and the main testing methods are as follows. Experiments in an independently set wind farm were conducted, and based on the simulated suspension velocity, the differences between the test results and the simulation results were compared, and the accuracy of the calculated suspension velocity was analyzed. An air suction and film unloading test bench with adjustable wind velocity was prepared. The residual film and soil mixture was placed at the inlet of the air suction device, and the inlet velocity of the centrifugal fan was set based on the calculated suspension velocity and simulation results. The suspended state of the inner film of the device was observed and recorded, and the wind velocity at the inlet was adjusted appropriately to achieve a good suspended state. The wind velocity and inlet air volume of the air suction and film-unloading device were determined by the velocity of the velocity-regulating motor connected to the rotor. Therefore, a frequency converter was used to control the velocity of the velocity-regulating motor, thereby achieving the goal of controlling the inlet air velocity. The three-dimensional model of the air suction device, analysis of flow field characteristics, and preliminary analysis of the movement path of materials in the air suction device are shown in Figure 8.
The required test instruments include the air suction film unloading test bench (self-developed), a vector 4300 frequency converter (Jiangsu Maifu Electrical Technology Co., Ltd., Dongtai City, Yancheng City, Jiangsu Province, China), and a Hot Film Anemometer AR866A current meter (Shenzhen Shenglilong Instrument Co., Ltd., Futian District, Shenzhen City, Guangdong Province, China).

2.4.2. Measurement Scheme for Film–Impurity Separation

In the simulation, SOLIWORKS 2020 was used to establish the simulation 3D model and it was converted into formats such as IGS or STP that can interact with discrete (EDEM 2021) and finite elements (Fluent 2020). Three-dimensional models include pipelines, residual film models, etc. The pipeline model was imported into EDEM, and residual film and soil particles were generated. A fluid domain in Fluent was established, and parameters such as inlet and outlet conditions and wind velocity were defined. EDEM—Fluent coupling analysis was conducted to observe the floating characteristics of residual film and soil particles under different wind velocities. Suspended materials are subjected to the combined effects of gravity, resistance, and buoyancy in fluid media. When the sum of all forces acting on the material equals zero, the material remains suspended. When the wind velocity is lower than the suspension velocity of the material, the buoyancy is less than the sum of gravity and resistance, and the material will move downwards; when the wind velocity is higher than the suspension velocity of the material, the buoyancy is greater than the sum of gravity and resistance, and the material will move upwards. These phenomena were concluded through the CFD-DEM coupling simulation, and the relevant simulation results will be provided in subsequent chapters. This process can be clearly observed in EDEM 2021. The accuracy of simulation is quantitatively verified by comparing the error between simulation and experiment values of suspension velocity.
A certain amount of residual film and soil particle mixture was placed at the inlet of the air suction device; the wind velocity at the inlet was continuously adjusted, and the wind velocity between the residual film suspension velocity and the soil suspension velocity was set (test at 3 m · s 1 , 4 m · s 1 , 5 m · s 1 ). The size of the residual film area is 25 c m 2 , the diameter of soil particles is 1 mm, and the wind velocity was measured using an anemometer. The film separation rate was calculated under different wind velocity conditions. The calculation method for the separation rate of residual film and soil is to divide the mass of soil particles that have not been absorbed by the wind force by the total mass of the soil. The test was repeated 5 times for each wind velocity and the average value was taken as the test result. The platform and instruments used are consistent with the suspension characteristics test. During CFD-DEM coupling simulation, the meshing was done using the “Mesh” modular in Ansys 2020, the maximum grid size was set to 1 mm. After the mesh was divided, a quality check was conducted, and the results (see Figure 9) show that the mesh quality is good (when the cell quality of the grid is closer to 1, it indicates better table quality. The average grid quality in this manuscript is 0.85). The simulation model described in this article does not have a small or complex structure, so there was no need to further mesh.

2.5. Simulation and Experimental Methods for Film Unloading

During simulation, when meshing, the maximum grid value was set to 1 mm. The inlet of the model was set as the velocity inlet, and the outlet was set as the velocity outlet. During simulation, the film established in EDEM was hung on the tine through parameter settings and other methods. There is frictional force between the residual film and the tooth, and its magnitude is related to the friction coefficient. The friction coefficient between the residual film and the soil can be observed in Table 1. Based on suspension characteristics of residual film, the wind force required for the film unloading process is greater than the suspension velocity of residual film. Therefore, 2 m · s 1 was used as the lower limit value of the boundary conditions for the air outlet. The initial range of inlet conditions for the air outlet was set as 2–5 m · s 1 . Based on the simulation, bench tests were conducted to further verify the simulation results. The residual film was hung on the top of the tine. The residual film used is an old film obtained from the cotton field. During the experiment, the inlet air velocity of the air suction device was adjusted within the range of the simulated wind velocity, and the wind velocity was adjusted, until the residual film was successfully removed from the tine. Different residual films were used for the experiment, experiments were repeated 10 times, and the number of times the residual film was successfully unloaded was counted during the experiment. The experiment using residual films of different sizes was repeated.

2.6. Optimization Scheme for Gas Suction Parameters Based on CFD—DEM Coupling Simulation

The Box–Behnken measure was used to conduct three factor and three level experiments, and the CFD—DEM coupling simulation was used to predict the effectiveness of the air suction device. This provides a theoretical basis and research direction for parameter optimization of the suction.
The angle between the tine and the normal of the air inlet can be set at 0°, and the tine is parallel to the normal of the air inlet. However, when the angle between the normal and the tine is close to 90°, the residual film will move laterally, so the high value (absolute value) was set at 30°. If the minimum distance between the teeth and the air inlet is less than 40 mm, the teeth and the air suction device are prone to collision when the teeth rotate at high speed. Therefore, the minimum distance between the teeth and the air suction device was set to 40 mm. When the distance is greater than 120 mm, if a large flow rate needs to be generated between the teeth and the air suction device, the fan needs to provide a large amount of wind force, which is unfavorable. Therefore, the high value was set to 120 mm. The above values are preliminary ranges obtained through simulation. If optimization values are not obtained within this range during actual simulation, the ranges of these two values can be adjusted appropriately. If the width of the suction opening is too small, it easily causes blockage, while it easily causes wind dispersion when it is too large. Therefore, the low value of the suction opening width was set at 40 mm, and the high value was set at 120 mm. Therefore, the numerical ranges of the three influencing factors are shown in Table 4.

3. Results

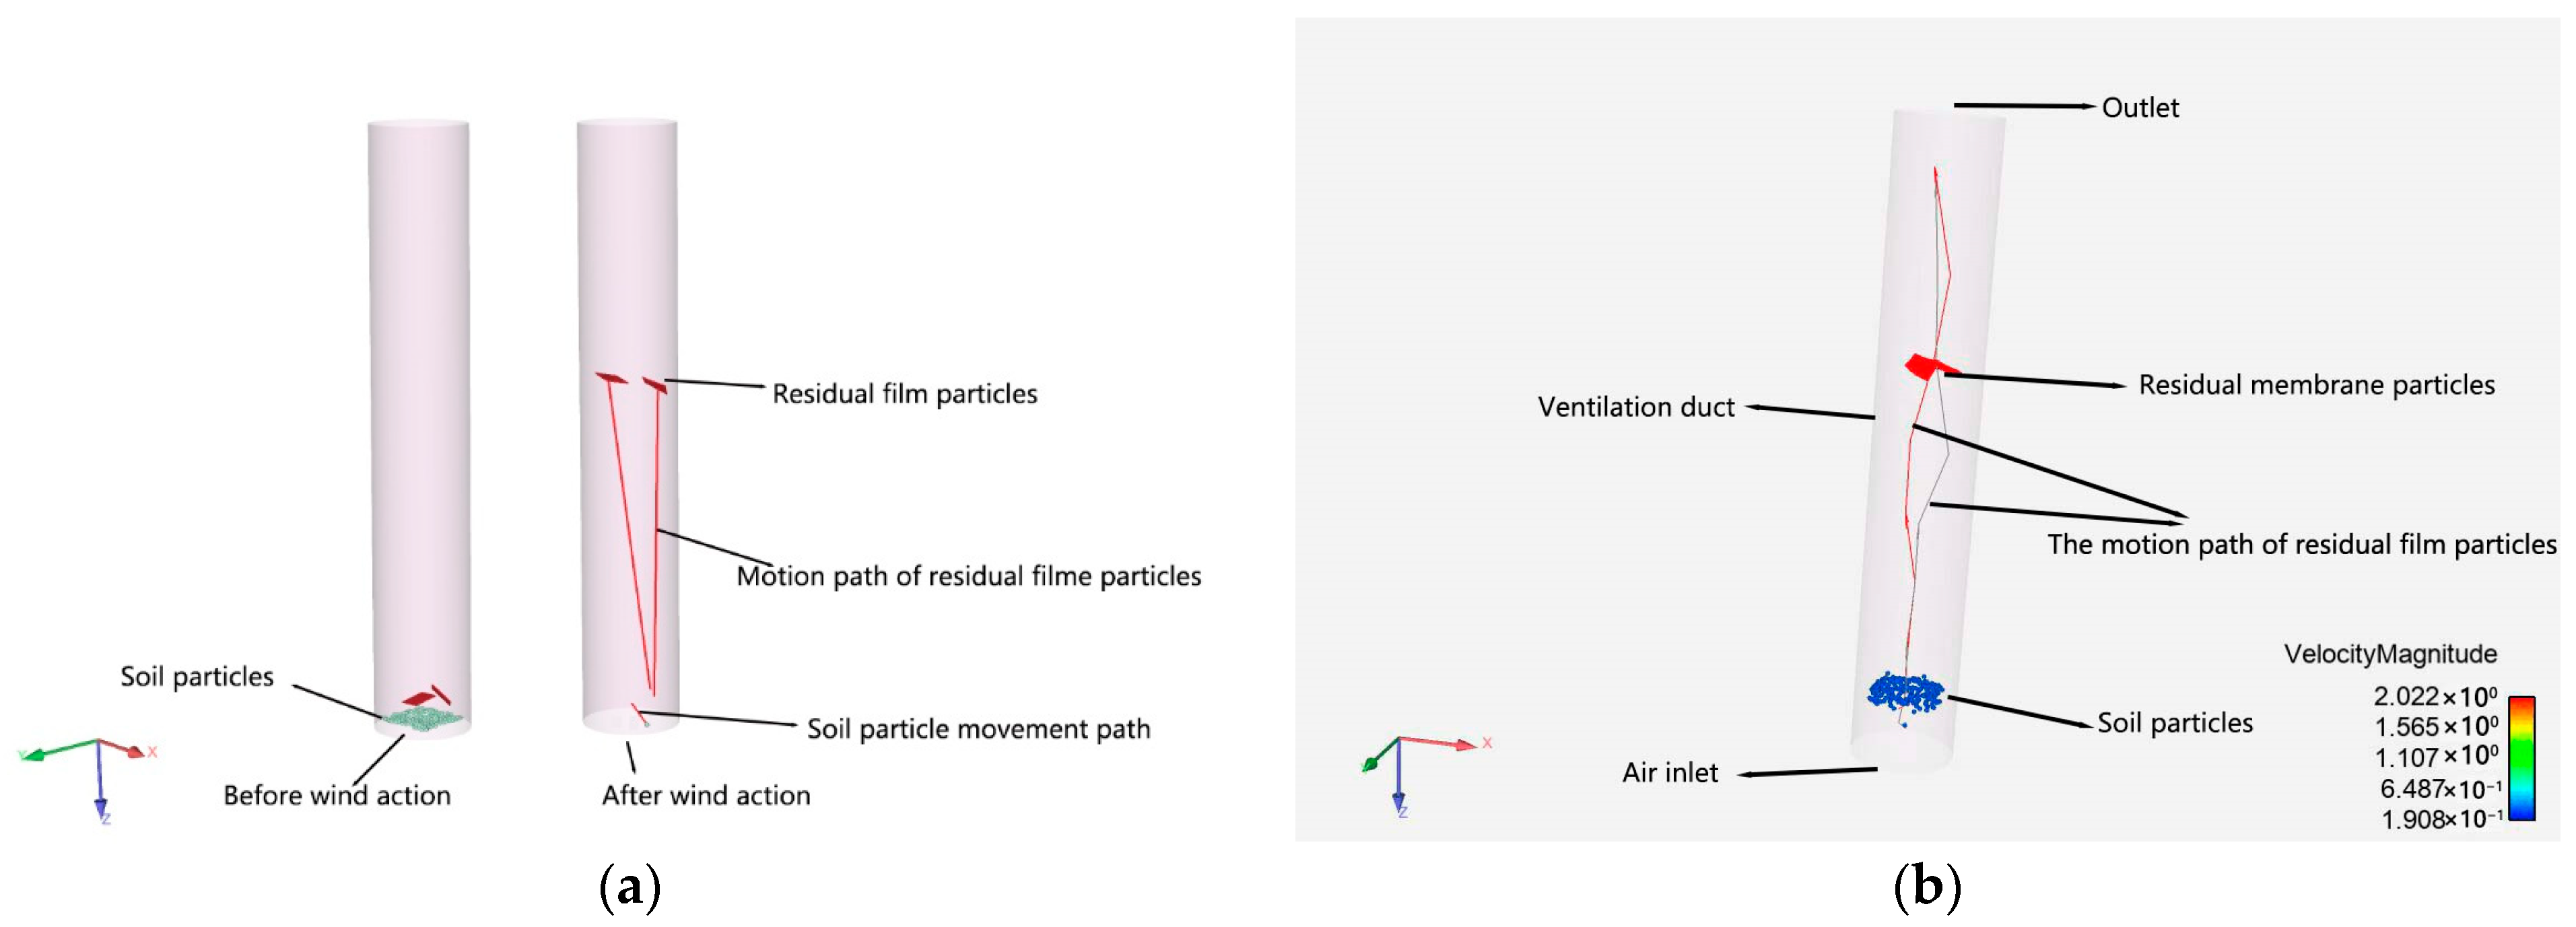
3.1. Simulation Analysis of Residual Film Suspension Velocity

As shown in Figure 10, the gravity direction was set to the Z-axis direction during simulation, and the material inlet and air outlet are both below the pipeline. The soil and residual film material parameters were obtained through experimental measurement and parameter calibration. The movement status of the soil and residual film was analyzed by modifying the inlet wind velocity to obtain the optimal separation wind velocity of the residual film and soil under pneumatic action. When the wind velocity is less than 1.68 m · s 1 , both residual film particles and soil particles decrease in the direction of gravity. At this time, neither can be transported upwards by air force, and the two cannot be separated by air force. When the wind velocity is greater than 10 m · s 1 (such as 12 m · s 1 shown in Figure 10b), the wind velocity is greater than the suspension velocity of soil and residual film particles, and both will be transported upwards by air force, so the separation of the two cannot be achieved (when the wind velocity is equal to the suspension velocity, the combined force of buoyancy, gravity, and resistance that the material will experience in the flow field is zero, and the material is in a suspended state. When the wind velocity is greater than the suspension velocity, the buoyancy experienced by the material is greater than the sum of gravity and resistance, and the material will rise with the direction of the wind. When the wind velocity is less than the suspension velocity, the buoyancy force on the material is less than the combined force of gravity and resistance, and the material will move in the opposite direction to the wind velocity.). When 1.68 m · s 1 < wind velocity < 10 m · s 1 , the wind velocity is greater than the suspension speed of residual film particles, but less than the suspension velocity of soil particles. As shown in Figure 10a, under the action of wind, residual film particles will move upwards, while soil particles will move downwards, thus achieving separation between the two.
In the subsequent pneumatic unloading of the film, a particle diameter of 0.25 was selected as the particle size that constitutes the residual film during simulation, which combines the accuracy of the results and saves time. The size of soil particles was set to a radius of 0.5 mm. When the soil particles are too small (particle radius less than 0.075~0.25 mm), they appear in a dust state and will be blown away by the wind during the air suction process.

3.2. Analysis of the Validation Results of Film–Soil Suspension Velocity and Film—Impurity Separation Experiments

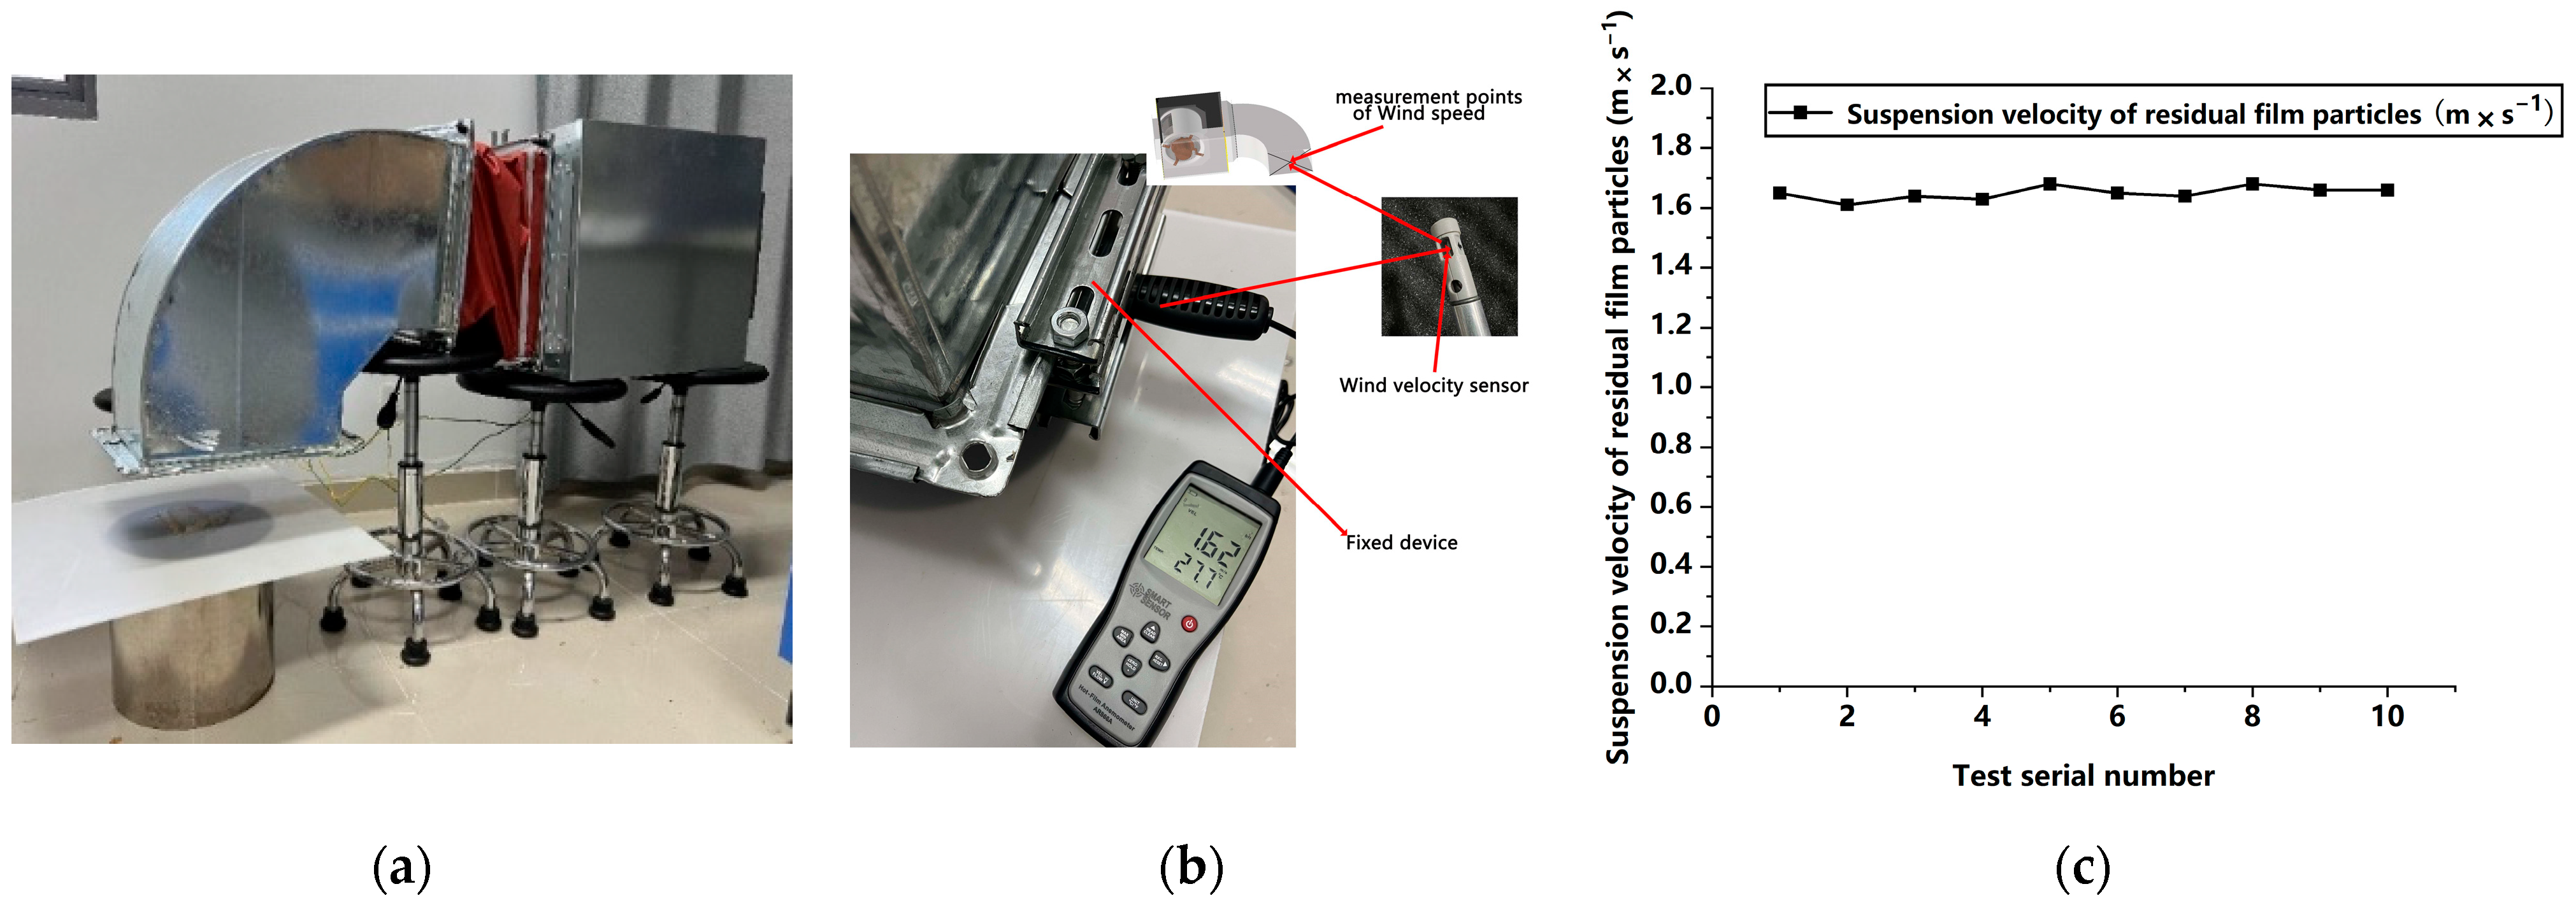
3.2.1. Analysis of Measurement Results of Residual Film Suspension Characteristics

The test process is shown in Figure 11. The point of wind velocity measurement is shown in Figure 11b. The residual film test and data statistics are as follows. As shown in Figure 11c, it can be seen that when the wind velocity is 1.65 m · s 1 , the residual film is in a suspended state, that is, 1.65 m · s 1 is the suspension velocity of the residual film (the simulation result is 1.68 m · s 1 , and the error between simulation and experiment is 1.8%). This confirms the effectiveness of the simulation data, and the established simulation model can be used for the air suction simulation of the residual film for subsequent optimization of the air suction device.

3.2.2. Analysis of Measurement Results of Soil Particle Suspension Characteristics

The soil particles with the largest proportion were selected for soil suspension characteristic measurement. In cotton fields, soil with a particle size of 0.25~0.5 mm accounts for the largest proportion. Soil particles with a particle size greater than this range will have a higher suspension velocity than those within this range. Particles with a particle size smaller than this range are basically in a powder state. Some holes can be set at the connection between the air suction pipeline and the film collection box, to disperse some powdery soil; this article focuses on studying the actual suspension velocity of soil particles with particle sizes ranging from 0.25 to 0.5 mm.
The measurement process of soil suspension velocity is shown in Figure 12. The point of wind velocity measurement is shown in Figure 12b. The flat plate device containing soil particles was placed at the air inlet of the suction device. The frequency of the frequency converter was adjusted to increase the wind velocity at the inlet of the air suction device, until soil particles began to move towards the inlet of the air suction device under the action of the force of wind. The wind velocity at the inlet was measured to obtain the suspension velocity of soil particles. The above experiment was repeated five times, as shown in the Figure 12c; the measured wind velocity was 10.54 m · s 1 , which is the suspended velocity of the soil (the simulation result is 10 m · s 1 , and the error between simulation and experiment is 5.4%).

3.2.3. Analysis of Measurement Results of Film—Impurity Separation Rate

By adjusting the frequency converter, the wind velocity at the inlet of the fan was adjusted to 3–7 m · s 1 (based on the analysis of film soil suspension characteristics, a certain margin was retained), and the film soil mixture was placed on the air outlet. The residual film is aged film (10 pieces, randomly selected) excavated from a 15 cm plow layer. The soil particles are sandy soil from cotton fields, with a random diameter of 0.5 mm–2 mm. As shown in the Figure 13, the residual film was quickly sucked into the air outlet under the action of wind force, and then flew towards the air outlet. Experiments were repeated 10 times. The average residual film–soil separation rate is 96.6% (see Figure 13). Therefore, it further proves the accuracy of the simulation results.

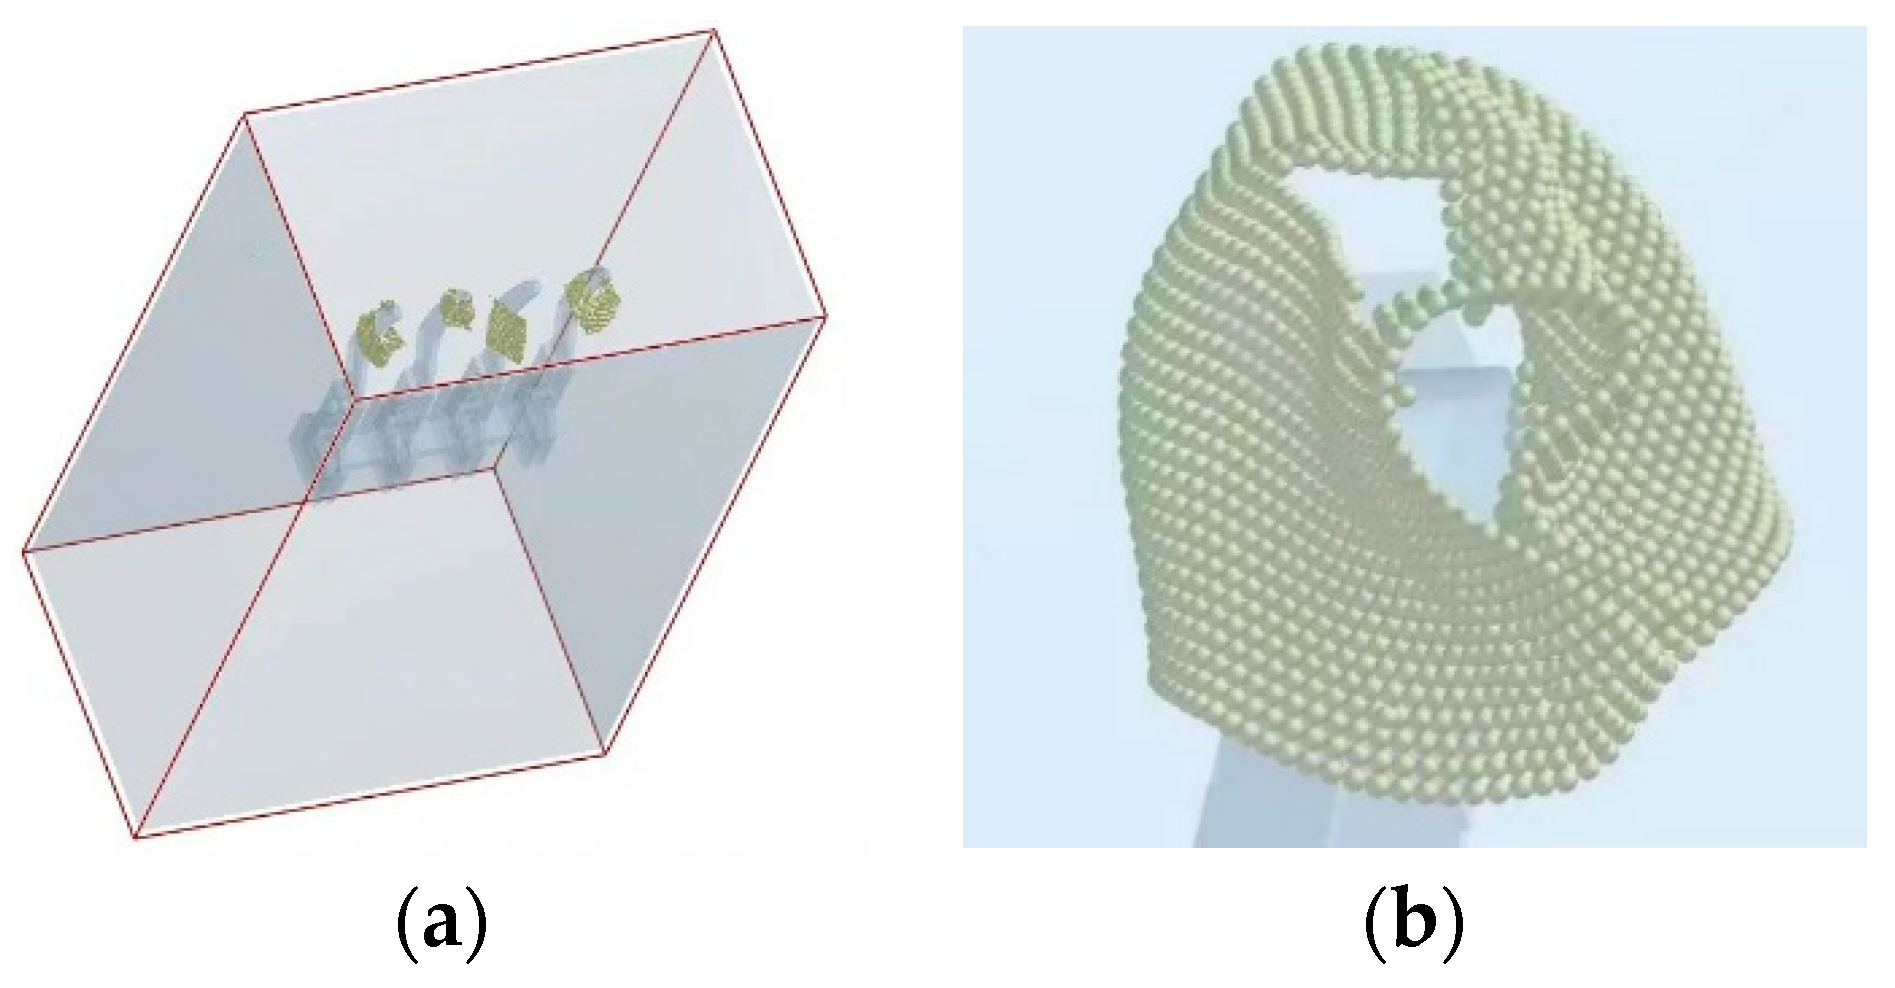
3.3. Simulation Analysis of Film Unloading Based on CFD—DEM Coupling

As shown in Figure 14, when the wind velocity is 5 m · s 1 (pre-test to obtain the range of suspension velocity), the residual film is sucked up by the wind force from the tine, proving that the wind force at this time is sufficient to overcome the total force between the residual film and the tooth and the gravity of the residual film. Therefore, 5 m · s 1 can be used as the upper limit value for pneumatic film unloading. Similarly, when the wind velocity is 2 m · s 1 , the residual film remains stationary on the tine, so 2 m · s 1 can be used as the lower limit value for pneumatic film unloading. Therefore, the minimum wind velocity that can unload the residual film from the teeth is greater than 2 m · s 1 , and less than 5 m · s 1 . Therefore, the wind velocity range 2–5 m · s 1 can be used as the minimum wind velocity range for unloading residual film from the teeth.

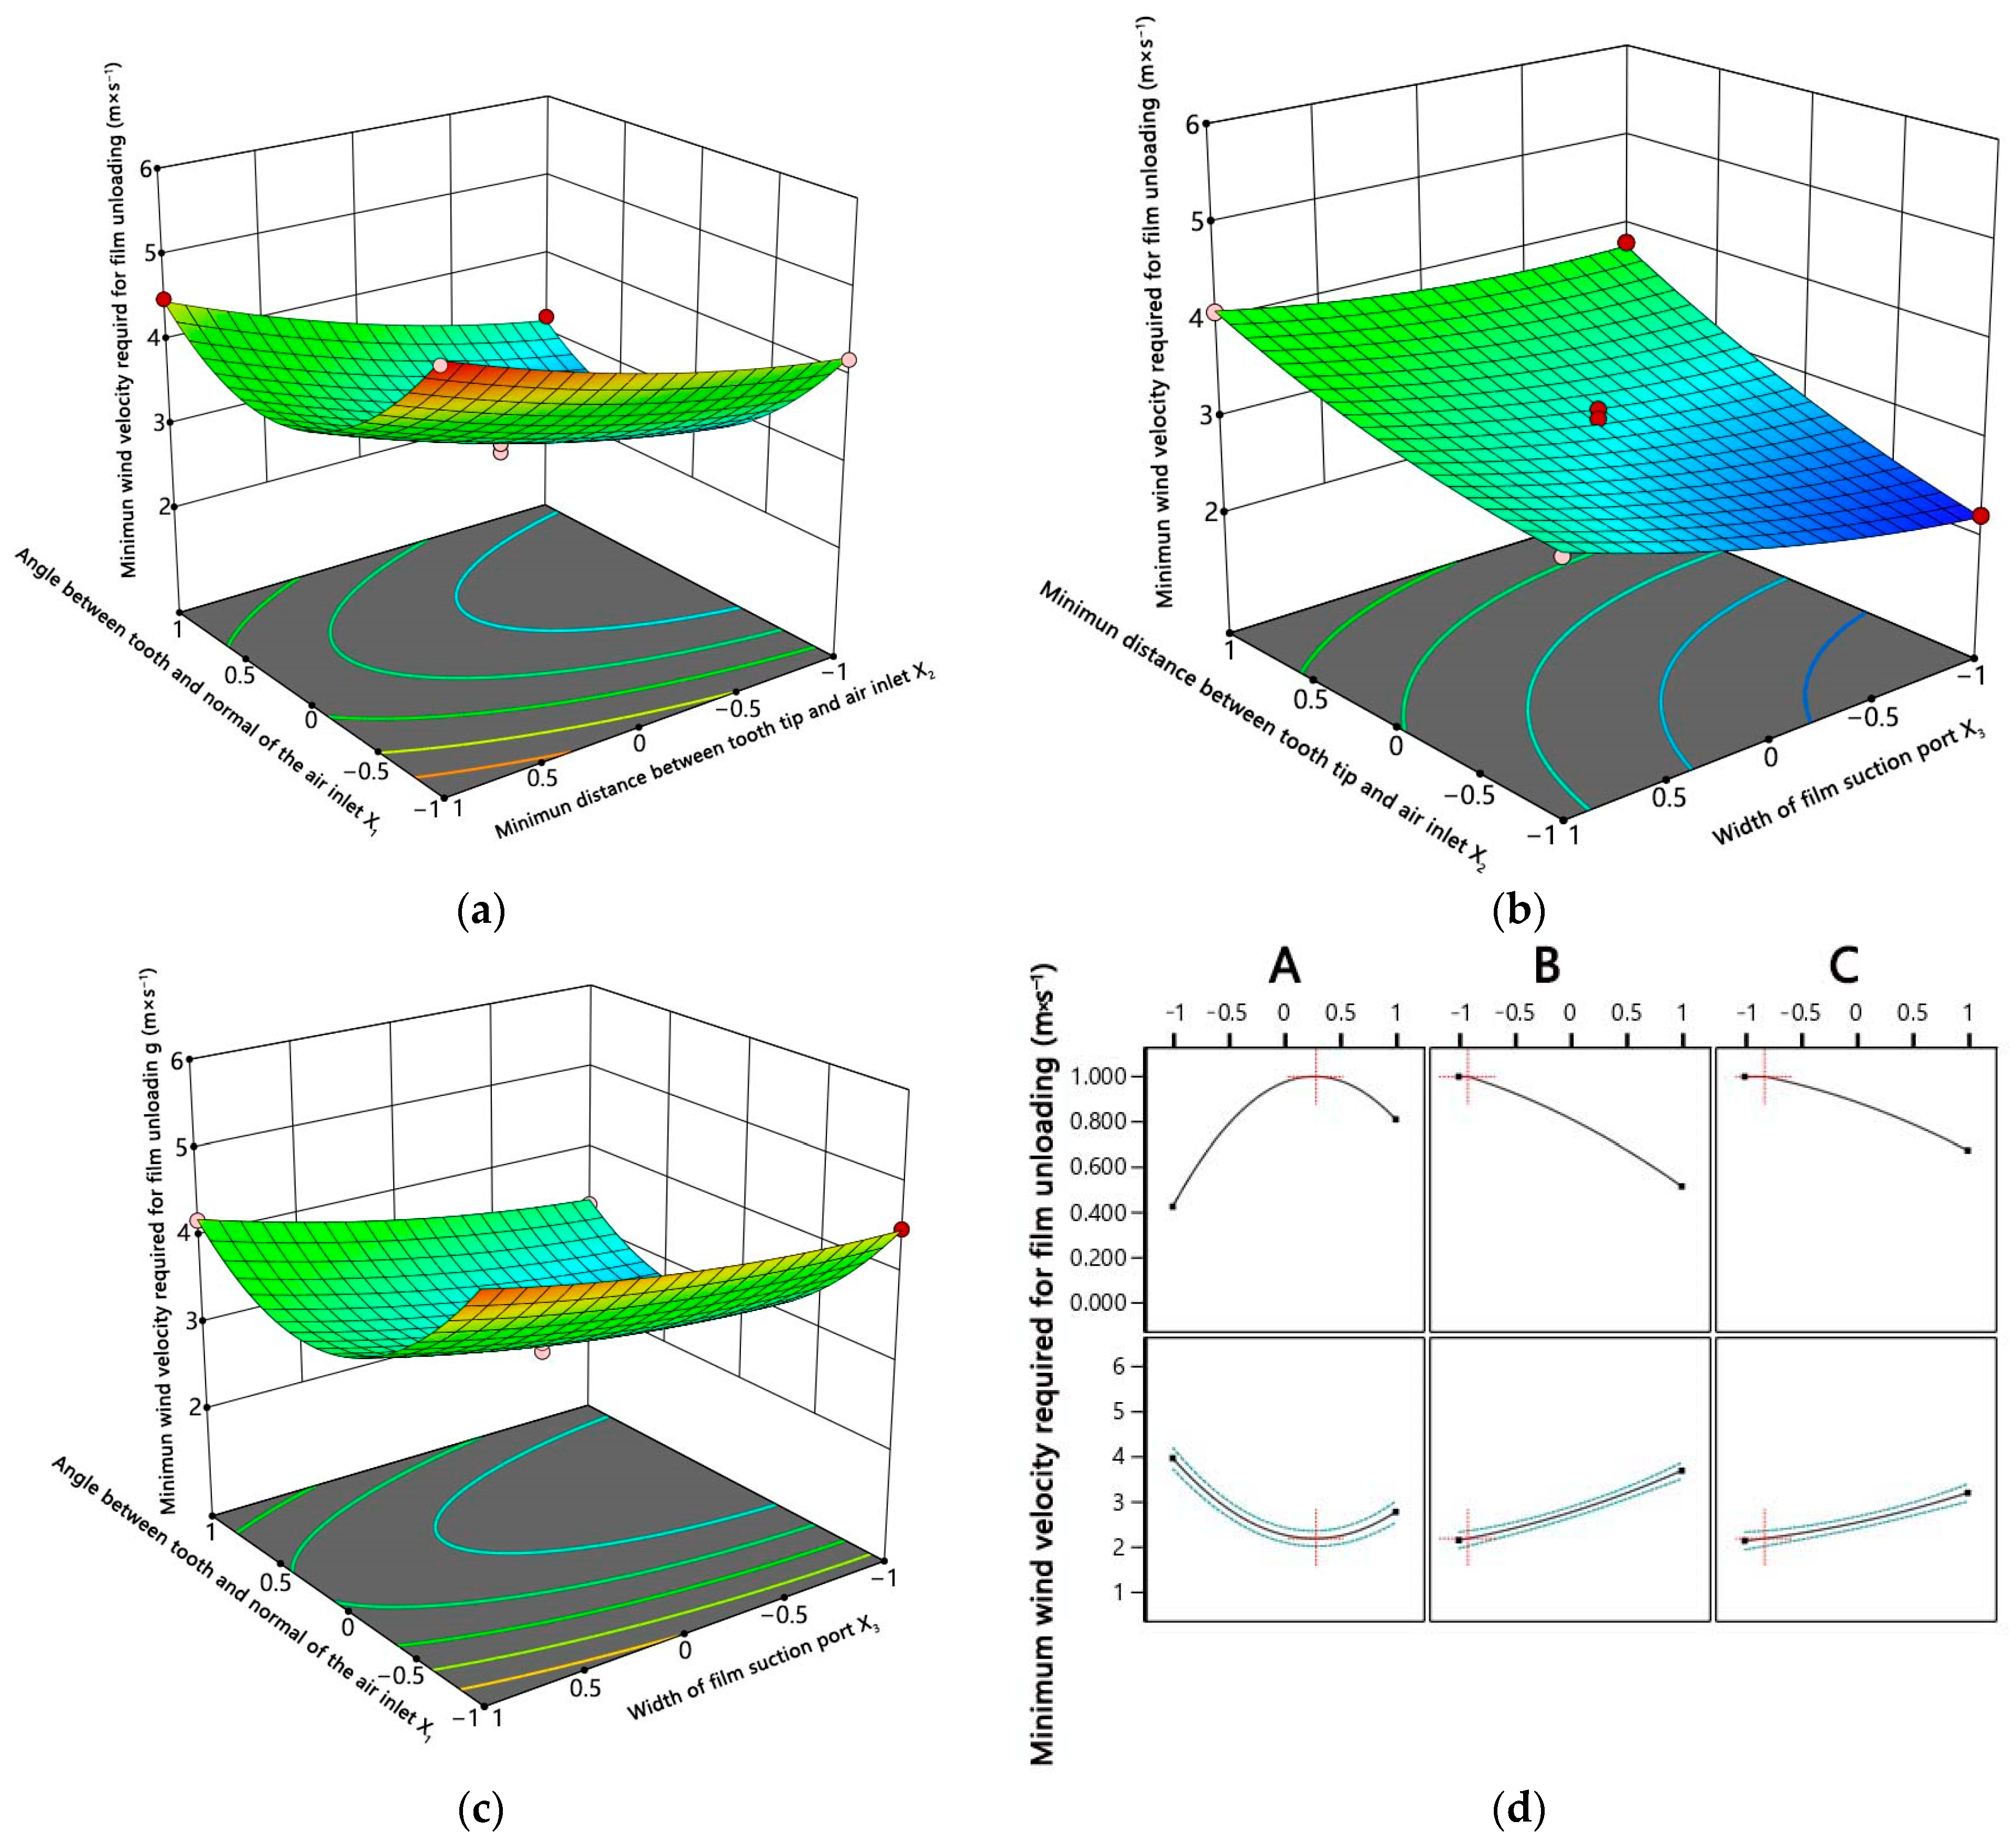
3.4. Analysis of Optimization Results of Gas Suction Parameters Based on CFD—DEM Coupling Simulation

The parameter optimization results are shown as Table 5 and Figure 15. The p-value of A, B, and C is less than 0.05 (when the p-value is less than 0.05, it proves that the influence of parameters on the corresponding factors is significant), which has a significant impact on the corresponding parameters. The final parameter optimization combination is (A = 9°, B = 40 mm, and C = 40 mm); the data were obtained through the Box–Behnken method in Design Expert 13 (see Figure 15). Under the optimal parameter combination obtained, the required film unloading wind velocity is 2.1 m · s 1 . And as Table 6 shows, the three influencing factors are all significant, and the model is significant (shown in Equation (8)), which can be used to predict more than 99% of situations.
Y 1 = 3.04 0.4875 A + 0.6125 B + 0.3500 C + 0.0500 A B + 0.0750 A C 0.1750 B C + 1.11 A 2 + 0.1550 B 2 + 0.1300 C 2

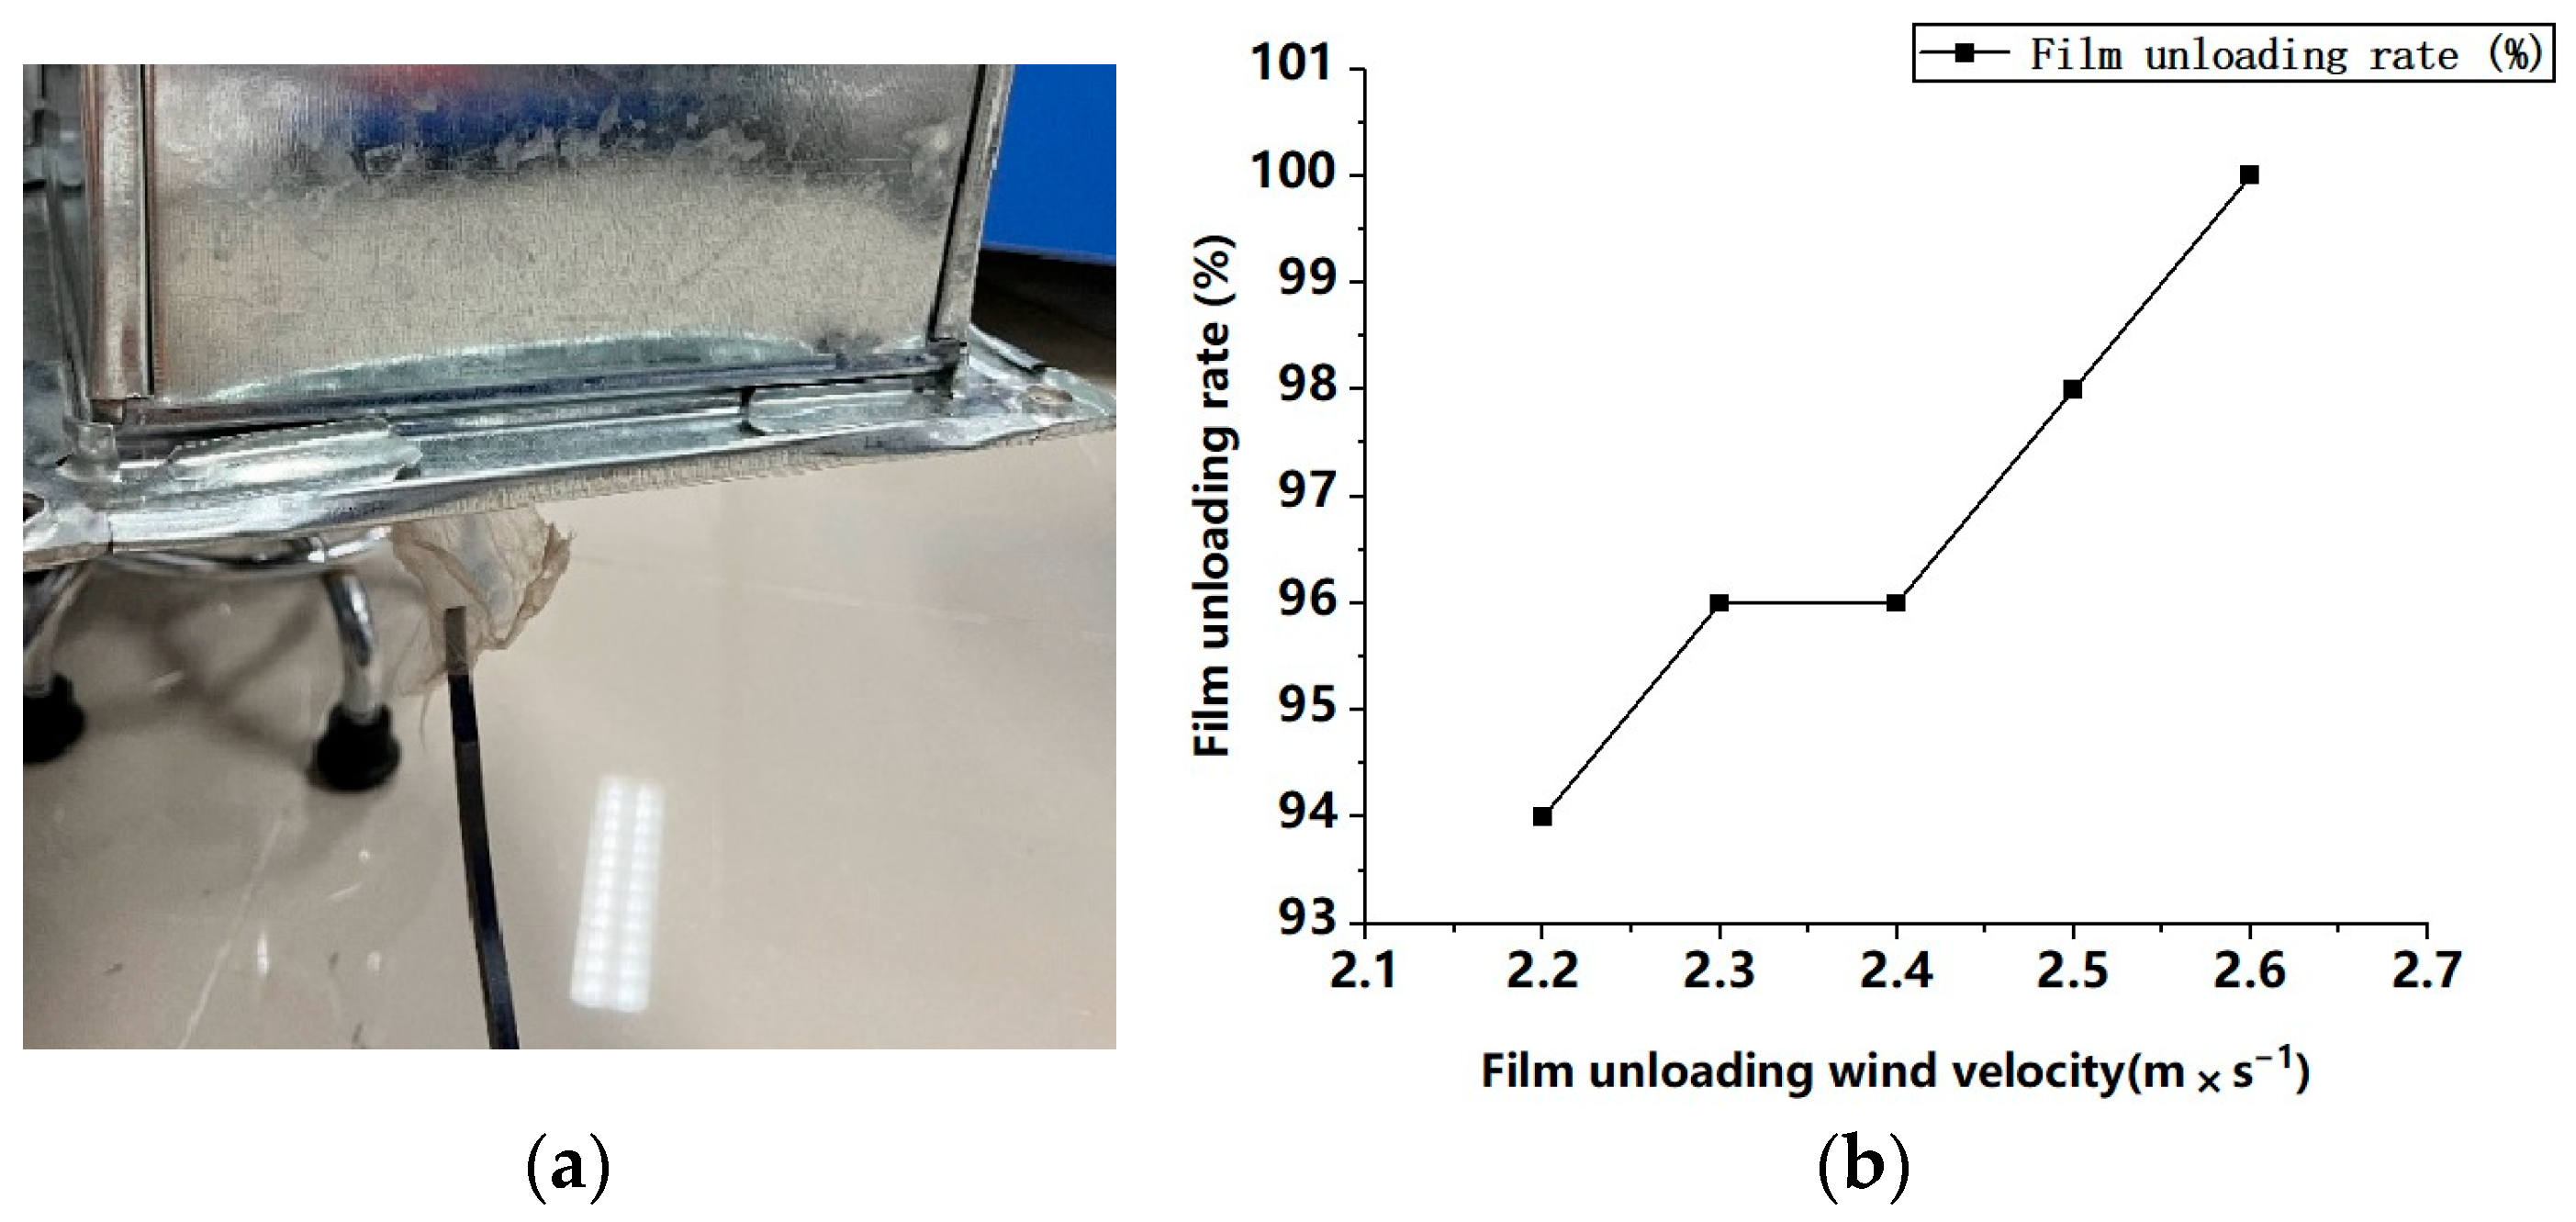
3.5. Analysis of Experimental Results on Film Unloading Wind Velocity and Film Unloading Rate after Parameter Optimization

The construction of the test bench was carried out using the optimized parameters. The film unloading situation of five different sizes of residual films under the same parameter settings on the test bench is shown in Figure 16a; the film unloading wind velocity and rate of the five sets of tests are shown in Figure 16b. According to the experimental results, under the optimized parameters, the wind velocity was set to 2.1 m · s 1 , which can unload the majority of the residual film on the tine, with an average film unloading rate of over 96%. When the wind velocity is slightly increased to 2.6 m · s 1 , the film unloading rate can reach 100%, which is greater than the mechanical film unloading rate on the teeth (86%). The experimental results prove that the parameters optimized by simulation are reliable and can be used as design parameters for the air suction and film-unloading device. Therefore, a certain margin can be reserved based on the experiment to effectively unload the residual film.

4. Discussion

The residual film in the topsoil of cotton fields is usually very small, and there is a certain difficulty in separating the residual film from the soil. Previous studies have not completely solved the problem of separating small residual films from soil. On the basis of the suspension characteristics of residual film and soil, the air suction separation characteristics of residual film and soil was simulated and analyzed, as well as the process of residual film unloading from the teeth, and the results were verified through experiments. The content studied in this manuscript has significant reference significance for the separation of residual film and soil, as well as the study of residual film recovery machines in film unloading and film–impurity separation.
The residual film in the cotton field cultivation layer can be preliminarily separated by using a tooth-shaped recycling method. After the film is picked, it needs to be unloaded. In the past, mechanical unloading was the main method of unloading the film, and a scraper was used to scrape off the film in the tooth-shaped recycling method. However, this method not only scrapes off the residual film, but also scrapes the impurities on the residual film into the film collection device, which is not conducive to the secondary separation of film impurities, and the structure of mechanical unloading is relatively complex. Air suction film unloading and the cleaning method can not only unload the residual film on the tine and achieve further separation of the film–soil but also set up an air absorption device on the surface after the film is lifted, which can further recover the small residual film that falls on the ground surface. It can achieve pneumatic secondary film collection, improve the recovery rate of the residual film, and achieve high net and low consumption recovery of the plow layer residual film. The application of the membrane soil separation in the process of residual film recovery will greatly improve the effectiveness and efficiency of residual film recovery due to the suspension characteristics of residual film and soil [40]. In addition, there is an analysis of the motion characteristics of residual film particles under pneumatic action. However, although it has certain reference significance to represent the residual film as circular particles, the residual film is a flexible object in the form of sheets. Simply replacing residual film with particles cannot simulate residual film very realistically [41]. Therefore, further research is needed on the suspension characteristics of residual film and their application in film–impurity separation. After extensive statistical analysis of the actual size of residual film and measurement of actual parameters, a soft residual film model was established and combined with the soil model to form a film–soil model for simulation analysis and experimental verification of film–soil suspension characteristics and the film–soil separation effect. During the simulation process, precise monitoring of the movement status during the film–soil separation process was carried out to preliminarily verify the accuracy of the measured suspension characteristics. The accuracy of the established film–soil model was further verified through film–soil separation experiments. After verifying the accuracy of the established film–soil separation model, a simulation analysis was conducted on the unloading of the air suction device and the film-picking tine to optimize the installation parameters between the air suction device and the film-picking tine. The coordination parameters between the air suction device and the film-picking device play an important role in the film–impurity separation rate and unloading rate [41]. After optimization, the actual design of the teeth and air suction device was used for film unloading analysis, and the actual film unloading rate was verified to verify the superiority of the optimized installation parameters. The optimized air suction film unloading rate was higher than the mechanical film unloading rate (86%) [46,47]. The separation rate of air suction film impurities is better than that of mechanical film impurities (83.27%) [48].

5. Conclusions

In this paper, material parameters were measured, and a CFD—DEM coupling simulation model was established to analyze the characteristics of film unloading, so as to provide research ideas and references for the air suction of a plough film recovery machine. The main research content is as follows. (1) By measuring the simulation parameters of residual film and soil, and combining them with existing research, a CFD—DEM coupled simulation model of film–soil was established to analyze the suspension characteristics of residual film and soil. And the accuracy of the simulation was verified by comparing the results of the simulation and experiments. (2) The film–soil separation process was analyzed by CFD—DEM coupling simulation analysis, and it was verified by test; the film–soil separation rate in the film–soil separation test is 96.6%. (3) The established film–soil simulation model was used for elastic unloading test analysis, and the installation parameters of the air suction device and the film-lifting device were optimized. The optimized installation parameters were (A = 9°, B = 40 mm, and C = 40 mm), and the optimized parameters were applied to the test bench to verify the accuracy of the unloading simulation. The required unloading wind velocity during the test process was 2.6 m · s 1 , and the unloading rate was 98% at this wind velocity. The model and analysis method established in this article can provide important references for the suspension characteristics, air suction separation, and pneumatic unloading of residual films.

Author Contributions

Conceptualization, W.F. and X.W.; methodology, W.F.; software, W.F. and N.Z.; validation, W.F., X.W. and D.H.; formal analysis, W.F.; investigation, X.W.; resources, X.W.; data curation, W.F. and C.Z.; writing—original draft preparation, W.F.; writing—review and editing, X.W., D.H., C.Z. and X.C.; visualization, W.F.; supervision, X.C.; project administration, X.W.; funding acquisition, X.W; resources, X.W. and C.Z. All authors have read and agreed to the published version of the manuscript.

Funding

This study was supported by the National Key Research and Development Project (No. 2022YFD2002403), Key Scientific and Technology Projects in Key Areas of Crops (No. 2023AB014), the Priority Academic Program Development of Jiangsu Higher Education Institutions (No. PAPD-2023-87), the 2023 Open Project of Key Laboratory of Modern Agricultural Equipment and Technology (Jiangsu University), Ministry of Education and High-tech Key Laboratory of Agricultural Equipment and Intelligence of Jiangsu Province (No. MAET202327).

Data Availability Statement

The data provided in this manuscript are all available, and the data from the references have been annotated with citation sources in the manuscript.

Conflicts of Interest

The authors declare no conflicts of interest. The cited references are all relevant to the content of this manuscript.

References

  1. Ren, J.; Wu, T.; Mo, W.; Li, K.; Hu, P.; Xu, F.; Liu, Q. Discrete Element Simulation Modeling Method and Parameters Calibration of Sugarcane Leaves. Agronomy 2022, 12, 1796. [Google Scholar] [CrossRef]
  2. Feng, X.; Gong, Z.; Wang, L.; Yu, Y.; Liu, T.; Song, L. Behavior of maize particle penetrating a sieve hole based on the particle centroid in an air-screen cleaning unit. Powder Technol. 2021, 385, 501–516. [Google Scholar] [CrossRef]
  3. Carvalho, R.M.; Oliveira, A.L.R.; Petit, H.A.; Tavares, L.M. Comparing modeling approaches in simulating a continuous pilot-scale wet vertical stirred mill using PBM-DEM-CFD. Adv. Powder Technol. 2023, 34, 104135. [Google Scholar] [CrossRef]
  4. Jiang, Z.; Rai, K.; Tsuji, T.; Washino, K.; Tanaka, T.; Oshitani, J. Upscaled DEM—CFD model for vibrated fluidized bed based on particle-scale similarities. Adv. Powder Technol. 2020, 31, 4598–4618. [Google Scholar] [CrossRef]
  5. Wang, L.; Li, Y.; Wang, H.; Wang, B.; Ma, Z. Behavior of maize particles on the bionic sieve designed based on the earthworm’s contour. Powder Technol. 2022, 403, 117399. [Google Scholar] [CrossRef]
  6. Peng, Z.; Alghamdi, Y.A.; Moghtaderi, B.; Doroodchi, E. CFD—DEM investigation of transition from segregation to mixing of binary solids in gas fluidised beds. Adv. Powder Technol. 2016, 27, 2342–2353. [Google Scholar] [CrossRef]
  7. Li, B.; Zhang, H.; Wei, J.; Zhang, O.; Guo, Y.; Zhang, J.; Si, L.; Xu, X. Coal particle transport behavior in a rotating drill pipe used for negative pressure pneumatic conveying. Powder Technol. 2022, 402, 117369. [Google Scholar] [CrossRef]
  8. Ji, Y.; Liu, S.; Li, J. Experimental study of supply pressure on spraying materials in horizontal pipe. Vacuum 2019, 159, 51–58. [Google Scholar] [CrossRef]
  9. Xi, X.; Wang, R.; Wang, X.; Shi, Y.; Zhao, Y.; Zhang, B.; Qu, J.; Gan, H.; Zhang, R. Parametric optimization and experimental verification of multi-fertilizer mixing by air blowing and blade stirring based on discrete element simulations. Comput. Electron. Agric. 2023, 210, 107895. [Google Scholar] [CrossRef]
  10. Chen, Y.; Tang, J.; Li, H.; Yan, Y.; Xu, Z.; Cai, F. Research on the particle movement in a flexible air chamber jig. Adv. Powder Technol. 2023, 34, 103922. [Google Scholar]
  11. Ding, B.; Liang, Z.; Qi, Y.; Ye, Z.; Zhou, J. Improving Cleaning Performance of Rice Combine Harvesters by DEM—CFD Coupling Technology. Agriculture 2022, 12, 1457. [Google Scholar] [CrossRef]
  12. An, X.; Cheng, X.; Wang, X.; Han, Y.; Li, H.; Liu, L.; Liu, M.; Liu, M.; Zhang, X. Design and Experimental Testing of a Centrifugal Wheat Strip Seeding Device. Agriculture 2023, 13, 1883. [Google Scholar] [CrossRef]
  13. Xiao, Y.; Ma, Z.; Wu, M.; Luo, H. Numerical Study of Pneumatic Conveying of Rapeseed through a Pipe Bend by DEM—CFD. Agriculture 2022, 12, 1845. [Google Scholar] [CrossRef]
  14. Xu, J.; Liu, X.; Pang, M. Numerical and experimental studies on transport properties of powder ejector based on double venturi effect. Vacuum 2016, 134, 92–98. [Google Scholar] [CrossRef]
  15. Wang, Y.; Li, H.; Hu, H.; He, J.; Wang, Q.; Lu, C.; Liu, P.; Yang, Q.; He, D.; Jiang, S.; et al. A noncontact self-suction wheat shooting device for sustainable agriculture: A preliminary research. Comput. Electron. Agric. 2022, 197, 106927. [Google Scholar] [CrossRef]
  16. Dai, F.; Guo, W.; Song, X.; Shi, R.; Qu, J.; Zhao, W. Measurement and simulation of the suspension velocity of flax threshing material using CFD-DEM. Int. J. Agric. Biol. Eng. 2021, 14, 230–237. [Google Scholar] [CrossRef]
  17. Kushimoto, K.; Suzuki, K.; Ishihara, S.; Soda, R.; Ozaki, K.; Kano, J. Analysis of the particle collision behavior in spiral jet milling. Adv. Powder Technol. 2023, 34, 103993. [Google Scholar] [CrossRef]
  18. Dai, F.; Song, X.; Zhao, W.; Han, Z.; Zhang, F.; Zhang, S. Motion simulation and test on threshed grains in tapered threshing and transmission device for plot wheat breeding based on CFD—DEM. Int. J. Agric. Biol. Eng. 2019, 12, 66–73. [Google Scholar] [CrossRef]
  19. Fayzullayevich, J.V.; Tan, G.; Alex, F.J.; Wu, Y.; Agyeman, P.K. Numerical Study of Factors Affecting Particle Suction Efficiency of Pick-Up Head of a Regenerative Air Vacuum Sweeper. Processes 2022, 10, 1252. [Google Scholar] [CrossRef]
  20. Lei, X.; Liao, Y.; Liao, Q. Simulation of seed motion in seed feeding device with DEM—CFD coupling approach for rapeseed and wheat. Comput. Electron. Agric. 2016, 131, 29–39. [Google Scholar] [CrossRef]
  21. Ma, Q.; Lu, A.; Gao, L.; Wang, Z.; Tan, Z.; Li, X. Aerodynamic characteristics of lotus seed mixtures and test on pneumatic separating device for lotus seed kernel and contaminants. Trans. Chin. Soc. Agric. Eng. (Trans. CSAE) 2015, 31, 297–303. [Google Scholar]
  22. Tian, F.; Zhang, E.; Yang, C.; Shi, W.; Chen, Y. Research on the Characteristics of the Solid-Liquid Two-Phase Flow Field of a Submersible Mixer Based on CFD-DEM. Energies 2022, 15, 6096. [Google Scholar] [CrossRef]
  23. El-Emam, M.A.; Zhou, L.; Shi, W.D.; Han, C. True shape modeling of bio-particulate matter flow in an aero-cyclone separator using CFD-DEM simulation. Comput. Part. Mech. 2021, 8, 955–971. [Google Scholar] [CrossRef]
  24. Zhou, L.; Lv, W.; Bai, L.; Han, Y.; Wang, J.; Shi, W.; Huang, G. CFD—DEM study of gas-solid flow characteristics in a fluidized bed with different diameter of coarse particles. Energy Rep. 2022, 8, 2376–2388. [Google Scholar] [CrossRef]
  25. Zhao, R.; Zhou, Y.; Zhang, D.; Gao, X. Numerical investigation of the hydraulic transport of coarse particles in a vertical pipe based on a fully-coupled numerical model. Int. J. Multiph. Flow 2022, 155, 104094. [Google Scholar] [CrossRef]
  26. Fei, T.; Erfeng, Z.; Chen, Y.; Shi, W.; Zhang, C. Review of Numerical Simulation Research on Submersible Mixer for Sewage. Front. Energy Res. 2022, 9, 818211. [Google Scholar] [CrossRef]
  27. Han, D.; Zhang, D.; Jing, H.; Yang, L.; Cui, T.; Ding, Y.; Wang, Z.; Wang, Y.; Zhang, T. DEM—CFD coupling simulation and optimization of an inside-filling air-blowing maize precision seed-metering device. Comput. Electron. Agric. 2018, 150, 426–438. [Google Scholar] [CrossRef]
  28. Dong, H.; Zhang, B.; Jiang, T.; Zhang, Y.; Qu, J.; Chen, C.; Xiao, Y.; Ding, Y.; Xi, X. Design and Optimization of Rice Grain Screening System Based on DEM-CFD Coupled Rice Seed Testing Platform. Agronomy 2022, 12, 3069. [Google Scholar] [CrossRef]
  29. Zhang, F.; Yu, F.; Li, Z.; Zhang, H.; Lan, H.; Li, P.; Li, P.; Zhang, C. Design and field testing of the air-suction machine for picking up Chinese jujube fruits. J. Fruit Sci. 2020, 37, 278–285. [Google Scholar]
  30. Zhang, F.; Ran, J.; Li, Z.; Wang, D.; Li, P. Optimization of working parameters of air- suction machine for picking up ground jujube. J. Fruit Sci. 2021, 38, 1190–1200. [Google Scholar]
  31. Xu, H.; Hua, Y.; He, J.; Chen, Q. The Positive and Negative Synergistic Airflow-Type Jujube Fruit Harvester (P-N JH). Processes 2022, 10, 1486. [Google Scholar] [CrossRef]
  32. Markauskas, D.; Platzk, S.; Kruggel-Emden, H. Comparative numerical study of pneumatic conveying of flexible elongated particles through a pipe bend by DEM-CFD. Powder Technol. 2022, 399, 117170. [Google Scholar] [CrossRef]
  33. Guo, W.; Hu, C.; He, X.; Wang, L.; Hou, S.; Wang, X. Construction of virtual mulch film model based on discrete element method and simulation of its physical mechanical properties. Int. J. Agric. Biol. Eng. 2020, 13, 211–218. [Google Scholar] [CrossRef]
  34. Wang, J.; Guo, F.; Xu, Y.; Zhu, J.; Li, R.; Tang, H.; Zhou, W.; Wang, Q.; Sun, X. Analysis of the Interaction Mechanism between Preharvest Threshing Device and Rice at Harvesting Period Based on DEM Simulations and Bench Tests. Agriculture 2024, 14, 183. [Google Scholar] [CrossRef]
  35. Yan, K.; Yao, S.; Huang, Y.; Zhao, Z. Study on Pulling Dynamic Characteristics of White Radish and the Optimal Design of a Harvesting Device. Agriculture 2023, 13, 942. [Google Scholar] [CrossRef]
  36. Ren, Y.; Guo, W.; Wang, X.; Hu, C.; Wang, L.; He, X.; Xing, J. Separation and mechanical properties of residual film and soil. Int. J. Agric. Biol. Eng. 2023, 16, 184–192. [Google Scholar] [CrossRef]
  37. Gao, Y.; Song, L.; Wang, L.; Wang, H.; Li, Y. Behavior of maize grains on the three-dimensional translational vibrating sieve. Powder Technol. 2022, 412, 117999. [Google Scholar] [CrossRef]
  38. Shi, Q.; Sakai, M. Numerical study on the elucidation of powder mixing mechanism in a container blender. Adv. Powder Technol. 2023, 34, 104231. [Google Scholar] [CrossRef]
  39. Wang, L.; Zhang, S.; Cui, T.; Gao, Y.; Wang, B. Kinetic characteristics of a bionic screen with continuous variable amplitude from front to rear and behavior of maize mixture on the screen. Powder Technol. 2023, 424, 118370. [Google Scholar] [CrossRef]
  40. Jin, W.; Zhang, X.; Ding, Y.; Bai, S.; Liu, W.; Zhou, X. Experiment on Suspension Separation of Residual Film and Impurity Based on EDEM-Fluent Coupling. Trans. Chin. Soc. Agric. Mach. 2022, 53, 89–98. [Google Scholar] [CrossRef]
  41. Guo, W.; He, X.; Wang, L.; Zhao, P.; Hu, C.; Hou, S.; Wang, X. Development of a comb tooth loosening and pneumatic stripping plough layer residual film recovery machine. Trans. Chin. Soc. Agric. Eng. (Trans. CSAE) 2020, 36, 1–10. [Google Scholar] [CrossRef]
  42. Ren, D.; Li, J.; Nie, Y.; Zhang, Y.; Cheng, H.; Zhang, L.; Gong, Y. Design and Experimental Study on Air-suction Hazelnut Picking and Cleaning Machine. J. Shenyang Agric. Univ. 2022, 53, 177–186. [Google Scholar]
  43. Fang, W.; Wang, X.; Han, D.; Chen, X. Review of Material Parameter Calibration Method. Agriculture 2022, 12, 706. [Google Scholar] [CrossRef]
  44. Liu, J.; Tang, Z.; Zheng, X.; Yang, H.; Zhang, L.; Xiang, J.; He, X. Design and test of deep fertilization shovel for opposite row ditching. J. Gansu Agric. Univ. 2021, 56, 169–176+186. [Google Scholar]
  45. Fang, W.; Wang, X.; Han, D.; Zang, N.; Xue, G.; Israel, E.O. Parameter Optimization and Disturbance Analysis of the Film Picking Device of the Chain-Type Plough Layer Residual Film Recovery Machine Based on DEM—MBD Coupling. Comput. Electron. Agric. 2024, 222, 109041. [Google Scholar] [CrossRef]
  46. Xie, J.; Zhang, F.; Chen, X.; Han, Y.; Tang, W. Design and parameter optimization of arc tooth and rolling bundle type plastic film residue collector. Trans. Chin. Soc. Agric. Eng. (Trans. CSAE) 2019, 35, 26–37. [Google Scholar] [CrossRef]
  47. Xie, J.; Tang, W.; Zhang, X.; Zhang, F.; Yang, Y.; Duan, W. Design and parameter optimization of swing rod driven residual plastic film collector. Trans. Chin. Soc. Agric. Eng. (Trans. CSAE) 2019, 35, 56–63. [Google Scholar] [CrossRef]
  48. Jin, W.; Liu, J.; Xu, C.; Zhang, X.; Bai, S. Design, Simulation and Experimentation of a Polythene Film Debris Recovery Machine in Soil. Appl. Sci. 2022, 12, 1366. [Google Scholar] [CrossRef]
Figure 1. Design scheme of the toothed chain air suction tillage residual film recovery machine. 1. Lower air suction and unloading film assembly. 2. Upper air suction and unloading film assembly. 3. Chain-type film picking and tooth assembly. 4. Chassis frame. 5. Tractor traction. 6. Front rotary tiller. 7. Lower lifting film component 8. Jack universal wheel (adjustable).
Agriculture 14 01021 g001
Figure 2. Test and simulation scheme of air suction device. (a) Overall coordination plan for air suction device and film tipping device; (b) simulation model two-dimensional diagram and parameter description. 1. Air inlet duct. 2. Air chamber. 3. Centrifugal fan stator and support frame. 4. Velocity regulating motor. 5. Film picking tine assembly.
Agriculture 14 01021 g002
Figure 3. Schematic diagram of residual film unloading force on the time.
Agriculture 14 01021 g003
Figure 4. Soil screening test process.
Agriculture 14 01021 g004
Figure 5. Principle analysis diagram of measuring static friction coefficient using the inclined plane method.
Agriculture 14 01021 g005
Figure 6. Cylinder lifting method for measurement of contact parameters of residual film–residual film. (a) Before lifting the cylinder (experiment); (b) after lifting the cylinder (experiment); and (c,d) stacking angle measurement of simulation.
Agriculture 14 01021 g006
Figure 7. The process of obtaining residual film from the plow layer. (a) Sampling of residual film on the topsoil layer; (b) sample of residual film.
Agriculture 14 01021 g007
Figure 8. The diagram and flow field characteristic analysis diagram of the unloading component test platform. (a) Three-dimensional diagram of suspension characteristics platform; (b) analysis of the influence of the flow field of the air suction device on material flow; (c) and the flow characteristics of residual film particles in the air suction device under the action of airflow.
Agriculture 14 01021 g008
Figure 9. Quality statistics of grid division for CFD-DEM film unloading model.
Agriculture 14 01021 g009
Figure 10. Simulation analysis of film soil separation effect at different speeds. (a) Simulation analysis of film–soil separation at a wind velocity of 3.5 m · s 1 . (b) Simulation analysis of film–soil at a wind velocity of 12 m · s 1 .
Agriculture 14 01021 g010
Figure 11. Testing and data statistics of residual film suspension speed. (a) Measurement process of suspension characteristics (b) Measurement of wind velocity; (c) data from residual film particle suspension velocity test.
Agriculture 14 01021 g011
Figure 12. Soil suspension velocity testing and data statistics. (a) Preparation for measurement of soil suspension characteristics; (b) measurement of wind velocity; and (c) data from soil suspension velocity test.
Agriculture 14 01021 g012
Figure 13. Film soil separation test and data statistics. (a) Before separation; (b) after separation; and (c) statistics of residual film–soil separation rate.
Agriculture 14 01021 g013
Figure 14. Film detachment state diagram at a boundary condition of 5 m · s 1 at the air inlet. (a) Simulation unloading model; (b) single film.
Agriculture 14 01021 g014
Figure 15. Simulation optimization results. (a) Factor A and B; (b) Factor B and C; (c) Factor A and C; and (d) parameter optimization value analysis.
Agriculture 14 01021 g015
Figure 16. Test and data statistics of film unloading wind speed. (a) Air suction and film unloading process; (b) the relationship between film unloading rate and wind speed.
Agriculture 14 01021 g016
Table 1. Soil granularity measurement.
Particle size (mm)0.075~0.250.25~0.50.5~11~2>2
Proportion (%)3.7063.2110.686.2215.49
Table 2. Summary of material intrinsic parameters.
ParameterSoil65 Mn SteelResidual Plastic Film
Poisson’s ratio0.360.350.21
Shear modulus/Pa1 × 1067.27 × 10101.12 × 106
Density/(kg·m−3)1.610 × 1037.830 × 1030.915 × 103
Table 3. Summary of material contact parameters.
ParameterSoil—65 Mn SteelSoil—Residual FilmSoil—SoilResidual Film—Residual FilmResidual Film—65 Mn Steel
coefficient of
static friction
0.500.550.740.520.45
coefficient of
rolling friction
0.310.460.220.40.4
coefficient of
collision recovery
0.430.50.520.570.5
Table 4. Factors for film absorption.
LevelsA: Angle between the Tine and Normal of the Air Inlet (°)B: Minimum Distance between Tine Tip and Air Inlet (mm)C: Width of Film Suction Port (mm)
−1−304040
008080
130120120
Table 5. Parameter optimization test table.
Serial NumberFactor 1
A: Angle between the Tine and Normal of the Air Inlet (°)
Factor 2
B: Minimum Distance between Tine Tip and Air Inlet (mm)
Factor 3
C: Width of Film Suction Port (mm)
Response 1
Minimum Wind Velocity Required for Film Unloading ( m · s 1 )
1−1−104.2
2−1105.3
3−10−14.5
4−1015.1
50−1−12.2
601−13.8
70−113.2
80114.1
90003
100003
110003.2
120002.9
130003.1
141−103.2
151104.5
1610−13.3
171013.7
Table 6. Analysis of variance of regression equation.
SourceMinimum Wind Velocity Required for Film Unloading ( Y 1 / 1   m · s 1 )
Sum of SquaresDegree of FreedomFSignificant Level (p-Value)
Model11.549129.14<0.0001 **
A1.901191.49<0.0001 **
B3.001302.28<0.0001 **
C0.9800198.71<0.0001 **
AB0.010011.010.3490
AC0.022512.270.1759
BC0.1225112.340.0098
A25.141517.81<0.0001 **
B20.1012110.190.0152
C20.071217.170.0317
Residual0.06957
Lack of Fit0.017530.44870.7318
Pure Error0.05204
Cor Total11.6116
Note: ** indicating extremely significant.
Disclaimer/Publisher’s Note: The statements, opinions and data contained in all publications are solely those of the individual author(s) and contributor(s) and not of MDPI and/or the editor(s). MDPI and/or the editor(s) disclaim responsibility for any injury to people or property resulting from any ideas, methods, instructions or products referred to in the content.

