
Rotary Tillage Plus Mechanical Transplanting Practices Increased Rice Yields with Lower CH4 Emission in a Single Cropping Rice System
 ,
,
Abstract
:1. Introduction
2. Materials and Methods
2.1. Site Description
2.2. Experiment Design and Implementation
2.3. Rice Yield Determination
2.4. Gas Sampling and Determination
2.5. Soil Sampling and Determination
2.6. Methanogen and Methanotroph
3. Statistical Analysis
4. Results
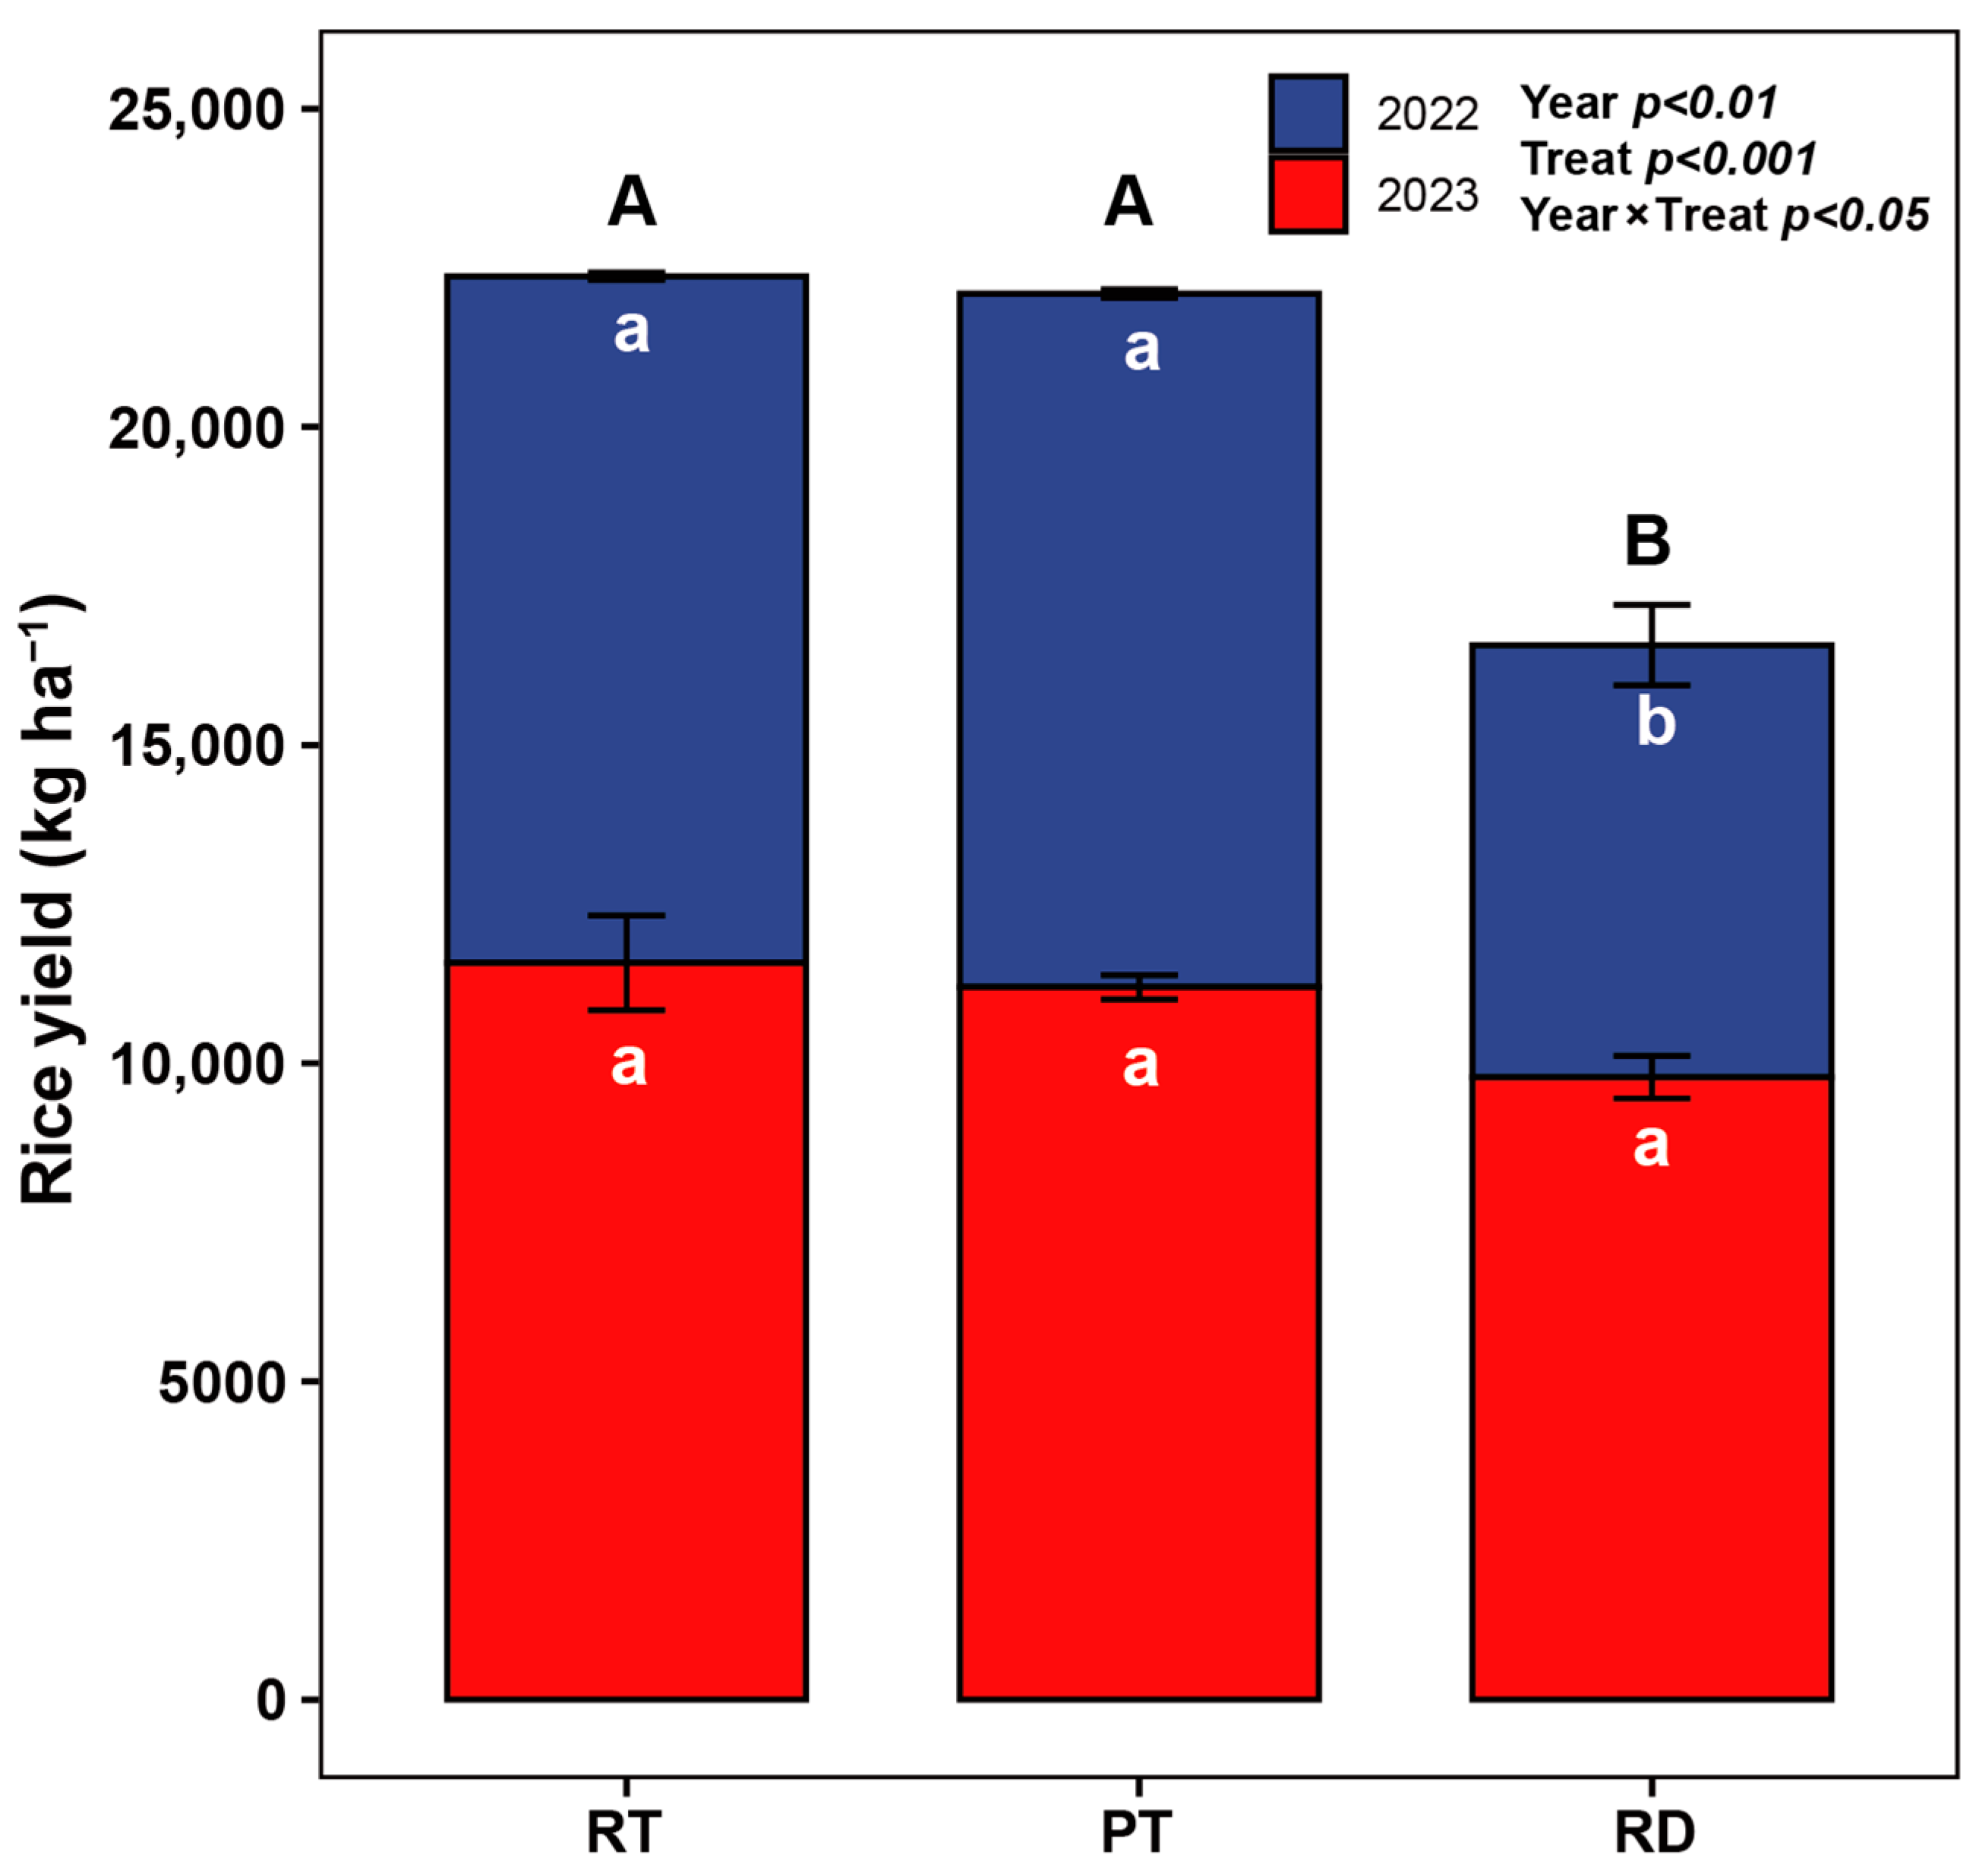
4.1. Rice Yields
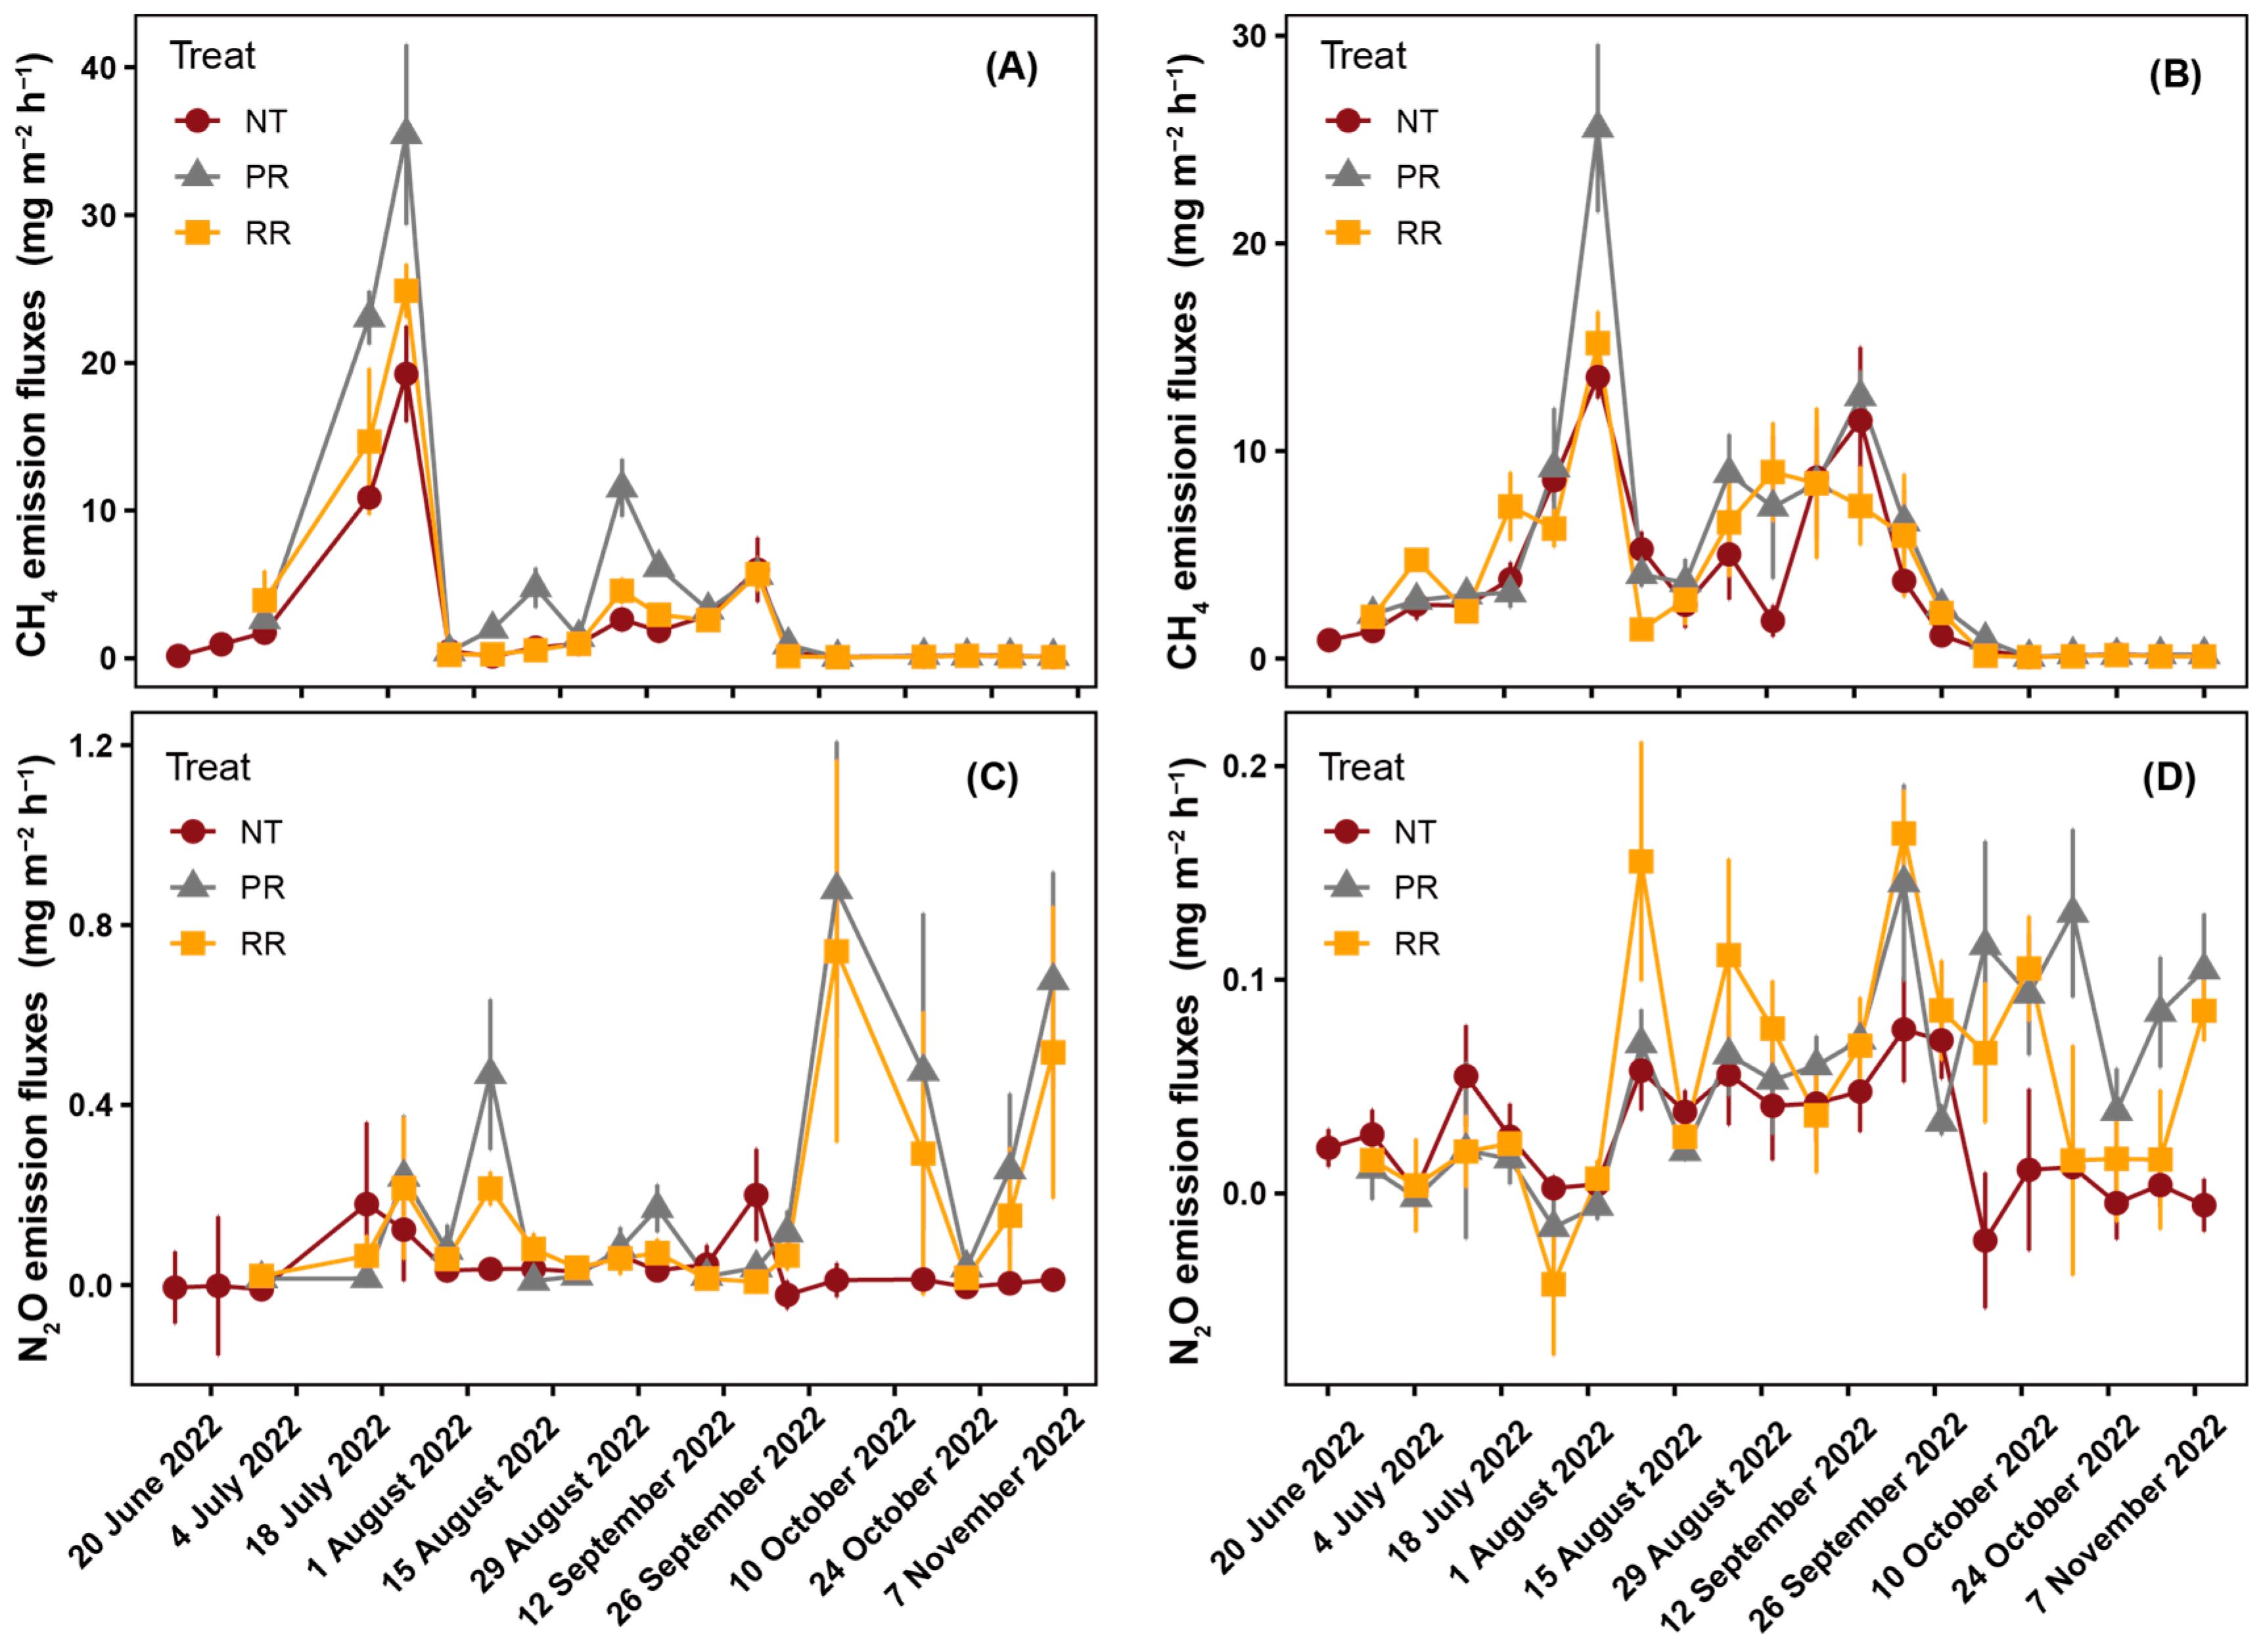
4.2. CH4 and N2O Emissions in Paddy Fields
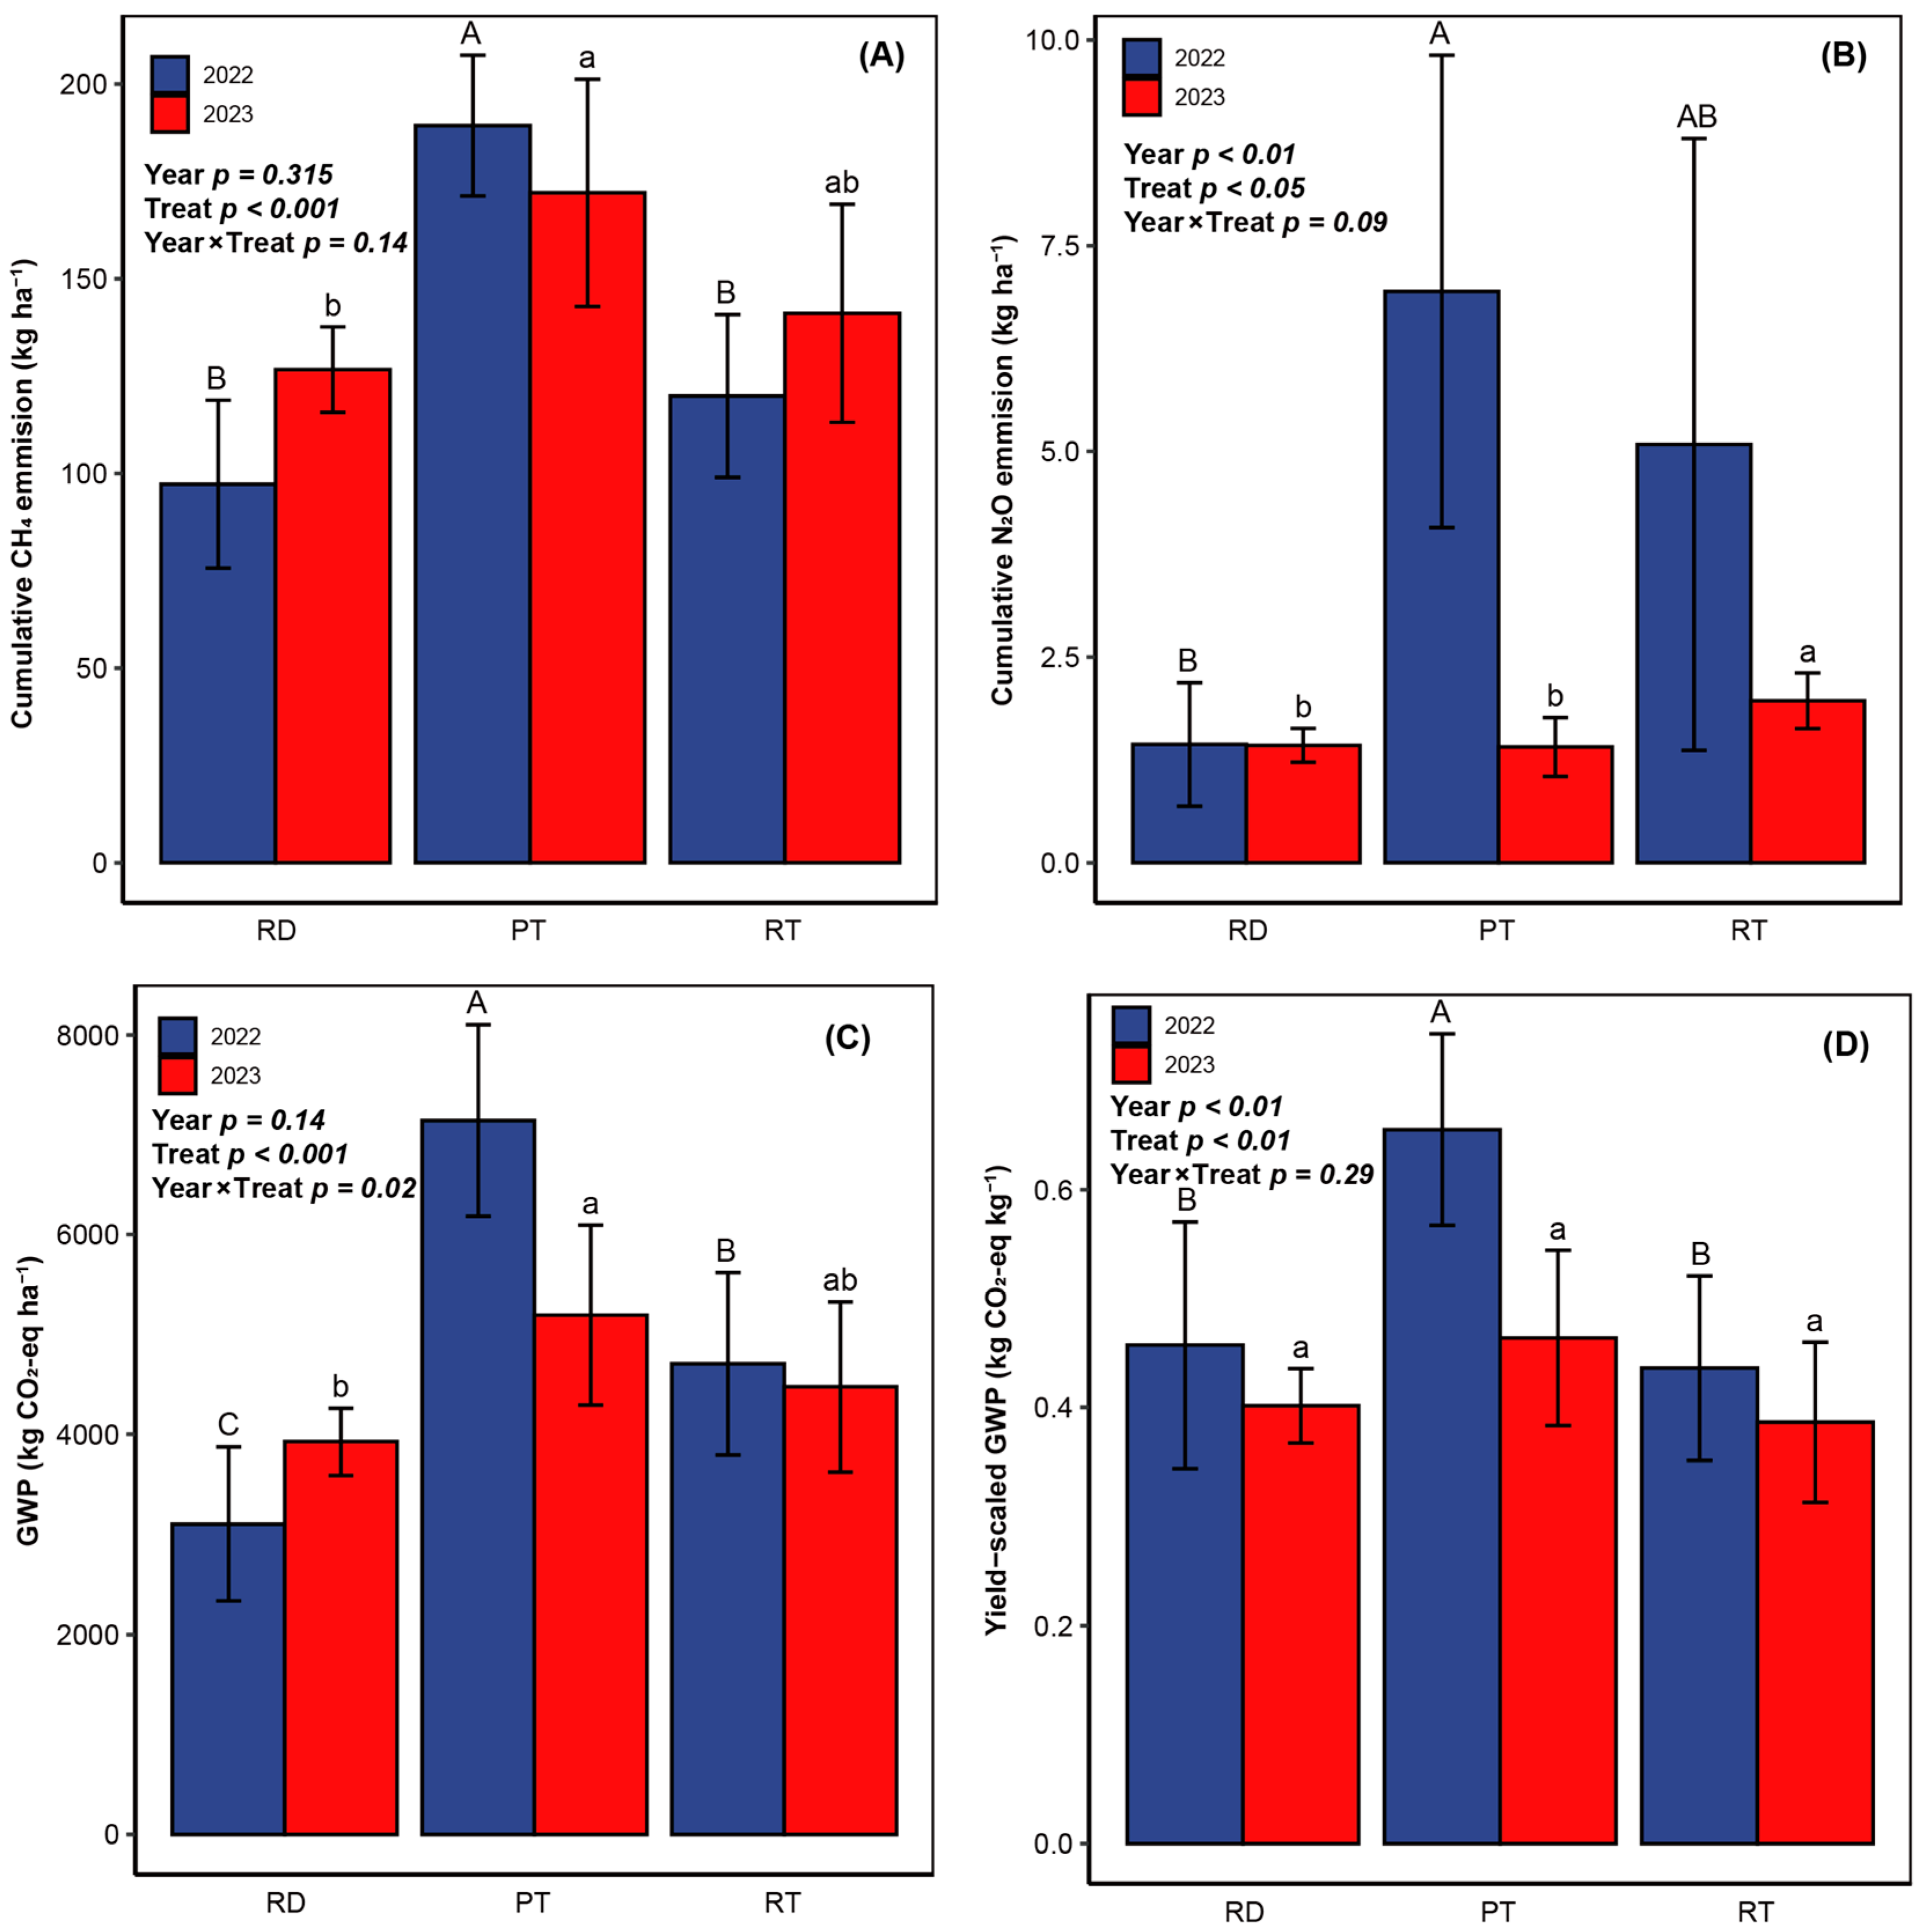
4.3. Global Warming Potential (GWP) and Yield-Scaled GWP
4.4. Abundances, Diversity, and Composition of Methanogens and Methanotrophs
4.5. Soil Nutrient Traits
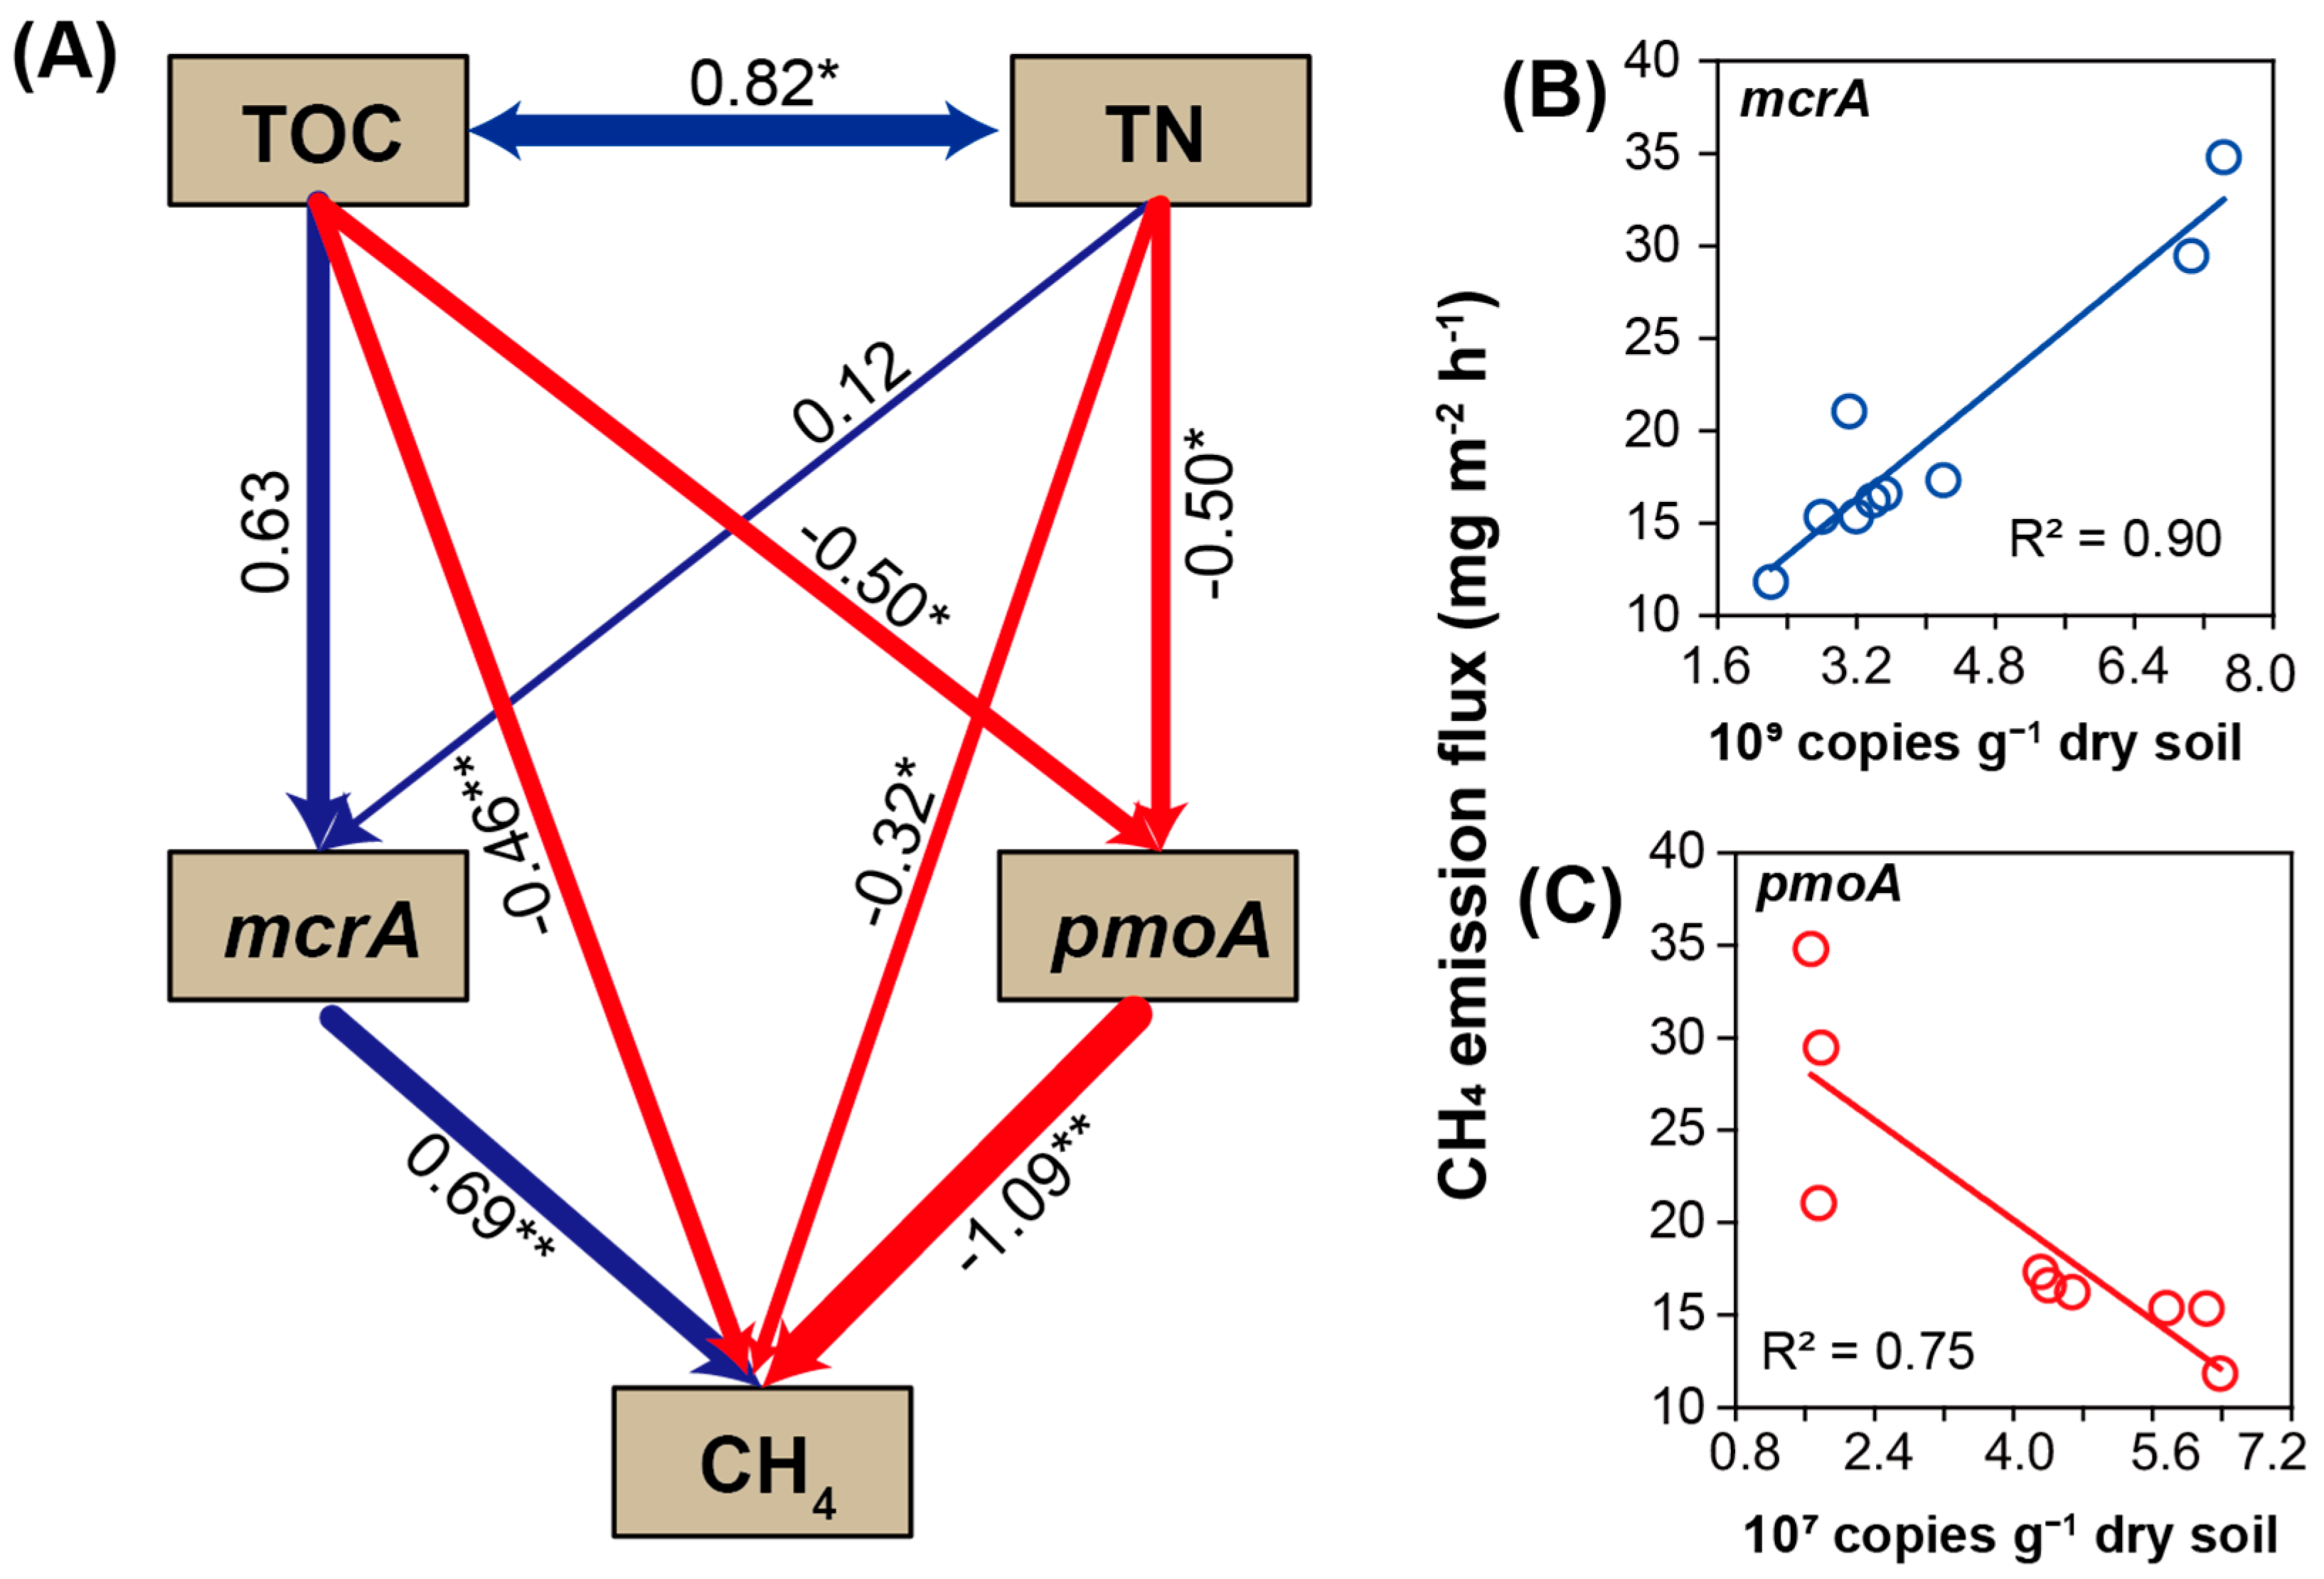
4.6. Structural Equation Modeling Analysis
5. Discussion
5.1. Rice Productivity and Global Warming Potential
5.2. Effects of Microbes, Function Genes, and Soil Nutrients on CH4 Emissions
5.3. Inherent Regulation Mechanism of CH4 Emission
6. Conclusions
Author Contributions
Funding
Institutional Review Board Statement
Data Availability Statement
Conflicts of Interest
References
- Li, W.; Zhu, Z.; Chern, M.; Yin, J.; Yang, C.; Ran, L.; Cheng, M.; He, M.; Wang, K.; Wang, J.; et al. A Natural Allele of a Transcription Factor in Rice Confers Broad-Spectrum Blast Resistance. Cell 2017, 170, 114–126.e15. [Google Scholar] [CrossRef] [PubMed]
- Linquist, B.A.; Adviento-Borbe, M.A.; Pittelkow, C.M.; van Kessel, C.; van Groenigen, K.J. Fertilizer Management Practices and Greenhouse Gas Emissions from Rice Systems: A Quantitative Review and Analysis. Field Crop. Res. 2012, 135, 10–21. [Google Scholar] [CrossRef]
- Hussain, S.; Peng, S.; Fahad, S.; Khaliq, A.; Huang, J.; Cui, K.; Nie, L. Rice Management Interventions to Mitigate Greenhouse Gas Emissions: A Review. Environ. Sci. Pollut. Res. 2015, 22, 3342–3360. [Google Scholar] [CrossRef] [PubMed]
- Roth, F.; Broman, E.; Sun, X.; Bonaglia, S.; Nascimento, F.; Prytherch, J.; Brüchert, V.; Lundevall Zara, M.; Brunberg, M.; Geibel, M.C.; et al. Methane Emissions Offset Atmospheric Carbon Dioxide Uptake in Coastal Macroalgae, Mixed Vegetation and Sediment Ecosystems. Nat. Commun. 2023, 14, 42. [Google Scholar] [CrossRef] [PubMed]
- Shakoor, A.; Shahbaz, M.; Farooq, T.H.; Sahar, N.E.; Shahzad, S.M.; Altaf, M.M.; Ashraf, M. A Global Meta-Analysis of Greenhouse Gases Emission and Crop Yield under No-Tillage as Compared to Conventional Tillage. Sci. Total Environ. 2021, 750, 142299. [Google Scholar] [CrossRef] [PubMed]
- Li, Z.; Zhang, Q.; Li, Z.; Qiao, Y.; Du, K.; Yue, Z.; Tian, C.; Leng, P.; Cheng, H.; Chen, G.; et al. Responses of Soil Greenhouse Gas Emissions to No-Tillage: A Global Meta-Analysis. Sustain. Prod. Consum. 2023, 36, 479–492. [Google Scholar] [CrossRef]
- Maucieri, C.; Tolomio, M.; McDaniel, M.D.; Zhang, Y.; Robatjazi, J.; Borin, M. No-Tillage Effects on Soil CH4 Fluxes: A Meta-Analysis. Soil Tillage Res. 2021, 212, 105042. [Google Scholar] [CrossRef]
- Huang, M.; Zhou, X.; Cao, F.; Xia, B.; Zou, Y. No-Tillage Effect on Rice Yield in China: A Meta-Analysis. Field Crop. Res. 2015, 183, 126–137. [Google Scholar] [CrossRef]
- Wang, Y.; Ying, H.; Yin, Y.; Wang, H.; Cui, Z. Benefits and Trade-Offs of Tillage Management in China: A Meta-Analysis. Agronomy 2021, 11, 1495. [Google Scholar] [CrossRef]
- Zheng, J.; Wu, Q.; Li, F. Rotary Tillage Combined with Reducing Nitrogen Application Decreased Greenhouse Gas Emission from Rice Fields in South China. J. Soil Sci. Plant Nutr. 2023, 23, 3349–3360. [Google Scholar] [CrossRef]
- Kim, S.Y.; Gutierrez, J.; Kim, P.J. Unexpected Stimulation of CH4 Emissions under Continuous No-Tillage System in Mono-Rice Paddy Soils during Cultivation. Geoderma 2016, 267, 34–40. [Google Scholar] [CrossRef]
- Yang, T.; Yang, Z.; Xu, C.; Li, F.; Fang, F.; Feng, J. Greenhouse Gas Emissions from Double-Season Rice Field under Different Tillage Practices and Fertilization Managements in Southeast China. Agronomy 2023, 13, 1887. [Google Scholar] [CrossRef]
- Zhang, L.; Zheng, J.; Chen, L.; Shen, M.; Zhang, X.; Zhang, M.; Bian, X.; Zhang, J.; Zhang, W. Integrative Effects of Soil Tillage and Straw Management on Crop Yields and Greenhouse Gas Emissions in a Rice–Wheat Cropping System. Eur. J. Agron. 2015, 63, 47–54. [Google Scholar] [CrossRef]
- Bharali, A.; Baruah, K.K.; Baruah, S.G.; Bhattacharyya, P. Impacts of Integrated Nutrient Management on Methane Emission, Global Warming Potential and Carbon Storage Capacity in Rice Grown in a Northeast India Soil. Environ. Sci. Pollut. Res. Int. 2018, 25, 5889–5901. [Google Scholar] [CrossRef] [PubMed]
- Pathak, H.; Sankhyan, S.; Dubey, D.S.; Bhatia, A.; Jain, N. Dry Direct-Seeding of Rice for Mitigating Greenhouse Gas Emission: Field Experimentation and Simulation. Paddy Water Environ. 2013, 11, 593–601. [Google Scholar] [CrossRef]
- Hang, X.; Zhang, X.; Song, C.; Jiang, Y.; Deng, A.; He, R.; Lu, M.; Zhang, W. Differences in Rice Yield and CH4 and N2O Emissions among Mechanical Planting Methods with Straw Incorporation in Jianghuai Area, China. Soil Tillage Res. 2014, 144, 205–210. [Google Scholar] [CrossRef]
- Lee, H.J.; Kim, S.Y.; Kim, P.J.; Madsen, E.L.; Jeon, C.O. Methane Emission and Dynamics of Methanotrophic and Methanogenic Communities in a Flooded Rice Field Ecosystem. FEMS Microbiol. Ecol. 2014, 88, 195–212. [Google Scholar] [CrossRef] [PubMed]
- Buan, N.R. Methanogens: Pushing the Boundaries of Biology. Emerg. Top. Life Sci. 2018, 2, 629–646. [Google Scholar] [CrossRef] [PubMed]
- Trotsenko, Y.A.; Murrell, J.C. Metabolic Aspects of Aerobic Obligate Methanotrophy. In Advances in Applied Microbiology; Elsevier: Amsterdam, The Netherlands, 2008; Volume 63, pp. 183–229. [Google Scholar] [CrossRef]
- Ermler, U.; Grabarse, W.; Shima, S.; Goubeaud, M.; Thauer, R.K. Crystal Structure of Methyl-Coenzyme M Reductase: The Key Enzyme of Biological Methane Formation. Science 1997, 278, 1457–1462. [Google Scholar] [CrossRef]
- Heděnec, P.; Alias, A.; Almahasheer, H.; Liu, C.; Chee, P.S.; Yao, M.; Li, X.; Vesterdal, L.; Frouz, J.; Kou, Y.; et al. Global Assessment of Soil Methanotroph Abundances across Biomes and Climatic Zones: The Role of Climate and Soil Properties. Appl. Soil Ecol. 2024, 195, 105243. [Google Scholar] [CrossRef]
- Kan, Z.-R.; Li, Y.; Yang, X.; Zhai, S.; Meng, Y.; Xu, C.; Qi, J.; Li, F.-M.; Chen, C.; Yang, H. Methane Emission under Straw Return Is Mitigated by Tillage Types Depending on Crop Growth Stages in a Wheat-Rotated Rice Farming System. Soil Biol. Biochem. 2023, 228, 105649. [Google Scholar] [CrossRef]
- Zhang, J.; Hang, X.; Lamine, S.M.; Jiang, Y.; Afreh, D.; Qian, H.; Feng, X.; Zheng, C.; Deng, A.; Song, Z.; et al. Interactive Effects of Straw Incorporation and Tillage on Crop Yield and Greenhouse Gas Emissions in Double Rice Cropping System. Agric. Ecosyst. Environ. 2017, 250, 37–43. [Google Scholar] [CrossRef]
- Deng, J.; Wang, G.; Zhu, Y.; Zhou, D.; Zhou, L.; Yuan, H.; Huang, D.; Jia, H. Conventional Tillage Combined with Residue Removal Reduces Growing-Season Methane Emissions in Flooded Paddy (Oryza sativa L. Subsp. Japonica Kato) Fields. Eur. J. Agron. 2022, 140, 126612. [Google Scholar] [CrossRef]
- Wang, H.; Shen, M.; Hui, D.; Chen, J.; Sun, G.; Wang, X.; Lu, C.; Sheng, J.; Chen, L.; Luo, Y.; et al. Straw Incorporation Influences Soil Organic Carbon Sequestration, Greenhouse Gas Emission, and Crop Yields in a Chinese Rice (Oryza sativa L.)–Wheat (Triticum aestivum L.) Cropping System. Soil Tillage Res. 2019, 195, 104377. [Google Scholar] [CrossRef]
- Yan, X.; Shi, S.; Du, L.; Xing, G. Pathways of N2O Emission from Rice Paddy Soil. Soil Biol. Biochem. 2000, 32, 437–440. [Google Scholar] [CrossRef]
- Wu, D.; Zhang, Y.; Dong, G.; Du, Z.; Wu, W.; Chadwick, D.; Bol, R. The Importance of Ammonia Volatilization in Estimating the Efficacy of Nitrification Inhibitors to Reduce N2O Emissions: A Global Meta-Analysis. Environ. Pollut. 2021, 271, 116365. [Google Scholar] [CrossRef] [PubMed]
- IUSS Working Group WRB. World Reference Base for Soil Resources 2014 (Update 2015): International Soil Classification System for Naming Soils and Creating Legends for Soil Maps; World Soil Resources Reports No. 106; Food and Agriculture Organization: Rome, Italy, 2015; pp. 12–21. [Google Scholar]
- Islam, S.F.; Sander, B.O.; Quilty, J.R.; de Neergaard, A.; van Groenigen, J.W.; Jensen, L.S. Mitigation of Greenhouse Gas Emissions and Reduced Irrigation Water Use in Rice Production through Water-Saving Irrigation Scheduling, Reduced Tillage and Fertiliser Application Strategies. Sci. Total Environ. 2020, 739, 140215. [Google Scholar] [CrossRef]
- Xu, C.; Shen, S.; Zhou, B.; Feng, Y.; He, Z.; Shi, L.; Wang, Y.; Wang, H.; Mishra, T.; Xue, L. Long-Term Non-Phosphorus Application Increased Paddy Methane Emission by Promoting Organic Acid and Methanogen Abundance in Tai Lake Region, China. Sci. Total Environ. 2023, 864, 161146. [Google Scholar] [CrossRef] [PubMed]
- IPCC. Climate Change 2013: The Physical Science Basis. Contribution of Working Group I to the Fifth Assessment Report of the Intergovernmental Panel on Climate Change; Cambridge University Press: Cambridge, UK; New York, NY, USA, 2013. [Google Scholar]
- Kunze, G.W.; Dixon, J.B. Pretreatment for Mineralogical Analysis. In Methods of Soil Analysis; SSSA Book Series; Wiley: Hoboken, NJ, USA, 1986; pp. 91–100. [Google Scholar] [CrossRef]
- CNCB-NGDC Members and Partners. Database Resources of the National Genomics Data Center, China National Center for Bioinformation in 2022. Nucleic Acids Res. 2022, 50, D27–D38. [Google Scholar] [CrossRef]
- Chen, S. Ultrafast One-Pass FASTQ Data Preprocessing, Quality Control, and Deduplication Using Fastp. iMeta 2023, 2, e107. [Google Scholar] [CrossRef]
- Martin, M. Cutadapt Removes Adapter Sequences from High-Throughput Sequencing Reads. EMBnet. J. 2011, 17, 10–12. [Google Scholar] [CrossRef]
- Edgar, R.C. Search and Clustering Orders of Magnitude Faster than BLAST. Bioinformatics 2010, 26, 2460–2461. [Google Scholar] [CrossRef]
- Fish, J.A.; Chai, B.; Wang, Q.; Sun, Y.; Brown, C.T.; Tiedje, J.M.; Cole, J.R. FunGene: The Functional Gene Pipeline and Repository. Front. Microbiol. 2013, 4, 291. [Google Scholar] [CrossRef]
- Wang, Q.; Quensen, J.F., 3rd; Fish, J.A.; Lee, T.K.; Sun, Y.; Tiedje, J.M.; Cole, J.R. Ecological Patterns of nifH Genes in Four Terrestrial Climatic Zones Explored with Targeted Metagenomics Using FrameBot, a New Informatics Tool. mBio 2013, 4, e00592-00513. [Google Scholar] [CrossRef]
- Edgar, R.C. SINTAX: A Simple Non-Bayesian Taxonomy Classifier for 16S and ITS Sequences. bioRxiv 2016, 074161. [Google Scholar] [CrossRef]
- R Core Team. R: A Language and Environment for Statistical Computing; R Foundation for Statistical Computing: Vienna, Austria, 2024. [Google Scholar]
- Rosseel, Y. Lavaan: An R Package for Structural Equation Modeling. J. Stat. Softw. 2012, 48, 1–36. [Google Scholar] [CrossRef]
- Zhang, C.; Hu, R. Adoption of Direct Seeding, Yield and Fertilizer Use in Rice Production: Empirical Evidence from China. Agriculture 2022, 12, 1439. [Google Scholar] [CrossRef]
- Kumar, V.; Ladha, J.K. Chapter Six—Direct Seeding of Rice: Recent Developments and Future Research Needs. In Advances in Agronomy; Sparks, D.L., Ed.; Academic Press: Cambridge, MA, USA, 2011; Volume 111, pp. 297–413. [Google Scholar] [CrossRef]
- Ling, L.; Shuai, Y.; Xu, Y.; Zhang, Z.; Wang, B.; You, L.; Sun, Z.; Zhang, H.; Zhan, M.; Li, C.; et al. Comparing Rice Production Systems in China: Economic Output and Carbon Footprint. Sci. Total Environ. 2021, 791, 147890. [Google Scholar] [CrossRef]
- Beare, M.H.; Gregorich, E.G.; St-Georges, P. Compaction Effects on CO2 and N2O Production during Drying and Rewetting of Soil. Soil Biol. Biochem. 2009, 41, 611–621. [Google Scholar] [CrossRef]
- Lu, C.; Yu, Z.; Hennessy, D.A.; Feng, H.; Tian, H.; Hui, D. Emerging Weed Resistance Increases Tillage Intensity and Greenhouse Gas Emissions in the US Corn–Soybean Cropping System. Nat. Food 2022, 3, 266–274. [Google Scholar] [CrossRef]
- Feng, J.; Chen, C.; Zhang, Y.; Song, Z.; Deng, A.; Zheng, C.; Zhang, W. Impacts of Cropping Practices on Yield-Scaled Greenhouse Gas Emissions from Rice Fields in China: A Meta-Analysis. Agric. Ecosyst. Environ. 2013, 164, 220–228. [Google Scholar] [CrossRef]
- Wang, J.; Ciais, P.; Smith, P.; Yan, X.; Kuzyakov, Y.; Liu, S.; Li, T.; Zou, J. The Role of Rice Cultivation in Changes in Atmospheric Methane Concentration and the Global Methane Pledge. Glob. Change Biol. 2023, 29, 2776–2789. [Google Scholar] [CrossRef]
- Xu, C.; Chen, L.; Chen, S.; Chu, G.; Wang, D.; Zhang, X. Effects of Rhizosphere Oxygen Concentration on Root Physiological Characteristics and Anatomical Structure at the Tillering Stage of Rice. Ann. Appl. Biol. 2020, 177, 61–73. [Google Scholar] [CrossRef]
- Das, S.; Kim, P.J. Rice Breeding for Low Methane and High Yields. Plant Commun. 2024, 5, 100924. [Google Scholar] [CrossRef] [PubMed]
- Man, M.; Tosi, M.; Dunfield, K.E.; Hooker, D.C.; Simpson, M.J. Tillage Management Exerts Stronger Controls on Soil Microbial Community Structure and Organic Matter Molecular Composition than N Fertilization. Agric. Ecosyst. Environ. 2022, 336, 108028. [Google Scholar] [CrossRef]
- Srour, A.Y.; Ammar, H.A.; Subedi, A.; Pimentel, M.; Cook, R.L.; Bond, J.; Fakhoury, A.M. Microbial Communities Associated With Long-Term Tillage and Fertility Treatments in a Corn-Soybean Cropping System. Front. Microbiol. 2020, 11, 1363. [Google Scholar] [CrossRef] [PubMed]
- Ling, J.; Zhou, J.; Wu, G.; Zhao, D.-Q.; Wang, Z.-T.; Wen, Y.; Zhou, S.-L. Deep-Injected Straw Incorporation Enhances Subsoil Quality and Wheat Productivity. Plant Soil 2022, 499, 207–220. [Google Scholar] [CrossRef]
- Liu, N.; Li, Y.; Cong, P.; Wang, J.; Guo, W.; Pang, H.; Zhang, L. Depth of Straw Incorporation Significantly Alters Crop Yield, Soil Organic Carbon and Total Nitrogen in the North China Plain. Soil Tillage Res. 2021, 205, 104772. [Google Scholar] [CrossRef]
- Yan, C.; Yan, S.-S.; Jia, T.-Y.; Dong, S.-K.; Ma, C.-M.; Gong, Z.-P. Decomposition Characteristics of Rice Straw Returned to the Soil in Northeast China. Nutr. Cycl. Agroecosyst. 2019, 114, 211–224. [Google Scholar] [CrossRef]
- Sources of Atmospheric Methane: Measurements in Rice Paddies and a Discussion—Cicerone—1981—Journal of Geophysical Research: Oceans—Wiley Online Library. Available online: https://agupubs.onlinelibrary.wiley.com/doi/10.1029/JC086iC08p07203 (accessed on 23 June 2024).
- Sandhu, N.; Sagare, D.B.; Singh, V.K.; Yadav, S.; Kumar, A. Environment-Friendly Direct Seeding Rice Technology to Foster Sustainable Rice Production. In Scaling-Up Solutions for Farmers: Technology, Partnerships and Convergence; Wani, S.P., Raju, K.V., Bhattacharyya, T., Eds.; Springer International Publishing: Cham, Switzerland, 2021; pp. 279–305. [Google Scholar] [CrossRef]
- Kline, R.B. Principles and Practice of Structural Equation Modeling, 4th ed.; Guilford Press: New York, NY, USA, 2016; 534p. [Google Scholar]
- Lyu, Z.; Liu, Y. Diversity and Taxonomy of Methanogens. In Biogenesis of Hydrocarbons; Stams, A.J.M., Sousa, D.Z., Eds.; Springer International Publishing: Cham, Switzerland, 2019; pp. 19–77. [Google Scholar] [CrossRef]
- Zhou, Z.; Liu, Y.; Pan, J.; Cron, B.R.; Toner, B.M.; Anantharaman, K.; Breier, J.A.; Dick, G.J.; Li, M. Gammaproteobacteria Mediating Utilization of Methyl-, Sulfur- and Petroleum Organic Compounds in Deep Ocean Hydrothermal Plumes. ISME J. 2020, 14, 3136–3148. [Google Scholar] [CrossRef]
- Adam, P.S.; Borrel, G.; Brochier-Armanet, C.; Gribaldo, S. The Growing Tree of Archaea: New Perspectives on Their Diversity, Evolution and Ecology. ISME J. 2017, 11, 2407–2425. [Google Scholar] [CrossRef] [PubMed]
- Song, Y.; Liu, C.; Wang, X.; Ma, X.; Jiang, L.; Zhu, J.; Gao, J.; Song, C. Microbial Abundance as an Indicator of Soil Carbon and Nitrogen Nutrient in Permafrost Peatlands. Ecol. Indic. 2020, 115, 106362. [Google Scholar] [CrossRef]


| Year | Treat | Seeding Date | Transplanting Date | Peak Tillering Date | Harvesting Date |
|---|---|---|---|---|---|
| 2022 | RD | 13 June | - | 22 July | 7 November |
| RT | - | 23 June | 24 July | 7 November | |
| PT | - | 23 June | 24 July | 7 November | |
| 2023 | RD | 12 June | - | 17 July | 4 November |
| RT | - | 17 June | 19 July | 4 November | |
| PT | - | 17 June | 19 July | 4 November |
| Treat | Methanogens | Methanotrophs | ||
|---|---|---|---|---|
| Chao1 | Shannon | Chao1 | Shannon | |
| RD | 496.37 a | 6.86 a | 437.29 a | 6.21 a |
| PT | 674.26 a | 7.06 a | 412.39 a | 6.12 a |
| RT | 625.52 a | 6.88 a | 412.03 a | 6.23 a |
| Treat | TOC (%) | TN (%) | TP (mg kg−1) | Olsen-P (mg kg−1) |
|---|---|---|---|---|
| RD | 1.98 c | 0.20 c | 743.37 a | 19.88 a |
| PT | 2.24 a | 0.22 a | 681.73 ab | 13.42 b |
| RT | 2.14 b | 0.21 b | 637.86 b | 14.55 ab |
Disclaimer/Publisher’s Note: The statements, opinions and data contained in all publications are solely those of the individual author(s) and contributor(s) and not of MDPI and/or the editor(s). MDPI and/or the editor(s) disclaim responsibility for any injury to people or property resulting from any ideas, methods, instructions or products referred to in the content. |
© 2024 by the authors. Licensee MDPI, Basel, Switzerland. This article is an open access article distributed under the terms and conditions of the Creative Commons Attribution (CC BY) license (https://creativecommons.org/licenses/by/4.0/).
Share and Cite
Shi, L.; Dong, L.; Zhang, J.; Huang, J.; Shen, Y.; Tao, Y.; Wang, H.; Lu, C. Rotary Tillage Plus Mechanical Transplanting Practices Increased Rice Yields with Lower CH4 Emission in a Single Cropping Rice System. Agriculture 2024, 14, 1065. https://doi.org/10.3390/agriculture14071065
Shi L, Dong L, Zhang J, Huang J, Shen Y, Tao Y, Wang H, Lu C. Rotary Tillage Plus Mechanical Transplanting Practices Increased Rice Yields with Lower CH4 Emission in a Single Cropping Rice System. Agriculture. 2024; 14(7):1065. https://doi.org/10.3390/agriculture14071065
Chicago/Turabian StyleShi, Linlin, Linlin Dong, Jun Zhang, Jing Huang, Yuan Shen, Yueyue Tao, Haihou Wang, and Changying Lu. 2024. "Rotary Tillage Plus Mechanical Transplanting Practices Increased Rice Yields with Lower CH4 Emission in a Single Cropping Rice System" Agriculture 14, no. 7: 1065. https://doi.org/10.3390/agriculture14071065