Article

Effects of Applying Biochar on Soil Cadmium Immobilisation and Cadmium Pollution Control in Lettuce (Lactuca sativa L.)

1
College of Engineering and Technology, Jilin Agricultural University, Changchun 130118, China
2
State Key Laboratory of Black Soils Conservation and Utilization, Northeast Institute of Geography and Agroecology, Chinese Academy of Sciences, Changchun 130102, China
*
Author to whom correspondence should be addressed.
Agriculture 2024, 14(7), 1068; https://doi.org/10.3390/agriculture14071068
Submission received: 2 June 2024 / Revised: 30 June 2024 / Accepted: 1 July 2024 / Published: 3 July 2024
(This article belongs to the Section Agricultural Soils)

Abstract

:
In order to analyse the impact of biochar in terms of reducing the bioavailability of cadmium (Cd) in soil, a study was conducted on the solidification effect of biochar on soil cadmium and its resistance to cadmium contamination in lettuce. In this study, soil which was contaminated with 10 mg/kg cadmium was used as the substrate; corn, rice, and wheat straw biochar were used as solidification and amendment materials; and lettuce (Lactuca sativa L. cv. Grand Rapids) was used as the test plant. The morphological characteristics of the biochar, soil pH, electrical conductivity, cation exchange capacity, and soil-available Cd, as well as lettuce plant height, fresh weight, and leaf Cd content, were measured and analysed. The results showed that all three types of biochar possessed distinct porous structures and functional groups such as hydroxyl, ether, and carbonyl groups. Increases in soil pH, electrical conductivity (EC), cation exchange capacity (CEC), lettuce plant height, and fresh weight were effectively promoted. Additionally, a significant reduction in the available Cd content in the soil and Cd content in lettuce leaves was observed, with the inhibitory effect becoming more pronounced as the biochar application rate increased. When 5% corn straw biochar was added (1 kg of substrate with 50 g of biochar), the best inhibitory effect on Cd contamination was observed, with a cadmium content of 4.63 mg/kg in lettuce leaves. The available Cd in the soil and the Cd content in lettuce leaves decreased by 32.00% and 49.78%, respectively, compared to the CK group (without biochar treatment). Additionally, the plant height and fresh weight of lettuce increased by 25.56% and 31.31%, respectively, compared to the CK group. This indicated that the application of straw biochar can stabilise soil Cd, reduce the availability of Cd in the soil, inhibit the transfer of Cd into lettuce, promote the growth of lettuce, and lower the ecological environmental risk of Cd. These research results can provide a theoretical basis and scientific guidance for the remediation of soil Cd contamination and the safe production of lettuce.

1. Introduction

With the rapid advancement of industrialization and urbanization in China, alongside the long-term improper use of pesticides and fertilizers in agricultural practices, the problem of heavy metal contamination in farmland soils is becoming increasingly serious. This poses severe threats to the ecological environment, food security, and public health [1]. In China, heavy metal contamination accounts for 82.4% of soil pollution, with a Cd contamination rate exceeding 7%, making Cd the primary pollutant in contaminated soil areas [2]. The emergence of ‘Itai-itai disease’ in Japan in the 1930s was also caused by Cd contamination. According to investigations conducted by the United States and the European Community, 82% to 94% of Cd released into the environment ends up in the soil through various pathways, with agricultural soil accounting for a significant portion of this [3]. Cd possesses strong biotoxicity and is difficult to degrade. Once absorbed and accumulated by plants, it not only affects growth and development, but also poses a threat to human health via effects throughout the food chain [4]. Therefore, improving and remediating Cd-contaminated soil is crucial for ensuring food security.
Biochar is defined as a highly aromatic, carbon-rich solid particulate material obtained from the pyrolysis of biomass at high temperatures under oxygen-limited or oxygen-free conditions [5]. During its preparation, biochar generates a large number of alkaline functional groups, making it alkaline. These functional groups in biochar mainly originate from surface oxides and hydroxyl groups. Under conditions of higher pH, these functional groups exist in the form of anions and can undergo complexation reactions with H+, thereby organic anions represent another form of alkaline substances in biochar. When biochar is applied to the soil, the soil’s pH can be increased, thereby promoting the transformation of free Cd ions into residual forms. This results in a reduction in the bioavailability of Cd in the soil and promotes its immobilization [6]. Additionally, biochar, with its abundant pore structure and large specific surface area, can effectively adsorb Cd in the soil [7]. Furthermore, the surface of biochar is rich in organic oxygen-containing functional groups, including carbonyl and carboxyl groups, which can complex with Cd ions, thereby exerting a passivating effect on Cd contamination in the soil [8,9]. Biochar not only significantly alters the labile Cd content in the soil, reducing its bioavailability, but also effectively improves soil quality and increases crop yield. Therefore, biochar holds great promise for the prevention and control of Cd contamination in soil.
Currently, extensive research is being conducted by numerous scholars on the role of biochar in the mitigation of Cd contamination in plants. Tahir et al. [10] studied the effects of rice straw biochar on Cd immobilisation in soil and its uptake by wheat. The results indicated that the application of rice straw biochar effectively immobilised Cd in the soil and reduced the absorption and translocation of Cd by the crop. Yan et al. [11] explored the remediation effects of chicken manure biochar on Cd contamination in soil. The results demonstrated that chicken manure biochar significantly increased soil pH, which promoted the transformation of Cd from a bioavailable product into a less bioavailable form. Fang et al. [12] developed a novel sludge biochar and conducted pot experiments to study its effectiveness in remediating Cd-contaminated soil. The results indicated that the sludge biochar immobilized Cd in the soil and effectively reduced Cd accumulation in various parts of pak choi, thus lowering its bioavailability. Liu et al. [13] investigated the effects of different application rates of bamboo biochar and rice straw biochar on Cd availability in soil and Cd accumulation in pak choi. The results indicated that, when the application rate exceeded 2.5%, the biochar immobilized Cd in contaminated agricultural soil, effectively reducing the bioconcentration factor (BCF) in pak choi.
The aforementioned research indicates that all four types of biochar—straw, livestock manure, sludge, and wood—can reduce the bioavailability of Cd in the soil. However, livestock manure and sludge biochars pose a risk of secondary pollution, while wood biochar has lower nutrient and ash content. Straw biochar is more suitable for the remediation of Cd-contaminated soils [14,15]. Currently, there are relatively few studies comparing the effectiveness of different types of straw biochar in immobilising and controlling Cd contamination in soils.
Therefore, in order to compare the immobilization of Cd pollution in soil and its inhibitory effect on Cd contamination in lettuce using different types and doses of straw biochar, the effects of different types and doses of straw biochar on soil pH, EC, CEC, and available Cd, as well as on lettuce plant height, fresh weight, and Cd content in leaves in conditions of Cd contamination, were studied. This research aimed to provide a scientific basis for safe lettuce production and sustainable agricultural development.

2. Materials and Methods

2.1. Materials and Experimental Design

2.1.1. Materials

The experimental soil used was a full-value seedling substrate purchased from Changchun Saishi Agricultural Development Co., Ltd (Changchun, China). It was characterised by an organic matter content of 12.59 g/kg, a total nitrogen content of 0.727 g/kg, an available phosphorus content of 0.007 g/kg, an available potassium content of 0.15 g/kg, a pH value of 6.15, an electrical conductivity (EC) of 712 μS/cm, and a cation exchange capacity (CEC) of 14.33 cmol/kg.
In this study, common rice straw biochar, wheat straw biochar, and corn straw biochar were selected for use in the experiments. Research has shown that the conversion of available Cd is positively correlated with the amount of added biochar [16]. Significant remediation effects on Cd-contaminated soil were observed with the addition of straw biochar at a rate of 5% [17]. Therefore, biochar addition rates of 1%, 3%, and 5% were chosen, with untreated, biochar-free soil serving as the control treatment (CK). Previous studies have indicated that the optimal preparation temperature for straw biochar is 500 °C [14], which was therefore selected for this study.
Corn straw biochar and rice straw biochar were obtained from Henan Lize Environmental Protection Technology Co., Ltd. (Gongyi, China), while wheat straw biochar was obtained from Nanjing Surui Agricultural Development Co., Ltd (Nanjing, China). The preparation conditions were as follows: First, the collected straw raw materials were cleaned to remove surface contaminants, washed with distilled water, dried, and cut into small pieces. Next, the straw was pulverised using a multifunctional grinder (JF-80, Hanlong Machinery Co., Ltd. (Binzhou, China). The pulverised straw was subsequently sieved through a 60-mesh sieve. Finally, the straw was subjected to high-temperature pyrolysis and carbonisation in a carbonisation furnace (LZ-SYL850-1250, Henan Lize Environmental Technology Co., Ltd.) at a constant temperature of 500 °C for 2 h, with a heating rate of 5 °C/min. The pH values of the corn straw biochar, rice straw biochar, and wheat straw biochar were measured at 9.46, 9.12, and 9.27, respectively.

2.1.2. Experimental Design

In the “Soil Environmental Quality Risk Control Standard for Agricultural Land (GB15618-2018)” [18], the maximum permissible Cd pollution control value for agricultural land is 4 mg/kg (pH > 7.5). Experimental concentrations were set at 2.5 times this risk control value [19,20]. Therefore, soil contaminated with 10 mg/kg of Cd was selected as the test subject for conducting biochar mitigation experiments.
The pot experiment was completed in September 2023 on the campus of Jilin Agricultural University in Changchun, Jilin Province (125°42′ E, 43°82′ N), China. First, impurities were removed from the soil matrix using a 2 mm mesh sieve, and the sieved matrix was placed in a dry, ventilated area for 3 days. Next, a 200 mL solution was prepared, using distilled water as the solvent and Cd nitrate as the exogenous Cd source, and it was sprayed layer by layer onto the experimental soil matrix. The soil was thoroughly mixed to maintain a moisture content of 60–70%, and then aged for 10 days. After aging, different mass fractions of various types of straw biochar were added to the soil, which was then maintained at a moisture content of 60–70% and aged for another 30 days before we measured the soil properties. After measuring the soil properties, the soil was placed into flowerpots with dimensions of 480 mm × 230 mm × 160 mm, with 1.5 kg of matrix soil in each pot [21,22]. Finally, lettuce (Lactuca sativa L. cv. Grand Rapids) seedlings, which showed consistent growth and were in good condition, were selected and transplanted into the flowerpots. At this stage, the lettuce had developed two leaves and one heart leaf. Throughout the entire growth period, an adequate water supply was maintained to facilitate normal growth. Additionally, the position of the flowerpots was changed every two days to ensure uniform exposure to sunlight. Given that the growth cycle of lettuce is 6–8 weeks, the harvest period was determined to be around 45 days, i.e., the maturity period. Testing mature lettuce can enhance food safety supervision by ensuring that the lettuce available in the market meets the Cd content standards, thereby safeguarding consumer rights.
Therefore, this study utilized straw biochar as a solidification and amendment material, applying different types and amounts of biochar to Cd-contaminated soil. After a 30-day aging period, lettuce was planted. Soil pH, electrical conductivity (EC), cation exchange capacity (CEC), and available Cd content in the soil, as well as the height, fresh weight, and Cd content in lettuce leaves at maturity, were detected and analyzed.

2.2. Characterization Analysis of Biochar from Different Feedstocks

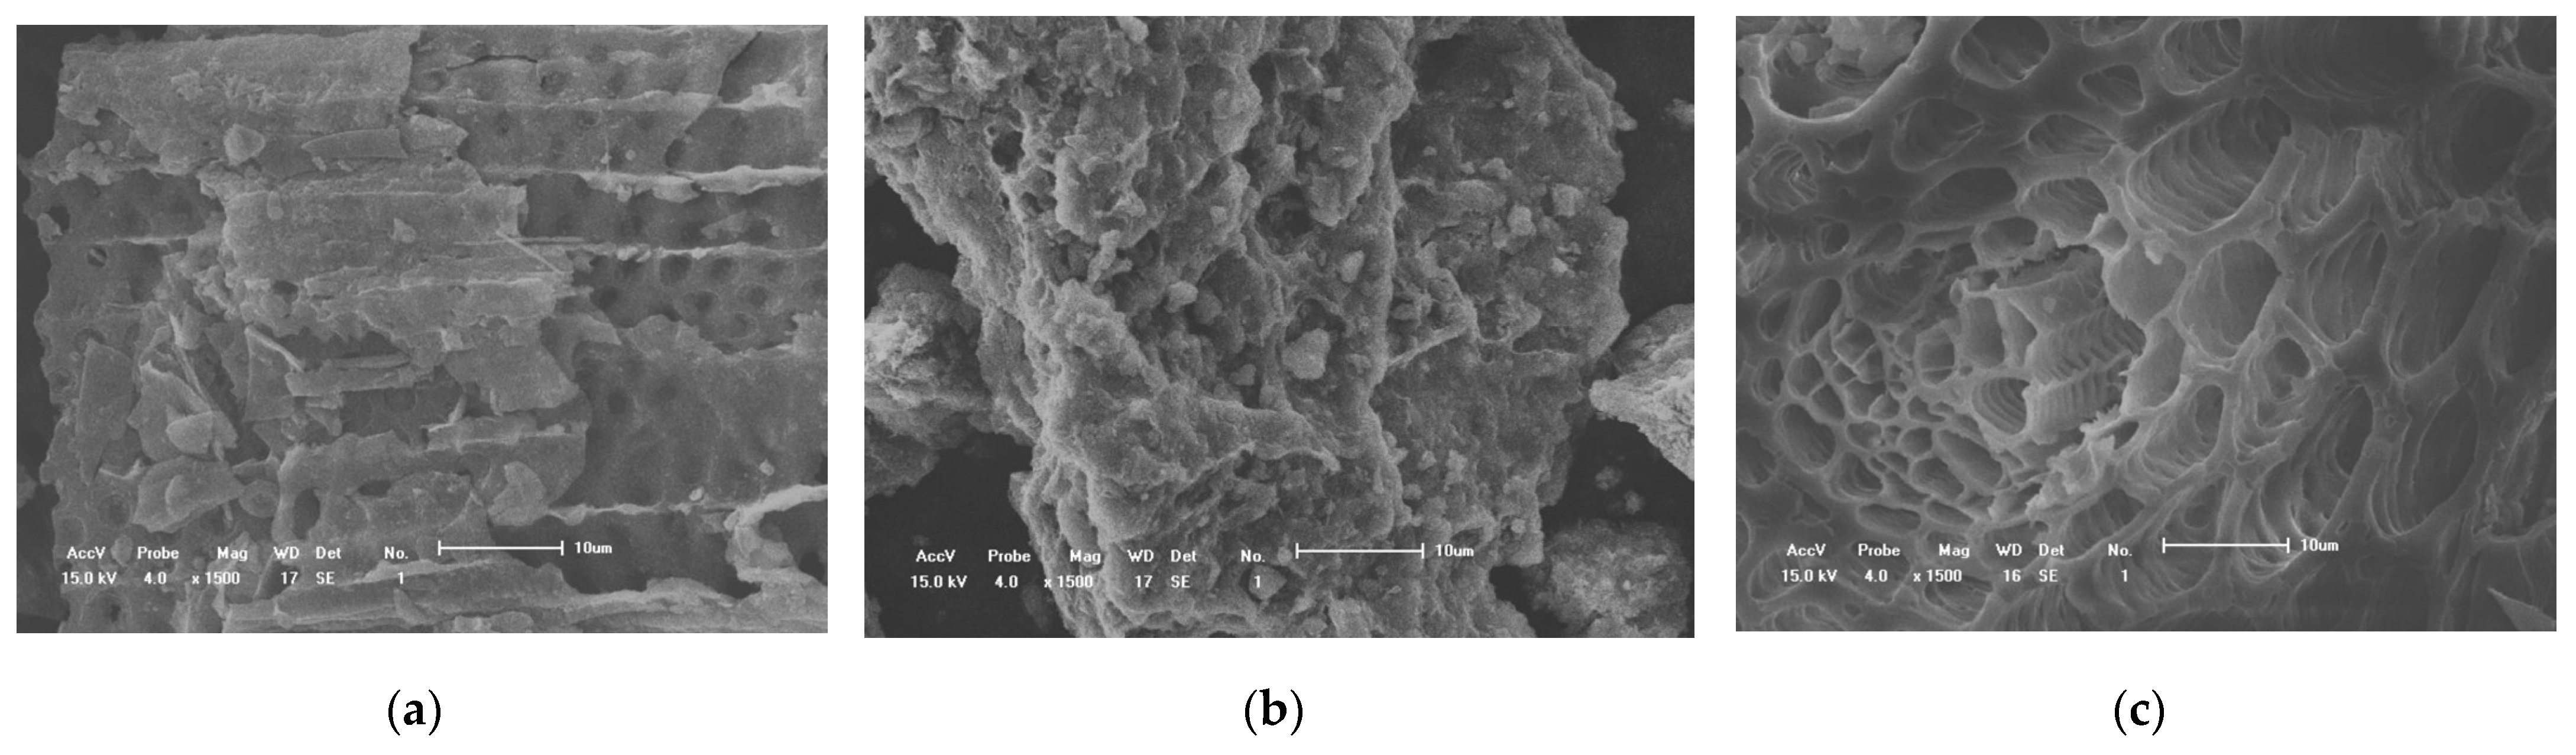
2.2.1. Scanning Electron Microscope (SEM)

Various straw biochars were dried at 105 °C for 8 h using an electric constant-temperature blast drying oven (DHG-9053A, Shanghai Jinghong Experimental Equipment Co., Ltd., Shanghai, China). After drying, small amounts of the dried straw biochar samples were affixed to sample holders. These were observed under vacuum conditions using a Quanta 200 scanning electron microscope (FEI Company, Eindhoven, The Netherlands) with an accelerating voltage of 15 kV in order to gather surface information on the different straw biochar materials.

2.2.2. Specific Surface Area (SSA) and Pore Size Analysis

We weighed 0.2 g of various dried straw biochar materials and then subjected them to vacuum degassing at 105 °C for 4 h. Subsequently, the specific surface area of these biochar materials was analyzed using a BELSORP MaxII surface area analyzer (Micromeritics, Osaka, Japan). Nitrogen gas adsorption–desorption tests were conducted under liquid nitrogen (77 K) conditions, and isothermal adsorption–desorption curves were obtained. The data were processed using models such as BET, BJH, and HK.

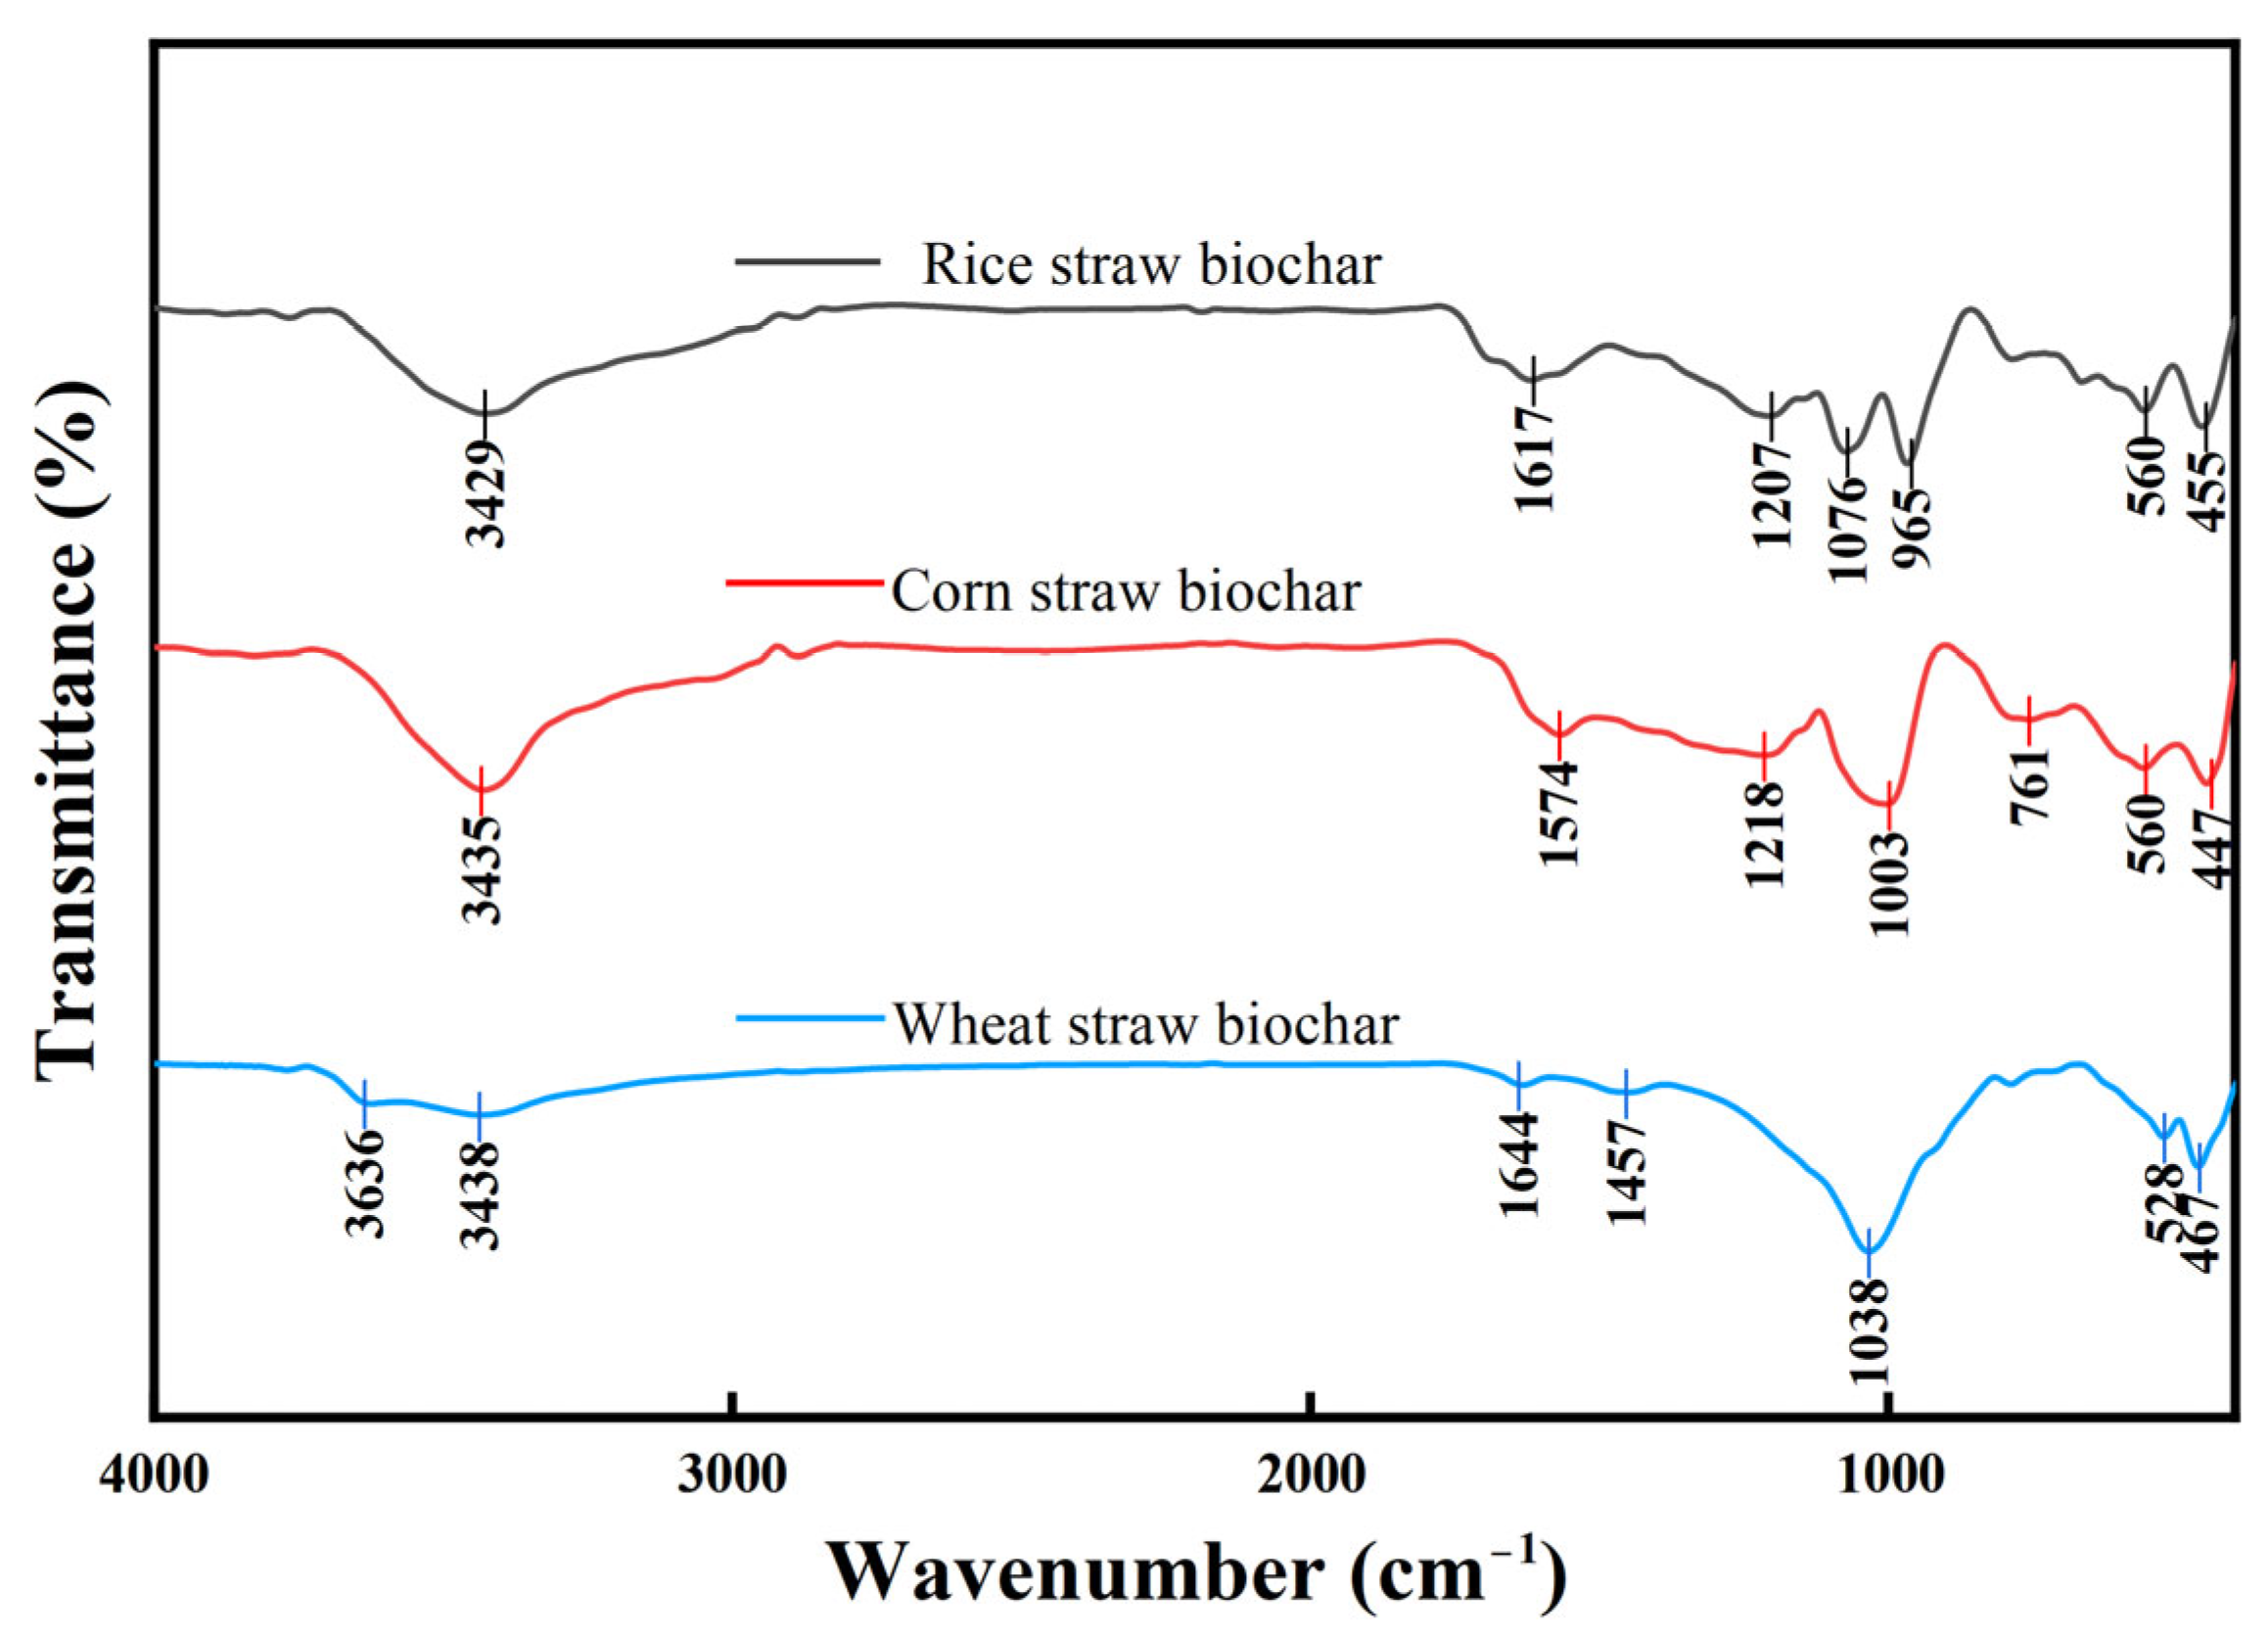
2.2.3. Fourier Transform Infrared Spectroscopy (FTIR)

The functional groups of various straw biochar materials were characterized using an IRTracer 100 Fourier Transform Infrared Spectroscopy (FTIR) instrument (Shimadzu, Kyoto, Japan). The dried biochar samples were ground into powder, with 1–2 mg of each sample weighed out and uniformly mixed with KBr at a mass ratio of 1:100. The KBr was ground to a particle size of 200 mesh and dried for 1 h at 60 °C. The mixed powder was then placed into a mold, leveled, and pressed into circular discs using a pellet press. The discs were carefully removed and subjected to infrared spectroscopy. The scanning range was set from 4000 to 400 cm−1 with a resolution of 0.1 cm−1.

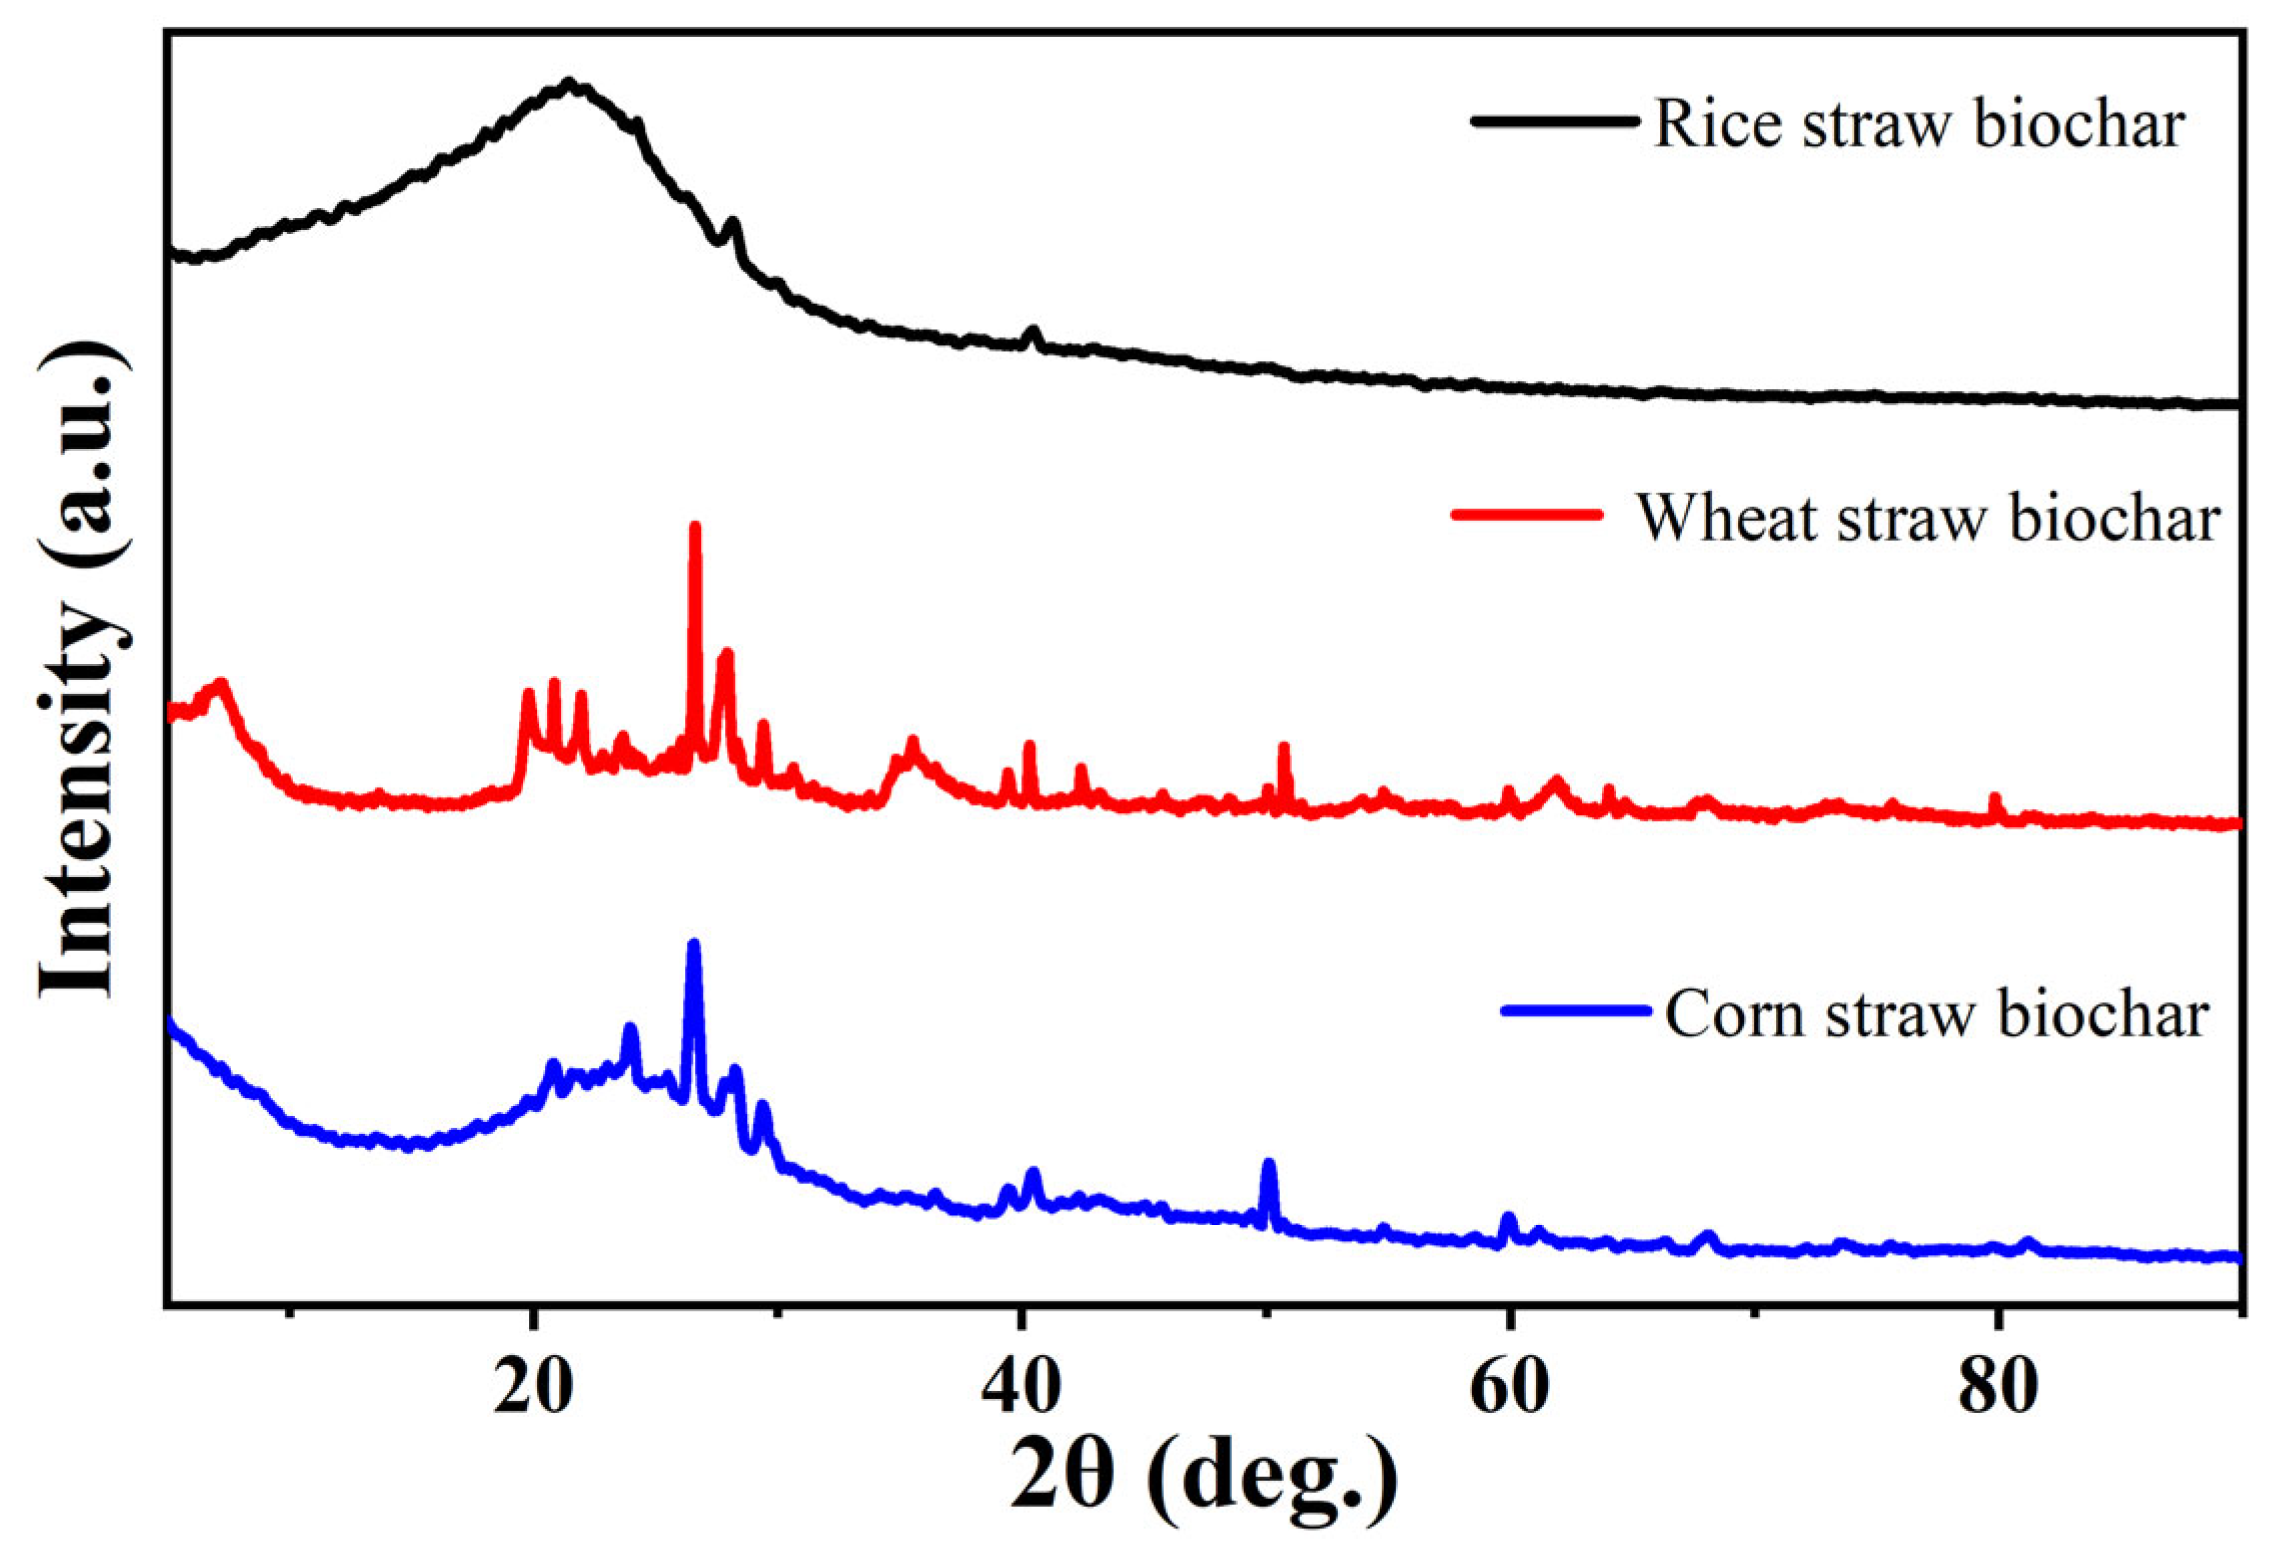
2.2.4. X-ray Diffraction Analysis (XRD)

We took 1–2 mg of powdered biochar sample, passed it through a 200-mesh sieve, and placed it on a powder sample holder for X-ray diffraction analysis using a D8 Advance X-ray diffractometer (Bruker, Karlsruhe, Germany). The testing conditions for determining the crystalline structure of various straw biochars included a tube voltage of 40 kV, a tube current of 40 mA, a step size of 0.04°, a scanning speed of 5°/min, and a scanning range from 5 to 90°.

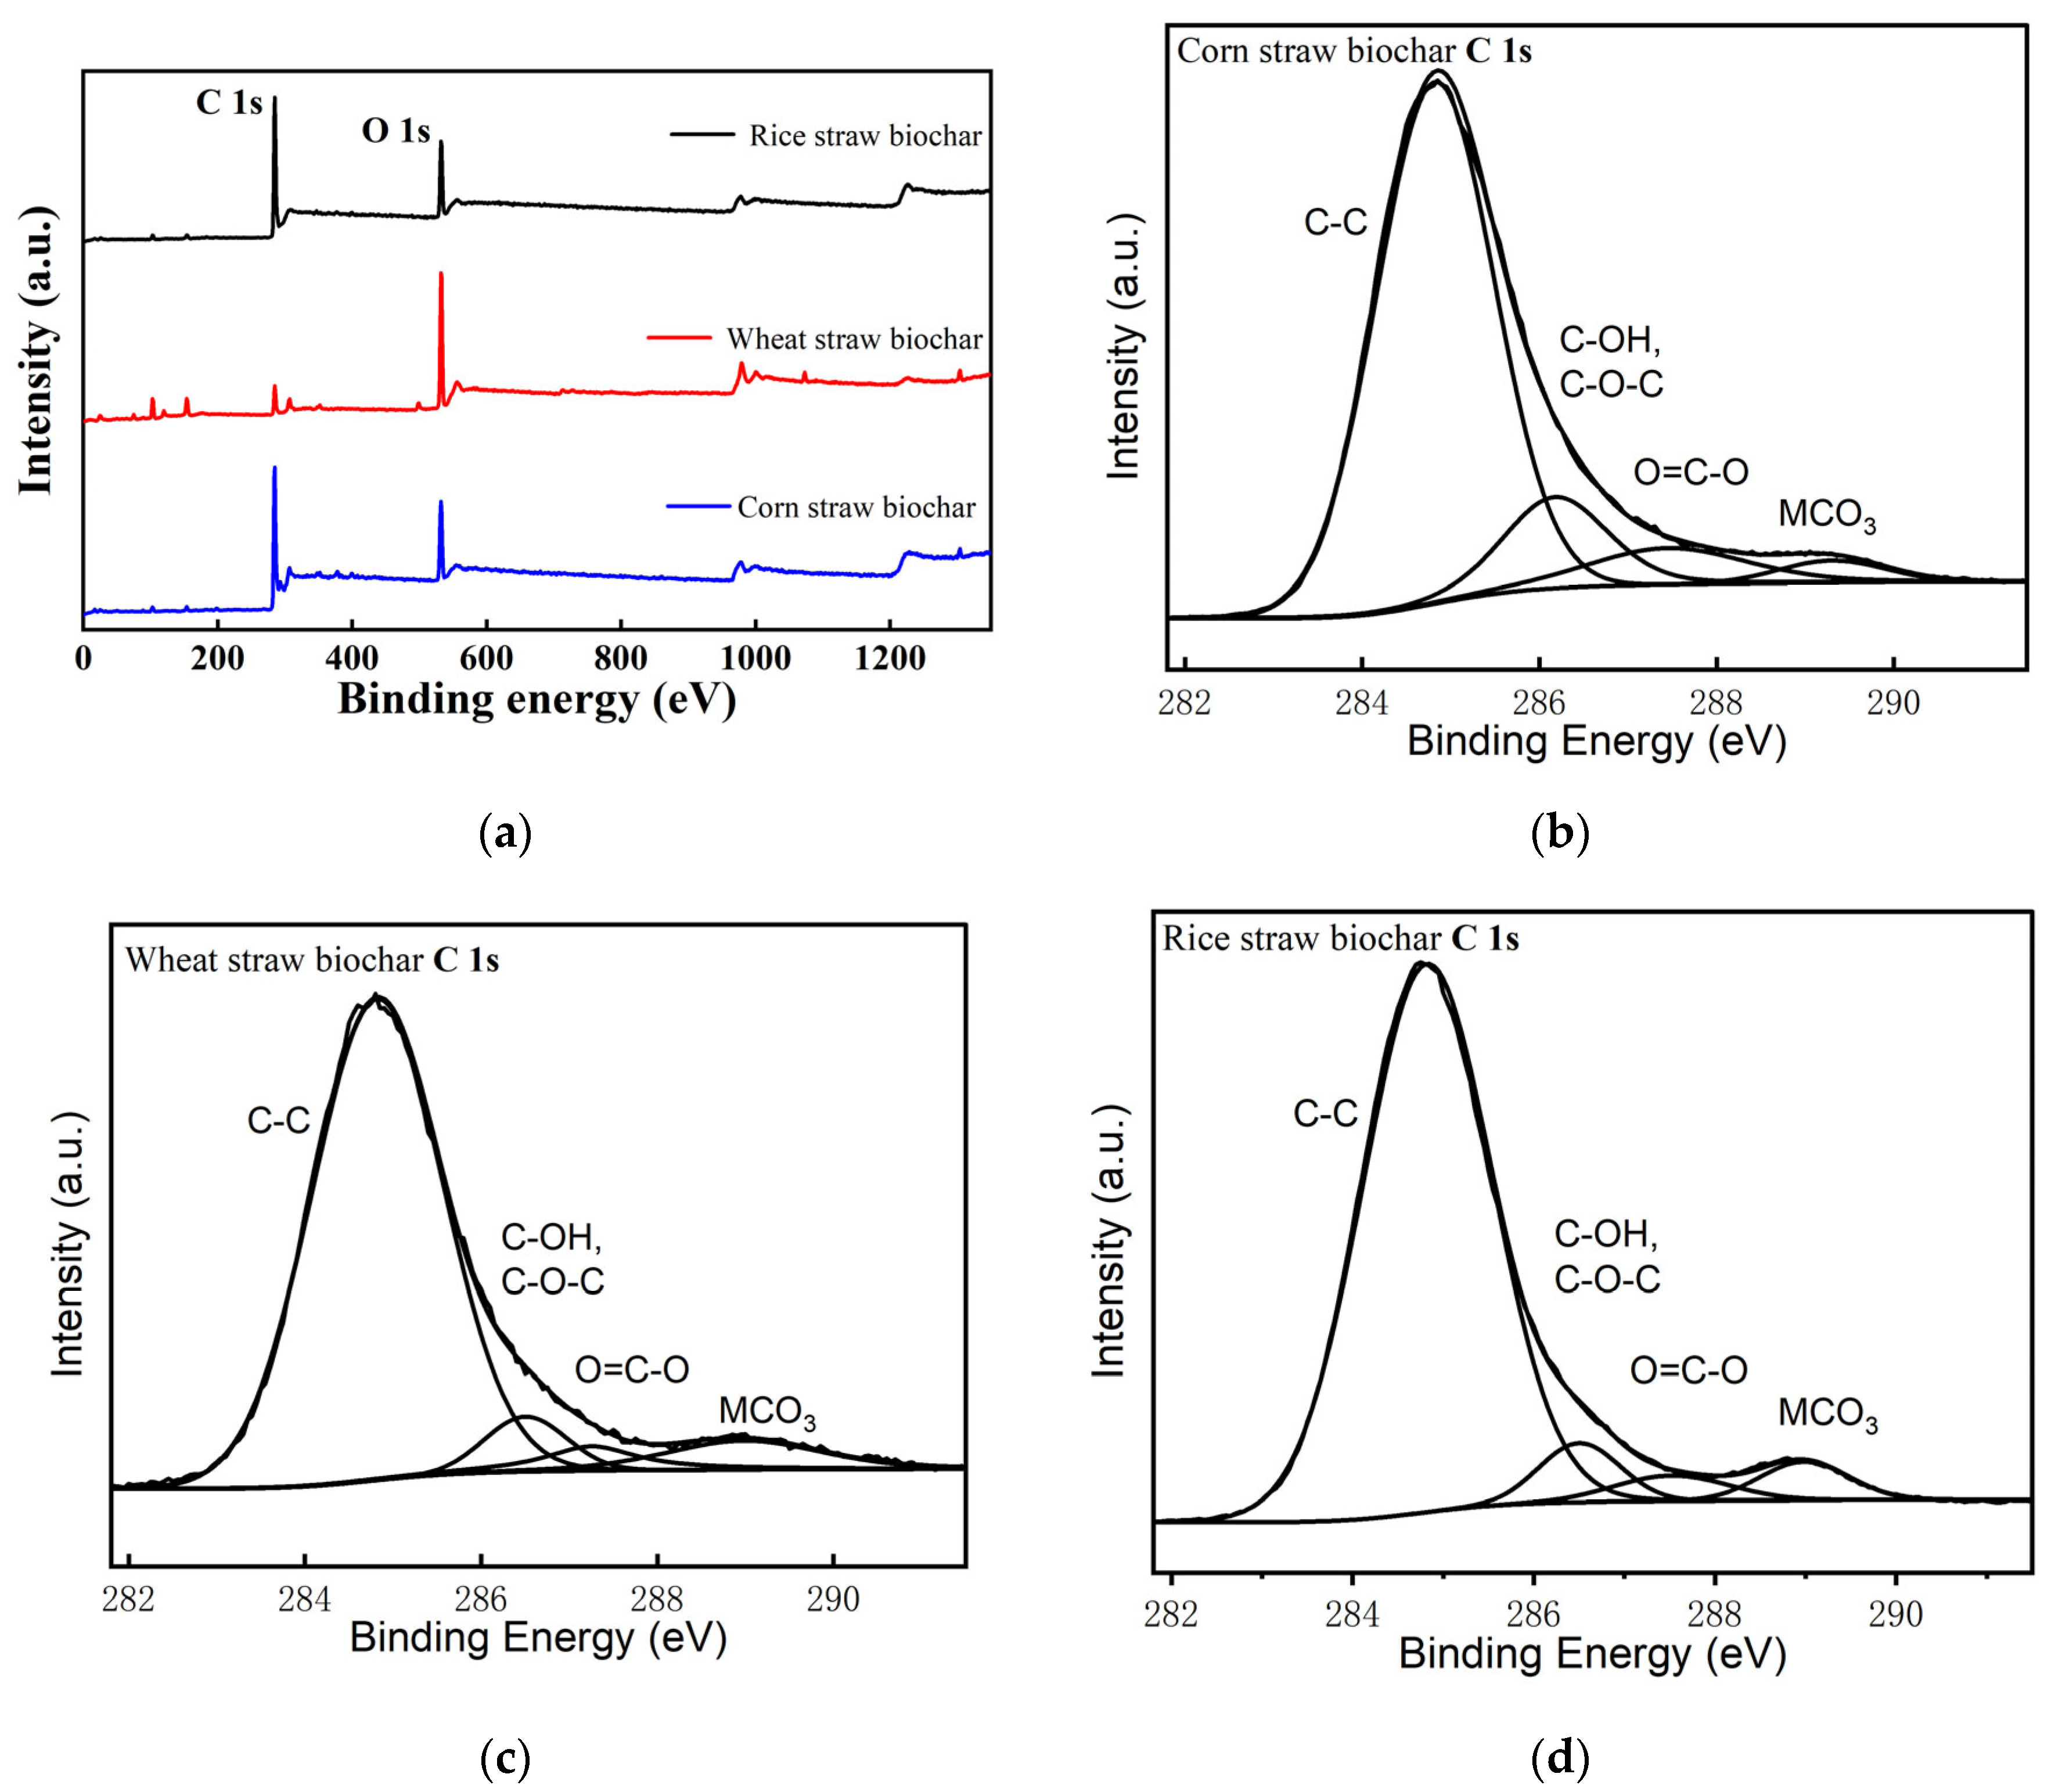
2.2.5. X-ray Photoelectron Spectroscopy Analysis (XPS)

The chemical binding states of major elements in various straw biochars were determined using X-ray photoelectron spectroscopy (THERMO SCIENTIFIC ESCALAB 250Xi, Thermo Fisher Scientific, Waltham, MA, USA). Sample preparation involved drying the samples, which were then uniformly spread onto double-sided tape and affixed to tin foil. The samples were compacted using a pellet press, and the tin foil with the covered samples was subsequently attached to the sample holder. Full-spectrum testing conditions included a pass energy of 100 eV, a step size of 1 eV, and an applied voltage of 12 kV. The survey spectrum testing conditions included a pass energy of 20 eV and a step size of 0.05 eV, as well as an applied voltage of 12 kV.

2.3. Soil Environmental Factor Detection

2.3.1. Soil pH Determination

Some 10.00 g of an air-dried soil sample was weighed into a 50 mL conical flask, and 25 mL of distilled water was then added. It was shaken for 2–3 min to fully disperse the soil particles. After being left to stand for 30 min, the pH was measured using a pH meter (PHS-3E, Shanghai INESA Scientific Instrument Co., Ltd., Shanghai, China) with a soil-to-water ratio of 1:2.5.

2.3.2. Soil Cation Exchange Capacity (CEC) Determination

The soil cation exchange capacity was determined using the cobaltihexamine trichloride spectrophotometric method [23]. A 3.5 g soil sample was taken and placed in a 100 mL centrifuge tube. Then, 50.0 mL of cobalt hexamine chloride solution was added to it, and the tube was tightly sealed with a cap. The tube was positioned on a shaker (HY-5, Changzhou Guoyu Instrument Manufacturing Co., Ltd., Changzhou, China) and oscillated at (20 ± 2) °C for (60 ± 5) min, with the oscillation frequency adjusted to maintain the suspended state of the soil extraction mixture. Subsequently, the mixture was centrifuged at 4000 r/min for 10 min using a low-speed centrifuge (MD-550A, Merck Instruments Co., Ltd., Shanghai, China), and the supernatant was collected in a colorimetric tube. The analysis had to be completed within 24 h. Spectrophotometry was used to calculate the cation exchange capacity. A laboratory blank sample was prepared by replacing the soil with distilled water and following the same preparation steps used for the test samples.

2.3.3. Soil Electrical Conductivity (EC) Determination

A 10.00 g air-dried soil sample was weighed into a 100 mL conical flask, and 50 mL of distilled water was added. The mixture was thoroughly stirred and left to stand for 5 min before the electrical conductivity was measured using a conductivity meter (TDS-3-in-1, Shandong Holder Electronic Technology Co., Ltd., Weifang, China) with a soil-to-water ratio of 1:5.

2.3.4. Soil-Available Cd Determination

A 10 g air-dried soil sample was placed in a 50 mL conical flask. Then, 50 mL of DTPA extraction solution (pH 7.3, containing 5 mmol·L−1 DTPA, 0.01 mol·L−1 CaCl2, and 0.1 mol·L−1 triethanolamine) was added. The sample was extracted by shaking at 180 r/min for 2 h at 20–25 °C. After extraction, the mixture was centrifuged at 4500 r/min for 10 min, and the resulting supernatant was filtered through a 0.22 μm membrane filter to remove impurities, thus producing the test solution. Finally, the cadmium content in the solution was measured using ICP-MS (Perkinelmer 300D, Waltham, MA, USA), with a blank test conducted under identical conditions but without adding soil samples.

2.4. Determination of Lettuce Plant Height and Fresh Weight

The height of the lettuce plants was measured using a ruler, and the longest distance from the base of the stem to its top was recorded as the plant height. The fresh weight of the plants was determined by rinsing the harvested lettuce plants with tap water and drying them before weighing them using an electronic scale (Kaifeng Group Co., Ltd., Yongkang, China) with a precision of 0.01 g. Each treatment was replicated three times, and the average value was taken.

2.5. Leaf Cd Content Determination

Due to the stronger physiological activity of the top leaves, there was a better opportunity to observe the physiological response of the plants to environmental pollution. Additionally, as Cd was more prone to migrate and accumulate in new leaves, the 1st to 3rd leaves from the top were the best positions for detecting the substance content in crops. These leaves were more representative across different growth stages compared to the lower leaves [24,25]. Furthermore, since the top leaf 1 was not fully expanded, the measurement was performed on top leaf 2 or top leaf 3. The collected leaves were washed, dried, and set aside for use.
First, 0.10 g to 0.70 g of the sample was placed in a dry polytetrafluoroethylene microwave tube, and 10 mL of high-purity concentrated nitric acid was added. The mixture was oscillated for 1 min, and then the polytetrafluoroethylene digestion tube was placed in a 120 °C reactor for pre-digestion for 20 min. The process was stopped when a small amount of yellow smoke emerged from the digestion vessel, and the tube was cooled to room temperature. Next, 5 mL of high-purity concentrated nitric acid was added to the pre-digested microwave tube, and it was subjected to microwave digestion using a Touchwin 2.0 microwave digestion instrument. Afterwards, the digestion solution was diluted to 50 mL in a centrifuge tube by adding ultrapure water three times, and this was shaken for 1 min to ensure thorough mixing. Then, the sample was passed through a 0.22 μm filter membrane to remove impurities. Finally, the Cd content in the leaves was measured using an Inductively Coupled Plasma-Mass Spectrometer (ICP-MS, 300D, Perkinelmer). Each treatment was repeated three times, and the average values were taken.

2.6. Data Processing and Analysis

The collected data were statistically analysed using Excel 2010. FTIR, XRD, and XPS spectra were plotted using Origin 2021, with the Correlation Plot plugin employed to create correlation heatmaps. Single-factor analysis of variance was conducted in SPSS 23, and the Duncan method was used to compare the significant differences in soil pH, EC, CEC, available Cd, lettuce plant height, fresh weight, and leaf Cd content among different treatments.
Significance testing was used to determine the significant differences among the mean values of soil pH, EC, CEC, available cadmium, lettuce plant height and fresh weight, and leaf cadmium content across different treatments. Significance testing is a statistical method used to assess whether differences between different treatment groups (or populations, samples) are significant. In significance testing, a significance level (α) is set, commonly at 0.05 or 0.01. During significance testing, the computed p-value is compared to the chosen significance level. If p < 0.05 or p < 0.01, the difference is considered significant or highly significant.

3. Results and Discussion

3.1. Characterization Analysis of Different Biochar Materials

3.1.1. Scanning Electron Microscope (SEM) Analysis

Figure 1 shows SEM images of biochar materials derived from corn, wheat, and rice straw. All three types of biochar exhibit porous structures on surfaces, but there are certain differences in terms of pore structure and quantity. The biochar derived from corn straw presents a circular pore structure with a smooth surface. The biochar derived from wheat straw has a relatively rough surface, displaying uneven layered pores of varying sizes, and is accompanied by granular impurities. The biochar derived from rice straw has a smooth surface, featuring a diverse honeycomb-like porous structure that is relatively densely distributed. The adsorption capacity of biochar is closely related to its specific surface area and porosity. The greater the specific surface area and porosity of the biochar material, the stronger its adsorption capacity for heavy metals [26].

3.1.2. Analysis of Pore Structure

Table 1 presents the pore parameters of different biochar materials. There were significant differences in terms of specific surface area, pore volume, and pore diameter among the three types of biochar. Specifically, the biochar derived from corn straw had the largest specific surface area at 20.087 m2/g and the smallest average pore diameter at 4.565 nm. In contrast, the biochar derived from rice straw had the smallest specific surface area at 1.042 m2/g, and the largest average pore diameter at 19.670 nm. This might be due to variations in the inherent composition or content of different straw biomass, whereby substances containing hydroxyl (-OH) or carboxylic C=O groups decompose and are lost successively during the carbonization process, with stable components such as lignin (C=C and O–H) ultimately being retained. This leads to differences in the morphology, structure, and surface properties of the resulting straw biochars [27].

3.1.3. Fourier Transform Infrared Spectroscopy (FTIR) Analysis

The results of the FTIR analysis of different biochar materials are shown in Figure 2. The main absorption peaks of corn straw biochar are observed near 3435 cm−1, 1574 cm−1, 1218 cm−1, 1003 cm−1, 761 cm−1, 560 cm−1, and 447 cm−1. The peak at 3435 cm−1 corresponds to the stretching vibration of hydroxyl (O–H) bonds, indicating the presence of compounds that contain hydroxyl groups such as alcohols, phenols, or water molecules. The peak at 1574 cm−1 represents the stretching vibration of C=C bonds, suggesting the possible presence of incompletely carbonised organic matter in the biochar [28]. At 1218 cm−1, the peak corresponds to the stretching vibration of C–O bonds, which are particularly present in compounds like ethers, esters, or phenols. The peak at 1003 cm−1 corresponds to the bending vibration of C–H bonds. At 761 cm−1, the peak corresponds to the C–H bending vibration of monosubstituted aromatic rings, indicating the presence of incompletely carbonised aromatic compounds in the biochar samples. The peaks at 560 cm−1 and 447 cm−1 are typically associated with the vibration of the (Si–O) bonds found in inorganic salts or minerals, suggesting the possible presence of silicates in the biochar [29].
The main absorption peaks of wheat straw biochar are located around 3636 cm−1, 3438 cm−1, 1644 cm−1, 1457 cm−1, 1038 cm−1, 528 cm−1, and 467 cm−1. The peak at 3636 cm−1 corresponds to the stretching vibration absorption peak of hydroxyl (O–H) bonds, which may be present in water molecules or surface-adsorbed water. The peak at 3438 cm−1 also corresponds to the stretching vibration absorption peak of hydroxyl (O–H) bonds, indicating the presence of oxygen-containing compounds such as alcohols, phenols, or carboxylic acids. The peak at 1644 cm−1 is likely the C=O absorption peak of alcohols, phenols, and ethers, indicating that both wheat straw and its biochar surface contain such oxygen functional groups [30]. The peak at 1457 cm−1 corresponds to the bending vibration peak of C–H bonds. The absorption peak near 1038 cm−1 is characteristic of cellulose and hemicellulose, mainly arising from the stretching vibration peak of C–O bonds. The peaks at 528 cm−1 and 467 cm−1 are typically associated with the vibration of metal–oxygen (M–O) bonds in inorganic salts or minerals, suggesting the presence of some inorganic components or minerals in the biochar.
The main absorption peaks of rice straw biochar are observed near 3429 cm−1, 1617 cm−1, 1207 cm−1, 1076 cm−1, 965 cm−1, 560 cm−1, and 455 cm−1. The peak at 3429 cm−1 is associated with the stretching vibration of hydroxyl (O–H) groups, typically found in oxygen-containing compounds such as alcohols, phenols, or carboxylic acids. The peak at 1617 cm−1 is related to the deformation vibration of O–H bonds associated with adsorbed water molecules. The peak at 1207 cm−1 corresponds to the stretching vibration of C–O bonds, particularly in ether or ester compounds such as C–O–C and C–OH structures, indicating the presence of such oxidized structures in the biochar. The peak at 1076 cm−1 is attributed to the stretching vibration of C–O single bonds. These are possibly contributed by components like polysaccharides such as cellulose or hemicellulose with C–O–C and C–OH structures, reflecting the possible presence of these components in the biochar. The peak at 965 cm−1 corresponds to the bending vibration of C–H bonds. The peaks at 560 cm−1 and 455 cm−1 are typically associated with the vibration of metal–oxygen (M–O) bonds in inorganic salts or minerals, suggesting the potential presence of some inorganic components or minerals in the biochar [31].
Under the same preparation conditions, the FTIR spectra of various biochar materials exhibit a certain level of similarity, indicating that the surface functional groups of straw biochar materials share similar characteristics, all containing hydroxyl and carbonyl groups, among others.

3.1.4. X-ray Diffraction (XRD) Analysis

The XRD patterns of different biochar materials are shown in Figure 3. The characteristic diffraction peaks of rice straw biochar material appear at diffraction angles (2θ) of 20.8° and 28.1°. These peaks correspond to the non-crystalline structure, and studies have indicated that these non-crystalline peaks are mainly related to the cellulose crystalline structure of biomass [32,33]. Comparison with standard PDF cards reveals the presence of SiS₂ and KCl crystalline phases in both corn straw biochar and wheat straw biochar materials, in addition to the carbon peak. The existence of these crystalline phases is speculated to be due to the oxidation of trace elements such as the Si, S, and K salts contained in fertilizers. A signal peak of potassium salt is observed near the diffraction angle (2θ) of 40.5°.

3.1.5. X-ray Photoelectron Spectroscopy (XPS) Analysis

The surface chemical properties of biochar are influenced by the types and contents of surface elements and functional groups, which affect the adsorption performance of biochar for Cd. Figure 4 shows the XPS full spectra and C1s narrow spectra of different biochar materials. All three straw biochar materials are mainly composed of carbon (C) and oxygen (O) elements. High-resolution narrow-spectrum measurements of C1s were performed, and peak fitting was conducted. C1s can be assigned to four peaks: 284.82 eV, 286.18 eV, 287.44 eV, and 289.30 eV for corn straw biochar; 284.82 eV, 286.50 eV, 287.25 eV, and 288.98 eV for wheat straw biochar; and 284.82 eV, 286.50 eV, 287.52 eV, and 288.98 eV for rice straw biochar. These correspond to C–C, C–OH/C–O–C, O=C–O, and MCO3 (M represents metal ion) functional groups, respectively. Among them, the percentages of C–C functional groups in corn straw biochar, wheat straw biochar, and rice straw biochar are 86.53%, 83.05%, and 76.06%, respectively.
The above study suggests that the three different biochar materials all possess abundant pore structures and surface functional groups such as hydroxyl, carboxyl, and carbonyl. However, there are significant differences in the specific surface areas of the three biochars, with the specific surface area of corn stover biochar being greater than that of wheat straw biochar and rice straw biochar.

3.2. Effects of Different Biochar Addition Levels on the Soil Properties

3.2.1. Effects of Different Biochar Addition Levels on the pH of Cd-Contaminated Soil

Table 2 shows the effects of different biochar additions on the pH, EC, and CEC of Cd-contaminated soil. The addition of different biochars resulted in a significant increase in soil pH compared to the control treatment (p < 0.05), and the pH increased with the greater amount of biochar added. The addition of corn straw biochar resulted in a minimum pH increase of 0.1 (1% biochar addition treatment) and a maximum increase of 0.31 (5% biochar addition treatment) in the soil. With rice straw biochar addition, the minimum pH increase was 0.05 (1% addition), and the maximum increase was 0.21 (5% addition). For wheat straw biochar addition, the minimum pH increase was 0.07 (1% addition), and the maximum increase was 0.26 (5% addition). This may be due to the fact that straw biochar contains a large amount of ash and fewer acidic volatiles, which can promote displacement reactions between acidic ions and the oxides and soluble salt base ions in the biochar, thereby increasing the soil’s salt base saturation and reducing the H+ content in the soil. Additionally, straw biochar is typically alkaline, with negatively charged functional groups (–COOH and –OH) present on its surface. These can combine with free H+ in the soil, leading to an increase in soil pH [34]. Therefore, considering the improvement of soil pH, corn straw biochar has the best effect, followed by wheat straw biochar, and rice straw biochar has the poorest effect. This is consistent with the pH levels of the three types of straw biochar. Hence, this result may be attributed to the pH of the biochar materials.

3.2.2. Effects of Different Biochar Addition Levels on the EC of Cd-Contaminated Soil

According to Table 2, the addition of different biochars significantly increased the soil EC compared to the control treatment (CK) (p < 0.05). Moreover, as the amount of biochar added increased, the magnitude of the increase in EC also increased. At the addition levels of 1%, 3%, and 5%, the soil EC of the corn straw biochar treatment increased by 45.66 μs/cm, 105.66 μs/cm, and 318.33 μs/cm compared to the CK group, respectively. For the rice straw biochar treatment, the soil EC increased by 26.33 μs/cm, 81 μs/cm, and 203 μs/cm compared to the CK group. Similarly, for the wheat straw biochar treatment, the soil EC increased by 43.66 μs/cm, 91.00 μs/cm, and 235.66 μs/cm compared to the CK group. All three types of straw biochar can increase soil EC, possibly due to the alkaline nature of straw biochar and its rich nutrient content. Upon application to the soil, biochar releases alkaline substances as well as elements such as nitrogen, phosphorus, and potassium, leading to a significant increase in soil EC [35]. In different straw biochars, when the addition level is 1%, there is no significant difference (p > 0.05) in the increase in soil EC between corn straw biochar and wheat straw biochar; when the addition level is 3%, there is no significant difference (p > 0.05) in the increase in soil EC among the three biochars; and when the addition level is 5%, the three biochars show significant differences (p < 0.05) in their effect on increasing soil EC. The performance of the three straw biochars in terms of increasing soil EC is as follows: corn straw biochar > wheat straw biochar > rice straw biochar. The reason for this result may be that corn straw biochar and wheat straw biochar contain more K+, Ca2+, Mg2+ and other basic ions compared to rice straw biochar, leading to an increase in the soil’s salinity, thus showing a better performance in increasing soil EC [36].

3.2.3. Effects of Different Biochar Addition Levels on the CEC of Cd-Contaminated Soil

According to Table 2, it is evident that, under the influence of biochar, the soil’s CEC significantly increases compared to the CK group (p < 0.05), and this increase becomes more pronounced with the higher levels of biochar addition. At the addition levels of 1%, 3%, and 5%, the CEC of soil in the corn straw biochar treatment increased by 6.24%, 19.14%, and 33.45% compared to the control treatment; in the rice straw biochar treatment, the CEC of soil increased by 3.12%, 13.25%, and 25.09%; and in the wheat straw biochar treatment, the CEC of soil increased by 4.42%, 15.19%, and 28.03% compared to the control treatment. All three types of straw biochar have a promoting effect on soil CEC, possibly due to the biotic and abiotic processes at work in the soil. On the surface of biochar, localized oxidation reactions can occur, forming hydroxyl and phenolic functional groups. The presence of these functional groups increases the charge of the biochar, thereby increasing CEC in the soil [37]. The effects of different biochars on soil CEC follow the order of corn straw biochar > wheat straw biochar > rice straw biochar. Corn straw biochar and wheat straw biochar have higher specific surface areas (Table 1), providing more adsorption sites for cations, and thus demonstrating a superior performance in increasing soil CEC [38].

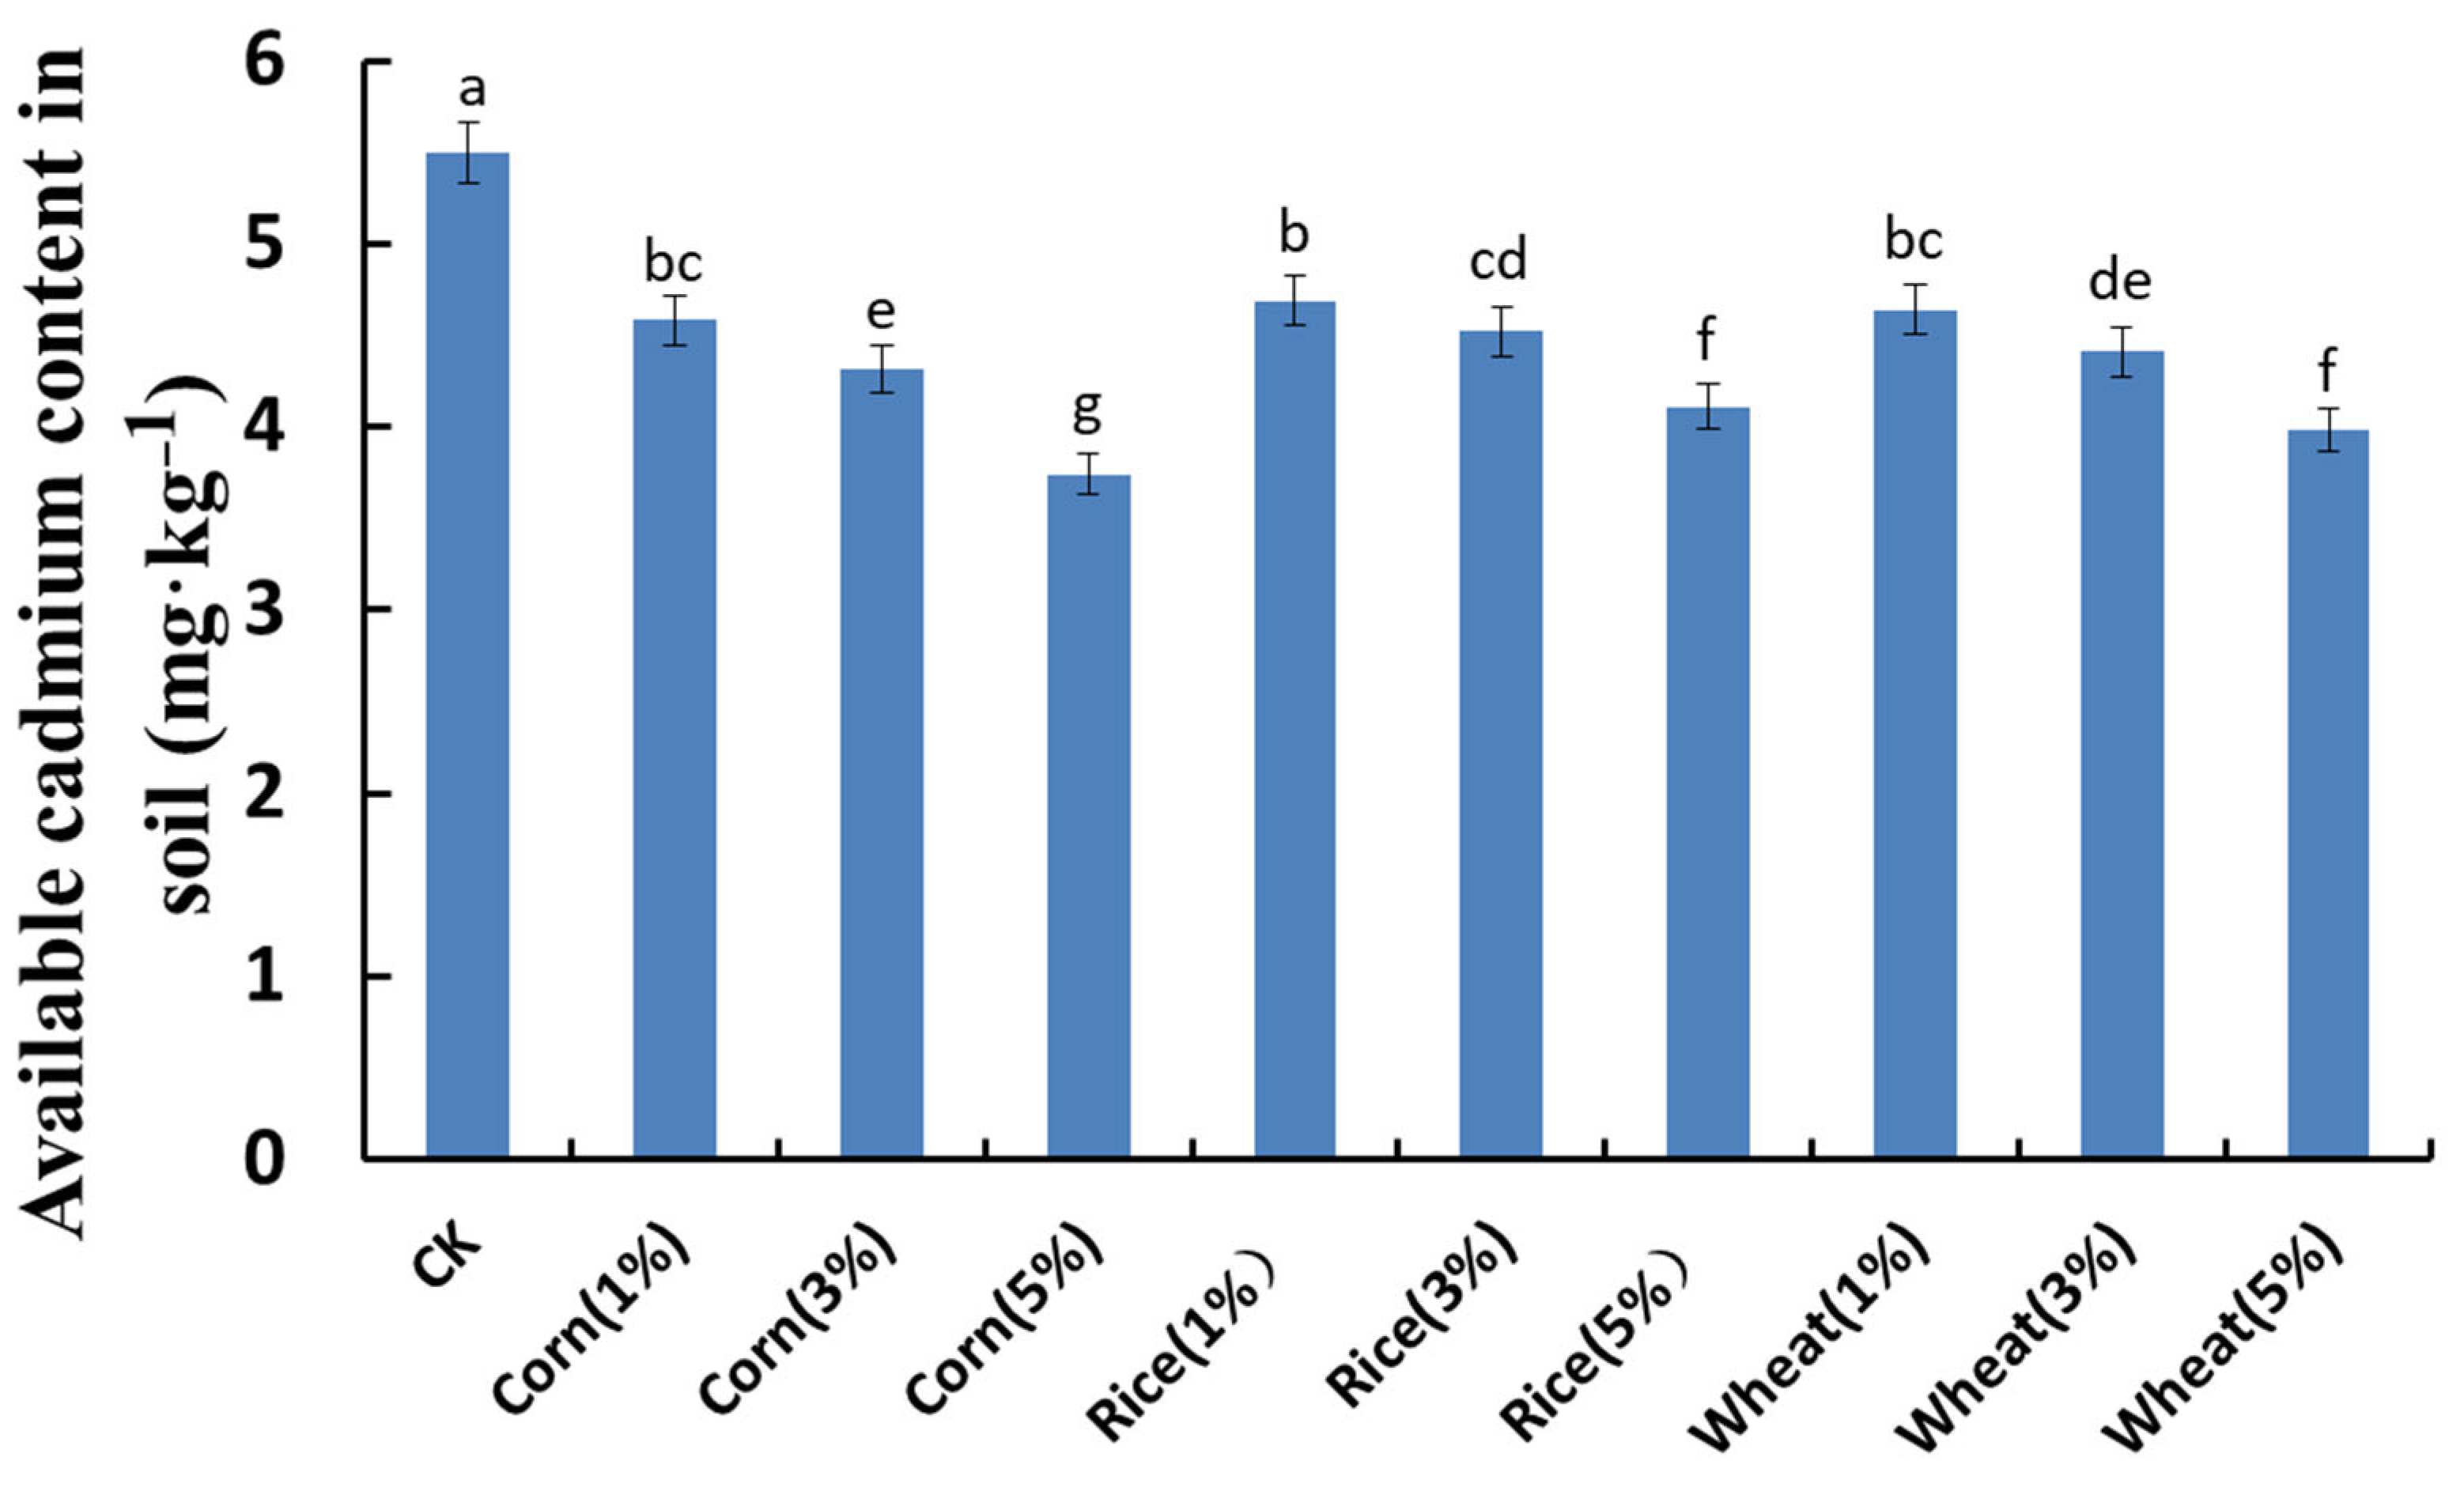
3.2.4. Effects of Different Biochar Addition Levels on the Available Cd in Cd-Contaminated Soil

Figure 5 shows the effects of different biochar additions on the available Cd in Cd-contaminated soil. All biochar additions significantly reduce the available Cd in the soil (p < 0.05). Furthermore, within the scope of this study, the reduction effect becomes more pronounced with increasing biochar addition levels. At addition levels of 1%, 3%, and 5%, the available Cd in the soil treated with corn straw biochar decreased by 16.73%, 21.45%, and 32.00%, respectively, compared to the control treatment (CK); for rice straw biochar, the reductions were 14.73%, 17.82%, and 25.27%; and for wheat straw biochar, the reductions were 15.64%, 19.82%, and 27.64% compared to the CK group.
In this study, all three types of biochar materials were found to reduce the available Cd in the soil. This may be attributed to the increased soil pH resulting from the addition of biochar, which provides abundant adsorption sites for heavy metals in the form of hydroxides formed under adsorption reactions. Simultaneously, the organic substances released by the soil and biochar form stable coordinated complexes with Cd2+, thereby reducing the effectiveness of Cd [39]. Characterization analysis revealed that all three types of biochar have abundant functional groups and porous structures on their surfaces. Various mechanisms or pathways such as adsorption and precipitation may also contribute to a reduction in available Cd in the soil [40]. Among the three types of straw biochar, corn straw biochar had the best effect, followed by wheat straw biochar, and the least effective was the rice straw biochar. When the addition level was 5%, the soil-available Cd in the corn straw biochar treatment decreased by 9.00% compared to the rice straw biochar treatment and by 6.03% compared to the wheat straw biochar treatment. This may be due to the larger specific surface area of corn straw biochar and wheat straw biochar (Table 1), which enables them to physically adsorb and immobilize Cd ions through chelation/complexation with the functional groups present in the biochar, making them more conducive to Cd adsorption [41]. Through the analysis of soil pH and CEC, it was found that corn straw biochar and wheat straw biochar were more effective than rice straw biochar in increasing soil pH and CEC (Table 2). The increase in soil pH and CEC is also beneficial for reducing the bioavailability of Cd in the soil, leading to a decrease in available Cd [42]. The different content of functional groups in the various biochar materials is also one of the reasons for the differential performance of different biochars in reducing the available Cd in soil.
These findings are consistent with the results of Luo et al. [43,44]. However, the study by Yu et al. [45] indicated that, while corn straw biochar has a large specific surface area and a microporous structure, its relatively high Cd content can lead to an increase in the total Cd content in the soil. This differs from the results of this study, possibly because the corn straw biochar used in this research had a lower Cd content, thus avoiding an increase in soil Cd levels. Therefore, in practical applications, it is important to consider not only the porous structure characteristics of the biochar but also the potential risks posed by raw materials.

3.3. Effects of Different Biochar Addition Levels on the Plant Height and Fresh Weight of Cd-Contaminated Lettuce at Maturity Stage

Table 3 shows the effects of different biochar additions on the plant height and fresh weight of lettuce under Cd stress. The addition of different biochar types significantly increased both the plant height and fresh weight compared to the control treatment (p < 0.05), with an increasing trend observed as the biochar dosage increased. At addition levels of 1%, 3%, and 5%, corn straw biochar treatment increased the plant height by 9.20%, 16.40%, and 25.56%, respectively, compared to the control treatment. Rice straw biochar increased the plant height by 6.06%, 12.98%, and 20.06%, respectively, while wheat straw biochar increased the plant height by 6.69%, 13.92%, and 21.23%, respectively, compared to the control treatment.
At the addition levels of 1%, 3%, and 5%, the lettuce fresh weight in the corn straw biochar treatment increased by 11.57%, 19.17%, and 31.31% compared to the control treatment; in the rice straw biochar treatment, the lettuce fresh weight increased by 10.96%, 16.53%, and 26.44% compared to the control treatment; and in the wheat straw biochar treatment, the lettuce fresh weight increased by 11.26%, 16.03%, and 26.42% compared to the control treatment. When the addition levels were 1% and 5%, there was no significant difference (p > 0.05) in improving the fresh weight of lettuce among the three types of straw biochar. When the addition level was 3%, there was no significant difference (p > 0.05) in promoting fresh weight between rice straw biochar and wheat straw biochar.
This research suggests that all three types of straw biochar can effectively increase the height and fresh weight of lettuce. These effects could be attributed to the biochar’s ability to enhance the availability and effectiveness of essential nutrients that are necessary for plant growth in the soil, thereby promoting cell division, plant growth and development, as well as stem thickening [46]. Considering the improvement in lettuce plant height and fresh weight, the effect of corn straw biochar is the most pronounced. This might be due to the better amelioration effect of corn straw biochar on Cd-polluted soil, which can provide a more suitable growing environment for lettuce, thus resulting in better performance in increasing plant height and fresh weight. The results indicate that the application of biochar can effectively improve the quality of Cd-contaminated lettuce.

3.4. Effects of Different Biochar Addition Levels on the Cd Content in Mature Lettuce Leaves under Cd Contamination

Figure 6 shows the effects of different biochar additions on the Cd content in lettuce leaves under Cd contamination conditions. With the addition of various biochars, there is a significant decrease in Cd content in lettuce leaves compared to the effects of CK treatment (p < 0.05), and as the biochar addition level increases, the Cd content in lettuce leaves gradually decreases. At addition levels of 1%, 3%, and 5%, the Cd content in lettuce leaves decreased by 24.19%, 38.50%, and 49.78%, respectively, in the corn straw biochar treatment compared to the CK group; in the rice straw biochar treatment, the Cd content in lettuce leaves decreased by 21.04%, 32.54%, and 45.23%, respectively, compared to the CK group; and in the wheat straw biochar treatment, the Cd content in lettuce leaves decreased by 22.56%, 35.57%, and 47.83%, respectively, compared to the CK group. This may be due to the fact that the application of biochar can alter soil properties, or because biochar can undergo complexation and precipitation reactions with heavy metals in the soil, leading to a decrease in Cd content in lettuce leaves. Among them, at the 1% addition level, the variation in Cd content in lettuce leaves among the three different biochar material groups was not significant (p > 0.05). The performance of the three biochar materials in reducing Cd content in lettuce leaves was ranked as follows: corn straw biochar > wheat straw biochar > rice straw biochar. This was consistent with the pattern observed for biochar in terms of reducing the available Cd in soil. When the addition level was 5%, the Cd content in lettuce leaves in the corn straw biochar treatment decreased by 8.32% and 3.89% compared to the rice straw biochar treatment and wheat straw biochar treatment, respectively. Corn straw biochar has a higher specific surface area compared to the other two types of biochar, resulting in stronger adsorption capacity for Cd. This enables it to reduce the translocation of Cd from roots to aboveground plant parts, thus demonstrating better effectiveness in reducing Cd content in lettuce leaves [47]. The above research indicates that biochar can effectively mitigate Cd contamination in lettuce by reducing the bioavailability of Cd in the soil, thereby decreasing the accumulation of Cd in lettuce and thus achieving the effective control of Cd pollution in lettuce.

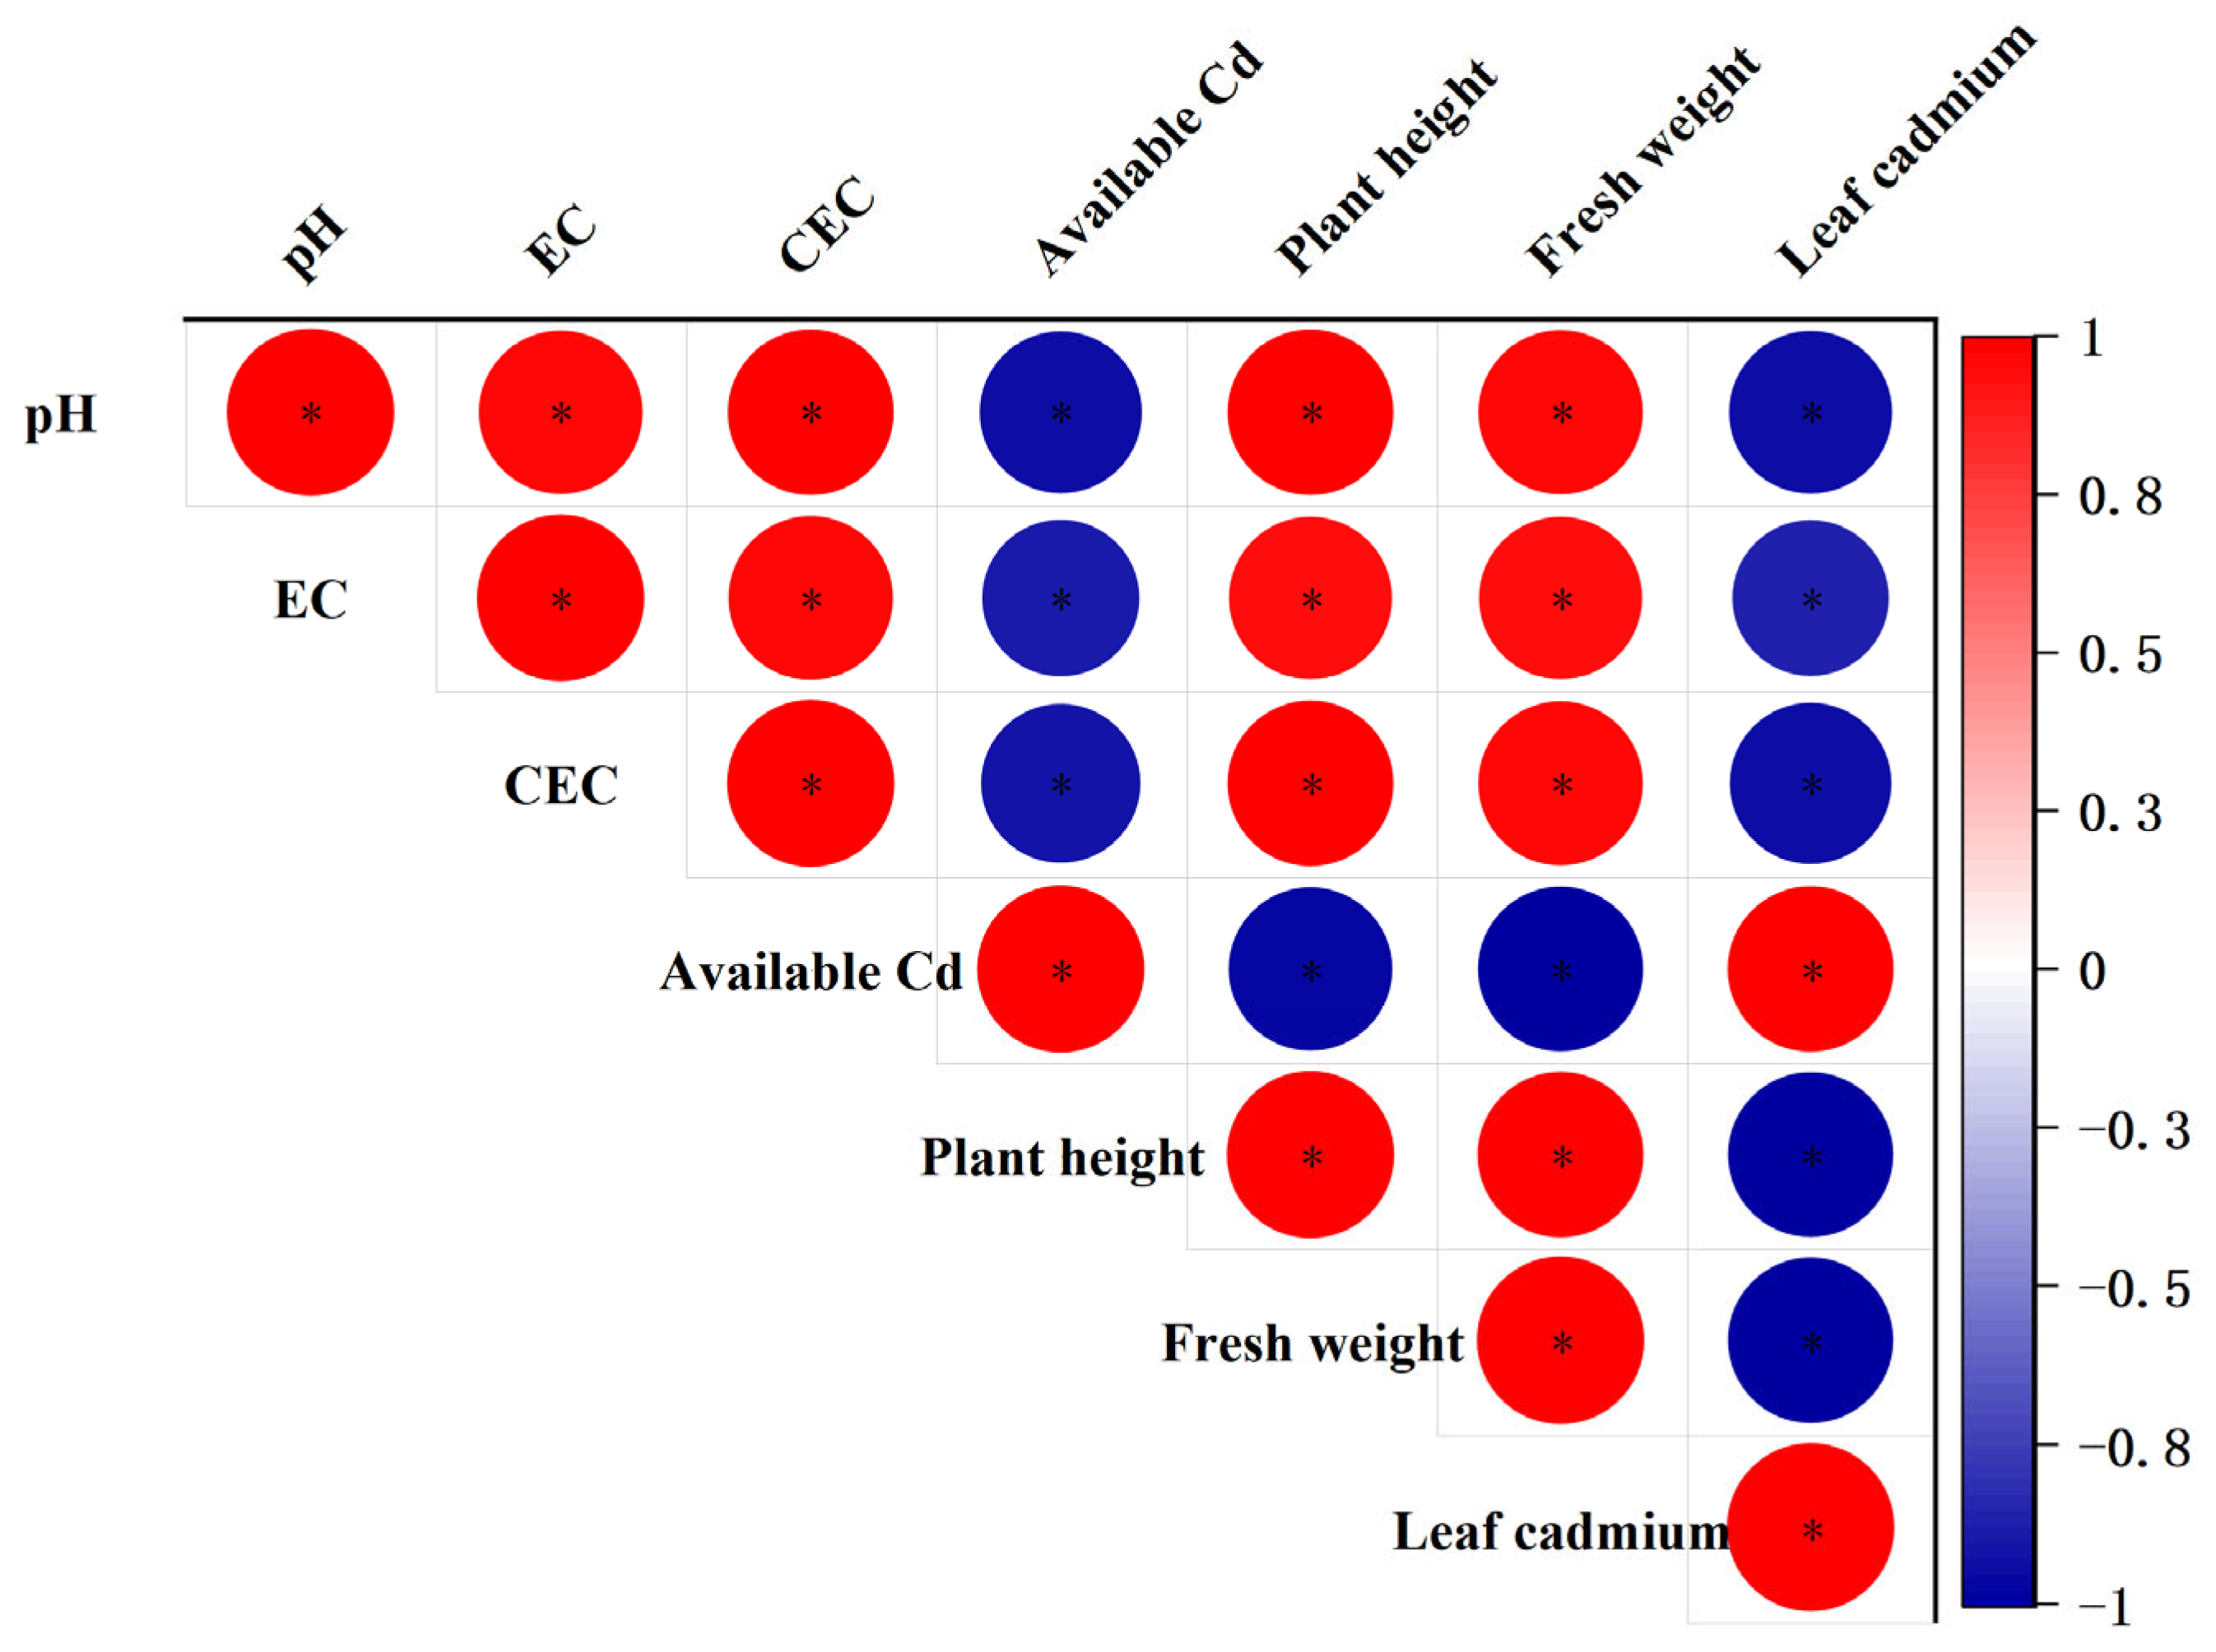
3.5. Analysis of the Correlation between Soil Properties and the Plant Height, Fresh Weight, and Leaf Cd Content of Lettuce

To clarify the relationship between soil-available Cd, lettuce leaf Cd content, and soil pH, EC, CEC, as well as between lettuce plant height and fresh weight under biochar addition, their interactions were examined. Moreover, this was performed due to the characteristics of mean values in reducing random errors and better representing overall features [48]. Therefore, the mean values of the aforementioned parameters were subjected to correlation analysis, followed by the creation of a correlation heatmap (Figure 7). There was a negative correlation between soil-available Cd and lettuce leaf Cd with soil pH, EC, CEC, lettuce plant height, and fresh weight. Soil-available Cd showed a positive correlation with lettuce leaf Cd content, and both correlations were statistically significant. The results indicate that the addition of biochar can alter soil properties, leading to the immobilization of Cd in the soil. By reducing the bioavailability of Cd in the soil, biochar mitigates Cd accumulation in lettuce leaves, thereby enhancing the quality of lettuce.
All three types of biochar increased soil pH to varying degrees (Table 2), and the results of the correlation analysis (Figure 7) also indicated a significant negative correlation between soil-available Cd content and pH. Therefore, raising soil pH may be one of the important mechanisms by which the three types of biochar reduce the bioavailability of Cd in the soil [49]. In addition to carbon elements, maize stalk biochar and wheat straw biochar contain trace elements such as silicon (Si), sulphur (S), and potassium (K) salts. Thus, chemical adsorption and precipitation might also contribute to a reduction in soil-available Cd [50].

4. Conclusions

Using soil contaminated with 10 mg/kg Cd as the substrate, corn, wheat, and rice straw biochar were utilised as solidification and amendment materials, and lettuce was used as the test plant. Through a pot cultivation method that involved the addition of biochar, this study investigated the effects of different biochar materials and various application rates on the soil properties. Additionally, the impact of biochar on lettuce plant height, fresh weight, and leaf Cd content under Cd stress was examined. The different biochar materials were also characterised. The following conclusions can be drawn:
(1) All three types of biochar contain a rich porous structure, with surfaces that include hydroxyl, carboxyl, and carbonyl functional groups. Among them, corn straw biochar has a larger specific surface area and higher pH value compared to the other two biochars, indicating that corn straw biochar has greater potential for use in Cd remediation in soil.
(2) All three types of biochar effectively raised soil pH, electrical conductivity (EC), and cation exchange capacity (CEC). They also promoted the plant height and fresh weight of lettuce under Cd stress conditions. Among these, corn straw biochar exhibited the best performance. These results indicate that biochar has significant potential for improving the physical and chemical properties of soil and enhancing lettuce quality.
(3) All three types of biochar significantly reduced the available Cd content in the soil and the Cd concentration in lettuce leaves. Specifically, corn straw biochar exhibited the highest efficacy, followed by wheat straw biochar and rice straw biochar. When 5% of corn straw biochar was added, the available Cd content in the soil and Cd concentration in lettuce leaves decreased the most compared to the control treatment, with reductions of 32.00% and 49.78%, respectively. Therefore, corn straw biochar can be regarded as a preferred material for the solidification and amendment of Cd pollution in lettuce.
In conclusion, all three types of straw biochar were found to effectively reduce the available Cd content in the soil and decrease the absorption of Cd by lettuce. However, within the scope of this study, the optimal addition amount was determined to be 5%. Future research could expand on the addition of amounts of biochar to determine the optimum levels for different types of straw biochar. Additionally, this study only focused on the analysis of mature lettuce. Subsequent research could consider conducting comprehensive comparative analyses throughout the entire growth stages of lettuce.

Author Contributions

Conceptualization, L.Z. (Lina Zhou) and L.Z. (Leijinyu Zhou); methodology, L.Z. (Lina Zhou) and H.Y.; formal analysis, L.Z. (Leijinyu Zhou) and L.K.; investigation, H.Y. and J.L.; resources, L.Z. (Lina Zhou) and H.Y.; writing—original draft preparation, L.Z. (Leijinyu Zhou) and H.W.; writing—review and editing, J.L. and L.K.; visualization, L.K. and H.W.; supervision, L.Z. (Lina Zhou); funding acquisition, H.Y. All authors have read and agreed to the published version of the manuscript.

Funding

This work was supported by the National Key Research and Development Program of China, grant number 2022YFD1500504, founded by Haoyu Yang. And This work was supported by the Scientific and Technological Research Projects of the Jilin Provincial Department of Education, grant number JJKH20240425KJ, founded by Lina Zhou.

Institutional Review Board Statement

The study did not require ethical approval.

Data Availability Statement

The data that support the findings of this study are available upon reasonable request from the authors.

Conflicts of Interest

The authors declare no conflict of interest.

References

  1. Song, W.; Chen, B.M.; Liu, L. Soil Heavy Metal Pollution of Cultivated Land in China. Res. Soil Water Conserv. 2013, 20, 293–298. [Google Scholar]
  2. Zhao, F.J.; Ma, Y.B.; Zhu, Y.G.; Tang, Z.; McGrath, S.P. Soil Contamination in China: Current Status and Mitigation Strategies. Environ. Sci. Technol. 2014, 49, 750–759. [Google Scholar] [CrossRef] [PubMed]
  3. Pandey, C.V.; Bajpai, O.; Singh, N. Energy crops in sustainable phytoremediation. Renew. Sustain. Energy Rev. 2016, 54, 58–73. [Google Scholar] [CrossRef]
  4. Raiesi, F.; Razmkhah, M.; Kiani, S. Salinity stress accelerates the effect of cadmium toxicity on soil N dynamics and cycling: Does joint effect of these stresses matter? Ecotoxicol. Environ. Saf. 2018, 153, 160–167. [Google Scholar] [CrossRef] [PubMed]
  5. Kong, S.F.; Yao, X.C.; Zhang, J.Y.; Yao, X.D.; Zeng, H. Review of Characteristics of Biochar and Research Progress of Its Applications. Ecol. Environ. Sci. 2015, 24, 716–723. [Google Scholar]
  6. Yang, K.D.; Xin, Y.J.; Wu, M.; Wu, D.; Luo, Y. Effects of Three Kinds of Biochar on the Biomass and Quality of Chinese Cabbage in Cadmium Polluted Yellow Soil. Anhui Agric. Sci. Bull. 2021, 27, 145–148. [Google Scholar]
  7. Pu, S.Y.; Shangguan, L.X.; Liu, S.B.; Shi, Q.Q.; Wang, X.K.; Zhang, Y. A Review of the application of biochar and its composites in soil remediation. Ecol. Environ. Sci. 2019, 28, 629–635. [Google Scholar]
  8. Yin, D.X.; Wang, X.; Peng, B.; Tan, C.Y.; Ma, L.N.Q. Effect of biochar and Fe-biochar on Cd and As mobility and transfer in soil-rice system. Chemosphere 2017, 186, 928–937. [Google Scholar] [CrossRef] [PubMed]
  9. Chen, D.; Wang, X.B.; Wang, X.L.; Feng, K.; Su, J.C.; Dong, J.N. The mechanism of cadmium sorption by sulphur-modified wheat straw biochar and its application cadmium-contaminated soil. Sci. Total Environ. 2020, 714, 136550. [Google Scholar] [CrossRef]
  10. Abbas, T.; Rizwan, M.; Ali, S.; Rehman, M.Z.U.; Qayyum, M.F.; Abbas, F.; Hannan, F.; Rinklebe, J.; Ok, Y.S. Effect of biochar on cadmium bioavailability and uptake in wheat (Triticum aestivum L.) grown in a soil with aged contamination. Ecotoxicol. Environ. Saf. 2017, 140, 37–47. [Google Scholar] [CrossRef]
  11. Yan, C.X.; Jia, H.T.; Sun, T.; Dina, T.; Luo, W.W.; Xie, S.; Sun, Y.B. Characteristics of chicken manure biochars and its effect on Cd and Pb remediation in water and soil. Trans. CSAE 2019, 35, 225–233. [Google Scholar]
  12. Fang, X.B.; Zhang, Z.J.; Lai, Y.Q.; Ye, M.; Diao, Z.H. Remediation of heavy metals Cr and Cd in soil by a novel sludge-derived biochar. Ecol. Environ. Sci. 2022, 31, 1647–1656. [Google Scholar]
  13. Liu, Y.X.; Wang, Y.Y.; Lu, H.H.; Lonappan, L.S.; Brar, S.K.; He, L.L.; Chen, J.Y.; Yang, S.M. Biochar application as a soil amendment for decreasing cadmium availability in soil and accumulation in Brassica chinensis. J. Soils Sediments 2018, 18, 2511–2519. [Google Scholar] [CrossRef]
  14. Chen, C.; Li, F.M.; Yang, L.; Nie, X.X.; Liu, B.; Hong, J. Mechanism and application of different types of biochar to remediation of Cd contaminated paddy soils: A review. Environ. Chem. 2022, 41, 4165–4179. [Google Scholar]
  15. Yuan, S.; Zhao, L.X.; Meng, H.B.; Shen, Y.J. The main types of biochar and their properties and expectative researches. J. Plant Nutr. Fertil. 2016, 22, 1402–1417. [Google Scholar]
  16. Hu, S.M.; Chen, C.; Chen, X.M.; Jing, F.; Wen, X. A field study of biochar application impact on adsorption and accumulation of Cd in paddy soil and rice. Arch. Agron. Soil Sci. 2023, 69, 48–59. [Google Scholar] [CrossRef]
  17. Chen, Y.; Qian, Y.; Liang, Y.; Shi, W.L. Immobilization and its mechanisms of cadmium contaminated soils by biochar. Chin. J. Environ. Eng. 2017, 11, 2528–2534. [Google Scholar]
  18. GB 15618-2018; Soil Environmental Quality Risk Control Standard for Agricultural Land (Trial). China Environmental Science Press: Beijing, China, 2018.
  19. Cao, S.Z.; Mu, Y.; Cui, J.X.; Liu, A.D.; Cheng, X.; Fu, Y.H.; Wei, S.Q.; Zhang, J.Z. Cd Pollution and Safe Planting Zoning in Paddy Soils: A Case Study in a District of Chongqing. Environ. Sci. 2021, 42, 5535–5544. [Google Scholar]
  20. Li, J.; Lin, Q.; Xu, S.H. Desorption and Migration Characteristics of Cu/Cd Composite Contaminated Soil Under Different pH/Ionic Strength. Acta Pedol. Sin. 2023, 60, 1026–1034. [Google Scholar]
  21. Tao, L.; Zhang, N.M. Growth Response of Three Leafy Vegetables to Cd Pollution and Their Cd Accumulation Characteristics. Chin. Agric. Sci. Bull. 2018, 34, 99–106. [Google Scholar]
  22. Sun, J.; Zhang, Y.C.; Mao, H.P.; Wu, X.H.; Chen, Y.; Weng, Q.P. Responses Analysis of Lettuce Leaf Pollution in Cadmium Stress Based on Computer Vision. Trans. Chin. Soc. Agric. Mach. 2018, 49, 166–172. [Google Scholar]
  23. Hu, W.; Cheng, J.Z.; Gao, W.C.; Tu, C.L.; Tang, Y. Remediation of Contaminated Soil in Pb-Zn Mining Area by Raw and Modified Tobacco Stem-derived Biochar. Earth Environ. 2024, 52, 144–153. [Google Scholar]
  24. Sun, Y.L.; Zhao, J.W.; Liu, X.S.; Li, S.Y.; Ma, C.H.; Wang, X.Z.; Zhang, Q.B. Effect of nitrogen application on photosynthetic daily variation, leaf morphology and dry matter yield of alfalfa at the early flowering growth stage. Acta Prataculturae Sin. 2022, 31, 63–75. [Google Scholar]
  25. Berens, M.L.; Wolinska, K.W.; Spaepen, S.; Ziegler, J.; Nobori, T.; Nair, A.; Krüler, V.; Winkelmüller, T.M.; Wang, Y.M.; Mine, A.; et al. Balancing trade-offs between biotic and abiotic stress responses through leaf age-dependent variation in stress hormone cross-talk. Proc. Natl. Acad. Sci. USA 2019, 116, 2364–2373. [Google Scholar] [CrossRef] [PubMed]
  26. Wang, T.T.; Wang, X.L.; Ren, Z.S.; Zheng, J.Y. Microscopic Morphology and Surface Features of Biochars Derived from Different Raw Materials. Environ. Sci. Technol. 2017, 40, 42–48. [Google Scholar]
  27. Hou, J.W.; Xing, C.F.; Deng, X.M.; Chen, F.; Liu, M.; Wang, Z.H.; Li, T.J.; Hu, Y.L. Physical and Chemical Properties of Different Straw Biochars. Chin. J. Soil Sci. 2020, 51, 130–135. [Google Scholar]
  28. Ma, K.Y.; Zhang, H.; Song, N.N.; Wang, F.L.; Lin, D.S. Mechanism of cadmium adsorption by oxidative aging corn straw biochar. J. Agro-Environ. Sci. 2022, 41, 1230–1240. [Google Scholar]
  29. Xin, X.; Bao, L.C.; Li, Z.Z. Transformation, morphology, and dissolution of silicon and carbon in rice straw-derived biochars under different pyrolytic temperatures. Environ. Sci. Technol. 2014, 48, 3411–3419. [Google Scholar]
  30. Rechberger, M.V.; Kloss, S.; Wang, S.L.; Lehmann, J.; Rennhofer, H.; Ottner, F.; Wriessnig, K.; Daudin, G.; Lichtenegger, H.; Soja, G.; et al. Enhanced Cu and Cd sorption after soil aging of woodchip-derived biochar: What were the driving factors? Chemosphere 2019, 216, 463–471. [Google Scholar] [CrossRef]
  31. Cao, Q.Q.; Song, M.; Meng, F.Y.; Zhao, Y.; Song, B. Remediation of cadmium contaminated soils by FeAl-LDHs/biochar and its mechanism. Ecol. Environ. Sci. 2020, 29, 834–841. [Google Scholar]
  32. He, J.W.; He, C.X.; Guo, H.Y.; Ming, L. Adsorption of methylene blue by five straw biochars and its performance comparison. J. Nanjing Agric. Univ. 2019, 42, 382–388. [Google Scholar]
  33. Yuan, J.D.; Wang, C.J.; Tang, Z.T.; Chu, T.Z.; Zheng, C.; Han, Q.R.; Chen, H.L.; Tan, Y.Z. Biochar derived from traditional Chinese medicine residues: An efficient adsorbent for heavy metal Pb(II). Arab. J. Chem. 2024, 17, 105606. [Google Scholar] [CrossRef]
  34. Ran, T.S.; Long, J.; Liao, H.K.; Li, J.; Yang, G.M.; Zhao, Y.X. Effects of Biochar Application on Physicochemical Properties and Bacterial Communities of Microplastic-contaminated Calcareous Soil. Environ. Sci. 2023, 44, 4507–4518. [Google Scholar]
  35. Muhammad, R.; Shafaqat, A.; Tahir, A.; Muhammad, A.; Muhammad, Z.R.; Muhammad, I.; Farhat, A.; Muhammad, F.Q.; Rab, N. Residual effects of biochar on growth, photosynthesis and cadmium uptake in rice (Oryza sativa L.) under Cd stress with different water conditions. J. Environ. Manag. 2018, 206, 676–683. [Google Scholar]
  36. Zheng, X.D.; Li, X.; Singh, B.P.; Wei, L.; Huang, L.X.; Huang, Y.F.; Huang, Q.; Chen, X.B.; Su, Y.R.; Liu, Z.Z.; et al. Biochar protects hydrophilic dissolved organic matter against mineralization and enhances its microbial carbon use efficiency. Sci. Total Environ. 2021, 795, 148793. [Google Scholar] [CrossRef]
  37. Zhang, C.S.; Lin, Y.; Tian, X.Y.; Xu, Q.; Chen, Z.H.; Lin, W. Tobacco bacterial wilt suppression with biochar soil addition associates to improved soil physiochemical properties and increased rhizosphere bacteria abundance. Appl. Soil Ecol. 2016, 112, 90–96. [Google Scholar] [CrossRef]
  38. Liang, B.; Lehmann, J.; Solomon, D.; Kinyangi, J.; Grossman, J.; O’Neill, B.; Skjemstad, J.O.; Thies, J.; Luizão, F.J.; Petersen, J.; et al. Black Carbon Increases Cation Exchange Capacity in Soils. Soil Sci. Soc. Am. J. 2006, 70, 1719–1730. [Google Scholar] [CrossRef]
  39. Liu, S.D.; Han, Y.G.; Zhu, X.P.; Wu, X.N. Effects of Cotton Stalk Biochar on the Structure and Function of Fungi Community in Alkaline Rhizosphere Soil of Rice Under Cadmium Pollution. Environ. Sci. 2020, 41, 3846–3854. [Google Scholar]
  40. Nie, X.X.; Zhang, Z.Y.; Huang, Y.H.; Feng, J.Y.; Zhang, Z.Y.; Yang, L. Effects of simultaneous biochar and nitrogen fertilizer application on the photosynthesis and Cd uptake of sorghum. J. Agro-Environ. Sci. 2019, 38, 2749–2756. [Google Scholar]
  41. Cheng, Z.; Cai, X.F.; Zhao, S. Effect of biochar with different particle size on remediation of soil heavy metal pollution in native zinc smelting area in northwest of Guizhou province. J. Guizhou Norm. Univ. 2023, 41, 21–28. [Google Scholar]
  42. Yang, W.W.; Zhang, C.L.; Cao, M.Z.; Yan, J.N.; Qin, X.; Liang, D.G. Immobilization and remediation of cadmium-contaminated soil with four kinds of biochars. J. Soil Water Conserv. 2015, 29, 239–243. [Google Scholar]
  43. Luo, Y.; Liang, Y.X.; Yang, K.D.; Wang, F.; Yang, X.L. Preparation of Two Different Straw Carbons and their Passivation Effect on Cd in Cd-contaminated Yellow Soil. Guizhou Agric. Sci. 2020, 48, 29–33. [Google Scholar]
  44. Chi, T.; Zuo, J.; Liu, F. Performance and mechanism for cadmium and lead adsorption from water and soil by corn straw biochar. Front. Environ. Sci. Eng. 2017, 11, 15. [Google Scholar] [CrossRef]
  45. Yu, C.; Wang, Y.Y.; Liu, Q.Z.; Wang, Y.; Shen, H.; Feng, Y. Effects of application of biochar from different raw materials combined with inorganic amendments on cadmium accumulation in pakchoi shoots and soil cadmium inactivation. Acta Agric. Zhejiangensis 2024, 36, 613–621. [Google Scholar]
  46. Luo, Y.; Zhang, G.L.; Wang, F.; Xiang, Y.Z.; Ren, J. Effect of Chili Straw Biochar on Chemical Characteristics of Yellow Soil and Growth of Chinese Cabbage. J. Sichuan Agric. Univ. 2022, 40, 847–852. [Google Scholar]
  47. Al, Y.M.; Wang, Y.; Li, J.Q.; Zhang, C.Y.; Xu, X.Y.; Feng, J.P.; Zhou, J.H. Effects of Soil Microbial Activity and Cu, Cd, Pb Enrichment of Vetiveria zizanioides to Biochar Addition in Contaminated Soil in Copper Mining Areas. J. Soil Water Conserv. 2022, 36, 402–409. [Google Scholar]
  48. Kang, Z.Y.; Han, M.W.; Zhou, M.W.; Li, L.; Yan, S.Y. Representative analysis of the average value of petroleum exploration and development data volume. J. Geol. 2022, 46, 136–141. [Google Scholar]
  49. Egene, C.E.; Poucke, R.V.; Ok, Y.S.; Meers, E.; Tack, F.M.G. Impact of organic amendments (biochar, compost and peat) on Cd and Zn mobility and solubility in contaminated soil of the Campine region after three years. Sci. Total Environ. 2018, 626, 195–202. [Google Scholar] [CrossRef]
  50. Zhao, Y.H.; Zhao, L.; Mei, Y.Y.; Li, F.Y.; Cao, X.D. Release of nutrients and heavy metals from biochar-amended soil under environmentally relevant conditions. Environ. Sci. Pollut. Res. Int. 2018, 25, 2517–2527. [Google Scholar] [CrossRef]
Figure 1. SEM images of biochar materials. (a) Corn straw biochar; (b) wheat straw biochar; (c) rice straw biochar.
Agriculture 14 01068 g001
Figure 2. FTIR spectra of different biochar materials.
Agriculture 14 01068 g002
Figure 3. XRD images of different biochar materials.
Agriculture 14 01068 g003
Figure 4. XPS full spectra and C1s narrow spectra of different biochar materials. (a) XPS full spectra; (b) C1s narrow spectra of corn straw biochar; (c) C1s narrow spectra of wheat straw biochar; (d) C1s narrow spectra of rice straw biochar.
Agriculture 14 01068 g004
Figure 5. Effects of different biochar addition levels on the available Cd in Cd−contaminated soil. Note: different lowercase letters following the data in the same column indicate significant differences (p < 0.05), N = 3.
Agriculture 14 01068 g005
Figure 6. Effects of different biochar addition levels on the Cd content in mature lettuce leaves under Cd contamination conditions. Note: different lowercase letters following the data in the same column indicate significant differences (p < 0.05), N = 3.
Agriculture 14 01068 g006
Figure 7. Correlation analysis between soil properties and lettuce plant height, fresh weight, and leaf Cd content. Note: * indicates significant correlation at the 0.05 level.
Agriculture 14 01068 g007
Table 1. Pore parameters of different biochar materials.
Biochar MaterialsSpecific Surface Area
(m2/g)
Total Pore Volume
(cm3/g)
Average Pore Diameter
(nm)
Corn straw biochar20.0870.0234.565
Wheat straw biochar17.9690.05110.962
Rice straw biochar1.0420.00519.670
Table 2. Effects of different biochar additions on the pH, EC, and CEC of Cd-contaminated soil.
TreatmentBiocharBiochar Addition Levels (%)pHEC (μs/cm)CEC (cmol/kg)
CK//6.47 ± 0.03 h1138.67 ± 16.86 f16.98 ± 0.24 i
1Corn straw biochar16.57 ± 0.02 efg1184.33 ± 11.06 e18.04 ± 0.19 g
236.66 ± 0.04 cd1244.33 ± 11.68 d20.23 ± 0.17 d
356.78 ± 0.05 a1457.00 ± 11.00 a22.66 ± 0.11 a
4Rice straw biochar16.52 ± 0.01 gh1165.00 ± 17.52 ef17.51 ± 0.13 h
536.58 ± 0.04 ef1219.67 ± 16.17 d19.23 ± 0.07 f
656.68 ± 0.03 bc1341.67 ± 14.50 c21.24 ± 0.08 c
7Wheat straw biochar16.54 ± 0.02 fg1182.33 ± 10.50 e17.73 ± 0.11 h
836.62 ± 0.03 de1229.67 ± 23.54 d19.56 ± 0.17 e
956.73 ± 0.01 ab1374.33 ± 17.04 b21.74 ± 0.10 b
Note: different lowercase letters following the data in the same column indicate significant differences (p < 0.05), N = 3.
Table 3. Effects of different biochar addition levels on the plant height and fresh weight of Cd-contaminated lettuce at maturity stage.
TreatmentBiocharBiochar Addition Levels (%)Plant Height (cm)Fresh Weight (g)
CK//25.43 ± 0.75 g39.86 ± 2.36 d
1Corn straw biochar127.77 ± 0.50 ef44.47 ± 0.75 c
2329.60 ± 0.26 cd47.50 ± 1.10 b
3531.93 ± 1.15 a52.34 ± 0.94 a
4Rice straw biochar126.97 ± 0.40 f44.23 ± 1.12 c
5328.73 ± 0.65 de46.45 ± 0.74 bc
6530.53 ± 0.70 bc50.40 ± 1.41 a
7Wheat straw biochar127.13 ± 0.70 f44.35 ± 0.62 c
8328.97 ± 0.60 d46.25 ± 0.88 bc
9530.83 ± 0.45 ab50.39 ± 1.64 a
Note: different lowercase letters following the data in the same column indicate significant differences (p < 0.05), N = 3.
Disclaimer/Publisher’s Note: The statements, opinions and data contained in all publications are solely those of the individual author(s) and contributor(s) and not of MDPI and/or the editor(s). MDPI and/or the editor(s) disclaim responsibility for any injury to people or property resulting from any ideas, methods, instructions or products referred to in the content.

