
Evaluation of the Habitat Suitability for Zhuji Torreya Based on Machine Learning Algorithms

Abstract
:1. Introduction
2. Data and Methods
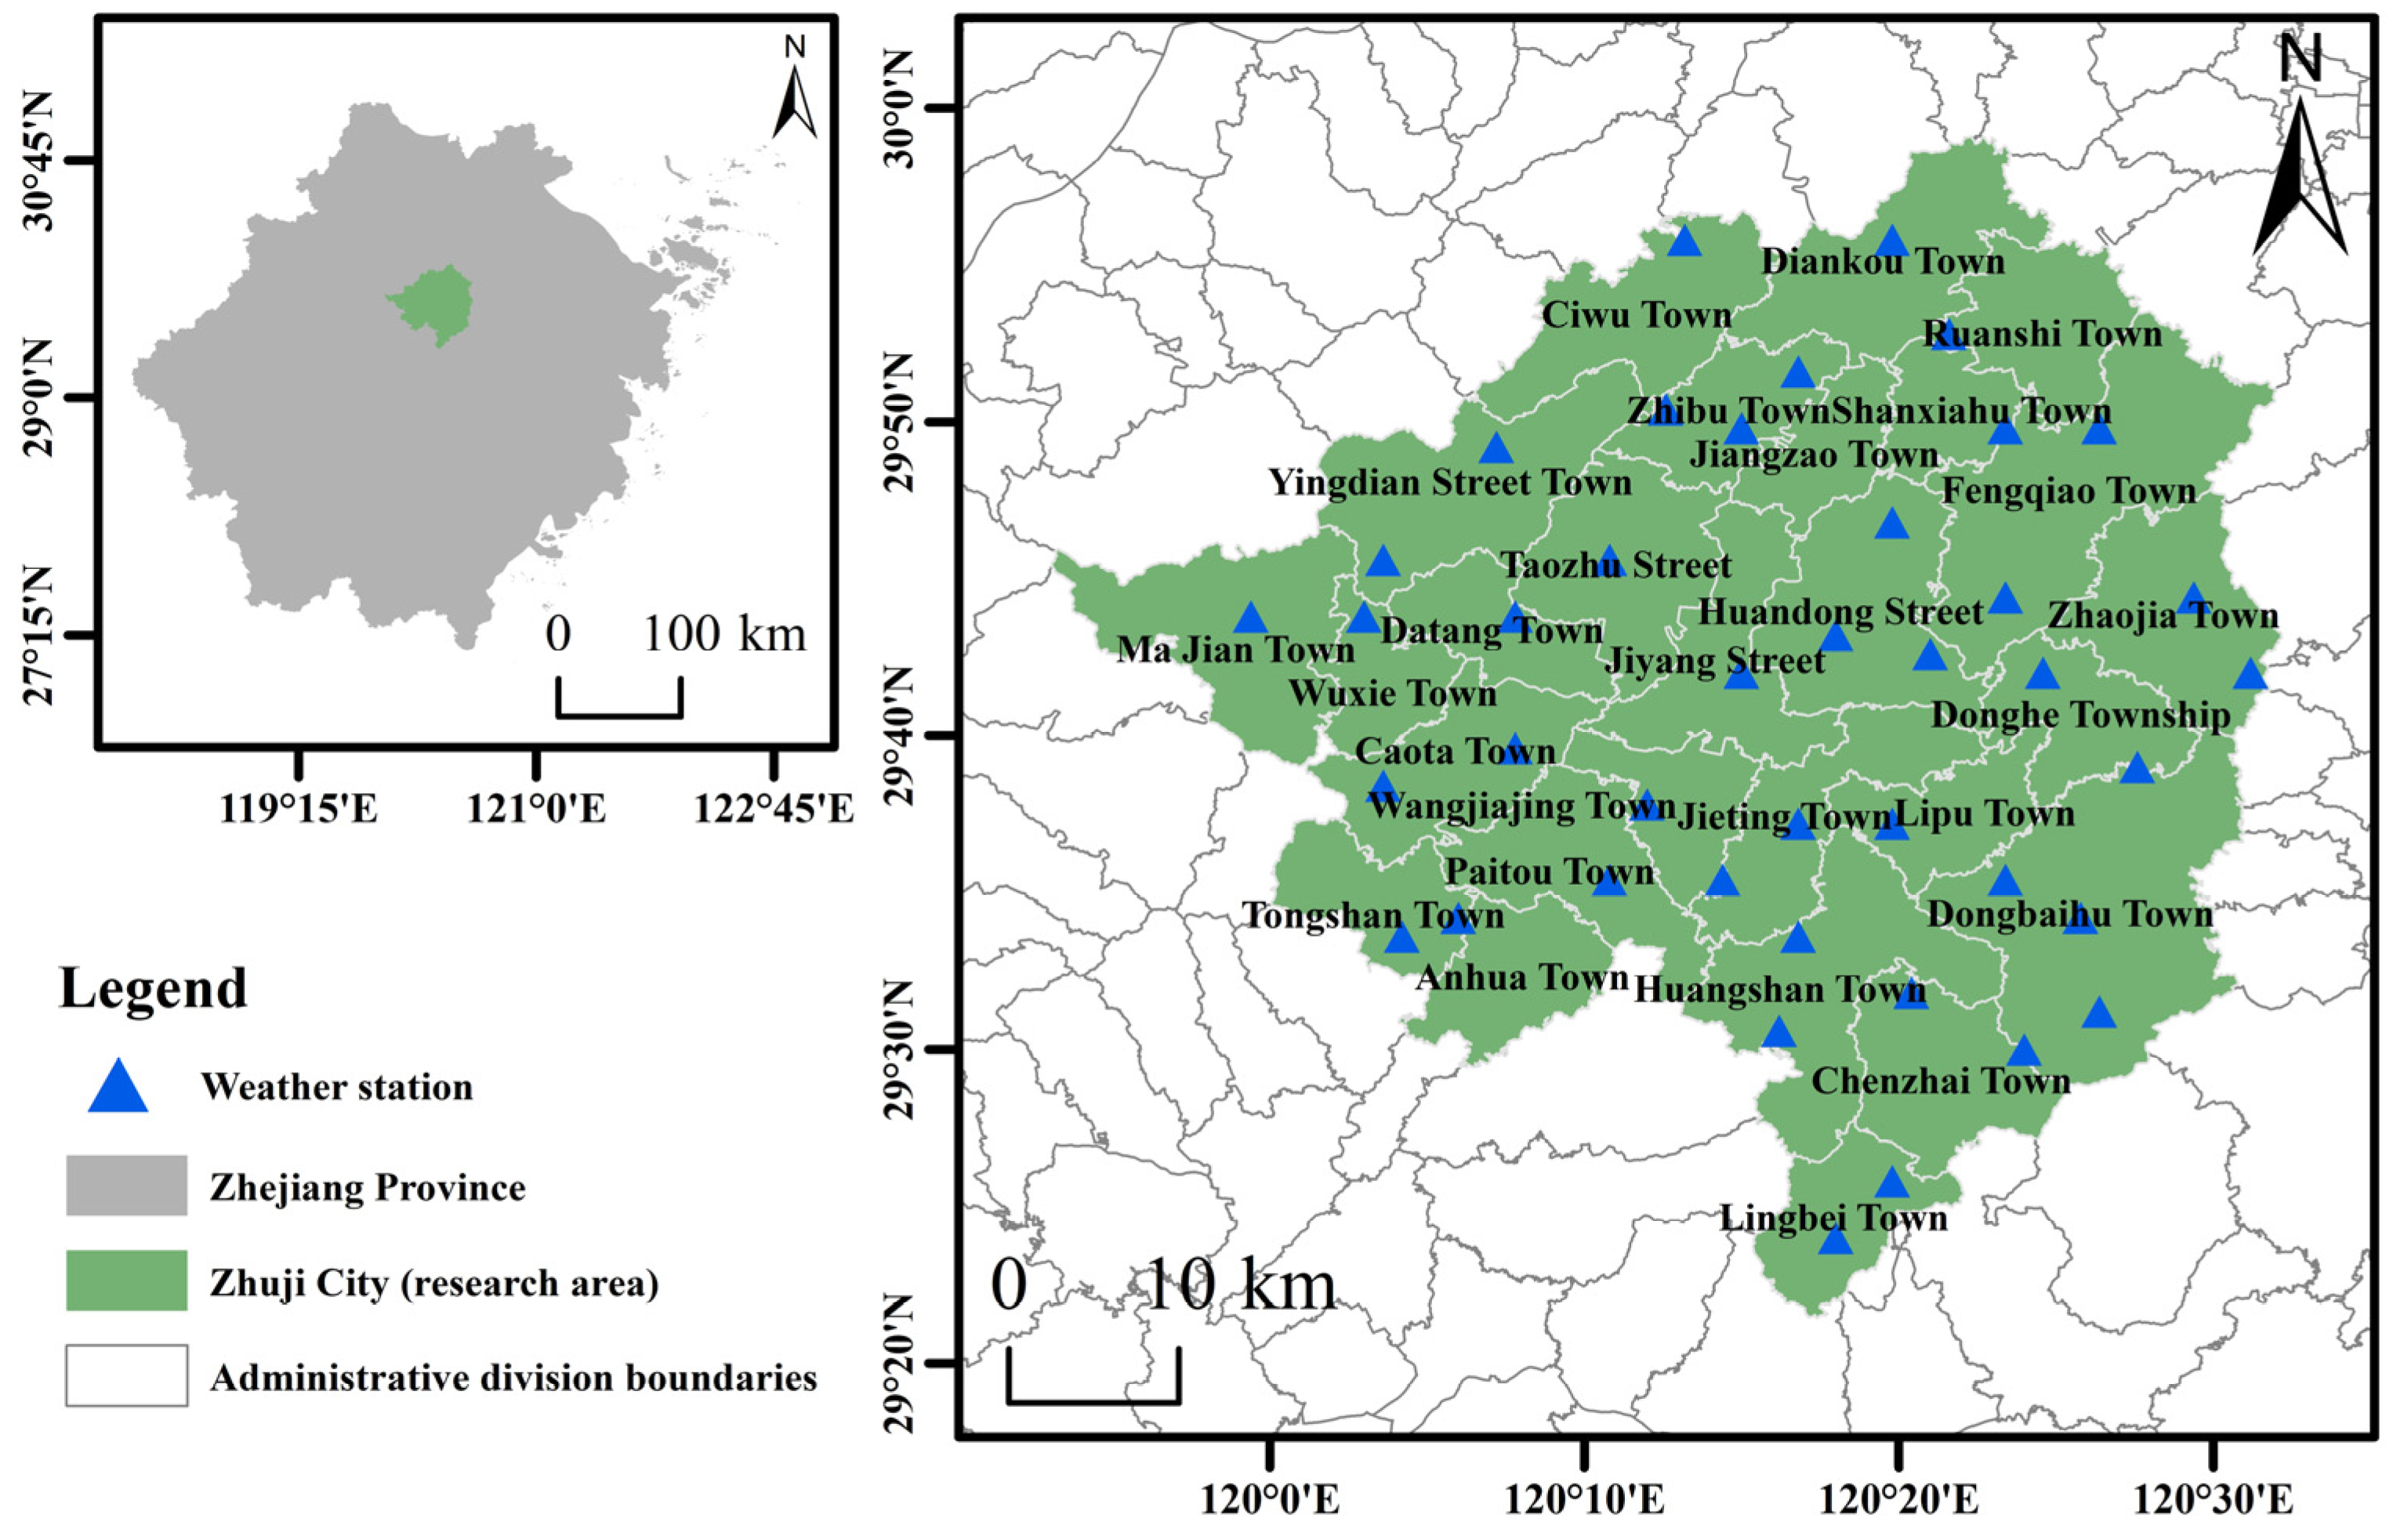
2.1. Research Area
2.2. Data
2.2.1. Data Introduction
2.2.2. Data Processing
2.3. Methods
2.3.1. Growth Climate Indicators
- (1)
- Kira’s Warmth Index ():where represents the warmth index and is the monthly average temperature greater than 5 °C.
- (2)
- Holdridge’s biological temperature () and possible evapotranspiration rate ():where represents the optimal temperature range required for sustaining life activities within the organism and denotes the monthly average temperature ranging from 0 °C to 30 °C. A monthly average temperature below 0 °C is regarded as 0; if it exceeds 30 °C, it is considered 30.
- (3)
- Xu Wenduo’s Humidity Index ():where represents the annual precipitation (mm) and represents the warmth index (°C).
2.3.2. Physical Model Calculation Method for Climate and Habitat Zoning in Torreya
2.3.3. Machine Learning Methods for Climate and Habitat Zoning in Torreya
- Algorithm selection
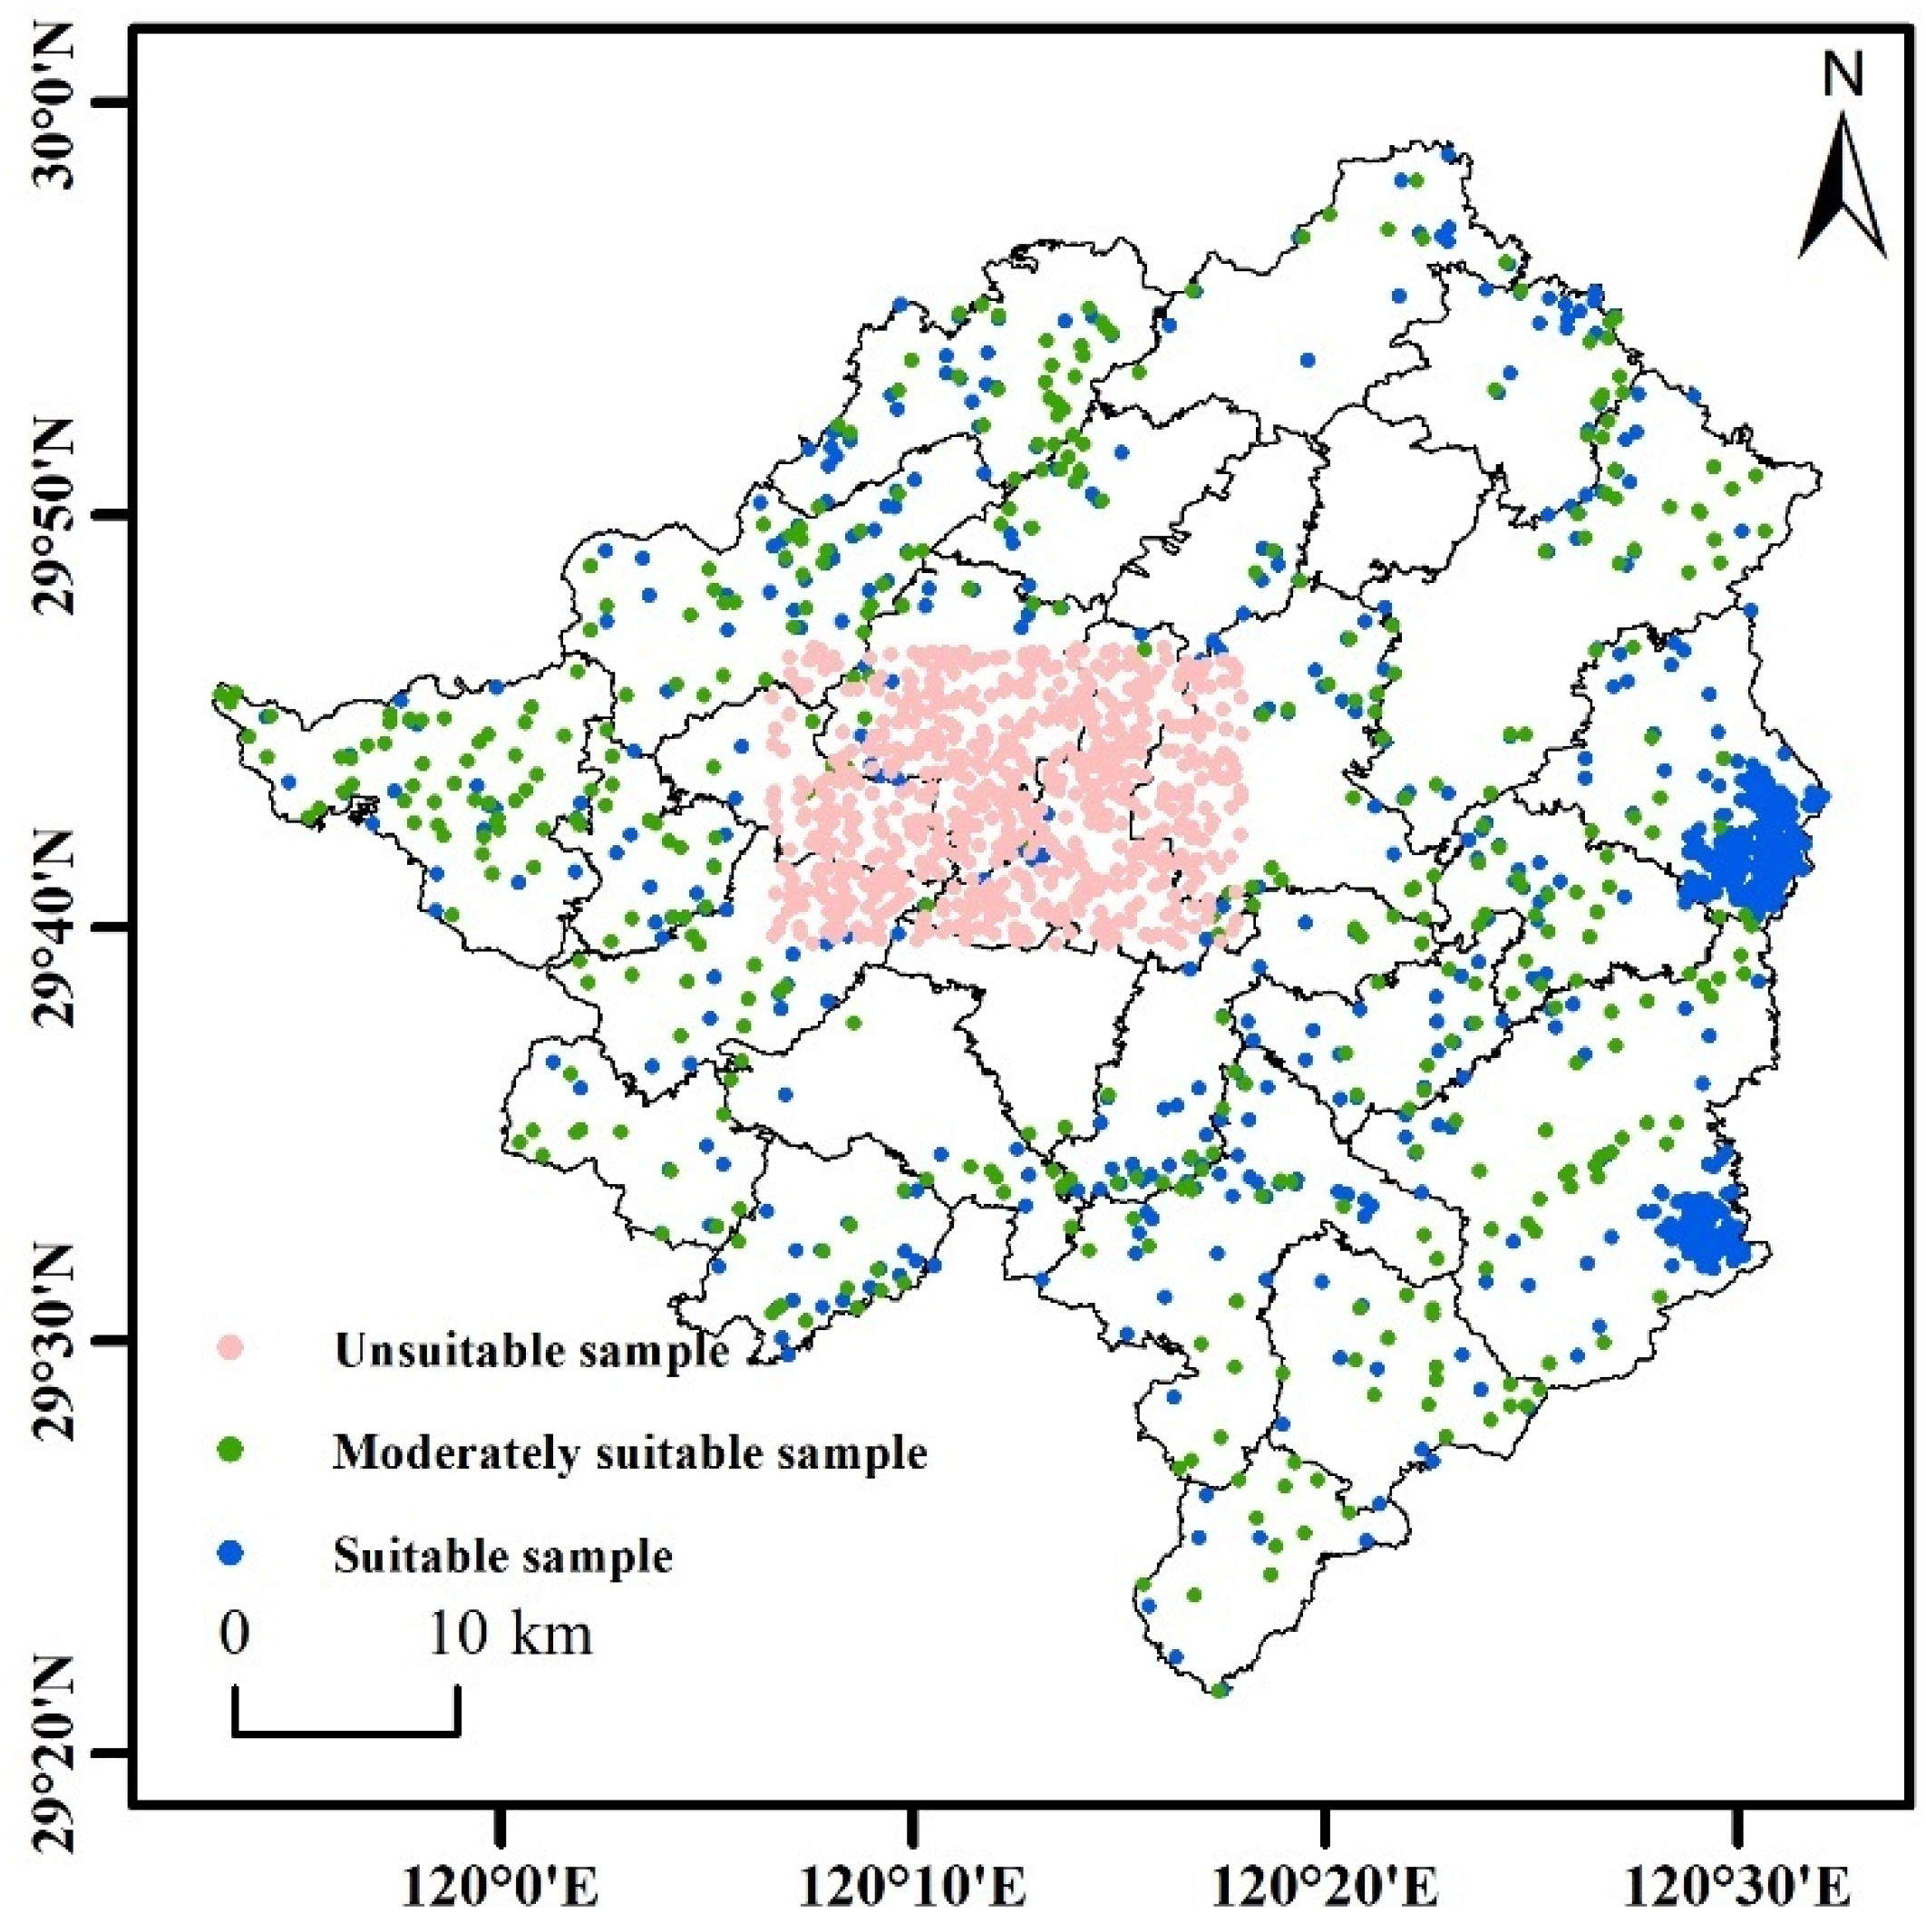
- Sample selection partition
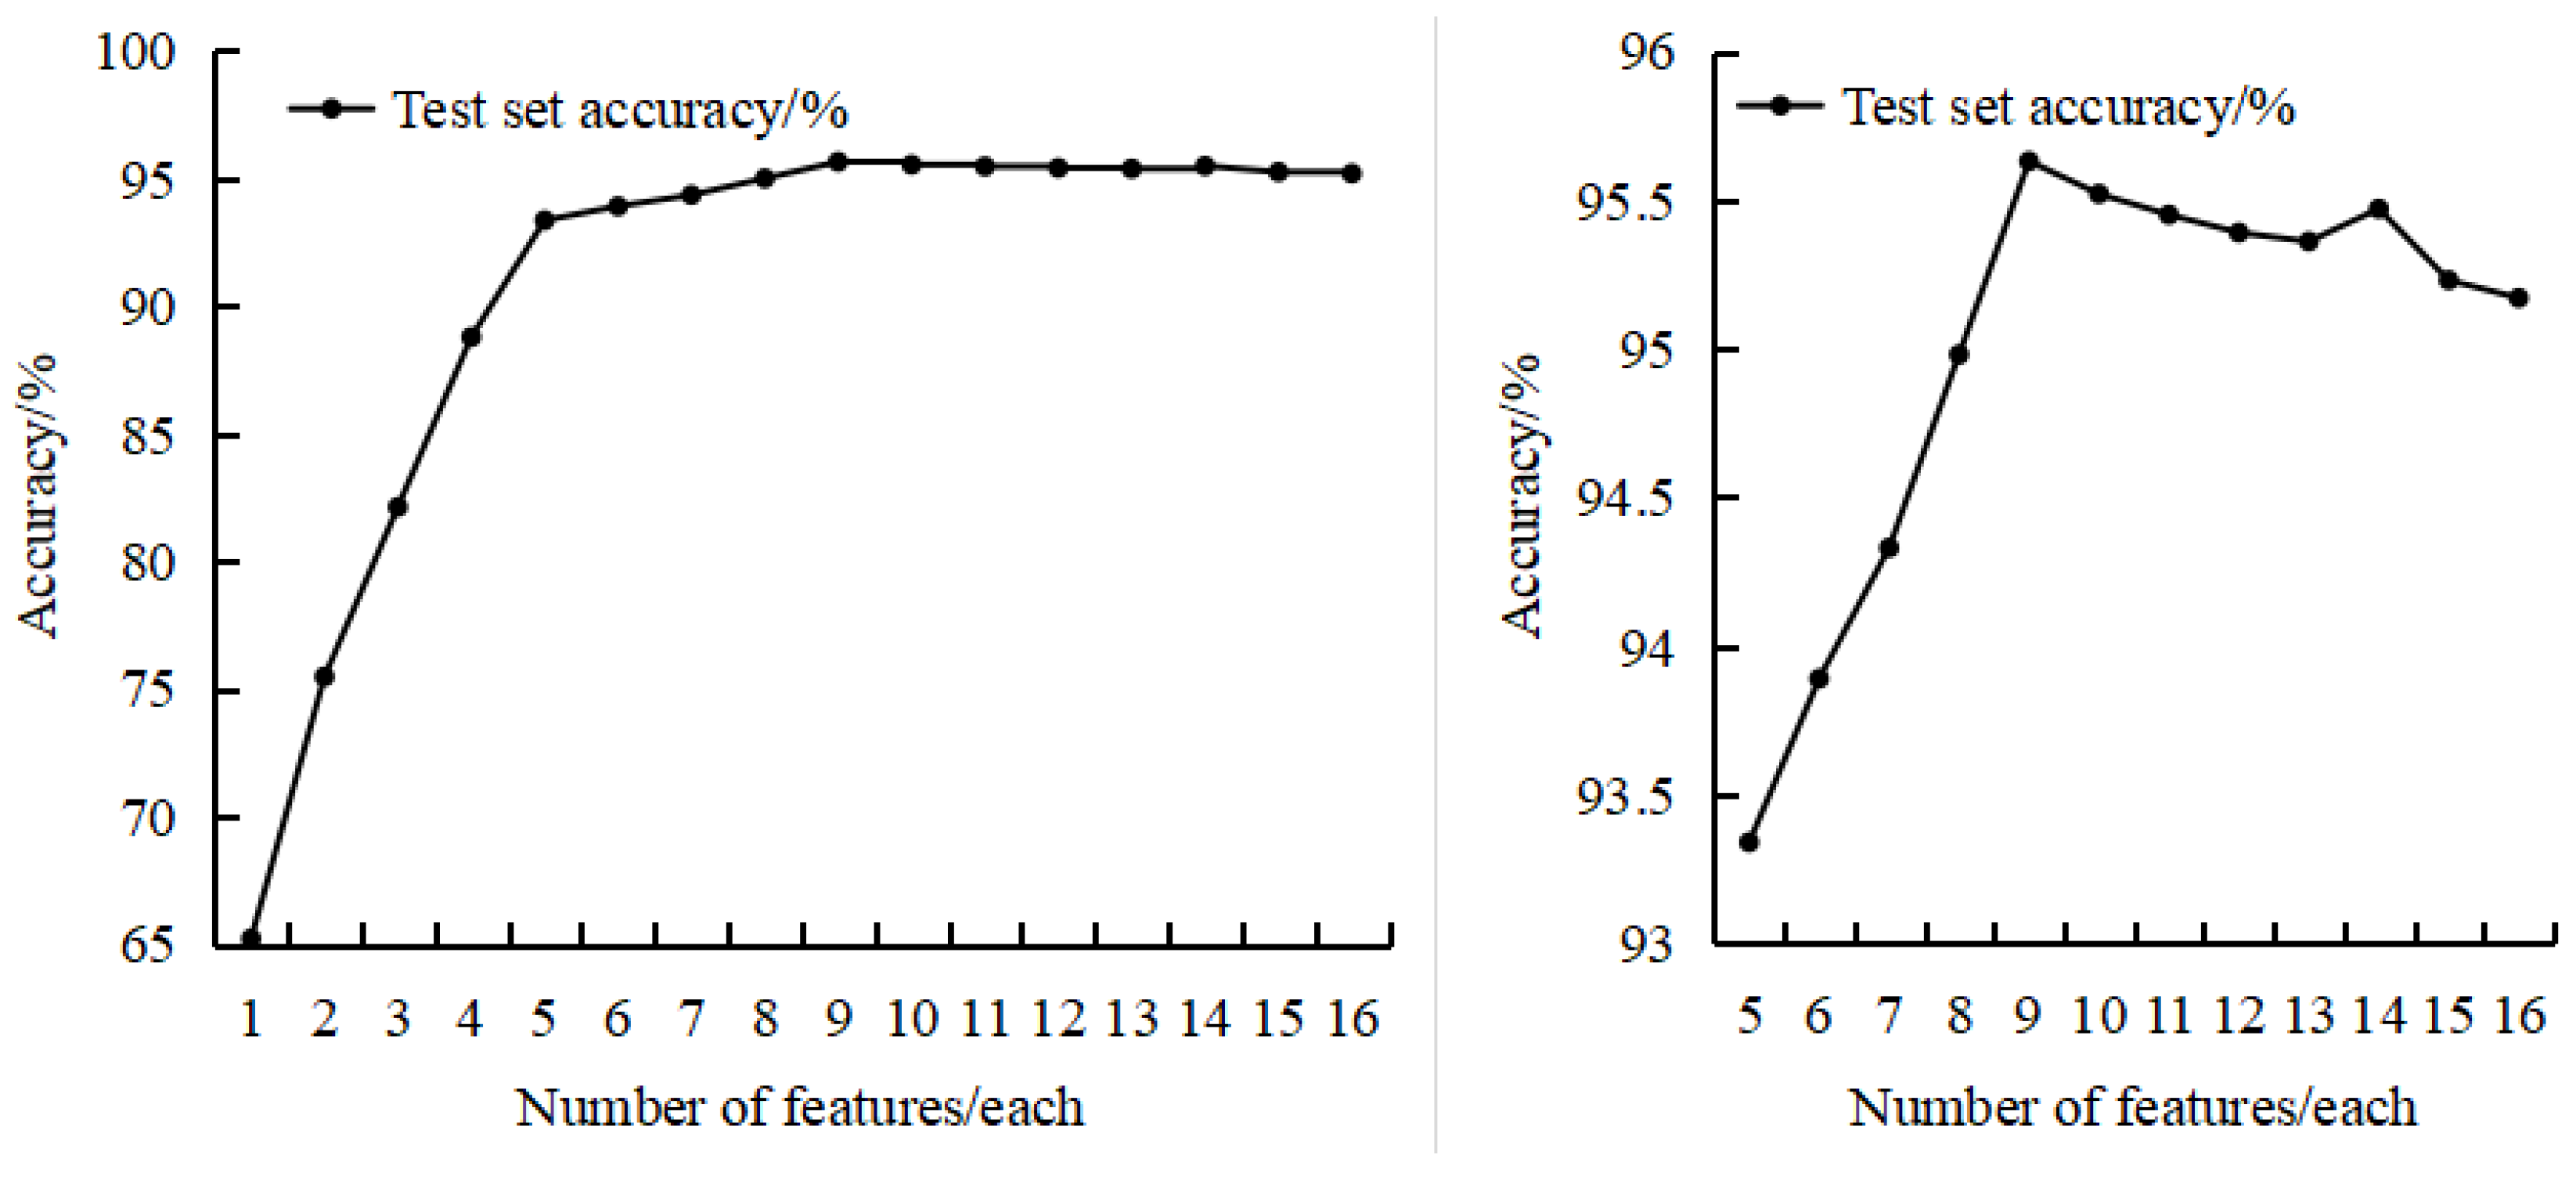
- Classification feature evaluation
- Model parameter optimization
2.3.4. Machine Learning Model Accuracy Evaluation Index
2.4. Technical Process
3. Results
3.1. Climate Suitability Zoning and Habitat Suitability Zoning Analysis Based on Physical Models
3.1.1. Spatial Distribution of Climate Suitability Zoning
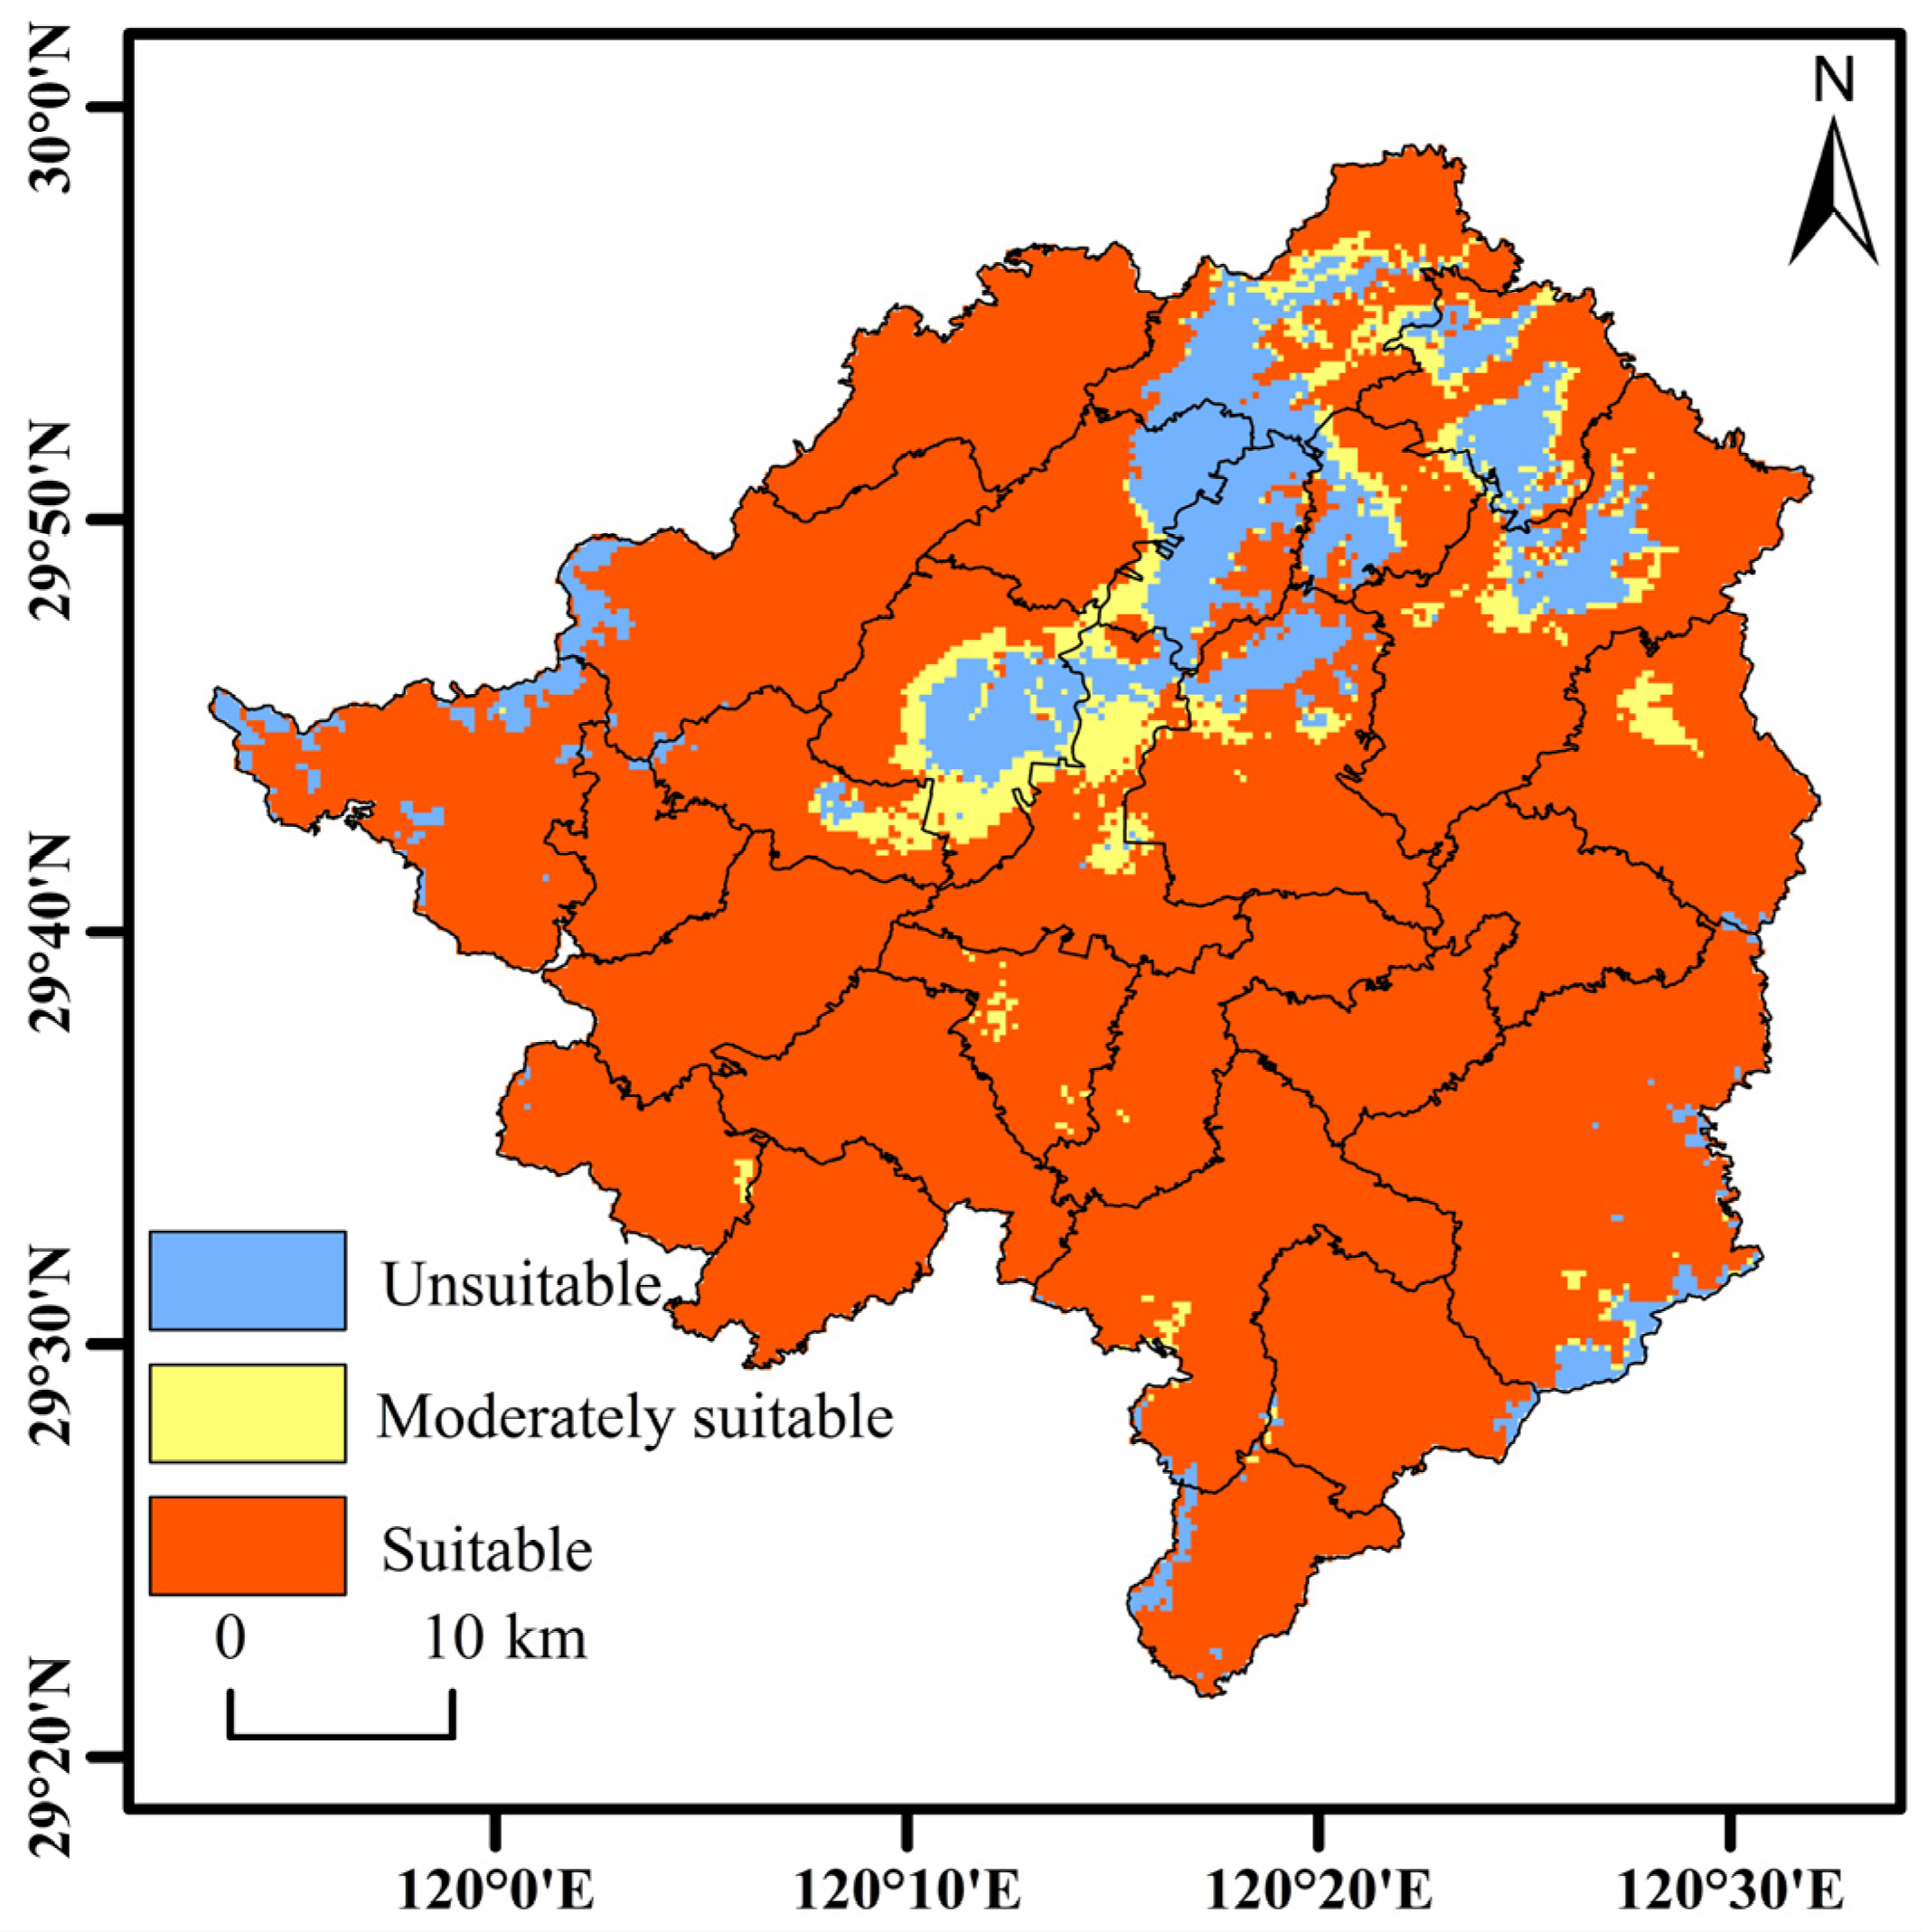
3.1.2. Spatial Distribution of Habitat Suitability Zones
3.2. Climate Suitability Zoning and Habitat Suitability Zoning Analysis Based on Machine Learning Methods
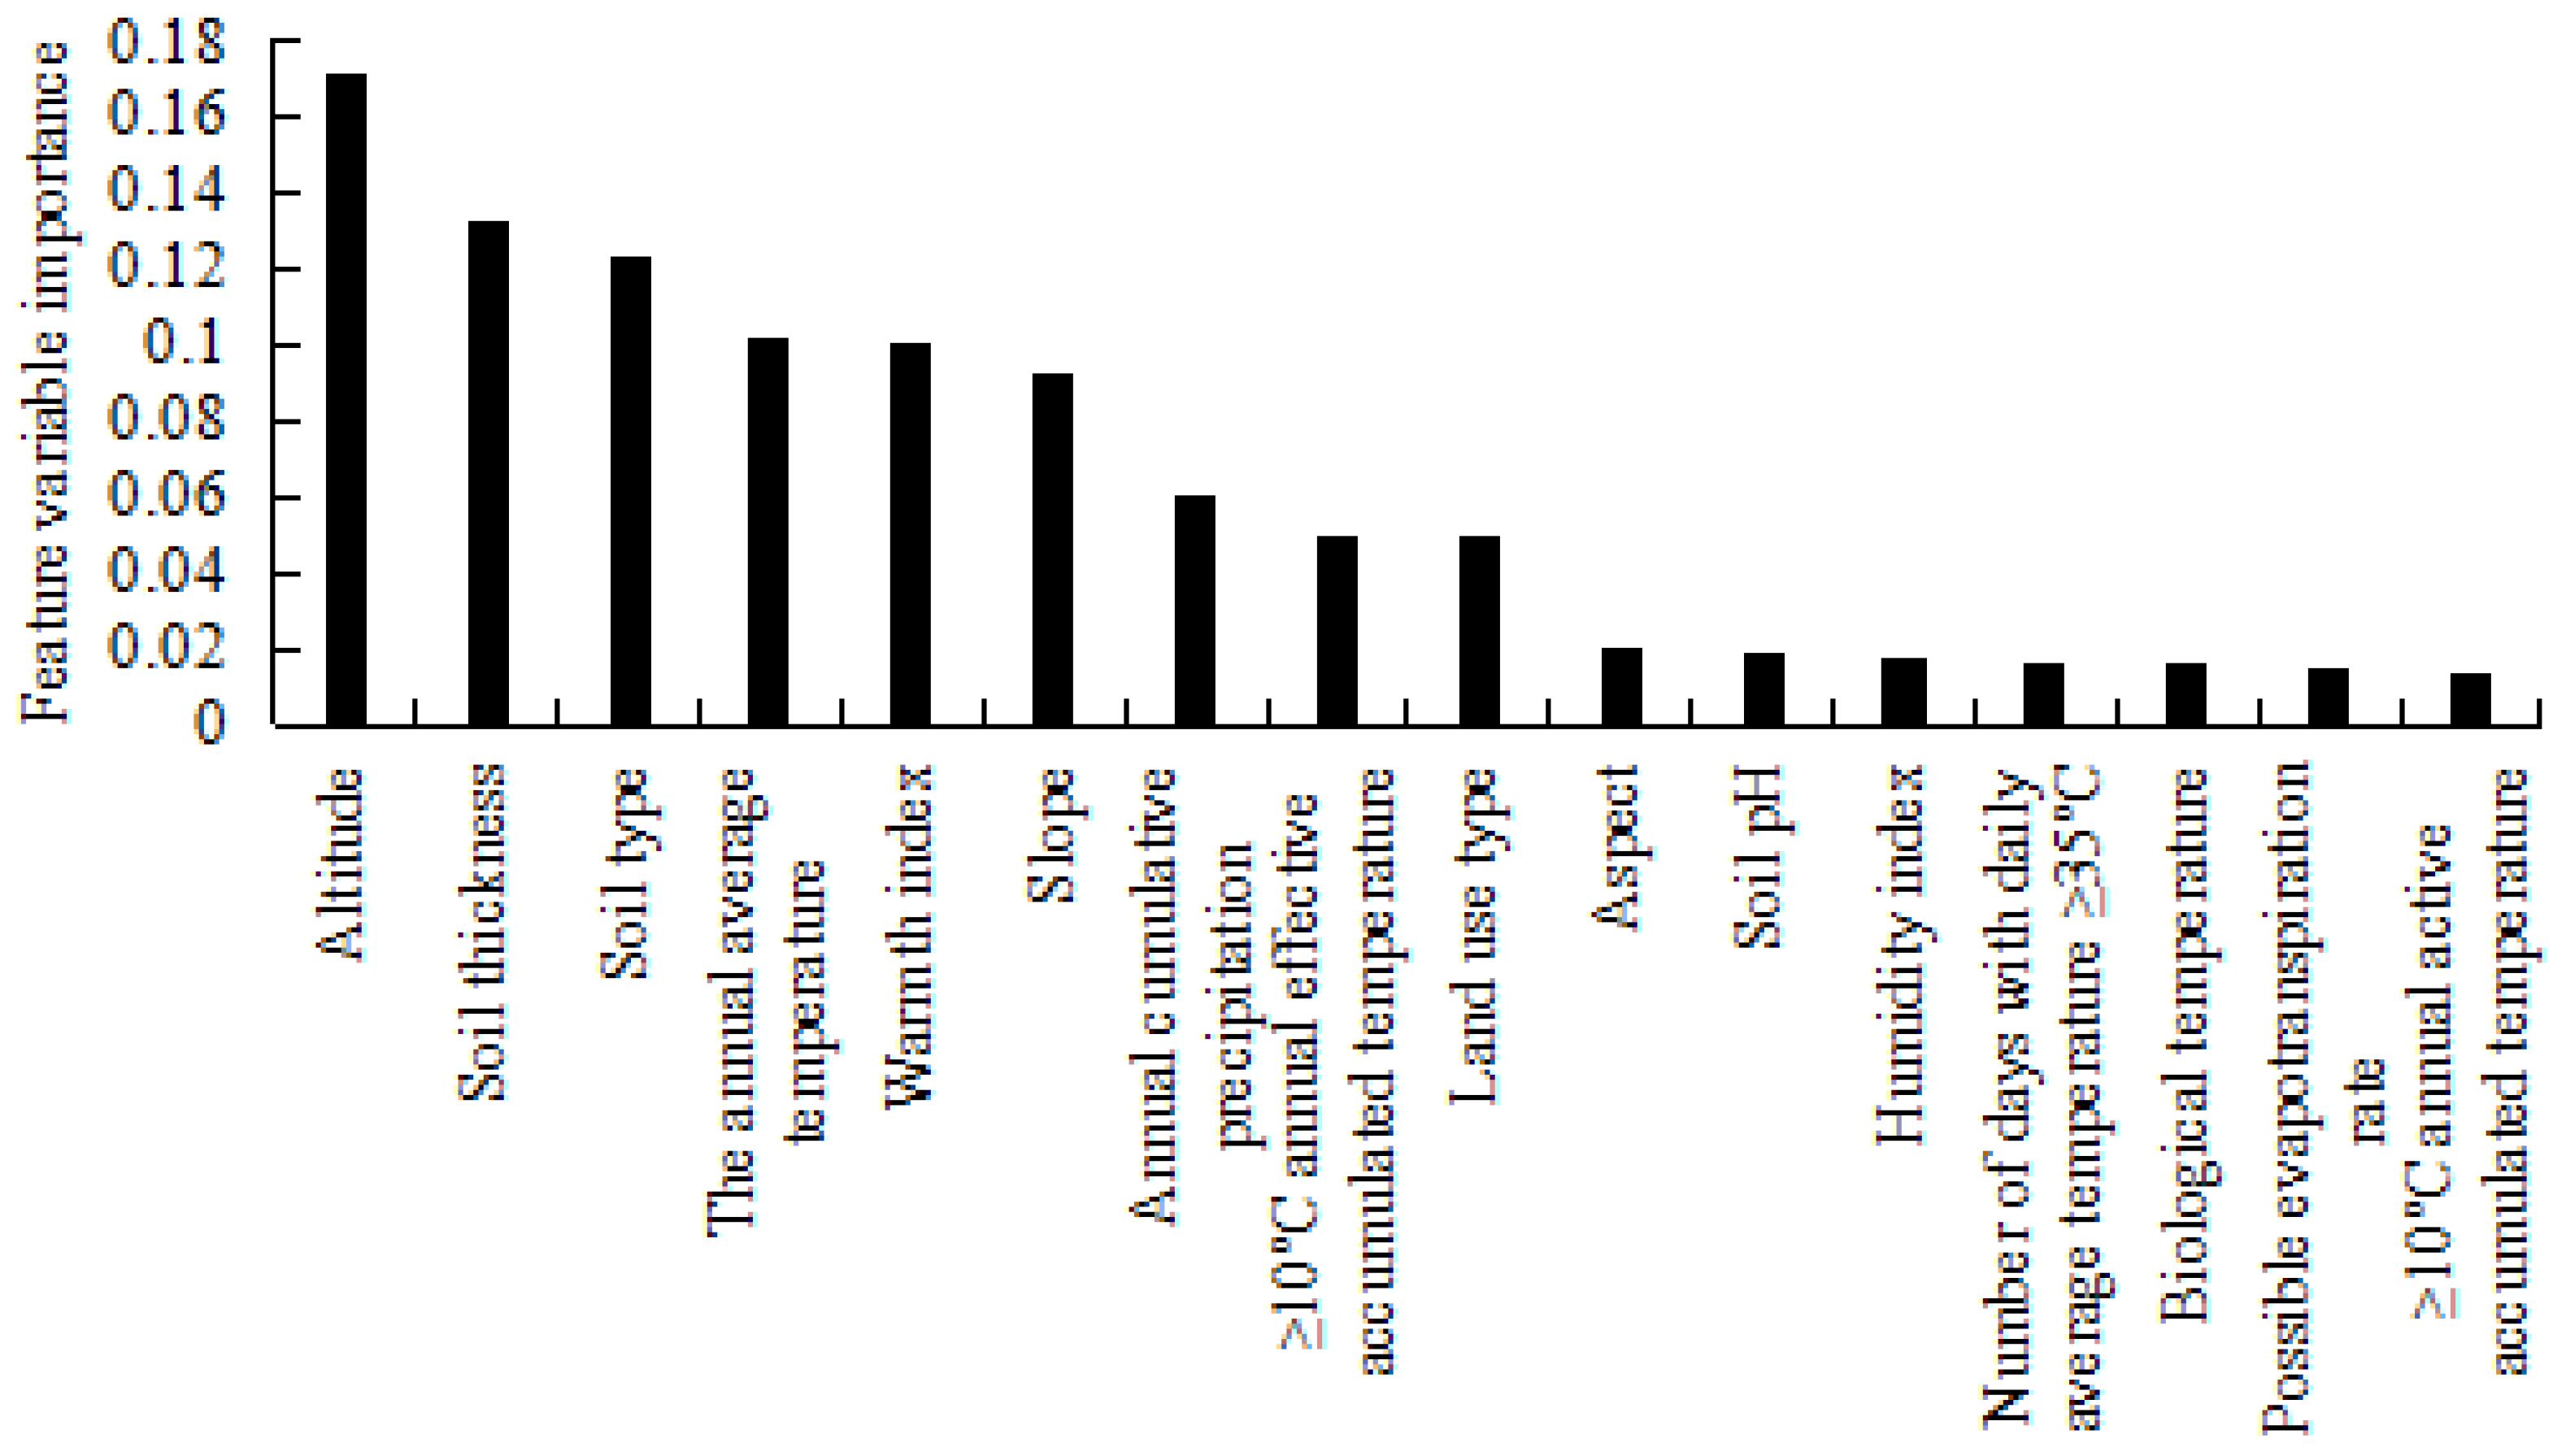
3.2.1. Classification Feature Evaluation Results
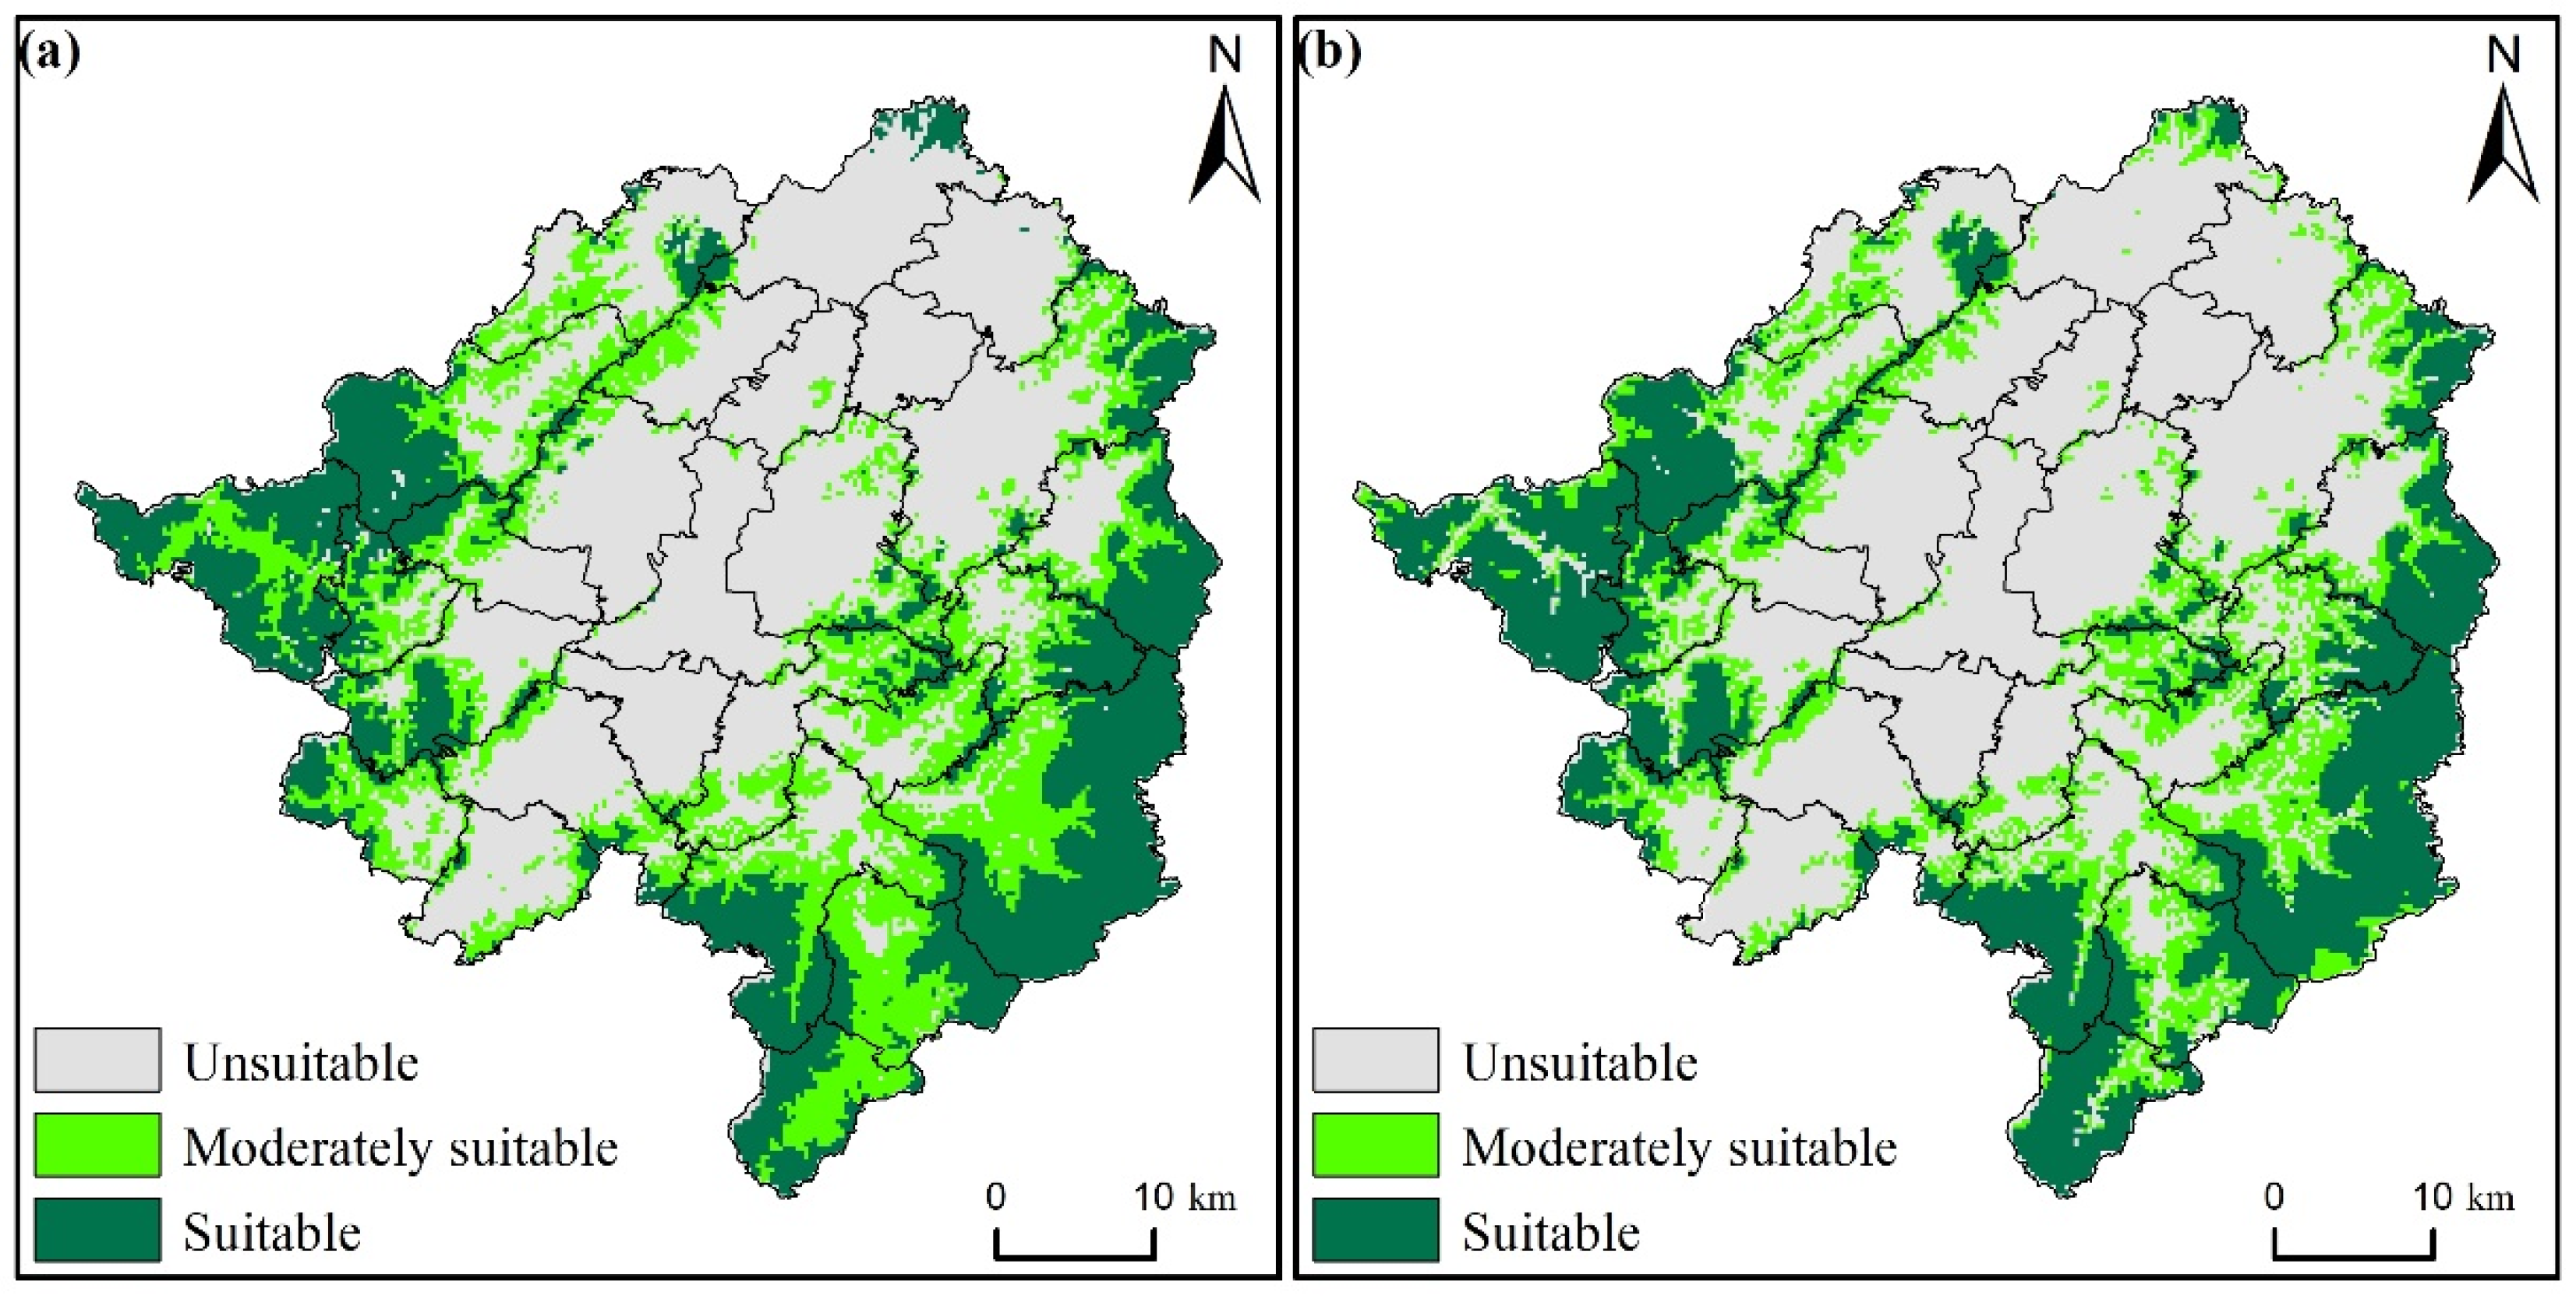
3.2.2. Spatial Classification Results for Climate Suitability Zones
3.2.3. Spatial Classification Results for Habitat Suitability Zones
3.3. Comparison of Zoning Results
4. Discussion
5. Conclusions
- (1)
- The suitable Torreya planting habitats in Zhuji city are distributed mainly in mountainous and hilly areas, while unsuitable areas are located mainly in central basins and northern river plains. Moderately suitable areas are found primarily in transitional zones between suitable and unsuitable areas. The main townships suitable for Torreya cultivation include Dongbaihu town, Zhaojia town, Donghe township, Majian town, Huangshan town, Yingdian Street town, Lingbei town, Chenzhai town, Fengqiao town, and Caota town.
- (2)
- In terms of the relative habitat suitability area, the distribution of climate-suitable areas is more extensive, indicating that climate factors in Zhuji city are not the primary limiting factors for Torreya cultivation. Soil and terrain factors play greater roles in limiting Torreya cultivation.
- (3)
- Machine learning classification algorithms can also achieve suitability zoning for cultivation, and their classification process is more concise and efficient. Compared to the SVM and NB algorithms, the RF algorithm demonstrated higher prediction accuracy in this study, achieving the best classification results.
Author Contributions
Funding
Institutional Review Board Statement
Data Availability Statement
Acknowledgments
Conflicts of Interest
References
- Sansavini, S. The role of research and technology in shaping a sustainable fruit industry: European advances and prospects. Rev. Bras. Frutic. 2006, 28, 550–558. [Google Scholar] [CrossRef]
- Shi, L.K.; Mao, J.H.; Zheng, L.; Zhao, C.W.; Jin, Q.Z.; Wang, X.G. Chemical characterization and free radical scavenging capacity of oils obtained from Torreya grandis Fort. ex. Lindl. and Torreya grandis Fort. var. Merrillii: A comparative study using chemometrics. Ind. Crops Prod. 2018, 115, 250–260. [Google Scholar] [CrossRef]
- Quan, W.; Zhang, C.; Wang, Z.; Zeng, M.; Qin, F.; He, Z.; Chen, J. Assessment antioxidant properties of Torreya grandis protein enzymatic hydrolysates: Utilization of industrial by-products. Food Biosci. 2021, 43, 101325. [Google Scholar] [CrossRef]
- Wu, L.; Wu, L.; Ni, R.; Yan, F. Economic benefits of Torreya grandis ‘Merrillii’ plantings. J. Zhejiang AF Univ. 2013, 30, 299–303. [Google Scholar]
- Laghari, A.; Kandhro, A.; Memon, A. Cold pressed Torreya grandis kernel oil. In Cold Pressed Oils; Elsevier: Amsterdam, The Netherlands, 2020; pp. 31–38. [Google Scholar]
- Chen, X.; Jin, H. Review of cultivation and development of Chinese torreya in China. For. Trees Livelihoods 2019, 28, 68–78. [Google Scholar] [CrossRef]
- Chen, X.; Jin, H. A case study of enhancing sustainable intensification of Chinese Torreya forest in Zhuji of China. Environ. Nat. Resour. Res. 2019, 9, 53–60. [Google Scholar] [CrossRef]
- Mohamed, A.; Reich, R.M.; Khosla, R.; Aguirre-Bravo, C.; Briseño, M.M. Influence of climatic conditions, topography and soil attributes on the spatial distribution of site productivity index of the species rich forests of Jalisco, Mexico. J. For. Res. 2014, 25, 87–95. [Google Scholar] [CrossRef]
- Tang, H.; Hu, Y.-Y.; Yu, W.-W.; Song, L.-L.; Wu, J.-S. Growth, photosynthetic and physiological responses of Torreya grandis seedlings to varied light environments. Trees 2015, 29, 1011–1022. [Google Scholar] [CrossRef]
- Al-Ruzouq, R.; Shanableh, A.; Yilmaz, A.G.; Idris, A.; Mukherjee, S.; Khalil, M.A.; Gibril, M.B.A. Dam site suitability mapping and analysis using an integrated GIS and machine learning approach. Water 2019, 11, 1880. [Google Scholar] [CrossRef]
- Radočaj, D.; Jurišić, M. GIS-based cropland suitability prediction using machine learning: A novel approach to sustainable agricultural production. Agronomy 2022, 12, 2210. [Google Scholar] [CrossRef]
- Taghizadeh-Mehrjardi, R.; Nabiollahi, K.; Rasoli, L.; Kerry, R.; Scholten, T. Land suitability assessment and agricultural production sustainability using machine learning models. Agronomy 2020, 10, 573. [Google Scholar] [CrossRef]
- El Baroudy, A. Mapping and evaluating land suitability using a GIS-based model. Catena 2016, 140, 96–104. [Google Scholar] [CrossRef]
- Dengiz, O.; Sezer, İ.; Özdemir, N.; Göl, C.; Yakupoğlu, T.; Öztürk, E.; Sırat, A.; Şahin, M. Application of GIS model in physical land evaluation suitability for rice cultivation. Anadolu Tarım Bilim. Derg. 2010, 25, 184–191. [Google Scholar]
- Chen, Y.; Wu, B.; Chen, D.; Qi, Y. Using machine learning to assess site suitability for afforestation with particular species. Forests 2019, 10, 739. [Google Scholar] [CrossRef]
- Xing, W.; Zhou, C.; Li, J.; Wang, W.; He, J.; Tu, Y.; Cao, X.; Zhang, Y. Suitability evaluation of tea cultivation using machine learning technique at town and village scales. Agronomy 2022, 12, 2010. [Google Scholar] [CrossRef]
- Morais, R. On the suitability, requisites, and challenges of machine learning. J. Opt. Commun. Netw. 2021, 13, A1–A12. [Google Scholar] [CrossRef]
- Cao, H.; Li, H.; Sun, W.; Xie, Y.; Huang, B. A boundary identification approach for the feasible space of structural optimization using a virtual sampling technique-based support vector machine. Comput. Struct. 2023, 287, 107118. [Google Scholar] [CrossRef]
- Chemura, A.; Schauberger, B.; Gornott, C.J.P.O. Impacts of climate change on agro-climatic suitability of major food crops in Ghana. PLoS ONE 2020, 15, e0229881. [Google Scholar] [CrossRef] [PubMed]
- Leng, G.; Hall, J.W. Predicting spatial and temporal variability in crop yields: An inter-comparison of machine learning, regression and process-based models. Environ. Res. Lett. 2020, 15, 044027. [Google Scholar] [CrossRef]
- Han, Y.; He, Y.; Liang, Z.; Shi, G.; Zhu, X.; Qiu, X. Risk Assessment and Application of Tea Frost Hazard in Hangzhou City Based on the Random Forest Algorithm. Agriculture 2023, 13, 327. [Google Scholar] [CrossRef]
- Kira, T. On the altitudinal arrangement of climatic zones in Japan. Kanchi-Nogaku 1948, 2, 143–173. [Google Scholar]
- Holdridge, L.R. Life Zone Ecology; CABI: Wallingford, UK, 1967. [Google Scholar]
- Xu, W. Ji Liang’s caloric index and its application in Chinese vegetation. J. Ecol. 1985, 3, 35–39. [Google Scholar]
- Tharwat, A. Parameter investigation of support vector machine classifier with kernel functions. Knowl. Inf. Syst. 2019, 61, 1269–1302. [Google Scholar] [CrossRef]
- Ghaddar, B.; Naoum-Sawaya, J. High dimensional data classification and feature selection using support vector machines. Eur. J. Oper. Res. 2018, 265, 993–1004. [Google Scholar] [CrossRef]
- Vabalas, A.; Gowen, E.; Poliakoff, E.; Casson, A.J. Machine learning algorithm validation with a limited sample size. PLoS ONE 2019, 14, e0224365. [Google Scholar] [CrossRef] [PubMed]
- Cervantes, J.; Garcia-Lamont, F.; Rodríguez-Mazahua, L.; Lopez, A. A comprehensive survey on support vector machine classification: Applications, challenges and trends. Neurocomputing 2020, 408, 189–215. [Google Scholar] [CrossRef]
- Nayak, J.; Naik, B.; Behera, H. A comprehensive survey on support vector machine in data mining tasks: Applications & challenges. Int. J. Database Theory Appl. 2015, 8, 169–186. [Google Scholar]
- Löw, F.; Michel, U.; Dech, S.; Conrad, C. Impact of feature selection on the accuracy and spatial uncertainty of per-field crop classification using support vector machines. ISPRS J. Photogramm. Remote Sens. 2013, 85, 102–119. [Google Scholar] [CrossRef]
- He, J.; Mattis, S.A.; Butler, T.D.; Dawson, C.N. Data-driven uncertainty quantification for predictive flow and transport modeling using support vector machines. Comput. Geosci. 2019, 23, 631–645. [Google Scholar] [CrossRef]
- Dehghanisanij, H.; Emami, H.; Emami, S.; Rezaverdinejad, V. A hybrid machine learning approach for estimating the water-use efficiency and yield in agriculture. Sci. Rep. 2022, 12, 6728. [Google Scholar] [CrossRef]
- Kok, Z.H.; Shariff, A.R.M.; Alfatni, M.S.M.; Khairunniza-Bejo, S. Support vector machine in precision agriculture: A review. Comput. Electron. Agric. 2021, 191, 106546. [Google Scholar] [CrossRef]
- Son, N.T.; Chen, C.F.; Chen, C.R.; Minh, V.Q. Assessment of Sentinel-1A data for rice crop classification using random forests and support vector machines. Geocarto Int. 2018, 33, 587–601. [Google Scholar] [CrossRef]
- Tatsumi, K.; Yamashiki, Y.; Torres, M.A.C.; Taipe, C.L.R. Crop classification of upland fields using Random forest of time-series Landsat 7 ETM+ data. Comput. Electron. Agric. 2015, 115, 171–179. [Google Scholar] [CrossRef]
- Castro-Franco, M.; Costa, J.L.; Peralta, N.; Aparicio, V. Prediction of soil properties at farm scale using a model-based soil sampling scheme and random forest. Soil Sci. 2015, 180, 74–85. [Google Scholar] [CrossRef]
- Dang, C.; Liu, Y.; Yue, H.; Qian, J.; Zhu, R. Autumn crop yield prediction using data-driven approaches:-support vector machines, random forest, and deep neural network method. Can. J. Remote Sens. 2021, 47, 162–181. [Google Scholar] [CrossRef]
- Kovačević, M.; Bajat, B.; Gajić, B. Soil type classification and estimation of soil properties using support vector machines. Geoderma 2010, 154, 340–347. [Google Scholar] [CrossRef]
- Dziugaite, G.; Ben-David, S.; Roy, D. Enforcing interpretability and its statistical impacts: Trade-offs between accuracy and interpretability. arXiv 2020, arXiv:2010.13764. [Google Scholar]
- ElShawi, R.; Sherif, Y.; Al-Mallah, M.; Sakr, S. Interpretability in healthcare: A comparative study of local machine learning interpretability techniques. Comput. Intell. 2021, 37, 1633–1650. [Google Scholar] [CrossRef]


| Classification | Suitable Type | F1-Score | User Accuracy/% | Overall Accuracy/% | Kappa Coefficient | R2 |
|---|---|---|---|---|---|---|
| RF | Suitable | 0.99 | 99.32% | 98.08% | 0.9937 | 0.9957 |
| Moderately suitable | 0.98 | 98.46% | ||||
| Unsuitable | 0.97 | 97.46% | ||||
| SVM | Suitable | 0.89 | 89.03% | 83.36% | 0.7141 | 0.5554 |
| Moderately suitable | 0.69 | 69.23% | ||||
| Unsuitable | 0.79 | 78.80% | ||||
| NB | Suitable | 0.76 | 61.29% | 48.30% | 0.2856 | 0.3019 |
| Moderately suitable | 0.32 | 98.46% | ||||
| Unsuitable | 0.15 | 8.70% |
| Classification | Suitable Type | F1-Score | User Accuracy/% | Overall Accuracy/% | Kappa Coefficient | R2 |
|---|---|---|---|---|---|---|
| SVM | Suitable | 0.92 | 90.37% | 91.95% | 0.8743 | 0.8933 |
| Moderately suitable | 0.83 | 88.54% | ||||
| Unsuitable | 0.96 | 94.61% | ||||
| RF | Suitable | 0.92 | 96.08% | 95.17% | 0.9243 | 0.9268 |
| Moderately suitable | 0.90 | 91.67% | ||||
| Unsuitable | 0.97 | 96.30% |
| Number of Pixels and Overlap Rate | Suitable Category | Moderately Suitable Category | Unsuitable Category | Zhuji |
|---|---|---|---|---|
| Number of physical model simulation pixels/each | 9157 | 6106 | 18,775 | 34,038 |
| SVM model predicts the number of pixels/each | 8935 | 8323 | 16,780 | 34,038 |
| The number of pixels in the overlap between the SVM model and the physical model/each | 7337 | 4362 | 15,866 | 27,565 |
| SVM model pixel overlap rate/% | 80.12% | 71.44% | 84.51% | 80.98% |
| RF model predicts the number of pixels/each | 9304 | 6494 | 18,240 | 34,038 |
| The number of pixels in the overlap between the RF model and the physical model/each | 7846 | 4360 | 17,195 | 29,401 |
| RF model pixel overlap rate/% | 85.68% | 71.41% | 91.58% | 86.38% |
Disclaimer/Publisher’s Note: The statements, opinions and data contained in all publications are solely those of the individual author(s) and contributor(s) and not of MDPI and/or the editor(s). MDPI and/or the editor(s) disclaim responsibility for any injury to people or property resulting from any ideas, methods, instructions or products referred to in the content. |
© 2024 by the authors. Licensee MDPI, Basel, Switzerland. This article is an open access article distributed under the terms and conditions of the Creative Commons Attribution (CC BY) license (https://creativecommons.org/licenses/by/4.0/).
Share and Cite
Wu, L.; Yang, L.; Li, Y.; Shi, J.; Zhu, X.; Zeng, Y. Evaluation of the Habitat Suitability for Zhuji Torreya Based on Machine Learning Algorithms. Agriculture 2024, 14, 1077. https://doi.org/10.3390/agriculture14071077
Wu L, Yang L, Li Y, Shi J, Zhu X, Zeng Y. Evaluation of the Habitat Suitability for Zhuji Torreya Based on Machine Learning Algorithms. Agriculture. 2024; 14(7):1077. https://doi.org/10.3390/agriculture14071077
Chicago/Turabian StyleWu, Liangjun, Lihui Yang, Yabin Li, Jian Shi, Xiaochen Zhu, and Yan Zeng. 2024. "Evaluation of the Habitat Suitability for Zhuji Torreya Based on Machine Learning Algorithms" Agriculture 14, no. 7: 1077. https://doi.org/10.3390/agriculture14071077