Article

Contributions of Soil Moisture and Vegetation on Surface-Air Temperature Difference during the Rapid Warming Period

State Key Laboratory of Sever Weather, Chinese Academy of Meteorological Sciences, Beijing 100081, China
*
Author to whom correspondence should be addressed.
Agriculture 2024, 14(7), 1090; https://doi.org/10.3390/agriculture14071090 (registering DOI)
Submission received: 18 June 2024 / Revised: 3 July 2024 / Accepted: 4 July 2024 / Published: 6 July 2024
(This article belongs to the Section Ecosystem, Environment and Climate Change in Agriculture)

Abstract

:
The difference (DIF) between land surface temperature (Ts) and near surface air temperature (Ta) is the key indicator of the energy budget of the land surface, which has a more complex process than the individual Ts or Ta. However, the spatiotemporal variations and influencing factors of DIF remain incomplete. The contribution of vegetation and soil moisture (SM) as key driving factors to DIF is not yet clear. Here, we analyzed the spatiotemporal variation patterns of DIF in China from 2011 to 2023 using in situ Ts and Ta data. A convergent cross-mapping method was employed to explore the causal relationship between SM, NDVI and DIF, and subsequently calculated the contribution of NDVI and SM variations to DIF under different climatic backgrounds. The results indicate that during the study period, DIF values were all above 0 °C and showed a significant increasing trend with a national mean slope of 0.02 °C/a. In general, vegetation and SM have a driving effect on DIF, with vegetation contributing more to DIF (0.11) than SM (0.08) under different surface properties. The background values of SM and temperature have a significant effect on the spatial and temporal distribution of DIF, as well as the correlation of vegetation and soil moisture to DIF. The study outcomes contribute to a better understanding of the coupling relationship between the land surface and atmosphere, which are also crucial for addressing climate change and ecological environmental management.

1. Introduction

Land surface temperature (Ts) and air temperature (Ta) are both key variables in the energy budget of the land’s surface [1,2,3,4]. Ts represents the thermal state of the Earth’s surface, while Ta represents the thermal state of the atmosphere at 2 m above the ground [5,6]. Ts and Ta play an irreplaceable role in areas related to climate change [7,8]. In addition to individual Ts and Ta, the surface–air temperature difference (DIF) is also a critical variable that affects the land surface energy balance [9]. DIF is the principal contributor to sensible heat flux, with many researchers utilizing DIF to study the variations of sensible heat flux [10,11]. According to statistics from the National Aeronautics and Space Administration (NASA), global Ts and Ta have been gradually increasing, with the rate of warming intensifying after 2011 (https://data.giss.nasa.gov/gistemp/ (accessed on 15 June 2024)). The World Meteorological Organization’s 2023 global climate report also indicates that the period from 2011 to 2023 was the fastest warming decade on record [12]. Since 1975, according to NASA’s statistics, the rate of Ts increase has been higher than that of Ta, with the DIF gradually increasing, particularly significantly after 2011. The increase in DIF will lead to a higher frequency and intensity of extreme events, exacerbate climate change, impact agricultural production and increase the likelihood of meteorological disasters [13,14]. Therefore, enhancing research on DIF is of significant importance for understanding climate change and its impacts.
Ts and Ta have significant spatial heterogeneity; therefore, previous studies on DIF have mostly focused on analyzing the spatial and temporal variation patterns of DIF and its influencing factors. The research by Liao et al. (2019) indicates significant seasonal differences in DIF in China, with DIF values consistently above 0 °C, suggesting that Ts in China are higher than Ta [15]. Li et al. (2024) suggest that since 2001, there has been a warming hiatus in Ta in the Qinghai-Tibet Plateau region, while Ts have continued to rise, leading to an increasing trend in DIF in this region [16].
For the study of factors influencing DIF, the interaction between Ts and Ta is determined by atmospheric conditions (such as net radiation, wind, precipitation (PRE) and humidity), shallow ground properties (such as soil texture and soil moisture), as well as all existing features at the surface-air interface. Therefore, researchers tend to select variables that affect energy balance, such as radiation [17], topography [18], vegetation [9] and soil moisture [19], to determine the factors influencing DIF variations. Many studies have reported the dominant role of net radiation on DIF at various spatial and temporal scales [16,20,21]. However, these studies only focus on whether individual factors have an effect on DIF, without a comparative assessment of the importance of the influencing factors.
Soil moisture (SM) is a key driver of climate change [22,23], influencing the distribution of sensible heat flux and latent heat flux, thereby significantly impacting climate processes, especially air temperature, boundary layer stability and precipitation processes [24,25]. A decrease in SM restricts latent heat flux, leading to an increase in sensible heat flux and subsequently raising Ts, affecting DIF. Additionally, SM plays a crucial regulatory role in vegetation distribution, soil evaporation and precipitation processes [26,27].
In general, the soil moisture data are obtained using two methods, i.e., the direct and indirect methods. The direct method, mainly the gravimetric method, has been frequently utilized to provide accurate soil moisture content data at various soil layers [28]. The indirect methods include the device-based measurement sensors, satellite-based remote sensing technology, as well as the multi-source data based assimilate models [29,30].
Changes in vegetation play a crucial role in regional and global ecological climate change [31,32,33]. Vegetation affects temperature by altering the thermal characteristics of the land surface and the atmosphere [34]. Additionally, vegetation influences greenhouse gas emissions and land surface hydrological processes, which in turn can alter DIF [35,36]. Therefore, vegetation also plays a vital role in DIF changes. While the dominant role of atmospheric conditions (such as radiation) is undeniable, the relative importance of vegetation and SM on DIF requires further investigation.
Based on this, the main purpose of this study is to investigate the spatiotemporal variations of DIF in China from 2011 to 2023, clarify the impacts of vegetation and SM on DIF and compare their contributions to DIF changes. In situ Ts, Ta and SM data in China, as well as satellite remote-sensing NDVI data, were used in the study. Section 1 provides basic information of the data used in this study. Section 2 elaborates on the research methods. Section 3 presents the results and the discussions are displayed in Section 4. Finally, the study conclusions are summarized in Section 5. The results of this study will reveal the differential driving roles of vegetation and SM in the changes of DIF in China during a period of rapid climate warming, providing insights for climate change adaptation and ecological management.

2. Materials and Methods

2.1. Materials

In this study, in situ Ts and Ta observations are used to calculate the DIF over China region. We explore the driving effect of SM and NDVI on DIF in different PRE gradients, DEM gradients and climate zones, respectively. All time series data used in this study were harmonized to monthly scale. The following sections provide further details of these datasets.

2.1.1. In Situ Data

The in situ data were obtained from China Meteorological Administration (CMA) (http://idata.cma/cmadaas/ (accessed on 15 June 2024)). Daily Ts, Ta and PRE data at 1260 stations (Figure 1) spanning 2011 to 2023. Ts and Ta were used to calculate the difference (DIF) between Ts and Ta, and further to detect the changes of Ts, Ta and DIF. The daily PRE data at the same stations were used to generate annual precipitation gradient. Hourly SM data were obtained from automated soil moisture observatories with station locations and time spans corresponding to Ts data, which was used to study the effect of soil moisture on DIF.

2.1.2. Elevation Data

The Global Multi-resolution Terrain Elevation Data 2010 (GMTED2010) was provided by The USGS and the National Geospatial-Intelligence Agency (NGA) (https://www.usgs.gov/ (accessed on 15 June 2024)), which has replaced GTOPO30 as the elevation dataset of choice for global and continental scale applications. The 30 arcsecond spatial resolutions GMTED2010 images covering China were downloaded and processed using ENVI [37]. In addition, the GMTED2010 data corresponding to 1260 site locations were extracted. The elevation data were selected to explore the relationship between SM, NDVI and DIF under different elevation gradients.

2.1.3. Vegetation Index data

Normalized Difference Vegetation Index (NDVI) data were selected to explore the influence of vegetation on DIF. NDVI data are obtained from the Moderate Resolution Imaging Spectroradiometer (MODIS) satellite’s MOD13C2 NDVI product (https://ladsweb.modaps.eosdis.nasa.gov/search/ (accessed on 15 June 2024)). The spatial resolution of the data are 0.05° and the temporal resolution is 1 month. We also extracted NDVI data for 1260 station locations.

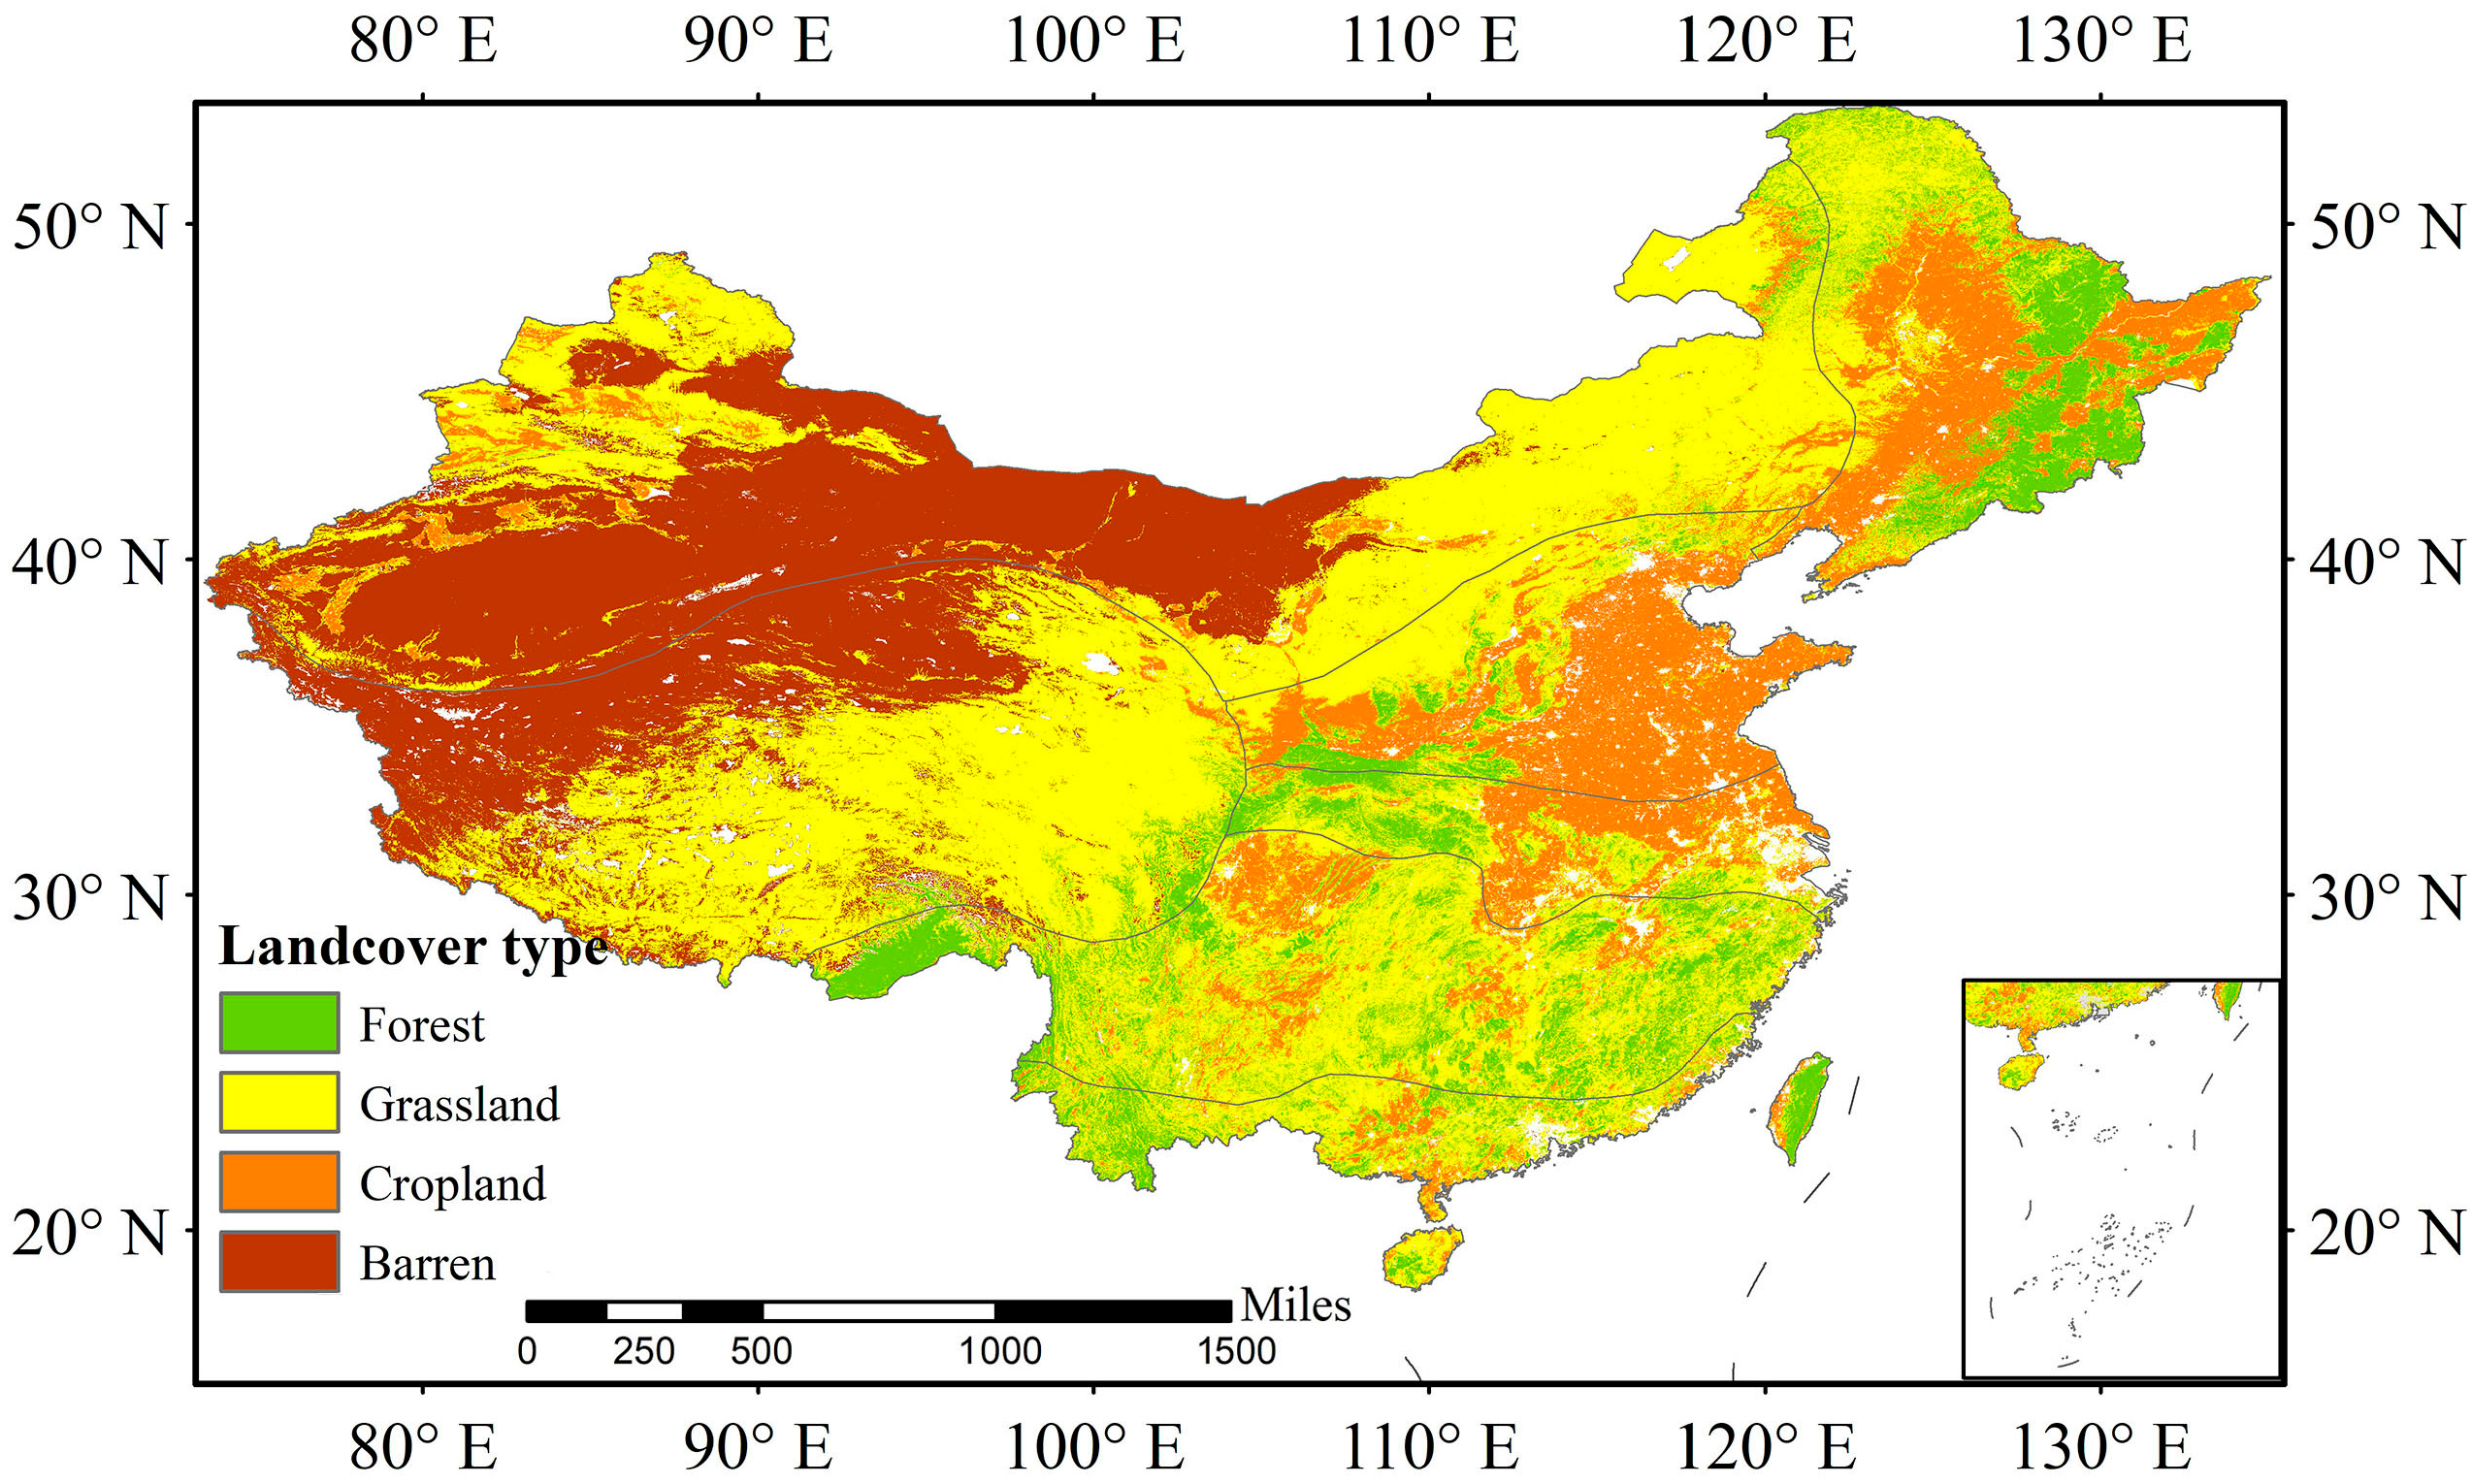
2.1.4. Land Cover Type Data

The International Geosphere Biosphere Programme (IGBP) classification was selected as the land cover type data from MCD12C1 product to explore the influence of SM, NDVI on DIF under different land cover types. In order to reduce the influence of land cover change, 3-year data (2011, 2016 and 2023) of MCD12C1 land cover type were used. Only stations where the land cover type had not changed in the 3 years were counted. Moreover, forest, grassland, cropland and barren land were chosen to explore the difference of the effect of SM and NDVI on DIF. The spatial distribution map of land cover type is shown in Figure 2.

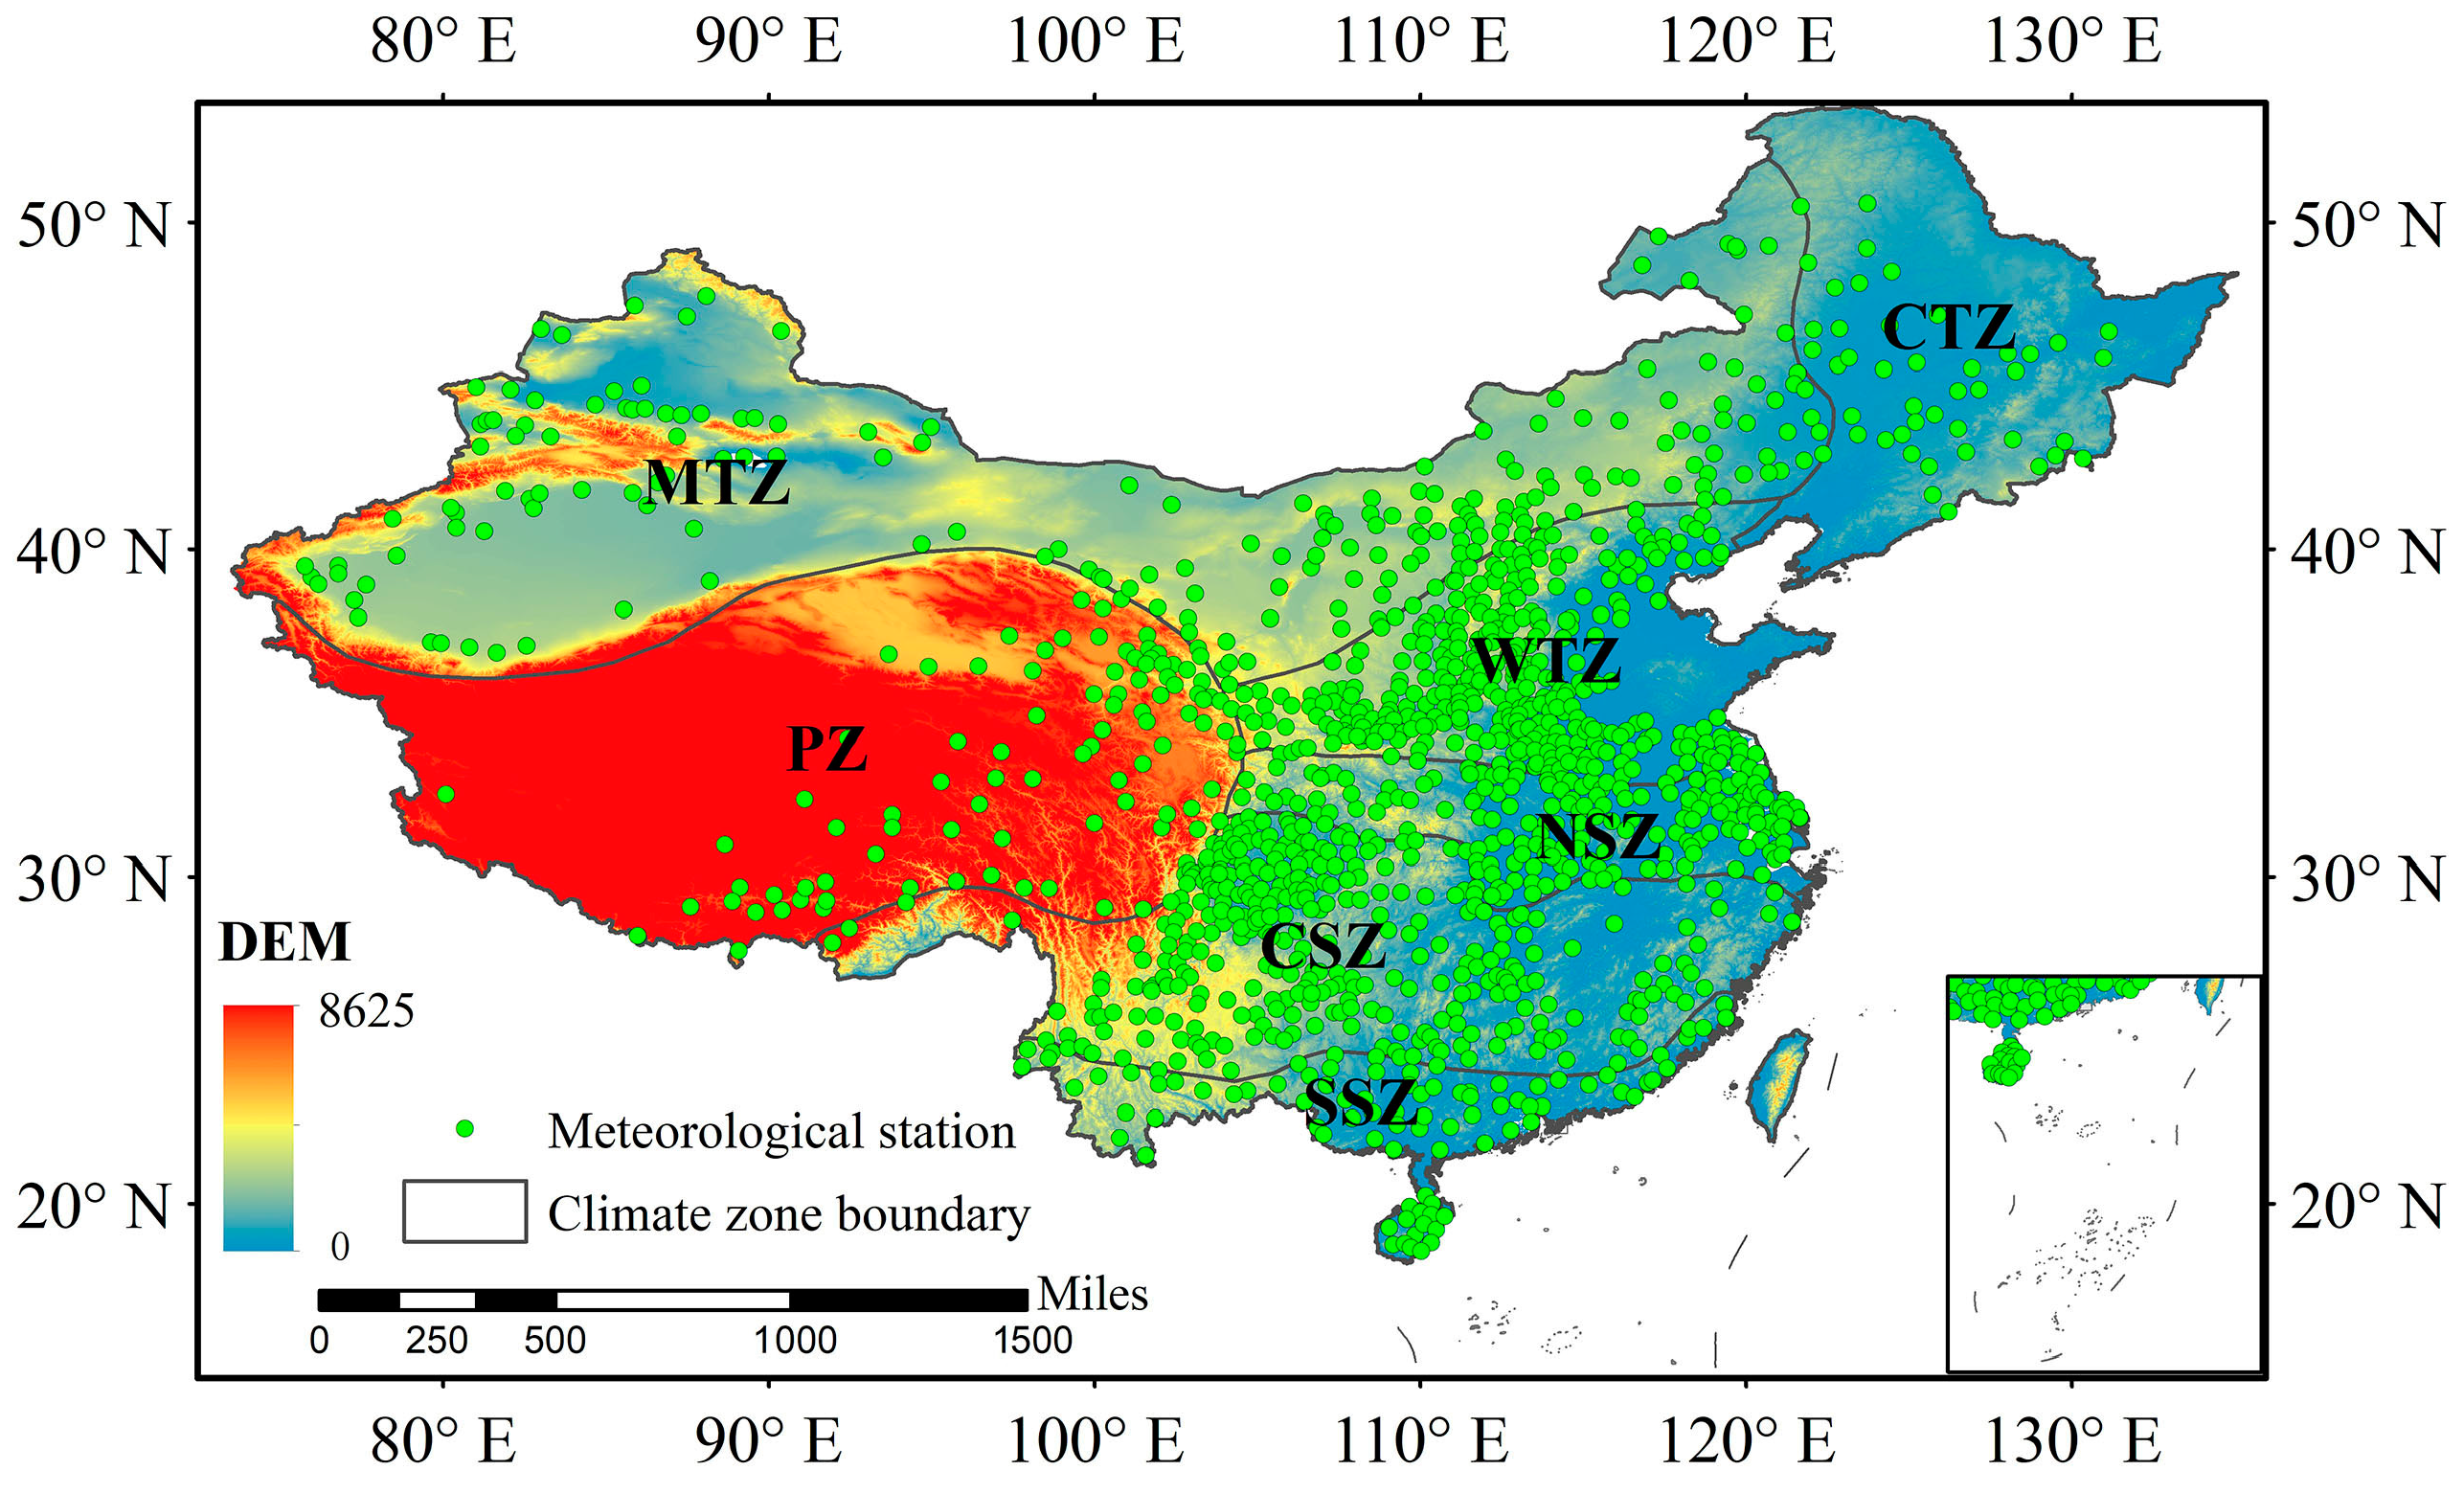
2.1.5. Climate Type Data

Local climate types also have an impact on DIF [38]. The climate type classification proposed by Huang (1958) was used in this study [39], which divides China into seven climate zones. The geographical locations of the climate zones are shown in Figure 1. We analyzed the relationship between SM, NDVI and DIF under different climate types.

2.2. Methods

2.2.1. Calculation of Surface–Air Temperature Difference (DIF)

DIF is defined as the difference between Ts and Ta, and it can be calculated as follows:
D I F = T s T a
where DIF is the difference between Ts and Ta. Ts and Ta are the in situ daily mean land surface temperature and air temperature, respectively.

2.2.2. Theil-Sen Trend Analysis

The Theil-Sen trend analysis method was used to calculate the slopes of change from 2011 to 2023 for each variable in this study. The method was proposed to study the long-term sequential changes by Sen in 1968 [40].
S l o p e = M e d i a n ( x j x i j i ) , j > i = 1 , 2 , 3 , , n
where x is the value to be analyzed, j and i are the time sequence and n is the sequence length. When Slope > 0, it means that the variable has an upward trend with the time series, and vice versa, it has a downward trend.

2.2.3. Correlation Analysis

In order to analyze the correlation between SM, NDVI and DIF, correlation analysis was conducted on SM, NDVI and DIF (Equation (3)), and a correlation coefficient was used to represent the magnitude of correlation [41].
R x y = i = 1 n ( x i x ¯ ) ( y y ¯ ) i = 1 n ( x i x ¯ ) 2 i = 1 n ( y y ¯ ) 2
where Rxy is the correlation coefficient of variables x and y, corresponding to SM, NDVI and DIF, respectively. x ¯  and y ¯ are the multi-year means and n is the station number, which is 1260.

2.2.4. Casual Analysis

Convergent cross-mapping (CCM) is an approach for detecting the causal relationship in a nonlinear dynamical system, which is based on Takens’ theorem [42,43,44,45,46]. In CCM, causality is detected by measuring the extent to which the time series historical record of one variable can reliably estimate the states of the other variable. The cross-map skill is used to reflect the causal relationship status between two variables. If the cross-map skill increases with the length of the time series and convergence is present, then the causal effect of X on Y can be inferred. The magnitude of the cross-map skill value corresponding to the convergence location responds to the strength of the causal relationship between the variables. More details can be found in Sugihara et al. (2012) [44].

2.2.5. Contribution Analysis

Contribution analysis uses the method of variation partitioning to determine the contributions of NDVI and SM to DIF changes in different land surface types/climatic zones. Variance partitioning is widely used in ecological analysis, but traditional variance partitioning analysis methods usually cannot quantify the separate contributions of each factor. However, the rdacca.hp package recently published by Lai et al. (2022) [47] in R can solve the shortcomings of traditional variance functions and provide the separate contribution of each factor. This study will use the rdacca.hp package to calculate the separate contributions of NDVI and SM to DIF.

3. Results

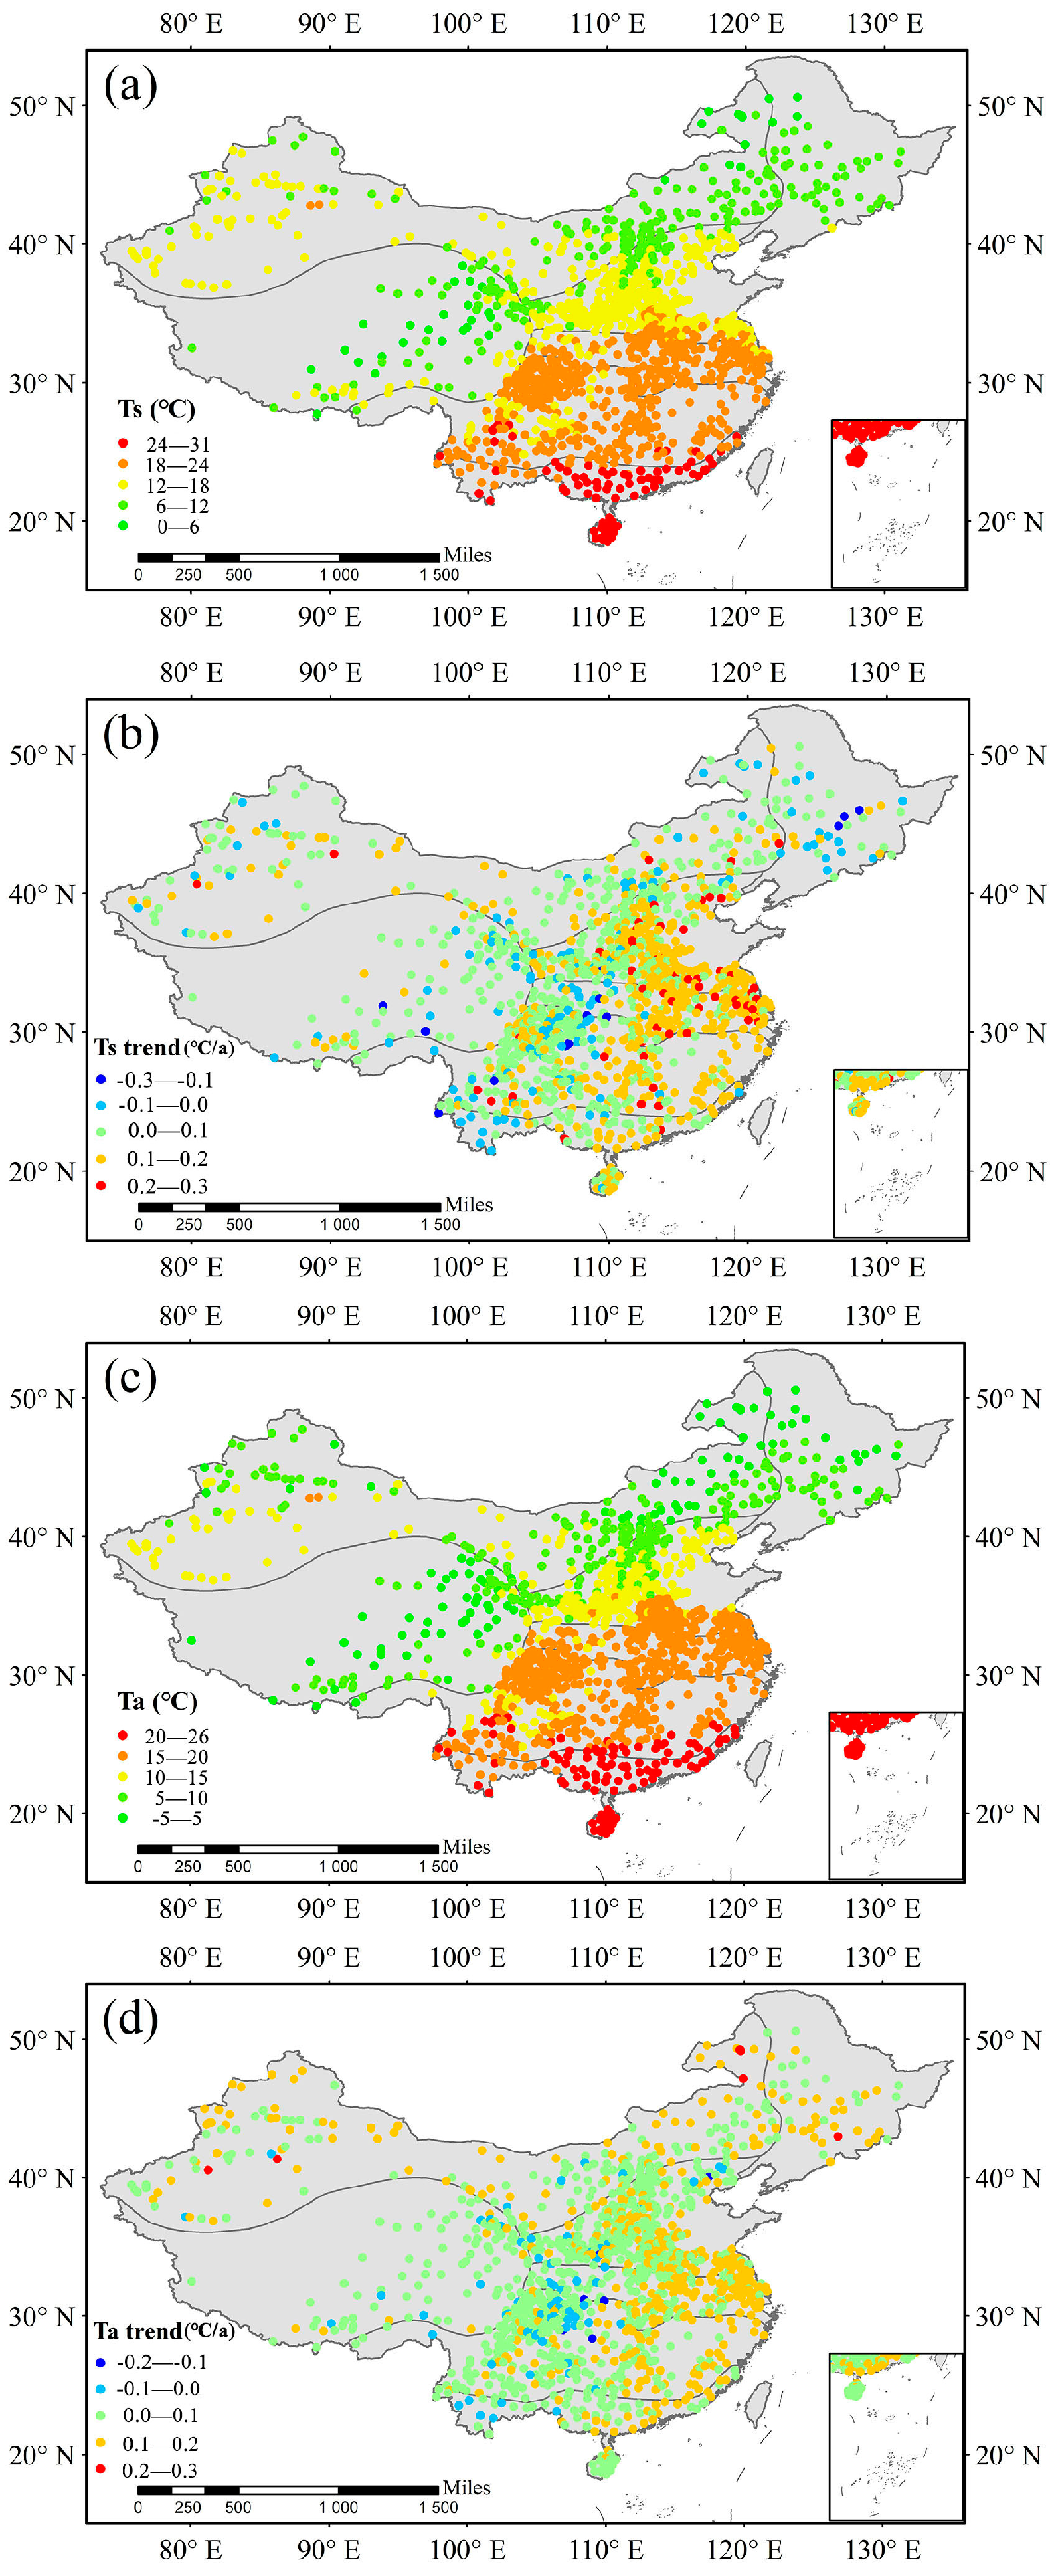
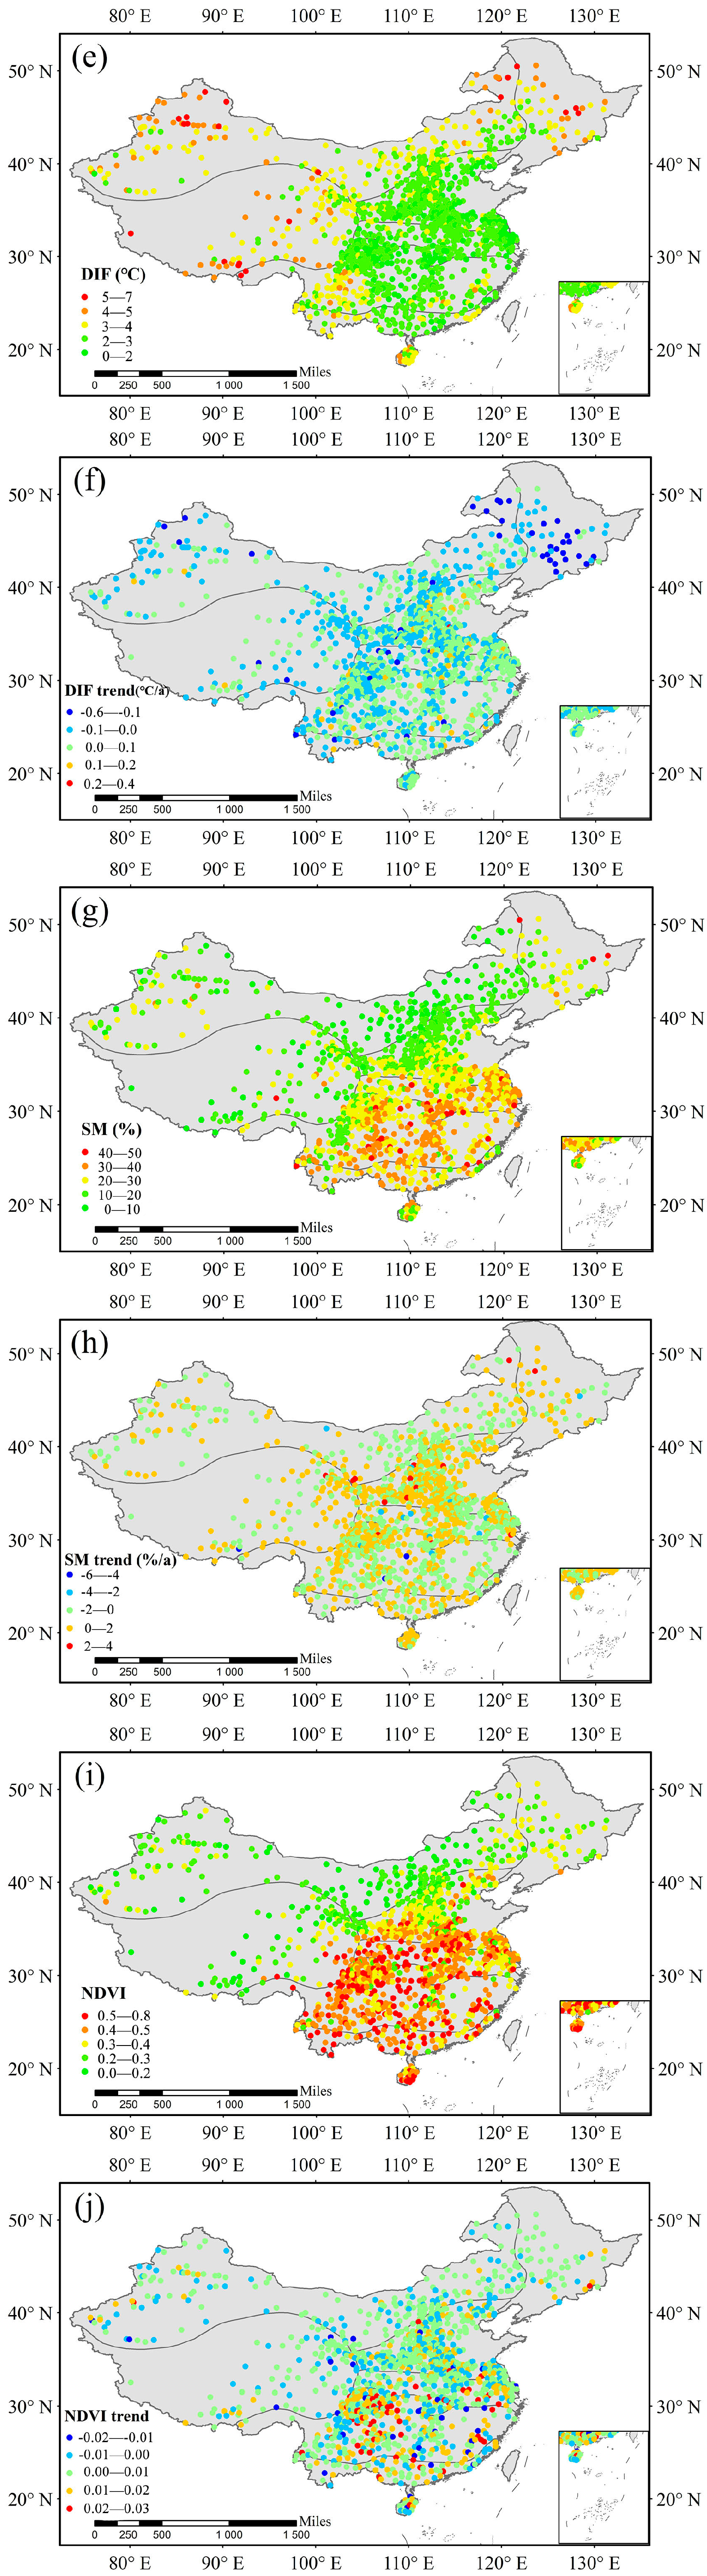
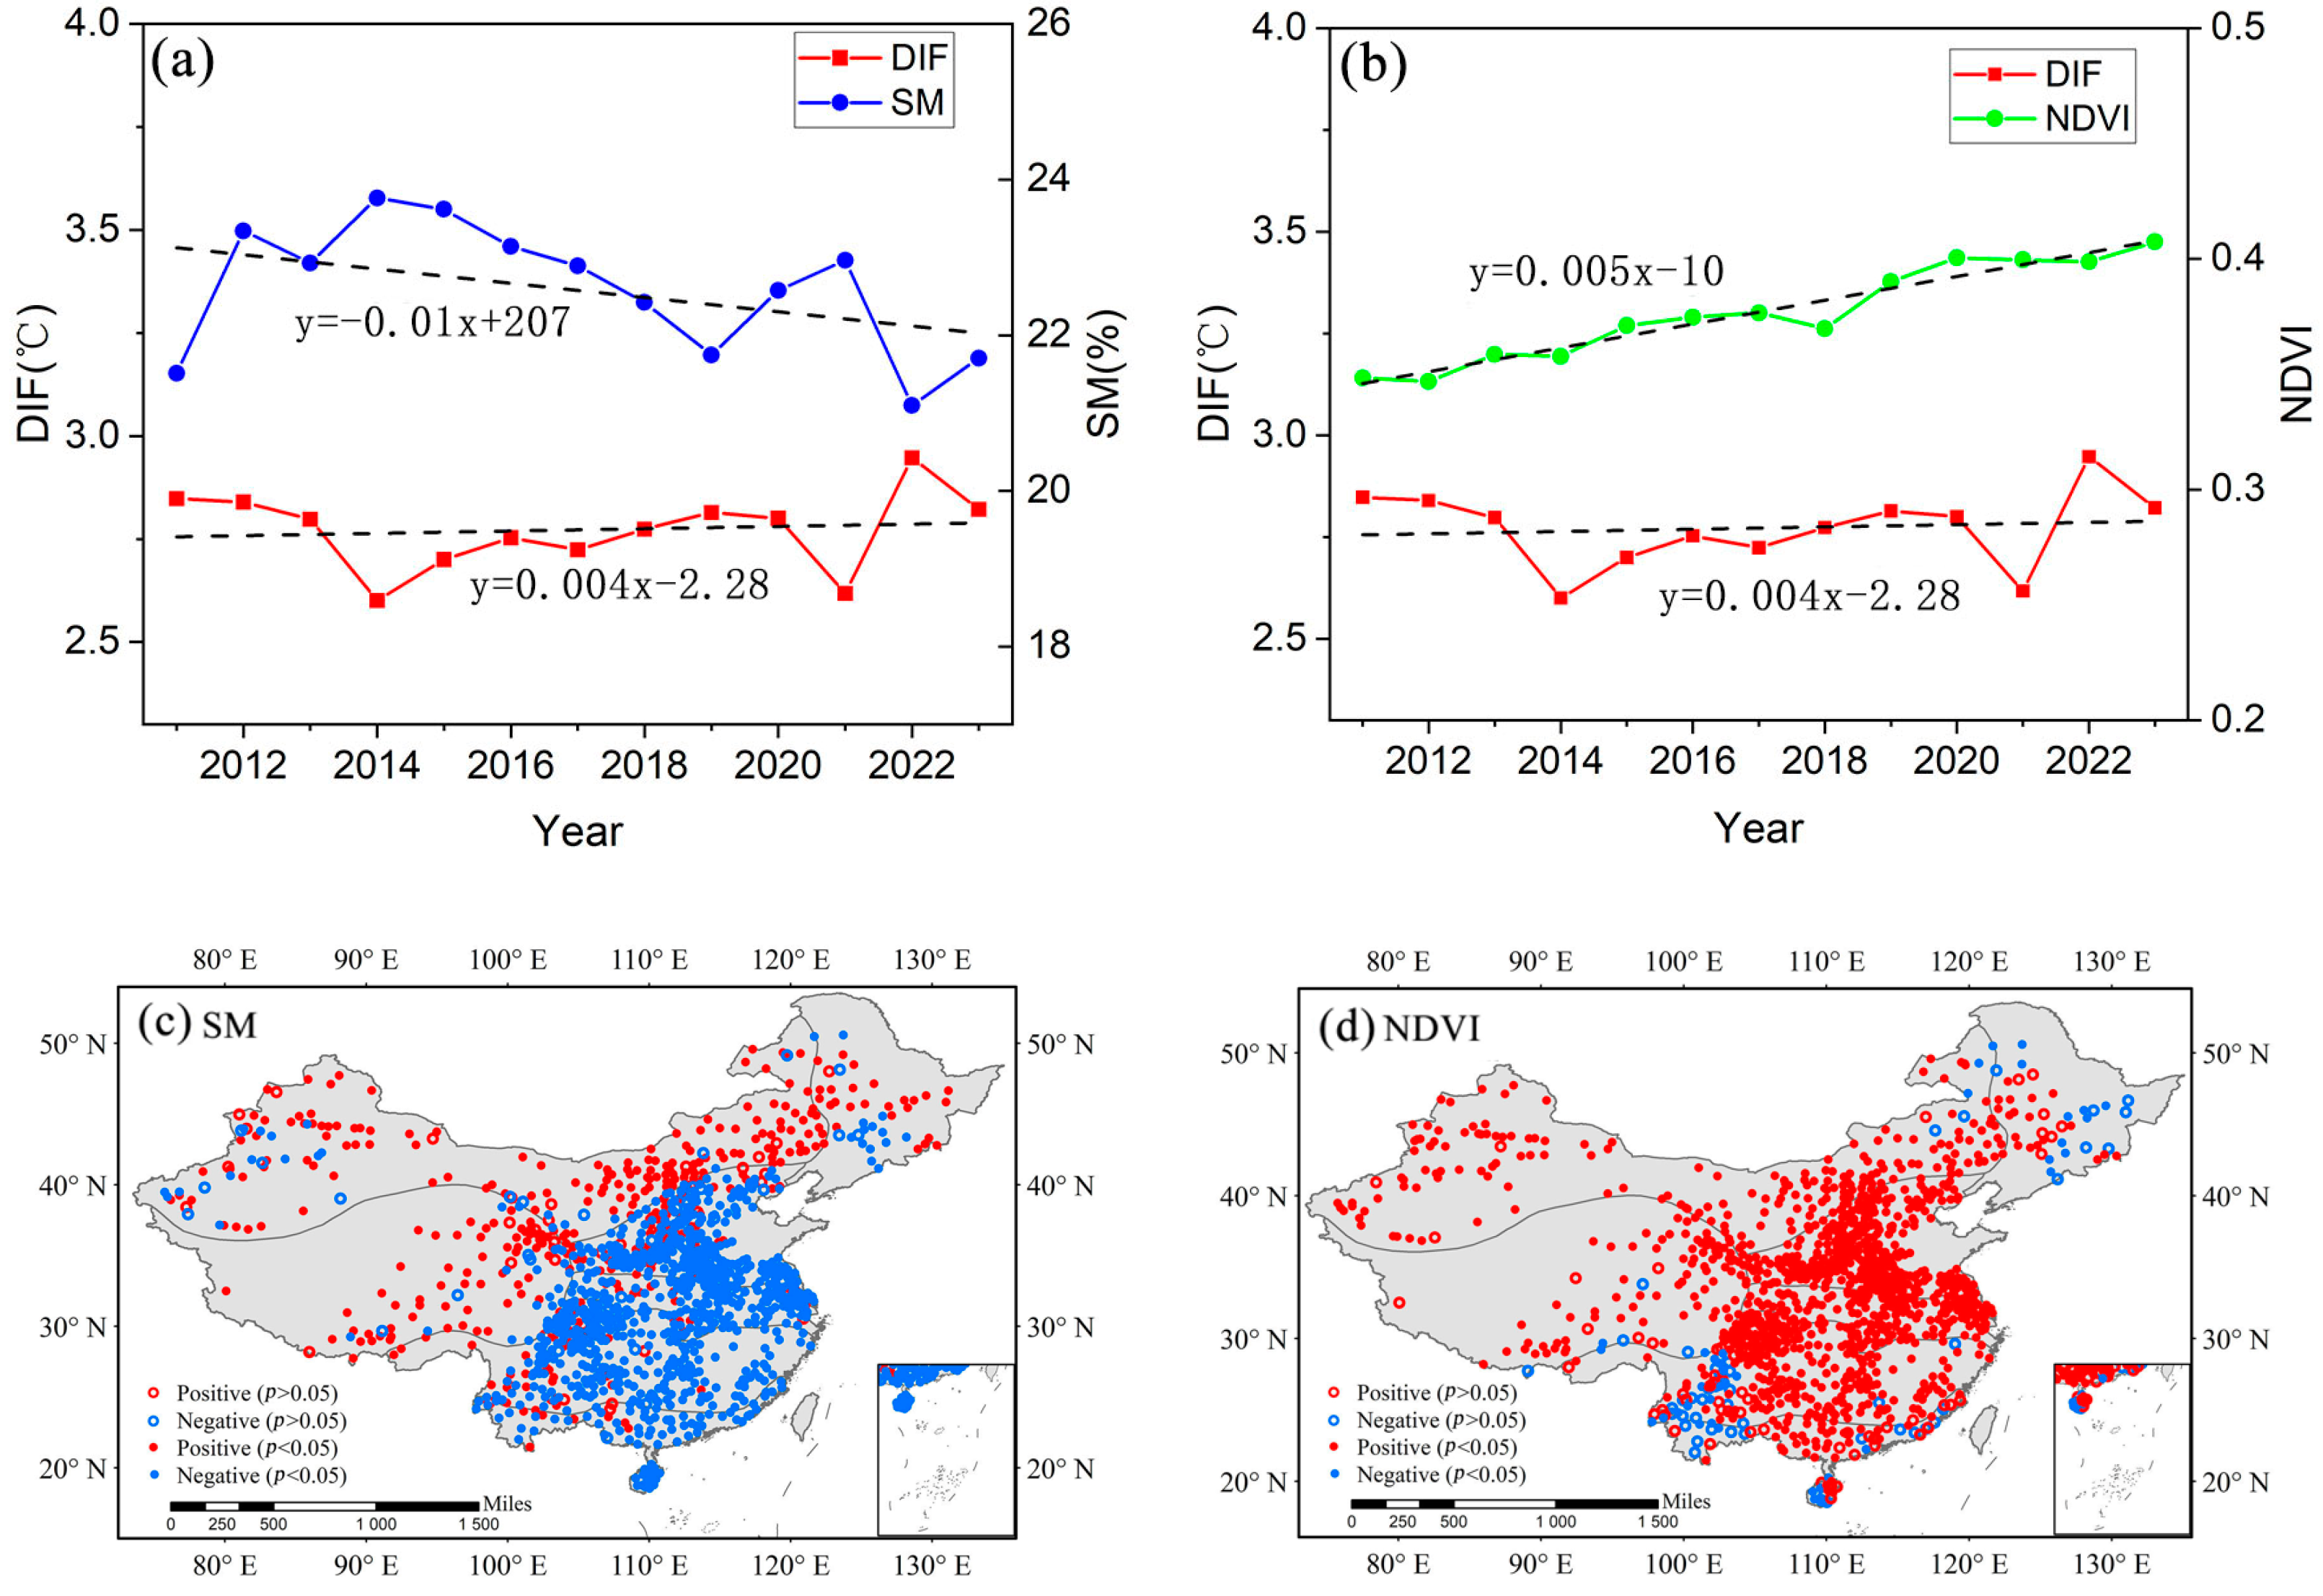
3.1. Spatial and Temporal Change Characteristics of Land Surface Temperature (Ts), Air Temperature (Ta), Surface-Air Temperature Difference (DIF), Soil Moisture (SM) and NDVI

From 2011 to 2023, the average Ts in China showed a gradual decrease from low to high latitudes (Figure 3a), except in the Qinghai-Tibet Plateau region, where the overall temperature is relatively low due to high altitude. The multi-year average Ts is 16.41 °C. During the same period, Ta exhibited a similar spatial distribution pattern to the Ts (Figure 3c), with an average value of 13.64 °C, slightly lower than that of Ts. In terms of the change trends, the national average trends of change for Ts and Ta are 0.09 °C/a and 0.08 °C/a, respectively. Of these, 89.2% of the Ts and 94.2% of the Ta showed a warming trend from 2011 to 2023. In space, the trends of Ts and Ta gradually decrease from the eastern to the western regions (Figure 3b,d). Statistically, 41.3% of the regions showed significant changes in Ts (p < 0.05) and 45.40% of the regions showed significant changes in Ta (p < 0.05).
The average DIF of China was consistently positive from 2011 to 2023, with a mean value of 2.78 °C (Figure 3e). This suggests that Ts are typically higher than Ta. Spatial differences in DIF are significant, with low values concentrated in low latitudes and low-altitude areas, and high values concentrated in high latitudes and high-altitude areas. During the period, 54.44% of the DIF showed an upward trend, while 45.56% showed a downward trend, and the average trend is 0.004 °C/a. Among them, 21.2% of the regions experienced significant changes (p < 0.05), and the significant change trend is 0.02 °C/a.
Figure 3g shows the multi-year average SM from 2011 to 2023, which exhibits a spatial distribution pattern opposite to DIF, gradually decreasing from the southeast coast to the northwest inland. The multi-year average value of SM is 16.41%. Within the study area, 50.56% of the SM shows an increasing trend, while 49.44% shows a decreasing trend, the average trend of SM from 2011 to 2023 is −0.01%/a. The proportion of significantly changing SM is 29.10% (p < 0.05) and the significant change trend is −0.02%/a.
The spatial distribution pattern of the average NDVI over the years is consistent with the spatial distribution of the average SM, meaning that areas with a high SM also have high vegetation coverage. The average value of NDVI from 2011 to 2023 is 0.38. The inter-annual variation trend of NDVI shows that accounting for 75% of the total areas experienced an increasing trend, while 25% of the areas show a decreasing trend, the average trend is 0.005/a, which indicates that China is in a greening state. About 56.19% of the vegetation changed significantly, with a significant change trend of 0.01/a.

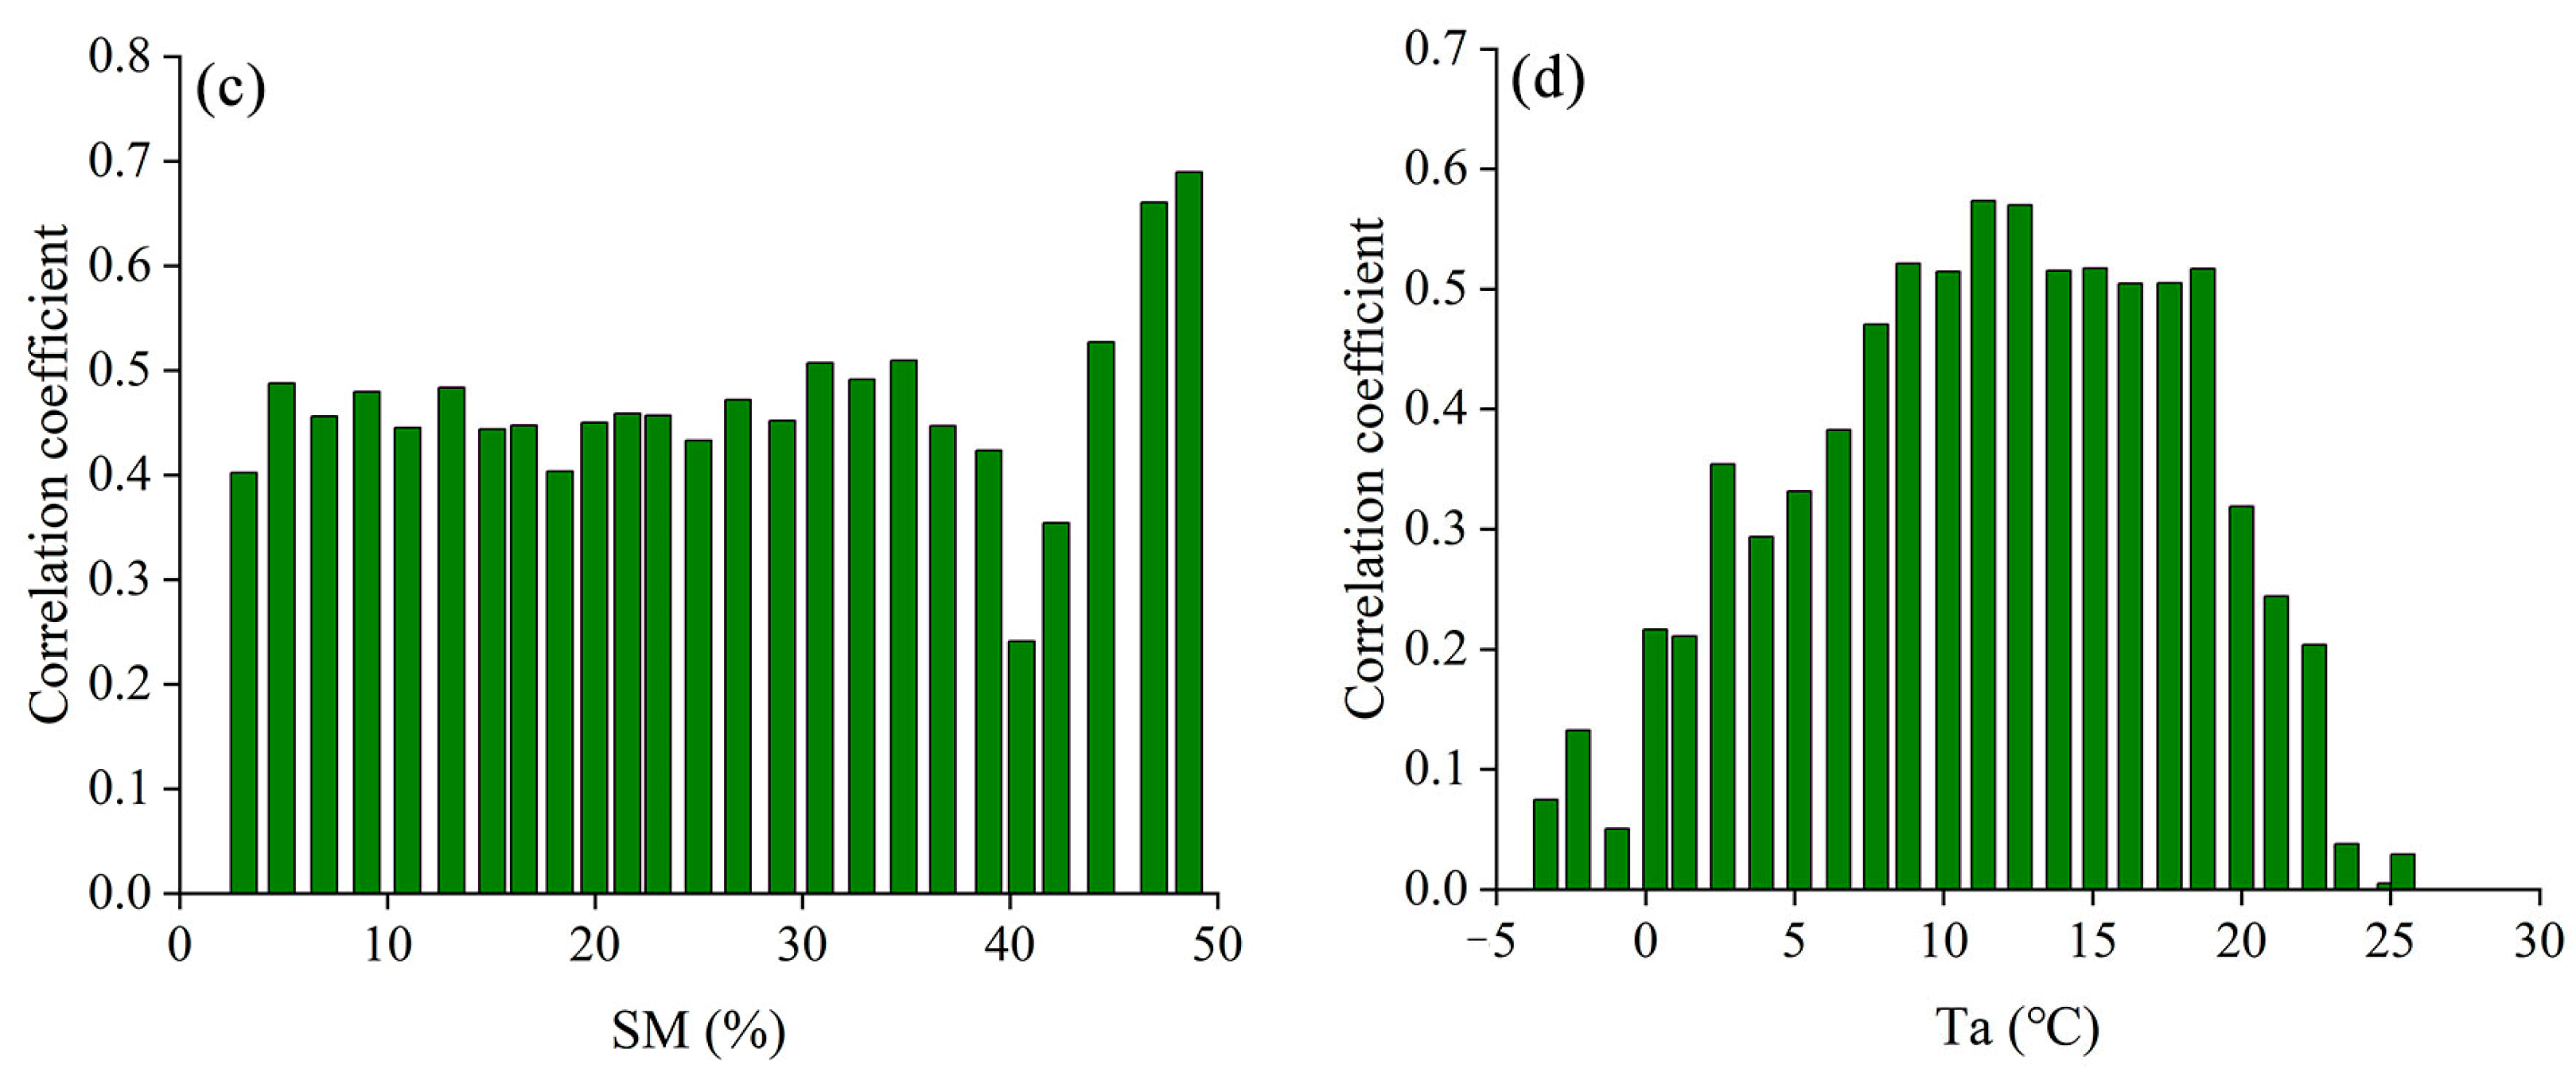
3.2. Correlation Analysis between Soil Moisture (SM), NDVI and Surface-Air Temperature Difference (DIF)

DIF exhibited a significant increasing trend (0.004 °C/a) while SM showed a significant decreasing trend (−0.01%/a) (Figure 4a). The national mean DIF fluctuated between 2.59 °C and 2.99 °C, and the SM varied from 19.01% to 23.76%. There is a significant negative correlation between DIF and SM on the national spatial scale (R = −0.75, p < 0.01). The NDVI also showed an increasing trend (0.005/a) (Figure 4b), which is slightly higher than DIF, and the national mean value change was between 0.35 and 0.41. A significant positive correlation was found between DIF and NDVI (R = 0.13, p < 0.05).
In terms of spatial distribution, the correlation between SM and DIF is divided by the “Hu Huanyong” line, which is highly related to DEM and precipitation (Figure 4c). To the north of this line, they mainly exhibit a positive correlation, accounting for 31.19%. To the south of this line, they mainly exhibit a negative correlation, accounting for 68.81%. Nationally, DIF and NDVI mainly show a positive correlation (Figure 4d), accounting for 93.09%, with only a few sites in the northeast and southwest showing a negative correlation, accounting for 6.91%. In spatial terms, there is a significant correlation between SM and DIF, as well as NDVI and DIF, with significant proportions of 93.1% and 91.3%, respectively.

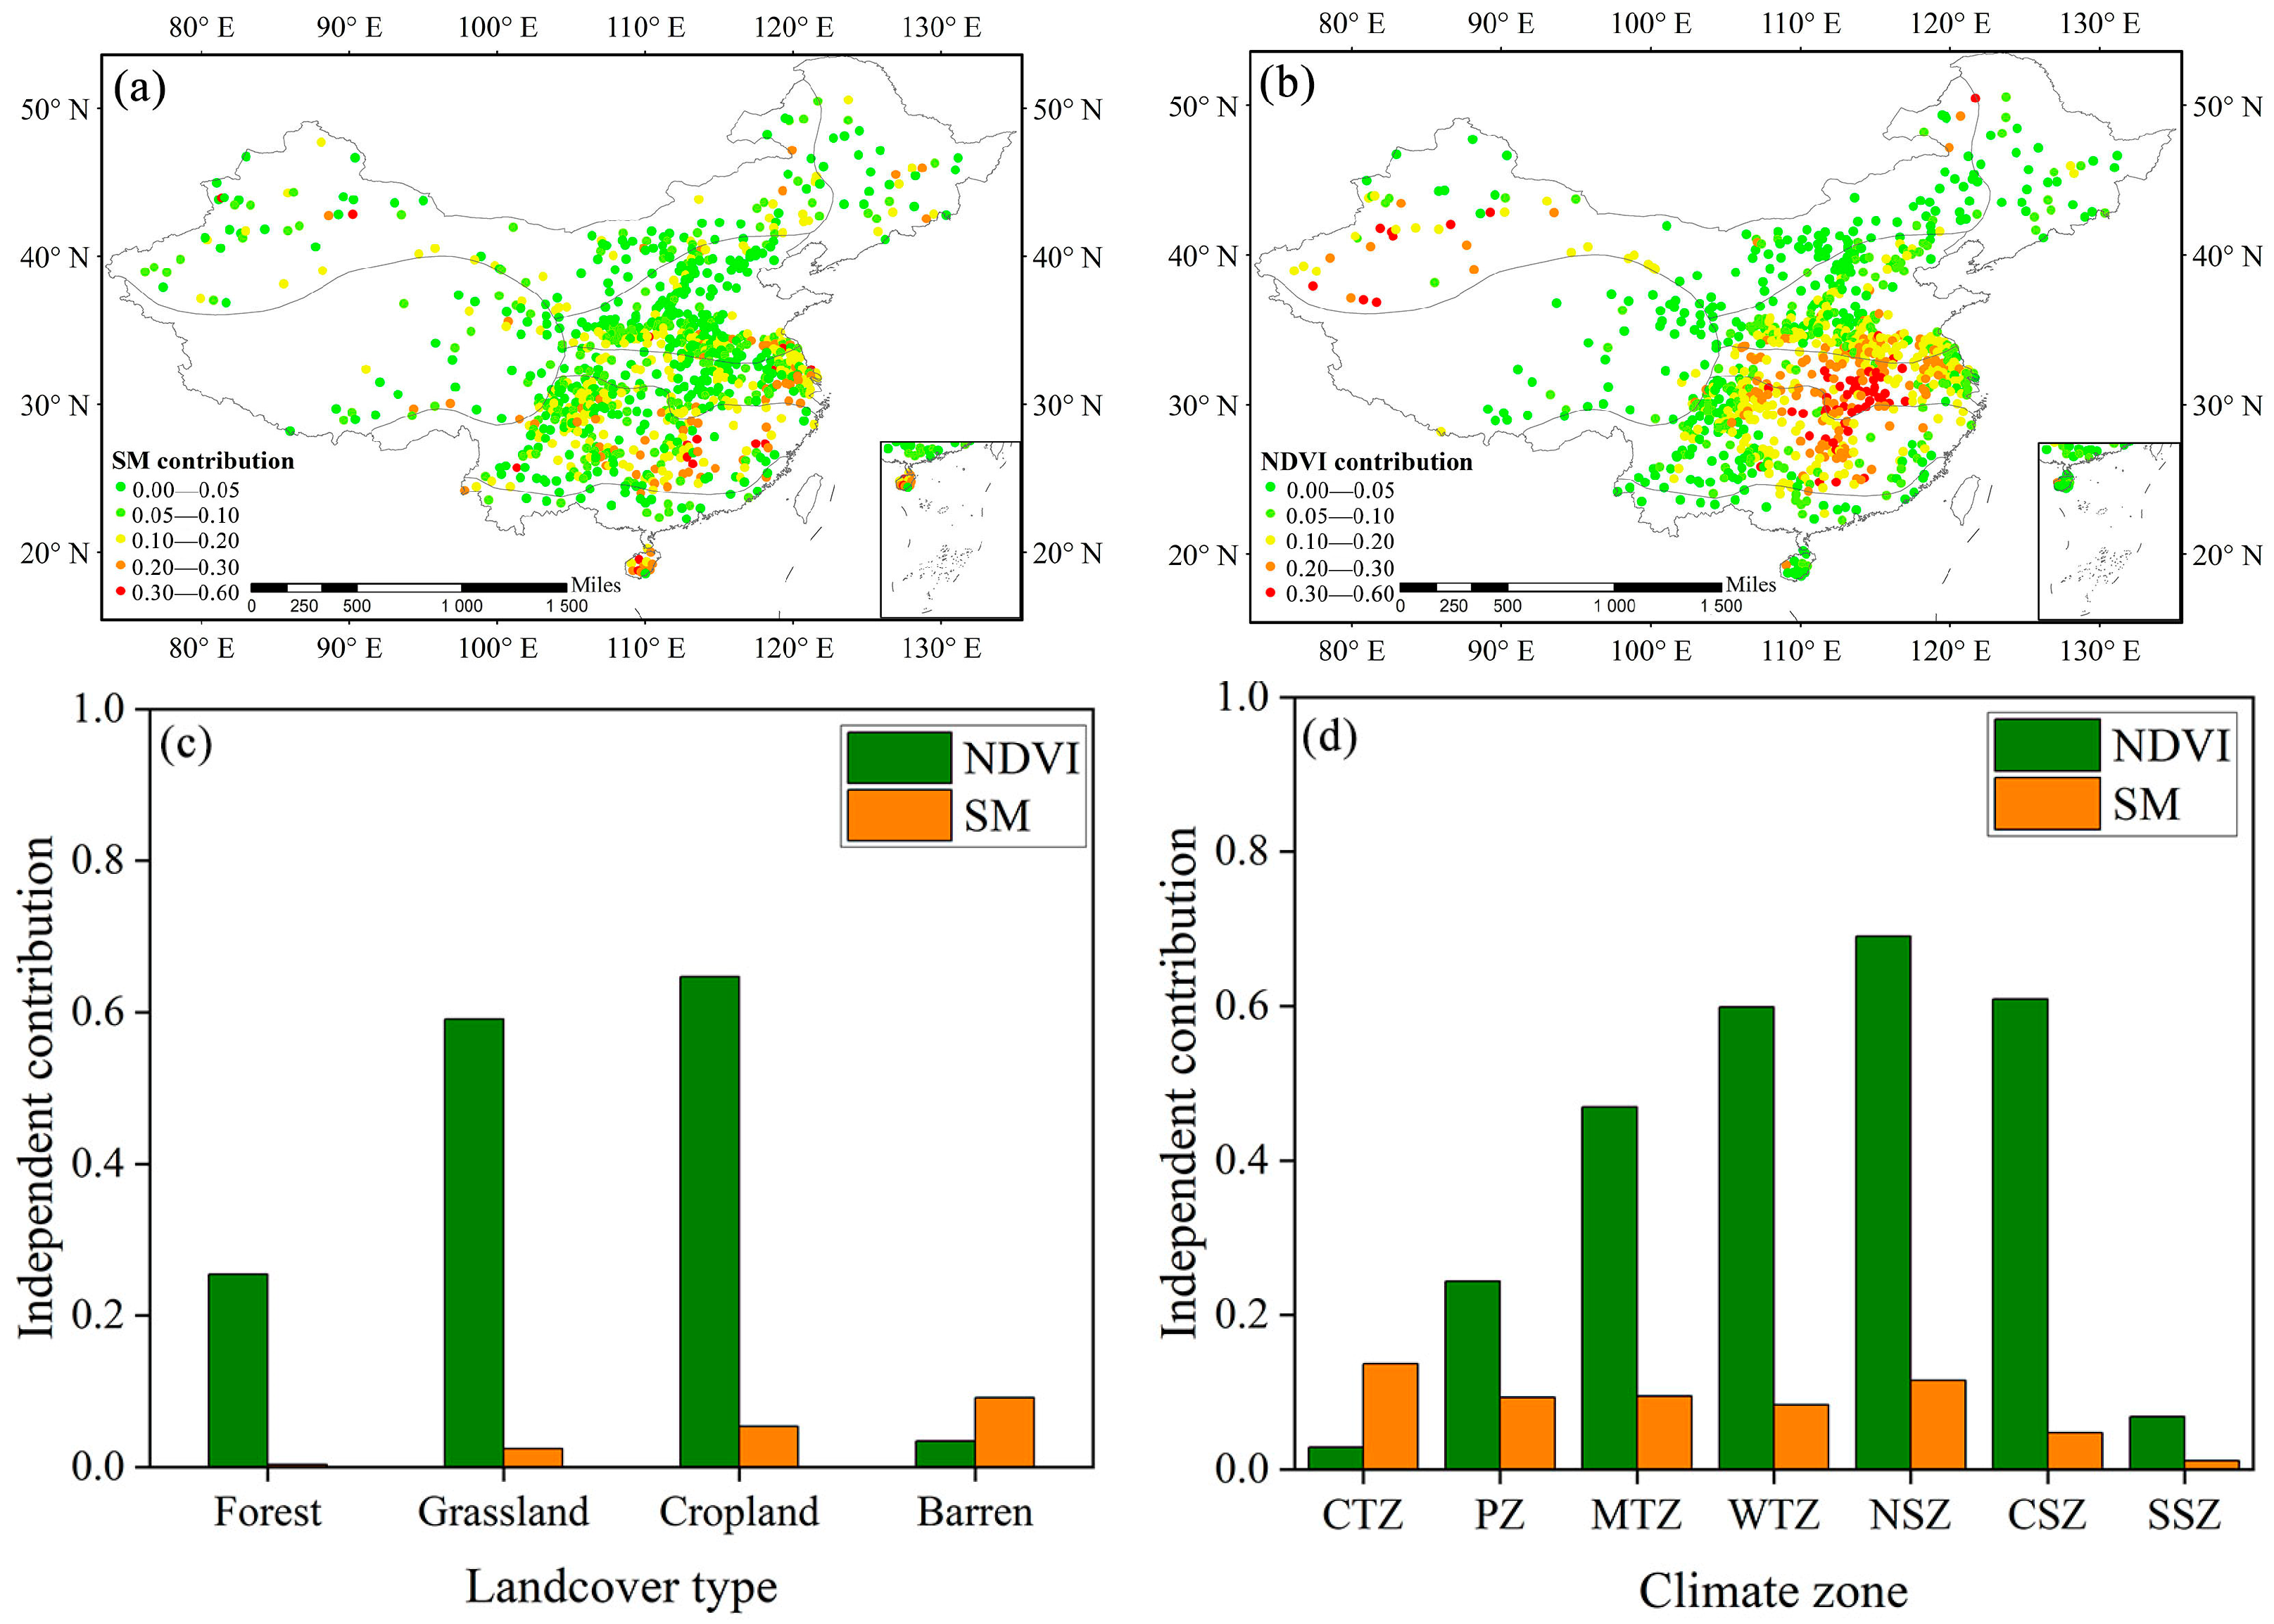
3.3. Detecting the Effects of Soil Moisture (SM) and NDVI on Surface-Air Temperature Difference (DIF) under Different Land Cover Types and Climate Zones

To further explore the driving effects of SM and NDVI on DIF, we employed the CCM causality analysis method to determine the causal relationships between SM, NDVI and DIF under different land surface cover types. This study selected forest, grassland, cropland and barren land surface types with distinct vegetation cover gradients for analysis. Figure 5 shows the causal relationship detection results of SM, NDVI and DIF in the four land surface cover types. It is evident that both SM and NDVI have driving effects on DIF, with NDVI exhibiting a significantly greater driving effect on DIF compared to SM.
Climate types determine the temperature, humidity and vegetation of a region. The impact of different climate zones on the driving effect of NDVI and SM on DIF is shown in Figure 6. There is a causal relationship between SM, NDVI and DIF. The causal relationship between SM and DIF is weaker in the NSZ, CSZ and SSZ (cross-map skill less than 0.5), while it is stronger in the CTZ, MTZ, PZ and WTZ (cross-map skill greater than 0.5). This indicates that the strength of the causal relationship between SM and DIF increases with latitude and altitude. The overall causal relationship strength between NDVI and DIF is greater than that between SM and DIF, and in high-altitude climate zones, the causal relationship strength is greater than in low-altitude climate zones.

3.4. Contributions of Soil Moisture (SM) and NDVI on Surface-Air Temperature Difference (DIF)

The previous section has confirmed the driving effect of SM and NDVI on DIF, so we further analyzed the contribution of SM and NDVI to DIF. Figure 7a,b show the spatial distribution of the contribution of SM and NDVI to the variation in DIF, respectively.
As shown in Figure 7a, the contribution of SM to DIF varied from 0 to 0.6, with an average contribution of 0.08. Spatially, there was no obvious distribution pattern, and it was only in the southeastern part that the contribution of some stations was slightly higher than that of other regions, which may be due to the higher soil moisture content in this region. The contribution of NDVI to DIF also varies between 0 and 0.6, with an average value of 0.11. Spatially, NDVI stations with a contribution of more than 0.2 are concentrated in the south-central areas, where the NDVI values are relatively large. However, in terms of the distribution of NDVI, the high value areas did not all reflect the high contributions to DIF. That is, the contribution of NDVI to DIF is nonlinear with the NDVI value. Overall, NDVI contributes more to DIF than SM contributes to DIF. The way of contribution combined with the results of correlation analysis shows that the positive contribution of SM to DIF is mainly distributed in the area north of the “Hu Huanyong” line, and the negative contribution is in the area south of the line. The NDVI contributes positively to DIF in most areas.
To further explore the reasons for the differences in the spatial distribution of the contributions of SM and NDVI to DIF, we counted the contributions across different surface types and different climatic zones. The contribution of SM and NDVI to DIF in each land cover type is depicted in Figure 7c. Overall, the contribution of NDVI to the DIF decreases as the vegetation coverage increases. For instance, the contribution to cropland is greater than that of forest areas. This could be due to the smaller fluctuations in NDVI in forest areas, especially in evergreen forests where vegetation coverage is larger, resulting in less variation in the land-air temperature difference. On the other hand, in cropland areas, NDVI changes with the growth of crops, exerting a greater impact on the DIF. For SM, the contribution to DIF gradually increases with the decrease in vegetation coverage, with the highest contribution in bare land type. Due to the fact that in areas with high vegetation cover, vegetation absorbs SM and affects DIF through transpiration, which makes the direct effect of SM on DIF not obvious; whereas in bare ground, which receives solar radiation directly, SM influences the soil heat capacity and thus has a larger contribution to the change in DIF.
In terms of the contribution of SM and NDVI to DIF in each climate zone (Figure 7d), the effect of NDVI on DIF is also larger than that of SM, expect in CTZ where the contribution of SM is greater than NDVI. The CTZ is located in the northernmost part of the study area, where seasonal permafrost and alpine snow are widely distributed, so soil freezing and thawing and snowmelt affect soil moisture content, resulting in a more significant effect on DIF. The contribution of NDVI to DIF seems to gradually increase from the northern climate zone to the southern climate zone, but anomalies occur in the SSZ. As vegetation coverage increases from north to south, its regulatory effect on surface and air temperatures continues to grow, thereby increasing its contribution to DIF. However, in the SSZ climate zone, where vegetation and temperatures are relatively stable, and due to its coastal location with high water vapor content, the exchange of heat between land and air is slowed down, resulting in relatively lower contributions of both NDVI and SM to DIF in this region.

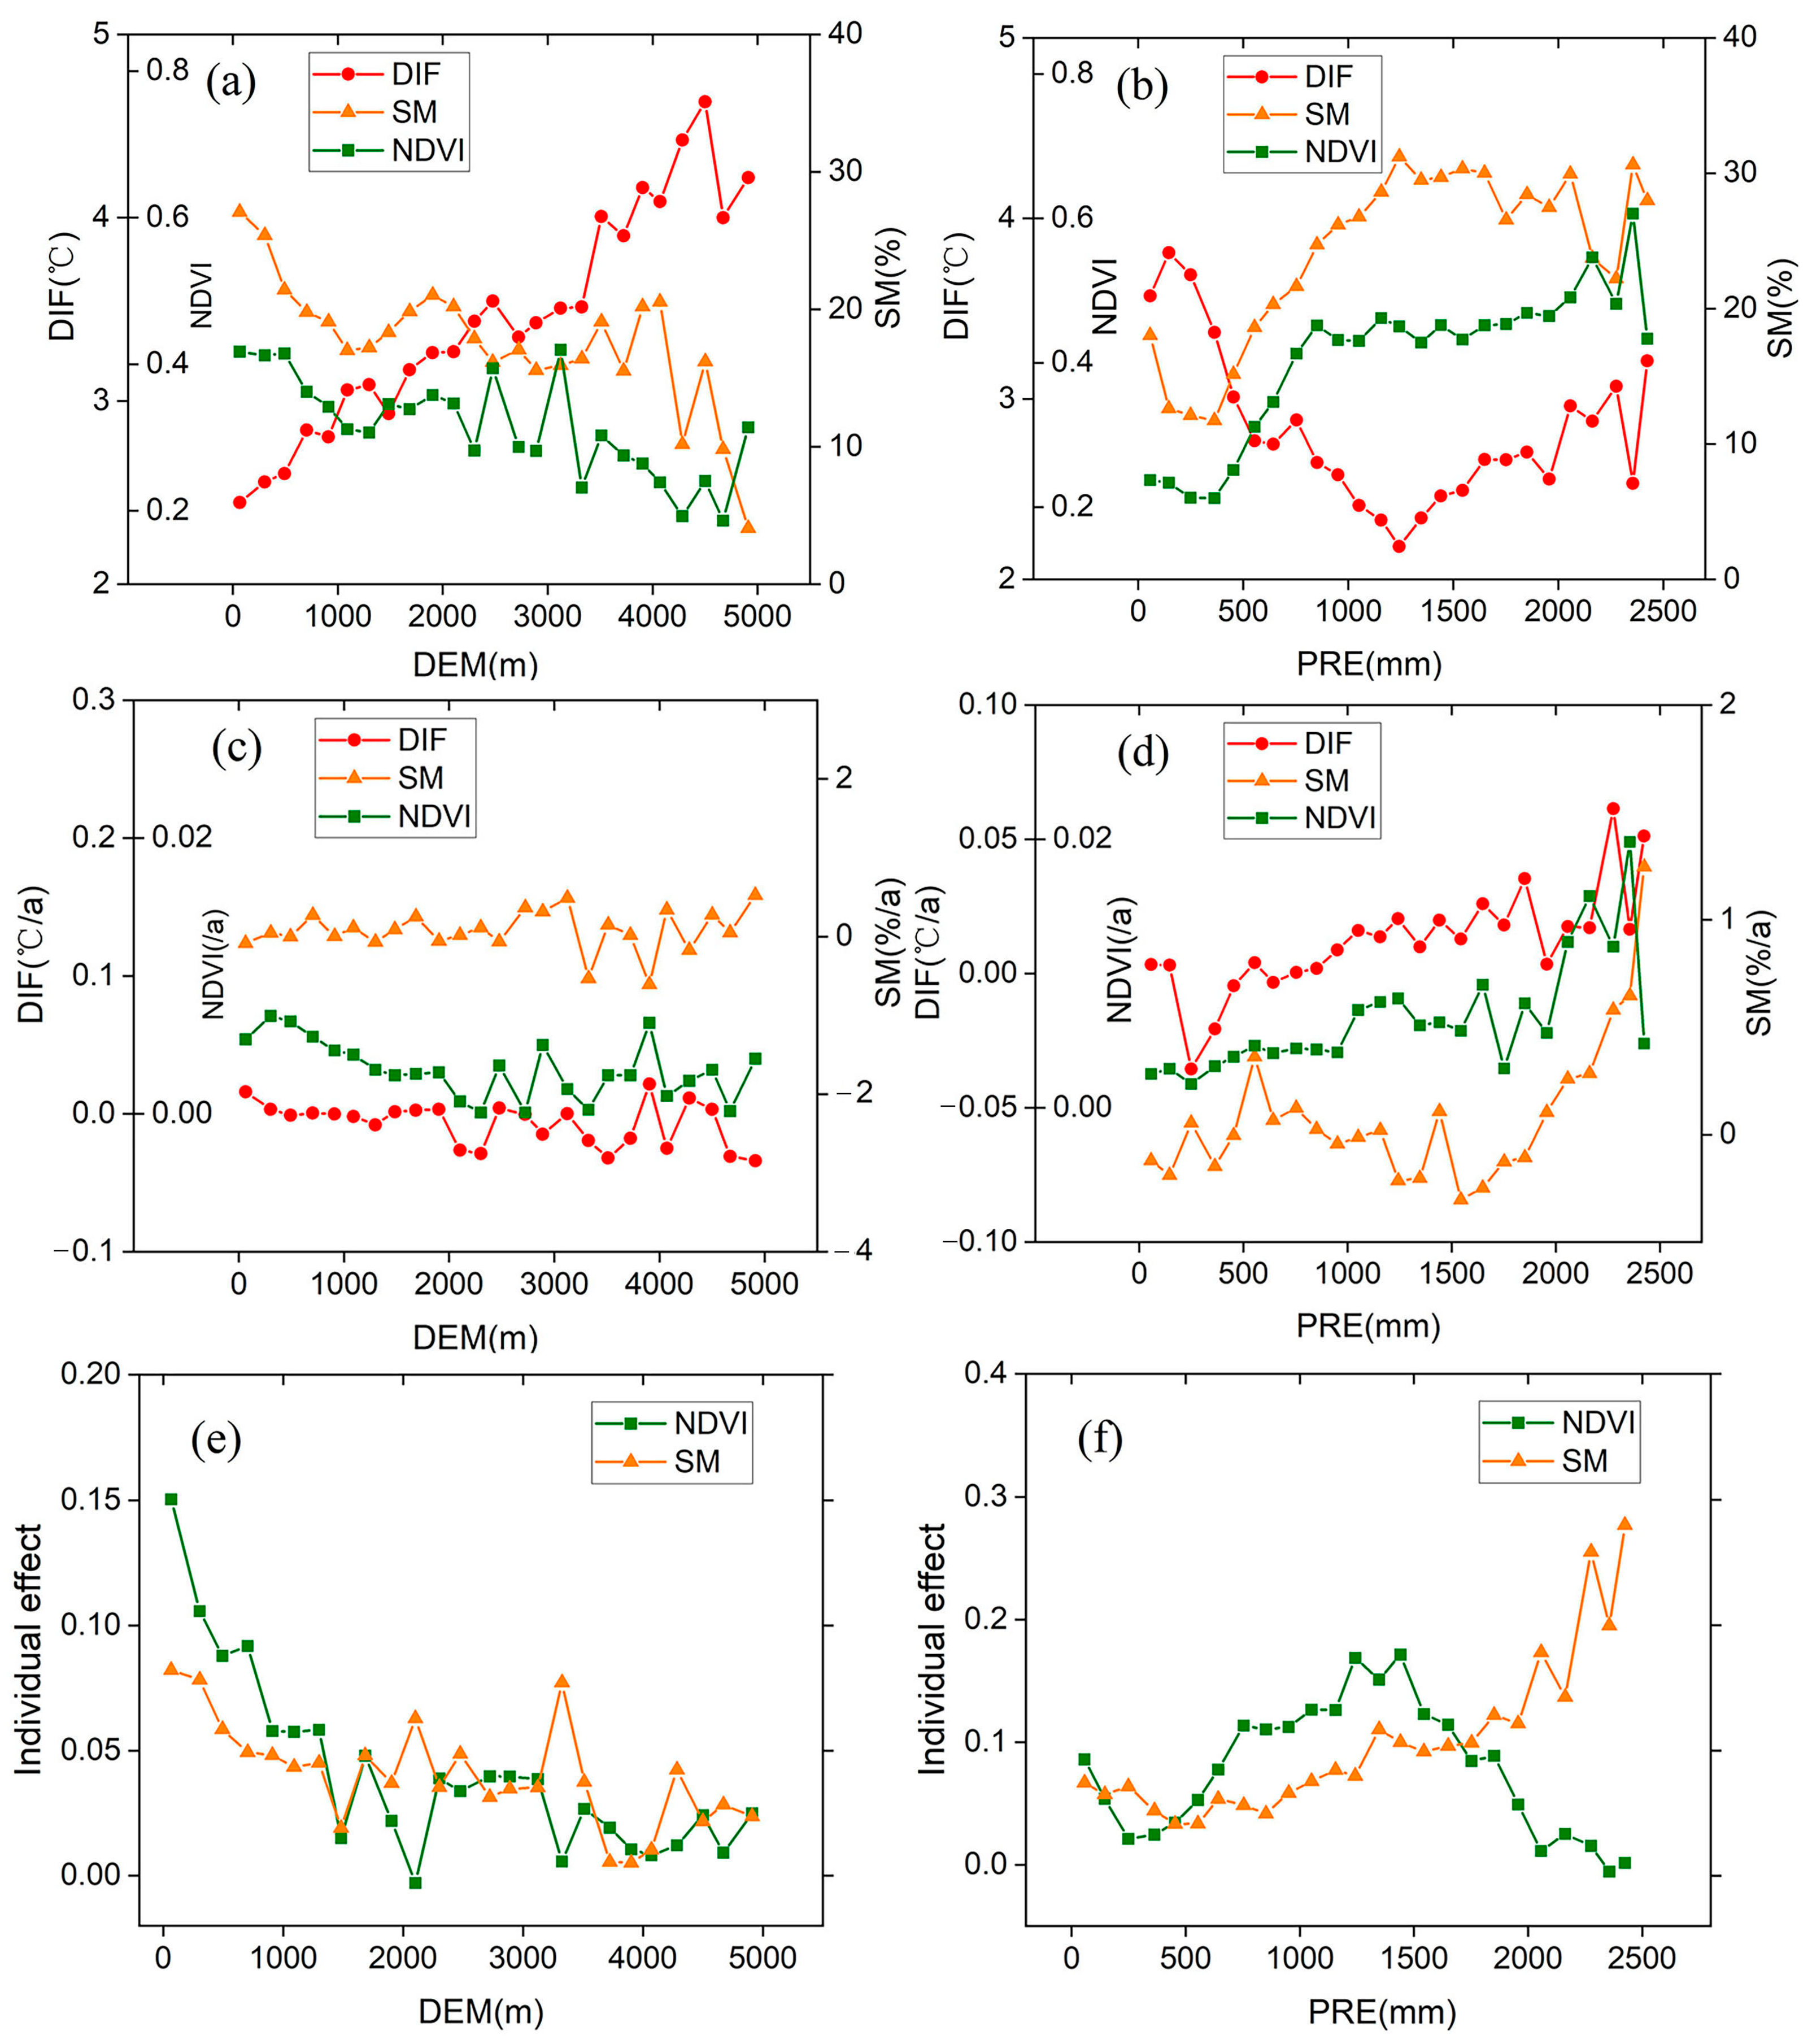
3.5. Changes Characteristics of the Difference between Surface–Air Temperature Difference (DIF), Soil Moisture (SM) and NDVI under Different Elevation (DEM) and Precipitation (PRE) Gradients

DEM is also an important environmental factor affecting Ts and Ta. Therefore, we further analyzed the variations of SM, NDVI and DIF at different DEM gradients. As shown in Figure 8a, DIF increases with higher elevations, while SM and NDVI decrease with higher elevations. It can be concluded that DEM drives a spatially negative correlation between SM and DIF, as well as NDVI and DIF.
The spatial distributions of SM and NDVI are influenced by annual total PRE, which in turn affects Ts and Ta. Figure 8b illustrates the variations of SM, NDVI and DIF under different PRE gradients. Overall, with the increase in PRE, DIF shows a trend of decreasing, while SM and NDVI demonstrate an increasing trend. In detail, at a precipitation amount of about 1250, DIF changes from a decreasing trend to an increasing trend, while SM changes from an increasing trend to a slight decreasing trend. For NDVI, NDVI increases with increasing PRE when PRE is less than 800 mm and it tends to be stable when PRE exceeds 800 mm.
Figure 8c illustrates the Theil–Sen’s slopes of DIF, SM and NDVI with DEM gradients. The slopes of SM, NDVI and DIF changes are relatively stable when DEM is less than 2000 m, and fluctuate more when DEM exceeds 2000 m. Among them, the slope of DIF appears negative when it is larger than 2000 m, indicating that, at high altitudes, DIF has a tendency to decrease year by year.
Under the PRE gradient, the slopes of DIF, SM and NDVI all increase with PRE (Figure 8d). In particular, the slope of SM fluctuates significantly with PRE, and turns from negative to positive when the PRE exceeds 2000 mm. It is quite evident that in regions with a higher PRE, SM is most affected.
DEM and precipitation affect the strength of the contribution of SM and NDVI to DIF. Figure 8e shows that the contribution of SM and NDVI to DIF decreases with increasing DEM, which indicates that the effects of SM and vegetation on DIF are attenuated at higher altitudes. Moreover, in regions where DEM is below 1500 m, the average contribution of NDVI is greater than that of SM, while in regions where the DEM is above 1500 m, the contributions of SM and NDVI to DIF is relatively complex.
Figure 8f shows that an increase in precipitation enhances the strength of SM’s effect on DIF, but the strength of NDVI’s effect on DIF is limited by the precipitation threshold, which will weaken the moderating effect of vegetation on DIF when the threshold range is exceeded.

4. Discussion

4.1. The Background Values of Soil Moisture (SM) and Air Temperature (Ta) Had a Significant Effect on Surface–Air Temperature Difference (DIF)

Different climatic backgrounds affect the influence patterns of SM change on DIF [19]. SM is a key influencing factor in heat capacity, controlling the rate of soil temperature variation, thereby affecting DIF. The intensity of vegetation evaporation is also affected by SM, which has a regulating effect on local Ts and Ta. Overall, the background values of SM can affect vegetation cover and soil evaporation directly and then affect DIF. Figure 9a characterizes the variation in the correlation coefficient between SM and DIF over different SM gradients. Differences in soil moisture content resulted in different patterns of SM influence on DIF. A positive correlation between SM and DIF was observed when SM was less than 13%, while a negative correlation between SM and DIF was observed when SM was greater than 13%. Figure 4a shows that the positive correlation between SM and DIF is mostly distributed in the MTZ and PZ regions, where SM is restricted with low vegetation coverage; the increase in SM accelerates the soil evaporation rate, which makes Ts warm up rapidly and thus enhances DIF. In contrast, in areas with high SM values, enhanced evapotranspiration has a cooling effect on Ts, thereby weakening DIF.
The background temperature usually affects the soil and vegetation evapotranspiration, thereby influencing the land–air temperature difference. Figure 9b shows that SM and DIF are positively correlated in areas with lower temperatures, while they are negatively correlated in areas with higher temperatures. High-temperature regions are mostly located in low latitudes, where SM is abundant. The high temperatures enhance soil and vegetation evapotranspiration, which increases the water vapour content of the air, thereby increasing the Ta and ultimately decreasing DIF. In cold regions, soil transpiration is weaker, with less latent heat and more sensible heat, leading to greater DIF.
Jiang et al. (2022) also found the similar results that DIF was positively correlated with SM in low SM or low-temperature areas [19]. However, there are differences in the spatial distribution of the correlation shown by DIF and SM, which may be due to variations in data sources and the length of data time series. Jiang et al. (2022) [19] used ERA5-Land data from 1981 to 2019, while this study used data from meteorological stations from 2011 to 2023.
The relationship between vegetation and temperature has long been debated by the scientific community [8,9,35,48]. We detected a positive correlation between NDVI and DIF, which is consistent with the findings of previous studies [9,33]. Vegetation regulates the thermal state near the surface in two ways. Firstly, vegetated surfaces with low albedo absorb more shortwave radiation, leading to warming. Secondly, increasing vegetation coverage enhances transpiration, which in turn reduces surface warming. Therefore, vegetation’s temperature regulation depends on the net effects of warming and cooling.
The research findings also indicate that the correlation between NDVI and DIF is influenced by the background temperature. NDVI shows a lower correlation with DIF when Ta is too high or too low, while the correlation is higher between 8 and 19 °C (Figure 9d). It can also be observed from Figure 7b that sites with high contribution are mostly distributed in the eastern mid-latitude zones. This could be due to the fact that extreme temperatures can affect vegetation transpiration, thereby limiting the vegetation’s regulating effect on temperature.
There is no clear distribution pattern of correlation between DIF and NDVI at different SM gradients. As shown in Figure 9c, the correlation between DIF and SM only increases when SM is greater than 45%. However, statistical analysis revealed that only four sites had annual average SM values above 45%, making this result unrepresentative.

4.2. Limitations

We analyzed the spatiotemporal changes of Ts, Ta and DIF since 2011 and explored the contributions of vegetation and SM to DIF. The research findings can provide references for studies on medium-term climate change, agricultural production, extreme weather and ecological environment. However, this study still has some limitations. Firstly, as this study aims to explore the spatiotemporal variation in DIF during the “fastest warming” period, the time series is relatively short, resulting in a weaker indication of medium to long-term climate change. Secondly, after spatial matching between meteorological observation stations and SM observation stations, the valid number of stations decreased, leading to uneven spatial distribution. Particularly in the Qinghai-Tibet Plateau region, the representativeness is inadequate. Perhaps high spatiotemporal resolution remote sensing data could provide a more detailed description. Lastly, in reality, the Ts observed by meteorological stations usually represent the bare ground temperature (concrete) of a 1 m2 area rather than the Ts of the actual land cover type, which may introduce certain biases to the results. Correcting the meteorological observed data with temperature data from different land cover types based on experimental measurements is one possible method to address this limitation.

5. Conclusions

In this study, we investigated the spatial and temporal of DIF in the China area and further evaluated the contributions of SM and NDVI to the variations of DIF. The conclusions are as follows.
(1)
Both land surface temperature (Ts) and air temperature (Ta) showed warming trends from 2011 to 2023, while Ts increased faster than Ta, which resulted DIF increased significantly by 0.02 °C/a. It was found that the annual mean surface–air temperature difference (DIF) exhibited a gradually increasing trend from coastal to inland areas, with the highest values of DIF observed in high altitude, and the multi-year mean DIF is 2.78 °C, indicating that Ts is greater than Ta at the national scale.
(2)
The variations of soil moisture (SM) and NDVI have a different effect on DIF. In areas where SM is not restricted, SM is negatively correlated with DIF, while in SM-restricted areas, they are positively correlated. NDVI shows a positive correlation with DIF in most regions. The correlation between SM and DIF is more significant than the correlation between NDVI and DIF. However, the contribution of NDVI to DIF (0.11) is higher than the contribution of SM to DIF (0.08).
(3)
The impact patterns of SM and NDVI on DIF are influenced by different climatic backgrounds. DIF is positively driven by SM in low SM or low-temperature regions. Vegetation can have the greatest effect on DIF at the optimal temperature.
Overall, during the period of rapid global warming, the land–atmosphere coupling has been further strengthened. Understanding the spatiotemporal changes of DIF and its influencing factors is crucial for better addressing climate change and also beneficial for taking appropriate measures to adapt to changes in the ecological environment.

Author Contributions

Writing—original draft preparation, Y.Y.; writing—review and editing, Y.Y., S.F. and W.Z.; visualization, Y.Y. and J.H.; formal analysis, Y.Y.; data curation, W.Z.; supervision, S.F. All authors have read and agreed to the published version of the manuscript.

Funding

This work was supported by the National Key Research and Development Program of China (Grant No. 2023YFE0122200).

Data Availability Statement

The data presented in this study are available upon request to the first author.

Acknowledgments

The authors would like to thank the reviewers and the handling editor, whose comments and suggestions improved this paper.

Conflicts of Interest

The authors declare no conflicts of interest.

References

  1. Hooker, J.; Duveiller, G.; Cescatti, A. A Global Dataset of Air Temperature Derived from Satellite Remote Sensing and Weather Stations. Sci. Data 2018, 5, 180246. [Google Scholar] [CrossRef] [PubMed]
  2. Li, Z.L.; Tang, B.H.; Wu, H.; Ren, H.; Yan, G.; Wan, Z.; Trigo, I.F.; José, A. Sobrino Satellite-Derived Land Surface Temperature: Current Status and Perspectives; Elsevier: Amsterdam, The Netherlands, 2013. [Google Scholar] [CrossRef]
  3. Li, Z.-L.; Wu, H.; Duan, S.-B.; Zhao, W.; Ren, H.; Liu, X.; Leng, P.; Tang, R.; Ye, X.; Zhu, J.; et al. Satellite Remote Sensing of Global Land Surface Temperature: Definition, Methods, Products, and Applications. Rev. Geophys. 2023, 61, e2022RG000777. [Google Scholar] [CrossRef]
  4. Yu, Y.; Fang, S.; Zhuo, W.; Han, J. A Fast and Easy Way to Produce a 1-Km All-Weather Land Surface Temperature Dataset for China Utilizing More Ground-Based Data. IEEE Trans. Geosci. Remote Sens. 2024, 62, 1–16. [Google Scholar] [CrossRef]
  5. Kloog, I.; Nordio, F.; Coull, B.A.; Schwartz, J. Predicting Spatiotemporal Mean Air Temperature Using MODIS Satellite Surface Temperature Measurements across the Northeastern USA. Remote Sens. Environ. 2014, 150, 132–139. [Google Scholar] [CrossRef]
  6. Vancutsem, C.; Ceccato, P.; Dinku, T.; Connor, S.J. Evaluation of MODIS Land Surface Temperature Data to Estimate Air Temperature in Different Ecosystems over Africa. Remote Sens. Environ. 2010, 114, 449–465. [Google Scholar] [CrossRef]
  7. Brown, P.T.; Caldeira, K. Greater Future Global Warming Inferred from Earth’s Recent Energy Budget. Nature 2017, 552, 45–50. [Google Scholar] [CrossRef]
  8. de Jong, R.; Verbesselt, J.; Schaepman, M.E.; de Bruin, S. Trend Changes in Global Greening and Browning: Contribution of Short-Term Trends to Longer-Term Change. Glob. Change Biol. 2012, 18, 642–655. [Google Scholar] [CrossRef]
  9. Feng, H.; Zou, B. A Greening World Enhances the Surface-Air Temperature Difference. Sci. Total Environ. 2019, 658, 385–394. [Google Scholar] [CrossRef] [PubMed]
  10. García-García, A.; Cuesta-Valero, F.J.; Beltrami, H.; Smerdon, J.E. Characterization of Air and Ground Temperature Relationships within the CMIP5 Historical and Future Climate Simulations. J. Geophys. Res. Atmos. 2019, 124, 3903–3929. [Google Scholar] [CrossRef]
  11. Zhou, L.-T.; Huang, R. An Assessment of the Quality of Surface Sensible Heat Flux Derived from Reanalysis Data through Comparison with Station Observations in Northwest China. Adv. Atmos. Sci. 2010, 27, 500–512. [Google Scholar] [CrossRef]
  12. Calvin, K.; Dasgupta, D.; Krinner, G.; Mukherji, A.; Thorne, P.W.; Trisos, C.; Romero, J.; Aldunce, P.; Barrett, K.; Blanco, G.; et al. IPCC, 2023: Climate Change 2023: Synthesis Report. Contribution of Working Groups I, II and III to the Sixth Assessment Report of the Intergovernmental Panel on Climate Change; Core Writing Team, Lee, H., Romero, J., Eds.; IPCC: Geneva, Switzerland, 2023. [Google Scholar]
  13. Teuling, A.J. A Hot Future for European Droughts. Nat. Clim. Change 2018, 8, 364–365. [Google Scholar] [CrossRef]
  14. Zhou, S.; Williams, A.P.; Berg, A.M.; Cook, B.I.; Zhang, Y.; Hagemann, S.; Lorenz, R.; Seneviratne, S.I.; Gentine, P. Land–Atmosphere Feedbacks Exacerbate Concurrent Soil Drought and Atmospheric Aridity. Proc. Natl. Acad. Sci. USA 2019, 116, 18848–18853. [Google Scholar] [CrossRef] [PubMed]
  15. Liao, Y.-M.; Chen, D.; Liu, Q.-F. The Spatiotemporal Characteristics and Long-Term Trends of Surface-Air Temperatures Difference in China. Adv. Clim. Change Res. 2019, 15, 374. [Google Scholar]
  16. Li, N.; Cuo, L.; Zhang, Y.; Ding, J. The Synthesis of Potential Factors Contributing to the Asynchronous Warming between Air and Shallow Ground since the 2000s on the Tibetan Plateau. Geoderma 2024, 441, 116753. [Google Scholar] [CrossRef]
  17. Bartlett, M.G.; Chapman, D.S.; Harris, R.N. A Decade of Ground–Air Temperature Tracking at Emigrant Pass Observatory, Utah. J. Clim. 2006, 19, 3722–3731. [Google Scholar] [CrossRef]
  18. Ying, L. Distribution of Differences between Ground and Air Temperature in Spring and Its Impact on Precipitation in Mid-Lower Reaches of Yangtze River. Meteorol. Sci. Technol. 2009, 37, 301–305. [Google Scholar]
  19. Jiang, K.; Pan, Z.; Pan, F.; Wang, J.; Han, G.; Song, Y.; Zhang, Z.; Huang, N.; Ma, S.; Chen, X. Influence Patterns of Soil Moisture Change on Surface-Air Temperature Difference under Different Climatic Background. Sci. Total Environ. 2022, 822, 153607. [Google Scholar] [CrossRef]
  20. Jiang, K.; Pan, Z.; Pan, F.; Wang, J.; Han, G.; Song, Y.; Zhang, Z.; Huang, N.; Ma, S.; Chen, X.; et al. The Global Spatiotemporal Heterogeneity of Land Surface-Air Temperature Difference and Its Influencing Factors. Sci. Total Environ. 2022, 838, 156214. [Google Scholar] [CrossRef] [PubMed]
  21. Stephen, H.; Ahmad, S.; Piechota, T.C. Land Surface Brightness Temperature Modeling Using Solar Insolation. IEEE Trans. Geosci. Remote Sens. 2010, 48, 491–498. [Google Scholar] [CrossRef]
  22. Deng, Y.; Wang, S.; Bai, X.; Luo, G.; Wu, L.; Cao, Y.; Li, H.; Li, C.; Yang, Y.; Hu, Z.; et al. Variation Trend of Global Soil Moisture and Its Cause Analysis. Ecol. Indic. 2020, 110, 105939. [Google Scholar] [CrossRef]
  23. Han, G.; Wang, J.; Pan, Y.; Huang, N.; Zhang, Z.; Peng, R.; Wang, Z.; Sun, G.; Liu, C.; Ma, S.; et al. Temporal and Spatial Variation of Soil Moisture and Its Possible Impact on Regional Air Temperature in China. Water 2020, 12, 1807. [Google Scholar] [CrossRef]
  24. Feng, H.; Zhang, M. Global Land Moisture Trends: Drier in Dry and Wetter in Wet over Land. Sci. Rep. 2015, 5, 18018. [Google Scholar] [CrossRef] [PubMed]
  25. Seneviratne, S.I.; Corti, T.; Davin, E.L.; Hirschi, M.; Jaeger, E.B.; Lehner, I.; Orlowsky, B.; Teuling, A.J. Investigating Soil Moisture–Climate Interactions in a Changing Climate: A Review. Earth-Sci. Rev. 2010, 99, 125–161. [Google Scholar] [CrossRef]
  26. Gevaert, A.I.; Miralles, D.G.; de Jeu, R.A.; Schellekens, J.; Dolman, A.J. Soil Moisture-Temperature Coupling in a Set of Land Surface Models. J. Geophys. Res. Atmos. 2018, 123, 1481–1498. [Google Scholar] [CrossRef] [PubMed]
  27. Way, R.G.; Lapalme, C.M. Does Tall Vegetation Warm or Cool the Ground Surface? Constraining the Ground Thermal Impacts of Upright Vegetation in Northern Environments. Environ. Res. Lett. 2021, 16, 054077. [Google Scholar] [CrossRef]
  28. Sekertekin, A.; Marangoz, A.M.; Abdikan, S. ALOS-2 and Sentinel-1 SAR Data Sensitivity Analysis to Surface Soil Moisture over Bare and Vegetated Agricultural Fields. Comput. Electron. Agric. 2020, 171, 105303. [Google Scholar] [CrossRef]
  29. Wang, L.; Fang, S.; Pei, Z.; Zhu, Y.; Khoi, D.N.; Han, W. Using FengYun-3C VSM Data and Multivariate Models to Estimate Land Surface Soil Moisture. Remote Sens. 2020, 12, 1038. [Google Scholar] [CrossRef]
  30. Wang, Y.; Zhao, H.; Fan, J.; Wang, C.; Ji, X.; Jin, D.; Chen, J. A Review of Earth’s Surface Soil Moisture Retrieval Models via Remote Sensing. Water 2023, 15, 3757. [Google Scholar] [CrossRef]
  31. Feng, H. Individual Contributions of Climate and Vegetation Change to Soil Moisture Trends across Multiple Spatial Scales. Sci. Rep. 2016, 6, 32782. [Google Scholar] [CrossRef]
  32. Lean, J.; Rind, D. Climate Forcing by Changing Solar Radiation. J. Clim. 1998, 11, 3069–3094. [Google Scholar] [CrossRef]
  33. Li, Y.; Li, Z.-L.; Wu, H.; Zhou, C.; Liu, X.; Leng, P.; Yang, P.; Wu, W.; Tang, R.; Shang, G.-F.; et al. Biophysical Impacts of Earth Greening Can Substantially Mitigate Regional Land Surface Temperature Warming. Nat. Commun. 2023, 14, 121. [Google Scholar] [CrossRef] [PubMed]
  34. Ellison, D.; Morris, C.E.; Locatelli, B.; Sheil, D.; Cohen, J.; Murdiyarso, D.; Gutierrez, V.; van Noordwijk, M.; Creed, I.F.; Pokorny, J.; et al. Trees, Forests and Water: Cool Insights for a Hot World. Glob. Environ. Change 2017, 43, 51–61. [Google Scholar] [CrossRef]
  35. Feng, H.; Zou, B.; Luo, J. Coverage-Dependent Amplifiers of Vegetation Change on Global Water Cycle Dynamics. J. Hydrol. 2017, 550, 220–229. [Google Scholar] [CrossRef]
  36. Houghton, R.A.; House, J.I.; Pongratz, J.; Van Der Werf, G.R.; DeFries, R.S.; Hansen, M.C.; Le Quéré, C.; Ramankutty, N. Carbon Emissions from Land Use and Land-Cover Change. Biogeosciences 2012, 9, 5125–5142. [Google Scholar] [CrossRef]
  37. Yu, Y.; Fang, S.; Zhuo, W. Revealing the Driving Mechanisms of Land Surface Temperature Spatial Heterogeneity and Its Sensitive Regions in China Based on GeoDetector. Remote Sens. 2023, 15, 2814. [Google Scholar] [CrossRef]
  38. Jiang, S.; Zhan, W.; Dong, P.; Wang, C.; Li, J.; Miao, S.; Jiang, L.; Du, H.; Wang, C. Surface Air Temperature Differences of Intra- and Inter-Local Climate Zones across Diverse Timescales and Climates. Build. Environ. 2022, 222, 109396. [Google Scholar] [CrossRef]
  39. Huang, B. Preliminary Draft of Comprehensive Natural Regionalization in China. Acta Geogr. Sin. 1958, 24, 348–365. [Google Scholar] [CrossRef]
  40. Sen, P.K. Estimates of the Regression Coefficient Based on Kendall’s Tau. J. Am. Stat. Assoc. 1968, 63, 1379–1389. [Google Scholar] [CrossRef]
  41. Mao, D.; Wang, Z.; Li, L.; Ma, W. Spatiotemporal Dynamics of Grassland Aboveground Net Primary Productivity and Its Association with Climatic Pattern and Changes in Northern China. Ecol. Indic. 2014, 41, 40–48. [Google Scholar] [CrossRef]
  42. Clark, A.T.; Ye, H.; Isbell, F.; Deyle, E.R.; Cowles, J.; Tilman, G.D.; Sugihara, G. Spatial Convergent Cross Mapping to Detect Causal Relationships from Short Time Series. Ecology 2015, 96, 1174–1181. [Google Scholar] [CrossRef]
  43. Deyle, E.R.; Maher, M.C.; Hernandez, R.D.; Basu, S.; Sugihara, G. Global Environmental Drivers of Influenza. Proc. Natl. Acad. Sci. USA 2016, 113, 13081–13086. [Google Scholar] [CrossRef]
  44. Sugihara, G.; May, R.; Ye, H.; Hsieh, C.; Deyle, E.; Fogarty, M.; Munch, S. Detecting Causality in Complex Ecosystems. Science 2012, 338, 496–500. [Google Scholar] [CrossRef] [PubMed]
  45. Wang, Y.; Yang, J.; Chen, Y.; De Maeyer, P.; Li, Z.; Duan, W. Detecting the Causal Effect of Soil Moisture on Precipitation Using Convergent Cross Mapping. Sci. Rep. 2018, 8, 12171. [Google Scholar] [CrossRef] [PubMed]
  46. Yu, Y.; Shang, G.; Duan, S.; Yu, W.; Labed, J.; Li, Z. Quantifying the Influences of Driving Factors on Land Surface Temperature during 2003–2018 in China Using Convergent cross Mapping Method. Remote Sens. 2022, 14, 3280. [Google Scholar] [CrossRef]
  47. Lai, J.; Zou, Y.; Zhang, J.; Peres-Neto, P. Rdacca.Hp: An R Package for Generalizing Hierarchical and Variation Partitioning in Multiple Regression and Canonical Analysis. bioRxiv 2021. [Google Scholar] [CrossRef]
  48. Chen, X.; Liu, L.; Su, Y.; Yuan, W.; Liu, X.; Liu, Z.; Zhou, G. Quantitative Association between the Water Yield Impacts of Forest Cover Changes and the Biophysical Effects of Forest Cover on Temperatures. J. Hydrol. 2021, 600, 126529. [Google Scholar] [CrossRef]
Figure 1. Spatial distribution of ground-based stations and climate zones. The climate zones are the cold temperature zone (CTZ), middle temperature zone (MTZ), plateau zone (PZ), warm temperature zone (WTZ), north subtropical zone (NSZ), central subtropical zone (CSZ) and south subtropical zone (SSZ). The background value is the land surface elevation.
Agriculture 14 01090 g001
Figure 2. Spatial distribution map of land cover types. Forest including evergreen needleleaf forest, evergreen broadleaf forest, deciduous needleleaf forest, deciduous broadleaf forest and mixed forests. Grassland including savannas and grasslands. Cropland including cropland and natural vegetation mosaic. Barren including barren and sparsely vegetated areas.
Agriculture 14 01090 g002
Figure 3. Spatial distribution of multi-year means and trends of Ts, Ta, DIF, SM and NDVI, 2011–2023. (a) Spatial distribution of multiyear Ts. (b) Spatial distribution of the Theil-Sen slope of annual mean Ts. (c) Spatial distribution of multiyear Ta. (d) Spatial distribution of the Theil-Sen slope of annual mean Ta. (e) Spatial distribution of multiyear DIF. (f) Spatial distribution of the Theil-Sen slope of annual mean DIF. (g) Spatial distribution of multiyear SM. (h) Spatial distribution of the Theil-Sen slope of annual mean SM. (i) Spatial distribution of multiyear NDVI. (j) Spatial distribution of the Theil-Sen slope of annual mean NDVI.
Agriculture 14 01090 g003aAgriculture 14 01090 g003b
Figure 4. Inter-annual change in (a) DIF and SM and (b) DIF and NDVI and spatial correlation of (c) DIF and SM and (d) DIF and NDVI, 2011–2023. The dashed lines in figures (a,b) are the trend lines of change.
Agriculture 14 01090 g004
Figure 5. Cross-map skills between SM, NDVI and DIF in different land cover types.
Agriculture 14 01090 g005
Figure 6. Cross-map skills between SM, NDVI and DIF in different climate zones.
Agriculture 14 01090 g006aAgriculture 14 01090 g006b
Figure 7. Contributions of SM and NDVI to DIF. (a) Spatial distribution of SM contributions to DIF. (b) Spatial distribution of NDVI contributions to DIF. (c) Contribution of SM and NDVI to DIF under different land cover types and (d) different climate zones.
Agriculture 14 01090 g007
Figure 8. Characteristics of DIF, SM and NDVI over the DEM and PRE gradients. (a,b) are the multi-year mean values of DIF, SM and NDVI. (c,d) are the change trends of DIF, SM and NDVI. (e,f) are the contributions of SM and NDVI to DIF.
Agriculture 14 01090 g008
Figure 9. Correlations between DIF and SM/NDVI under different SM or temperature background values. (a) Correlation between SM and DIF under different SM gradients. (b) Correlation between SM and DIF under different Ta gradients. (c) Correlation between NDVI and DIF under different SM gradients. (d) Correlation between NDVI and DIF under different Ta gradients.
Agriculture 14 01090 g009aAgriculture 14 01090 g009b
Disclaimer/Publisher’s Note: The statements, opinions and data contained in all publications are solely those of the individual author(s) and contributor(s) and not of MDPI and/or the editor(s). MDPI and/or the editor(s) disclaim responsibility for any injury to people or property resulting from any ideas, methods, instructions or products referred to in the content.

