Article

Modeling Risk in Fusarium Head Blight and Yield Analysis in Five Winter Wheat Production Regions of Hungary

Department of Agronomy, Hungarian University of Agriculture and Life Sciences, Georgikon Campus, P. O. Box 71, 8361 Keszthely, Hungary
*
Author to whom correspondence should be addressed.
Agriculture 2024, 14(7), 1093; https://doi.org/10.3390/agriculture14071093 (registering DOI)
Submission received: 15 May 2024 / Revised: 26 June 2024 / Accepted: 26 June 2024 / Published: 7 July 2024
(This article belongs to the Section Crop Protection, Diseases, Pests and Weeds)

Abstract

:
The five-year mean yield of five Hungarian wheat production counties was 5.59 t ha−1 with a 7.02% average coefficient of variation. There was a regional effect on yield when progressing from south to north with a 1–2 °C higher mean winter air temperature, meaning that the Ta in southern counties increased the five-season mean yield by 15.9% (p = 0.002) compared to the yield of northern counties. Logistic regression models developed to assess the FHB risk driven by a few meteorological variables (Ta; RH) provided proper predictive performance. The results in the regression model were validated against the measured infection rates (P%) provided by the NÉBIH 30 days before and after heading. The FHB pressure was comparatively higher in Zala County, probably due to its special topological and growing conditions, irrespective of the season. Across all areas studied, two of the five identified counties (Pest and Somogy) provided the best classification for FHB infection. In the remaining three counties, the seasonal mean prediction accuracy (differences) exceeded 10% in only 6 out of 30 model outputs. The modeled five-season P% values averaged 70.4% and 93.2% of the measured infection rates for models 1 and 2, respectively. The coincidence of wet and warm weather around the time of wheat flowering enhanced the risk of FHB.

1. Introduction

Winter wheat (Triticum aestivum), an important staple crop with essential amino acids and minerals [1] and a source of income for farmers and investors, is widely grown in temperate regions of the world [2]. FAOSTAT (2018) reported that over 210 million hectares of bread wheat was cultivated, resulting in over 800 million tons of grain yield that was consumed by approximately one-third of the world’s population. In Hungary, winter wheat is the most significant arable crop, accounting for close to 1 million ha out of 5 million ha of cultivated land. According to the FAOSTAT (2018) [3] report, the mean wheat productivity per unit area has reached 3.77 t ha−1 worldwide. In Hungary, the mean wheat productivity per unit area surpassed 36.4% of the world average during the investigation period (2017–2021 [4]).
Although stable wheat cultivation is essential for food security [5], it is often threatened by fungal diseases; among them is Fusarium head blight (FHB), caused by Fusarium graminearum (Schwabe), which is a devastating wheat disease in temperate regions [6]. F. graminearum is the only species associated with FHB in the wheat-producing regions of Hungary [7]. The toxins produced by fungi contaminate human food and animal feed [8]. Wheat grain yield loss due to FHB was estimated to be 50–70% of the total production in different wheat-producing areas of the world [9], with the highest (100%) yield losses noted among the susceptible wheat cultivars. Crop rotation and tillage can control the appearance of FHB infections by eliminating crop residues and inoculum sources [10].
Previous investigations have demonstrated that FHB infection is significantly affected by weather conditions. Because it is a monocyclic disease (infecting stubble), the weather of the preceding season is also important [11]. Xu et al. (2007) [12] found wheat to be susceptible to FHB infection over a critical period just around anthesis (depending on the total precipitation PR and average air temperature Ta for a four-week period before anthesis). Due to its close relation to PR during anthesis and Ta in the preceding six weeks [13], the FHB disease risk can be estimated with a >70% accuracy rate [14].
Infection occurs mainly in mid-to-high altitudes with high humidity in the wheat-growing areas of the world. In field conditions (Peoria, Illionis, USA), the relative humidity (RH) was 95–100% with a Ta of 13–22 °C [15] during dispersal in wheat. These data were in agreement with those measured by Tschanz et al. (1976) [16] in a controlled environment (optimum Ta: approximately 16 °C, atmospheric moisture below saturation). Sutton (1982) [17] noted that periods of warm weather with persistent wetness were the best conditions for an FHB epidemic in Canada. Based on his observation, infection progressed with a Ta of 15–35 °C (the optimum range was 25 °C–32 °C) in the different stages of wheat development. In the US, Shah et al. (2019) [18] found that the best Ta was the daily difference between maximum and minimum temperatures detected hourly. Bondalapati et al. (2012) [19] developed nine FHB prediction models for barley using a wide range of meteorological variables (average, minimum, and maximum Ta together with weighted time (in hours) when the RH was above 90%) around anthesis (±5 days) in Canada. Three critical periods, approximately 7 days before and 10 days after heading with three different regression equations incorporating PR, high RH, and warm Ta (10 °C < Ta > 32 °C) including maximum temperatures, were distinguished in [20] in Ontario. In their multiple regression model, Birr et al. (2019) [21] successfully applied meteorological variables (average Ta covariates, cumulative PR, and their interaction) and crop features (mycotoxin concentrations) during wheat flowering in farmers’ fields in Germany between 2008 and 2017. There were many more complex models like the above-cited ones, such as those established by Rossi et al. (2003) [22] in Italy. The authors adjusted the spore dispersal to rainy (PR > 0.2 mm) and non-rainy (PR < 0.2 mm) days as the main influencing factors. In addition, daily mean Ta, PR intensity, and duration of hours with RH > 80% were included in their regression model.
Regarding future climate scenarios, Ta increases will probably be accompanied by modifications in both the amounts and distribution of PR. The basin-type geographical position of Hungary makes this country extremely vulnerable to changes in weather conditions [23]. Using Zala County (Keszthely) as an example of changes, annual precipitation declines of 0.2–0.7 mm were determined in the last century (1901–2000) using an autocorrelated Mann–Kendall trend test [24,25]. At the same time, an overall significant monotonic increasing tendency of 0.4 °C/100 year in Ta was detected [24]. The Hungarian Observational Network published similar trends for other places in the state on its webpage (www.met.hu; accessed on 1 January 2023).
Because the abiotic factors of climate change are important drivers affecting host–pathogen interactions [15], several studies were published on the topic outside Hungary [26,27]. Less information is available for the five wheat cultivation regions of the Hungarian University of Agriculture and Life Sciences (MATE). Our objectives were to (i) identify weather conditions associated with wheat yield and the likelihood of FHB appearance, (ii) adopt a model of easily accessible meteorological elements for FHB forecasting that provides useful information to mitigate yield loss risk, and (iii) analyze spatial and temporal variances in wheat yield and FHB infection rates in five counties with varied growing seasons/regional datasets. Due to its high weather dependency, FHB is an ideal disease for damage forecasting. As FHB disease risk prediction has tended to be regional in nature [28], the included five representative wheat production counties met the expectations for MATE’s wheat research activity, although model performance may differ among the counties because weather data and agronomic procedures are unique to each county. Nonetheless, the model-estimated FHB risk based on easily detectable meteorological variables from the official Hungarian station network in the counties was adopted in the assessing prediction system in [6]. Demonstrated results in FHB projection models across the wheat production counties of MATE may strengthen the collaboration among the university researchers and farmers of the studied regions to improve FHB protection strategies.
Among the interactions arising from global warming, the rising Ta and atmospheric CO2 content and the modified PR patterns [29] will probably cause the wheat yield (and quality) to be highly variable in the future and require further action.

2. Materials and Methods

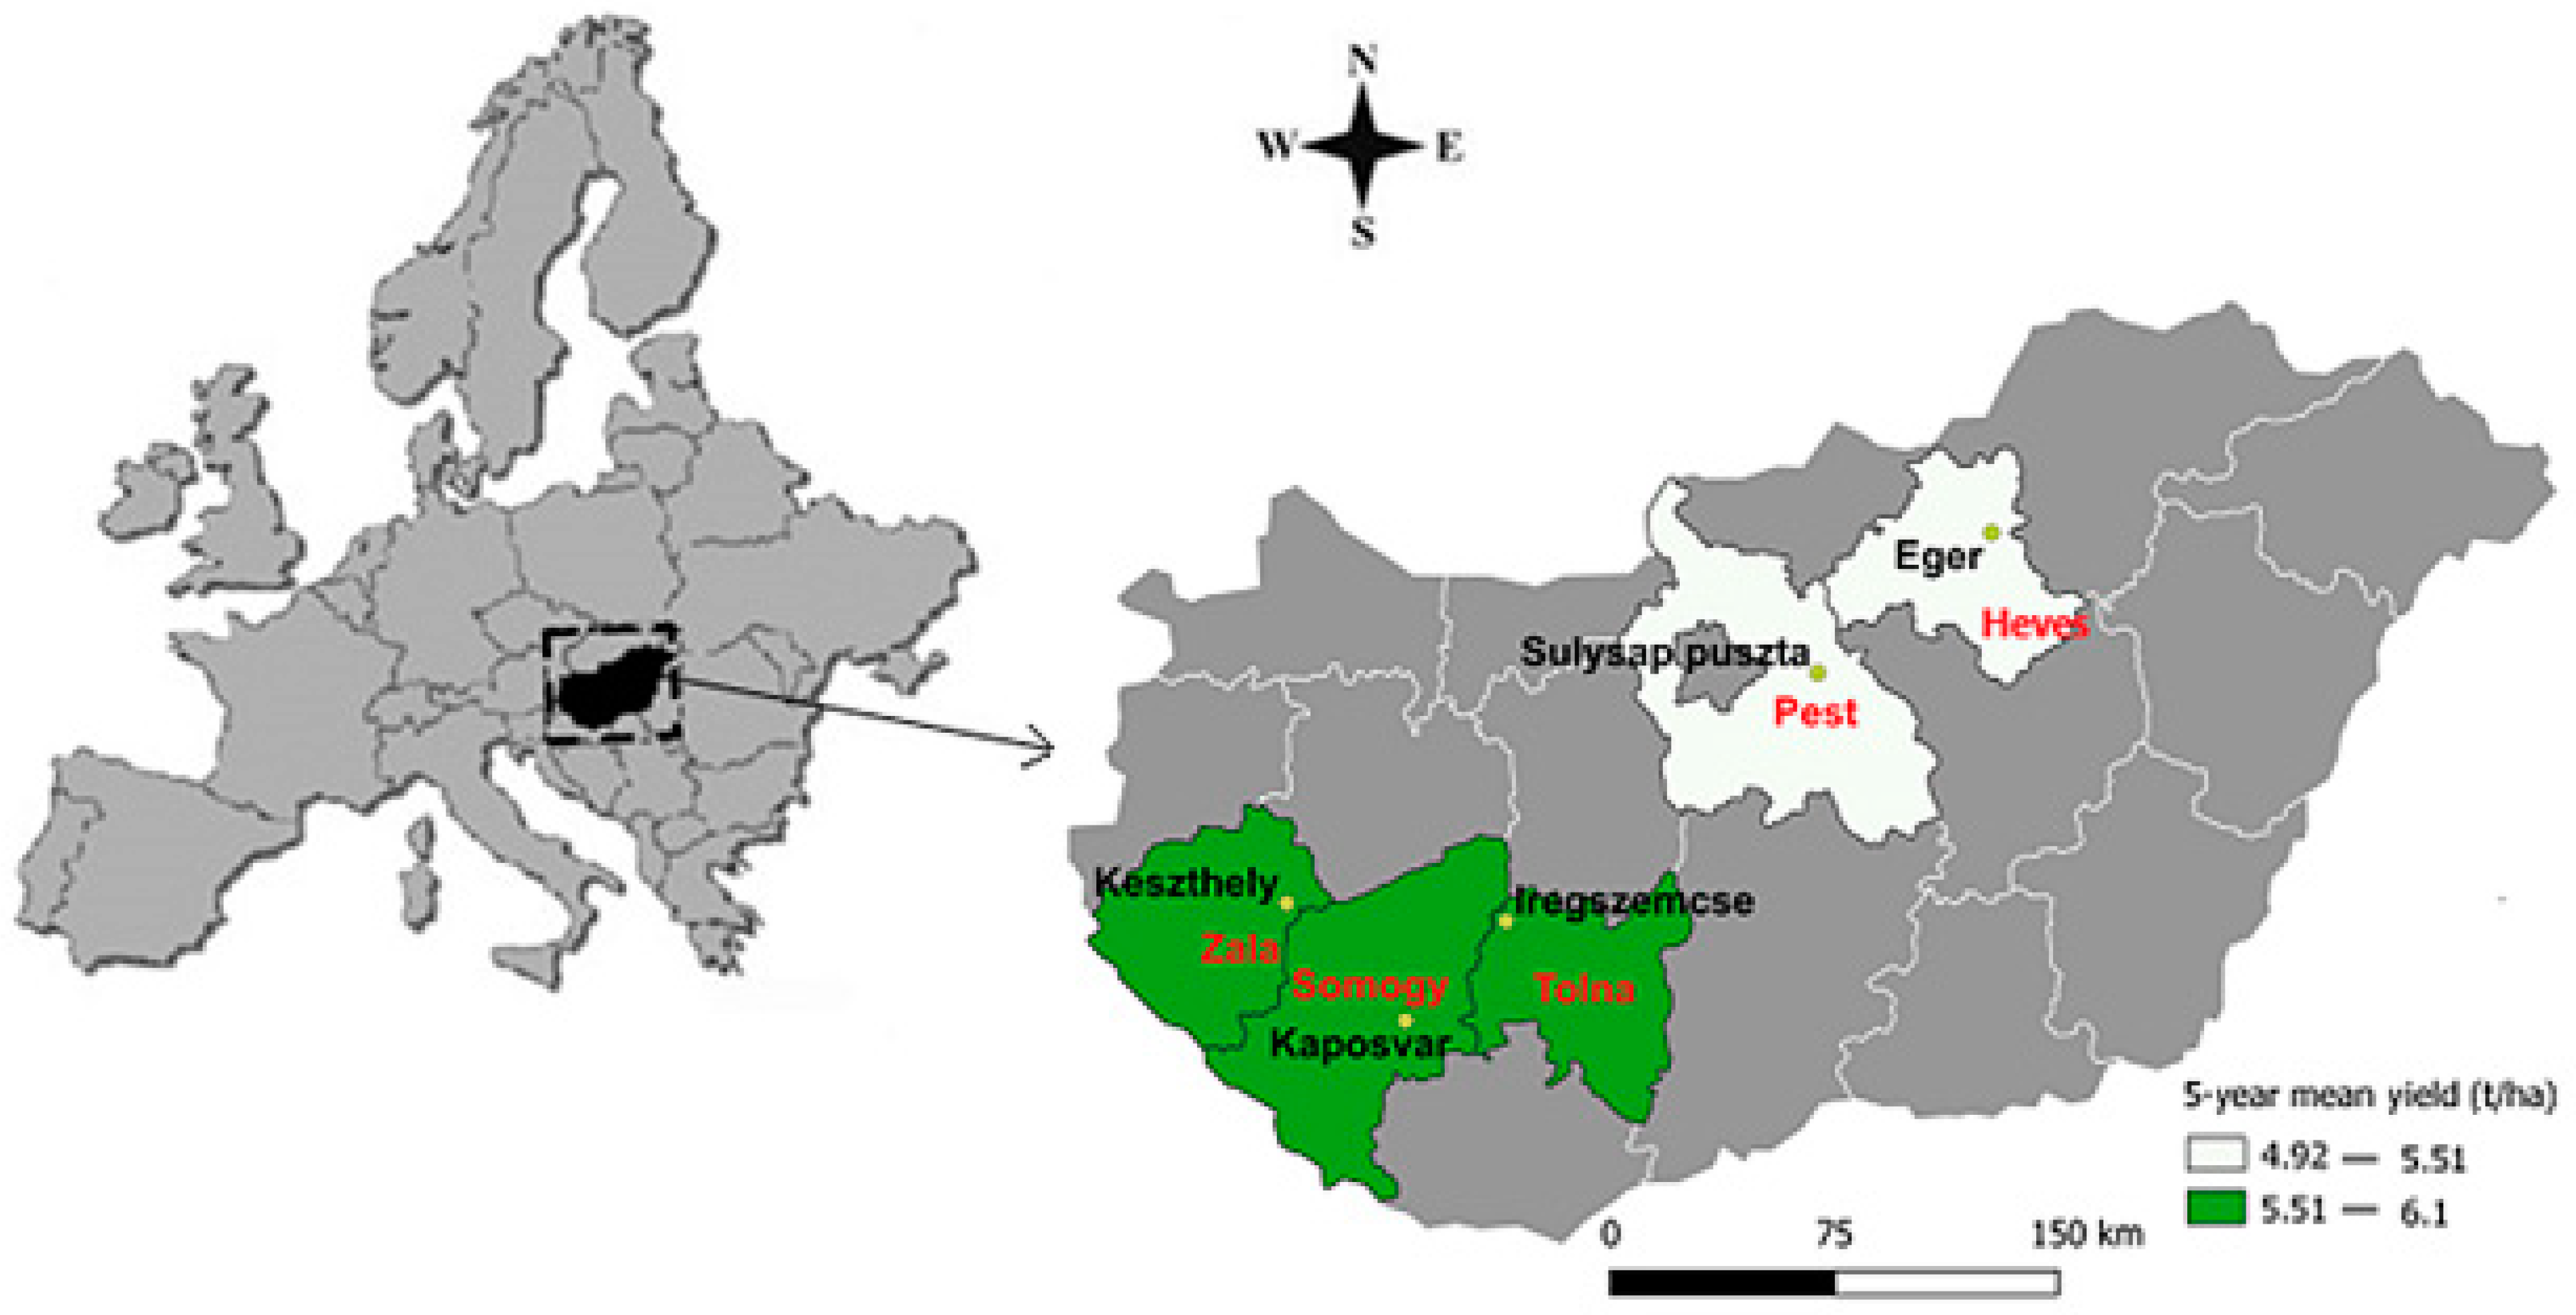
2.1. Measured Variables: Weather and Crop Data

Associates from the MATE, NÉBIH (National Food Chain Safety Office), and Hungarian Central Statistical Office contributed information about winter wheat production and FHB epidemics in five counties belonging to the extension network of the University. According to the observations of De Wolf et al. (2003) [30] from four US states (Ohio, North Dakota, Missouri, and Kansas), variations in wheat varieties, agronomic procedures, and estimated infection rates among the five counties resulted in no consistent quantitative scale for the magnitude of FHB epidemics, although the growing seasons were classified with a high epidemic (infection rate > 10%), moderate, or no disease rate. Fungicide treatments were not considered in the study.
The daily meteorological variables of Ta and PR for selected meteorological stations (Heves: Eger, Pest: Sülysáp, Somogy: Kaposvár, Tolna: Iregszemcse, and Zala: Keszthely), representative of five Hungarian counties (Heves, Pest, Somogy, Tolna, and Zala) covering the winter wheat production area of the MATE (Hungarian University of Agriculture and Life Sciences, Gödöllő), were supplied by the Hungarian Observational Network, HungaroMet (Figure 1) from 2017 to 2021. Daily weather data from these 5 weather stations for the entire wheat-growing period from October to June were summarized separately. These data were the basis of weather and yield analysis. Separate periods were considered, such as those in which the meteorological conditions were most likely to affect the FHB infection (May–June). In May and June, hourly meteorological data of Ta and RH were used in the FHB prediction for the same synoptic weather stations closest to the wheat cultivation areas from which the observed (daily) data for grain yield were also collected. The stations were equipped with instantaneous Ta and RH sensors detecting data 2 m above ground level daily throughout the year. Daily PR amounts were collected 1 m above the ground surface. Every climate station’s elevation was below 300 m and located less than 2 km from the university’s wheat field. Each station was georeferenced and provided a homogenized Ta. Due to the county-based study regarding wheat yield and infection rates, the measuring network was designed to capture county mesoscale rather than local or microscale weather conditions.
In classifying the weather during May and June, a ±10% monthly PR sum deviation and a ±1 °C alteration in monthly mean Ta were assumed from the five-season monthly means (2017–2021) above and below (the five-season average PR5s and Ta5s) for both included meteorological variables, allowing the following weather classes to be distinguished:
  • Dry month (D): PR > P5s × 0.9;
  • Wet month (W): PR > P5s × 1.1;
  • Normal (N): P5s × 0.9 < PR < P5s × > 1.1;
  • Warm month (H): TaTa5s + 1 °C;
  • Cool month (C): TaTa5s − 1 °C;
  • Normal (N): Ta5s − 1 °C < Ta < Ta5s + 1 °C.
The annual mean wheat yields and the cultivated winter wheat field sizes (Table 1) for the period 2017–2021 were collected from the database of the Hungarian Central Statistical Office [4]. The average yields mostly belonged to Hungarian-bred mega varieties. Irrespective of the county, among others, the most frequently sown varieties were Mv Nádor (https://martongenetics.com/en/termek/mv-nador-wheat/; accessed on 1 May 2024), Mv Kolo (https://martongenetics.com/en/termek/mv-kolo-wheat; accessed on 1 May 2024), Mv Nemere (https://martongenetics.com/en/termek/mv-nemere-wheat/; accessed on 1 May 2024), and Mv Suba (https://martongenetics.com/en/termek/mv-suba-wheat/; accessed on 1 May 2024). Bayer (Germany) variety Mulan was also popular during the investigation time.
Annual mean FHB severity values (infection rates in %) collected by the NÉBIH [31] were gathered from 30 sites in each county (5 counties × 30 sites = 150 samples seasonally) between 2017 and 2021. The NÉBIH worked under strict governmental regulation. The disease data for all fields within a county near each of the 5 weather stations were averaged annually to decrease the overall variability of the data. These data were recorded as the percentage of grain affected by FHB after harvesting. The method of assessing the FHB grain infection rates was published (in Hungarian) in Regulation 401/2006/EK based on the EU directives (https://eurlex.europa.eu/legalcontent/HU/TXT/PDF/?uri=CELEX:32006R0401&from=NL; accessed on 1 January 2023) and in the WHO Technical report (2011) [32]. FHB severity data were collated from a minimum of 30 sample locations throughout each county using the above NÉBIH directives [31]. In this study, data collected over harvest years 2017–2021 for five Hungarian counties (150 samples annually) were used for model validation. Differences in wheat cultivars and crop cultivation among the fields may have been present. Based on the five-season observations, no extremely high quantitative scales for the magnitude of FHB epidemics were detected. However, within each county, a separation between growing seasons was observed. The preselected field disease severity in both measured and modeled observations was 10% [30], with binary codes of 1 (infection rate > 10%) and 0 (infection rate < 10%).

2.2. Modeling Probability of Wheat FHB Infection by De Wolf et al. (2003)

Two logistic weather-based regression models of De Wolf et al. (2003) [30] were adopted for the probability estimation of FHB. The timeframe of the disease prediction model was 30 days before and 30 days after anthesis (different from that of the original publication). Most regression models use meteorological elements to detect FHB epidemics/non-epidemics [33] for shorter periods within 5–14 days preceding and following anthesis [18,34]. From several weather-based regression models reviewed by Matengu et al. (2023) [28], highly variable timeframes, ranging from 120 days before to 14 days after anthesis, were reported. However, Shah et al. (2019) [18] concluded that 5-day pre-anthesis and 15-day post-anthesis durations for capturing weather associations with FHB disease appeared to have too many predictors. Giroux et al. (2016) [35] highlighted the advantage of the extended timeframe and established that models limited to pre-anthesis weather variables might have a weak performance. The longer timeframe was, thus, used in the study to distinguish epidemics/non-epidemics, since the five production counties likely had slightly different anthesis dates and a broader range of cultivated varieties than was used in this study. However, Bondalapati et al. (2012) [19] found that wheat variety was not a significant factor when it was incorporated into their regression model.
Previous investigations indicated that the anthesis of winter wheat was at the beginning of June in Hungary. Accordingly, hourly measured meteorological variables of Ta and RH were included in the estimation from 1 May to 30 June between 2017 and 2021.
In model 1, the inputs that correlated best with the infection were an hourly RH greater than 90% and a Ta interval between 15 and 30 °C. The best model fit was as follows:
P % = 3.3756 + 6.8128 × T a R H
where P is the probability (from 0 to 1) of FHB infection above 10% and TaRH is the duration of 15 °C < Ta < 30 °C corresponding to the conditions RH > 90% in May and June (in the original publication, this model was only used during pre-anthesis).
Model 2 was developed with an interaction INT3 term (between predictor variables to detect which were most aligned with infection severity above 10%) for the study period:
P % = 3.3756 + 10.5097 × I N T 3
where P is the probability of infection as a percentage and INT3 is the continuous number of hours with 15 °C < Ta < 30 °C corresponding to the conditions RH > 90% during May and June.
Before using the equations, the variables were scaled to the data used to develop the original model of De Wolf et al. (2003) [30]. The conditions were counted using a continuous hour counting algorithm corresponding to the wheat bloom in the past (1 June). The probabilities P% were calculated in an Excel spreadsheet using the models. A P above 10% was used to determine the frequency of wheat epidemics for the given locations.

2.3. Statistics

The annual grain yield and infection rate data were analyzed using two-way mixed ANOVA without replication. County was included in the model as a fixed factor, and year was included in the model as a random factor. Since there was no replication, the interaction term was excluded from the model. Pairwise comparisons were performed using the Tukey test. All computations were conducted using SPSS 29.0 software. Wheat yield plots were created using the ggplot2 3.5.1 package [36] in R 4.4 statistical software [37].
Model performance was assessed by comparing the predicted FHB infection rates with observed infection.
The root-mean-square error (RMSE) and mean absolute percentage error (MAPE) were used to quantify the performance and transferability of the model to Hungarian data:
R M S E = 1 n n ( M e M o ) 2
where Me and Mo are the estimated and observed infection rates.
M A P E = 1 n n M e M o M e × 100 %
Residuals were visualized to assess their distributions and relationship with the measured data. Pearson correlation coefficients between the residuals and estimated infection rates were also calculated. If the models were valid for the data analyzed in this paper, these correlations should be close to zero.

3. Results and Discussion

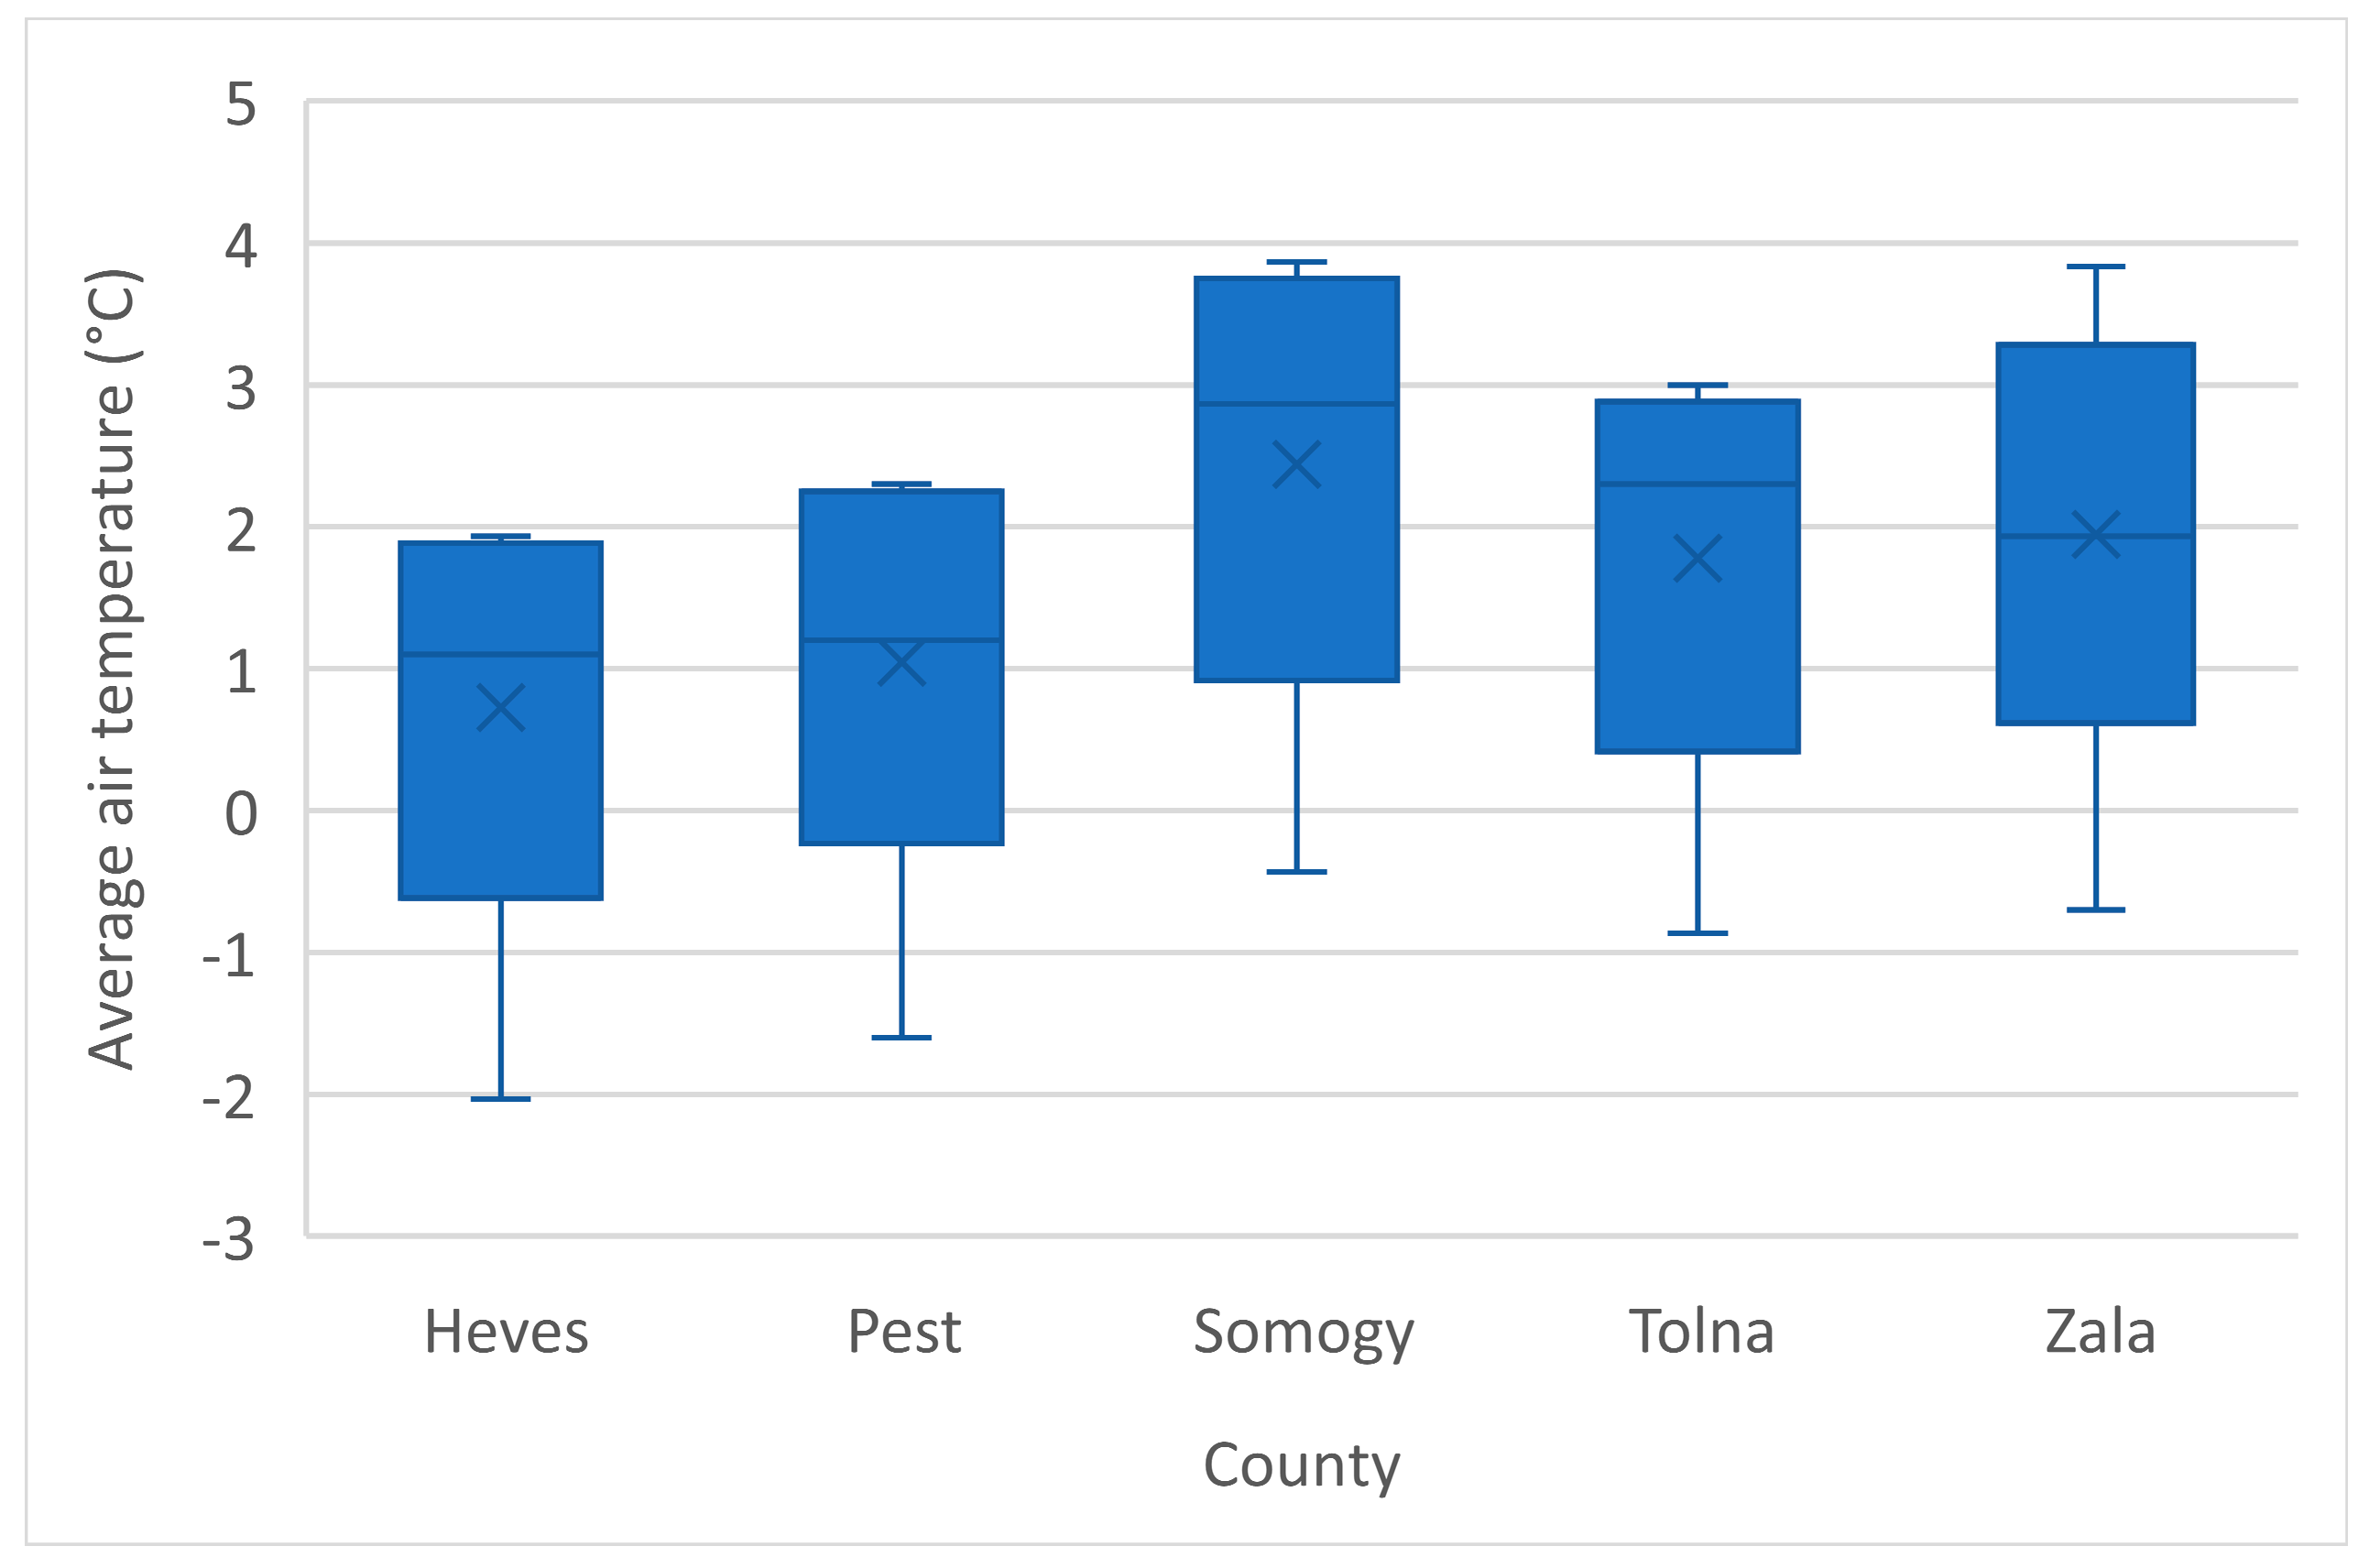
3.1. Seasonal Weather Conditions between 2017 and 2021

The five-season mean Ta of the studied regions (Table 2) showed moderate variation, ranging from 8.3 ± 0.8 °C (Heves) to 9.2 ± 0.6 °C (Somogy). The seasonal average Ta values for the southern sites were approximately a half degree higher than the Ta values for the northern counties.
Highly variable and irregular five-season mean PR events from 395.5 ± 77.2 mm (Tolna) to 441.8 ± 24.3 mm (Heves) were characteristic of the investigated area (Table 2). High SD data in five-season means, sometimes exceeding 100 mm (Somogy: 435.1 ± 121.2 mm), confirmed the strong interannual PR variability. Monthly mean PR sums, ranging from 0.4 mm (Heves: December 2016) to 144.2 mm (Pest: June 2020), had even greater variability compared to seasonal PR totals. It is important to note that, in several seasons and locations, extremely high monthly PR totals in late June (from 18% to 37% of the seasonal P sums) might not be totally utilized in wheat yield (Zala: 2018; Tolna: 2018 and 2020; Heves: 2017, 2019, and 2021; Pest: 2018 and 2020; Somogy: 2018). Moreover, abundant water in June may favor FHB outbreaks in the wheat crop.

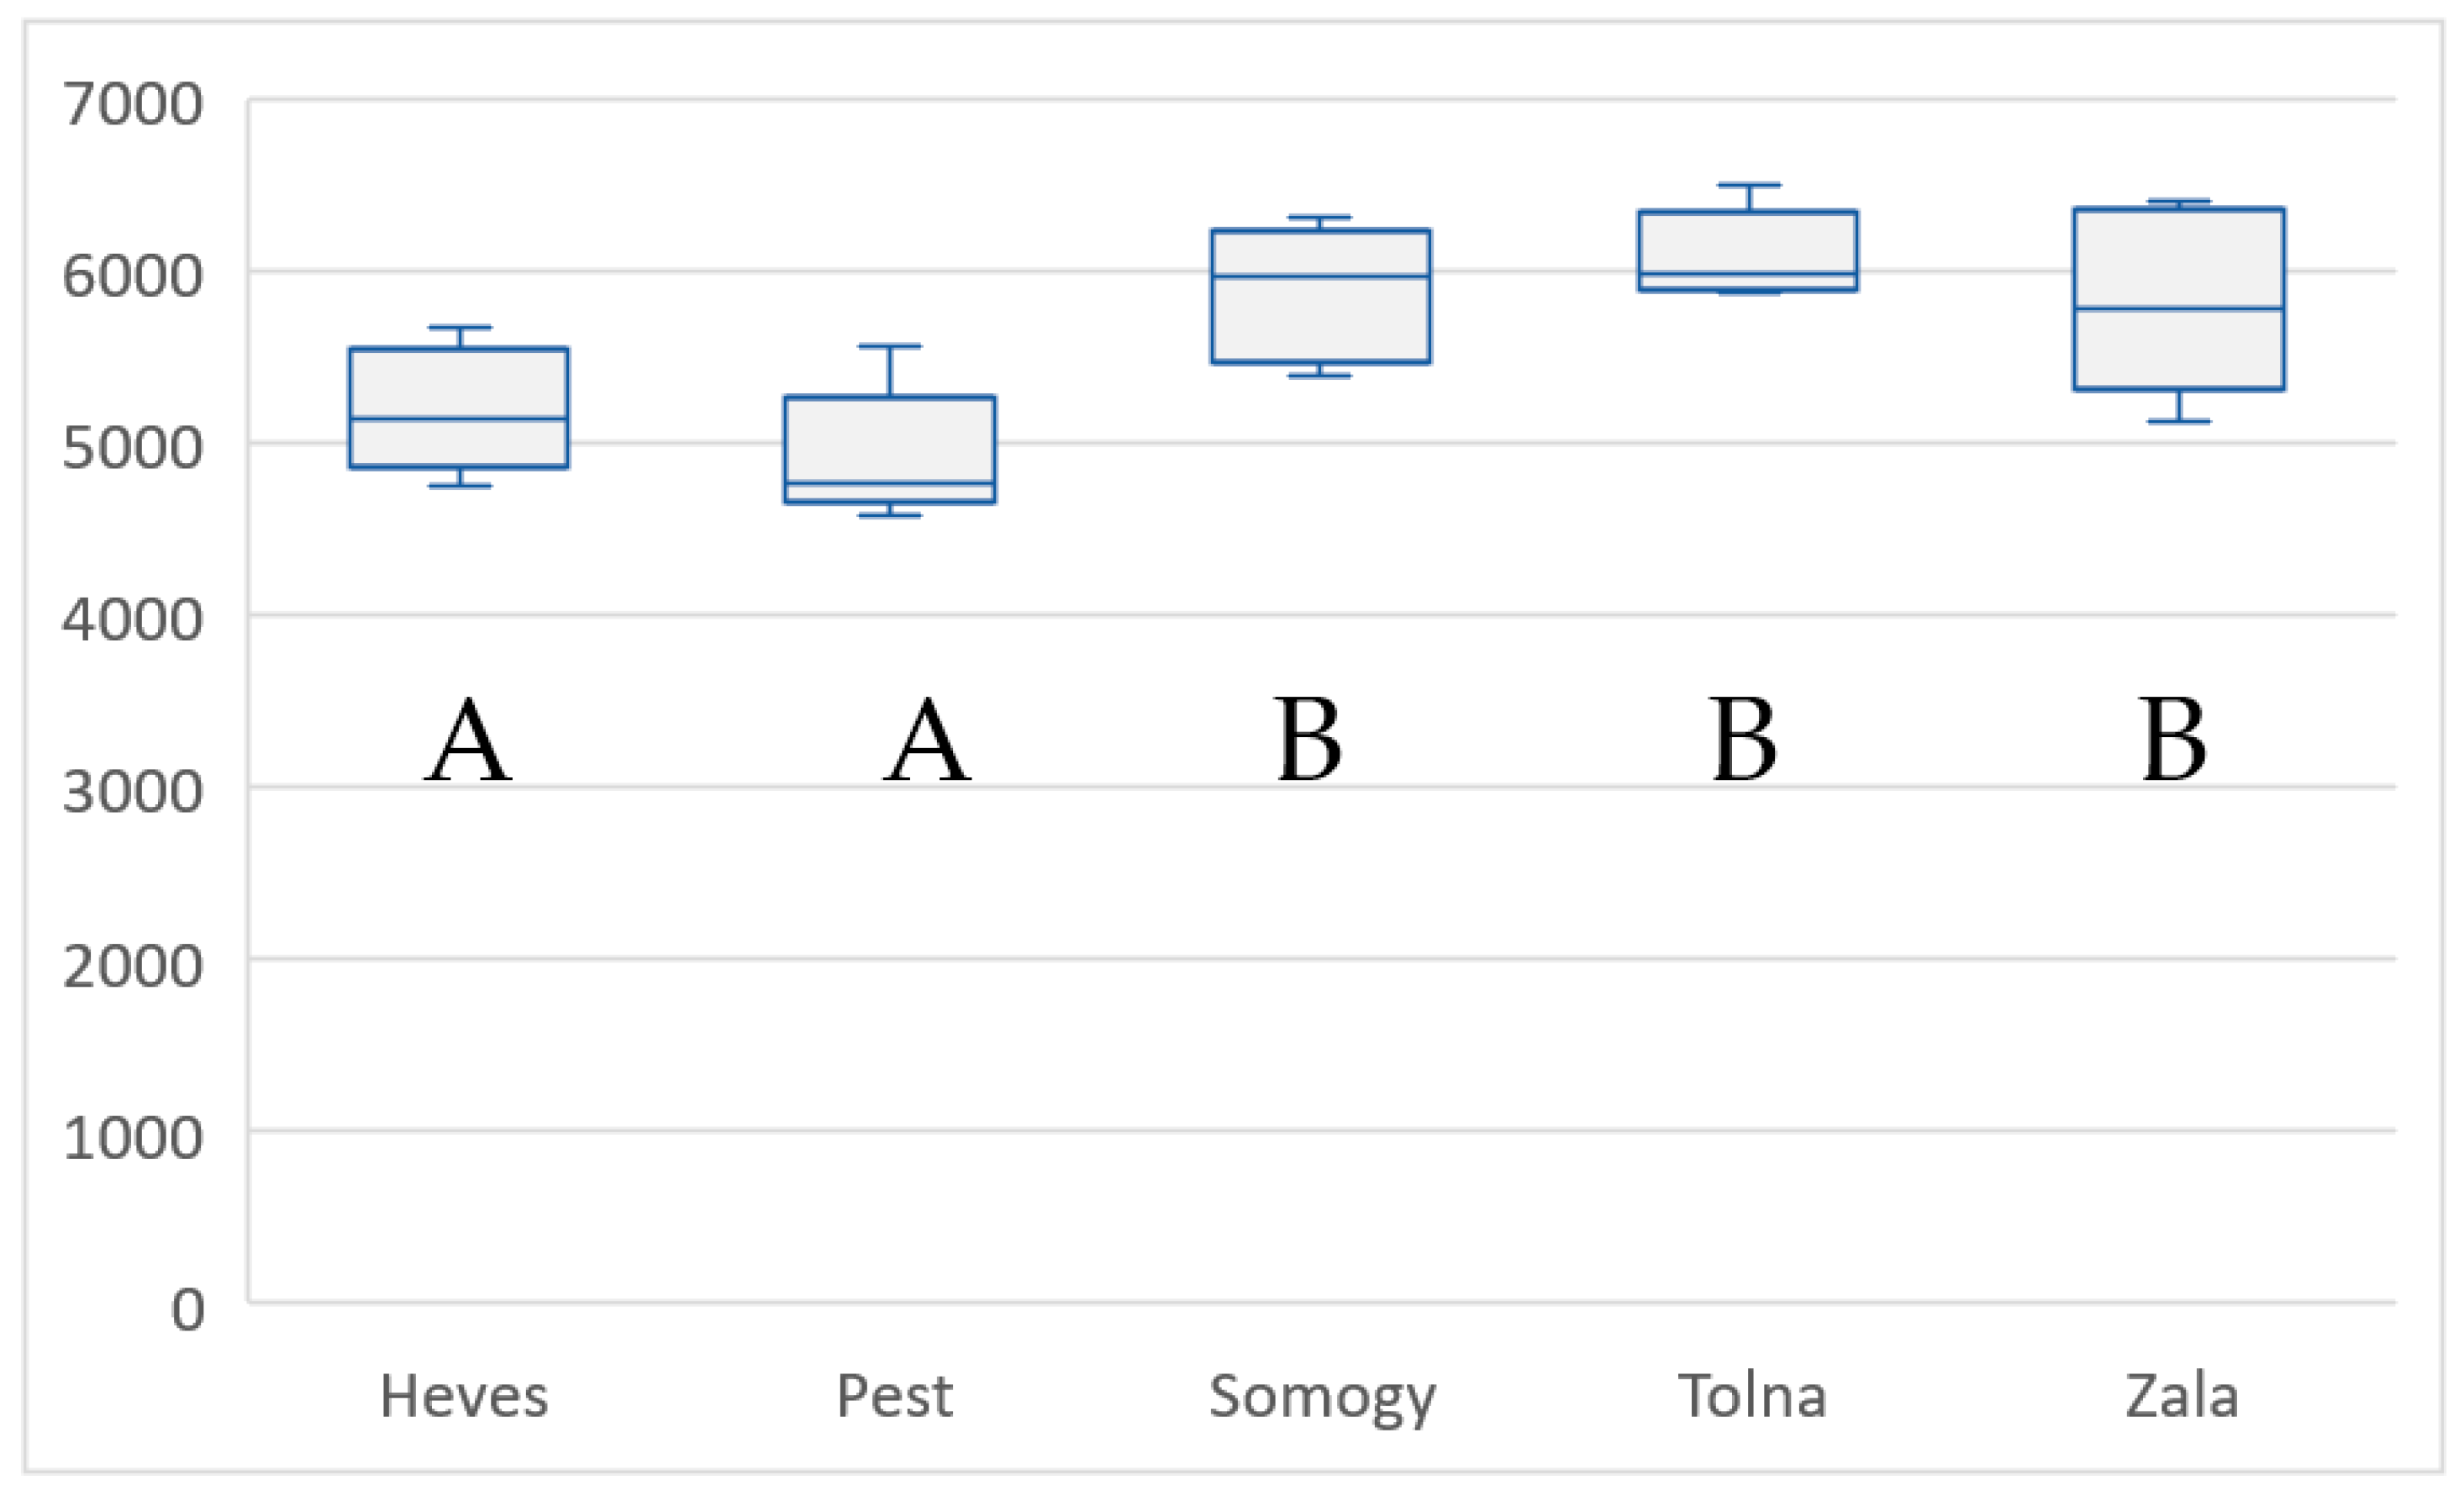
3.2. Wheat Yield in the Studied Seasons

Across all sites, the five-year wheat yields averaged 5.59 t ha−1 and ranged from 4.92 t ha−1 in Pest to 6.1 t ha−1 in Tolna County.
The main effect of the county was significant in the case of yield (p < 0.001). The yields in the northern counties of Heves and Pest were significantly lower (p < 0.05) than those in the three southern regions (Figure 2). According to the results, the most and least productive provinces were Tolna and Pest, respectively. Across all provinces and seasons, geographical position played a crucial role in yield determination. Proceeding from north (Heves) to south (Tolna), the five-year average yield decline was 15.9% (p = 0.002). At the same time, no significant differences were observed between the two northern (Heves and Pest, p = 0.678) and three southern (Zala and Somogy, p = 0.999; Zala and Tolna, p = 0.700; Somogy and Tolna, p = 0.82) provinces. Given that most climate variables are not consistently significant in wheat yield globally [38], their incorporation in climate–wheat production analysis needed to be regionally focused, as it was in the analysis.
The highest differences were observed during the 2020 season, probably due to the extremely dry April and May weather (monthly PR totals in the north and south provinces were between 5.7 and 19.1 mm and 15.0 and 39.2 mm, respectively). Asseng et al. (2019) [39] reported that wheat yields are expected to be lower and more variable in most low-water-income regions. As the five-season PR sums were approximately 400 mm for the entire study region, the PR provided enough water for rainfed wheat during most years, although the seasonal distribution of PR might negatively impact the wheat growth and development in Hungary.
Across all growing seasons, the variation coefficient CV indicated that the yield stability (CV of 9.3%) was the lowest in Zala County (with lower grain yield), while the smallest yield variation of CV = 4.27% was observed in Tolna with respect to the highest grain yield.
Except for in Pest, the lowest yields, ranging from 4.76 t ha−1 (Heves) to 5.88 t ha−1 (Tolna), were observed during the cool and wet 2018 season. Asseng et al. (2015) [39] reported that higher annual Ta accelerated crop development, shortened the grain filling period, and limited the duration of the grain growth period and the amount of wheat yield. In contrast, 1–2 °C warming in the North China Plain increased the leaf area and chlorophyll content, resulting in higher biomass and grain yield [40].
Variations in the temporal distribution of maximum yields (2017: Tolna—6.51 t ha−1, 2020: Zala—6.41 t ha−1, Somogy—6.32 t ha−1, 2021: Heves—5.67 t ha−1, Pest—5.57 t ha−1) indicated differences among locations; in the two northern counties, the maximum yield was measured in 2021, while in two out of the three southern counties, it appeared during 2020. In agreement with the yield changes reported by Bai et al. (2022) [41], the annual distribution in PR among the years could also partially mitigate the annual variations in wheat.
Among the climate variables, the annual mean Ta and P sum were found to determine wheat growth, resulting in different performances with regard to crop yield [42]. Four out of the five seasons had the maximum yield during cooler growing seasons; June was characterized by a below-long-term average monthly Ta. Lobell and Burke (2010) [43] concluded that annual Ta was the key factor regulating crop growth and development. Under climate change, mainly in central Europe, the Ta during wheat flowering is of primary importance, as crops must exhibit tolerance to increased Ta by extending the grain filling period [44,45]. Similar to our findings, a significant negative correlation (−0.26, p < 0.001; [42]) was found between annual Ta and yield of winter wheat [46], although, contrary to most previous investigations, instead of annual mean Ta, seasonal and monthly mean Ta values were used in this yield analysis. According to the study, increased Ta might accelerate wheat root senescence, limiting soil water uptake and decreasing the number of spikes and kernel number per spike, resulting in reduced wheat yield [47]. In addition, warmer winter Ta was significant for wheat production (Figure 3), with consistently greater yield. The box plots for county winter Ta values in Figure 3 depict the warmer winters in the southern counties (Somogy, Zala, and Tolna), with higher median values and wider intervals between their first and third quartiles. Increases of 1 to 2 °C in the average winter Ta in the southern provinces increased the five-season mean yield by 15.9% (p < 0.005) compared to those for Heves and Pest. However, in regions close to our altitude (China—latitude: 38–40°, longitude: 114–120°), a 5–6 °C annual Ta increment caused heat stress in wheat, significantly reducing grain yield [48].
Notably, influences on wheat yield were observed to fluctuate with different management practices, crop features, and growing (environmental) conditions in previous studies (see a summary in Hasheminasab et al. (2023) [49]), although a comprehensive overview is required to understand their contribution to wheat grain yield.

3.3. Measured Infection Rates (P%) in the Counties between 2017 and 2021

The yearly mean Fusarium head blight (FHB) infection rates in the counties exhibited a strong variation, ranging from 2.5% (Heves in 2017) to 30.2% (Zala in 2018).
The main effect of county on the infection rate was significant (p < 0.001). Averaged over five years, the infection rates of the counties ranged from 3.9% (Heves) to 21.7% (Zala), with an overall average of 11.3%. In accordance with the smallest yields, the lowest five-season average FHB infections of 3.9% and 6.0% were obtained in the northern counties of Heves and Pest, respectively (Figure 4).
During this study, Zala had the most serious five-season average FHB disease rate (21.7%), with strong inter-annual variability within (SD: 38.6%) and across the samples (highest standard error: 3.7). The reason for this might have been the special topological features of Zala County (largest forest cover among all Hungarian counties, the total water catchment area of the Zala River feeding Lake Balaton is found here, and most of the Kis-Balaton wetland and other marsh areas are located here), which might create a special microclimate in Zala compared to the other counties. Special microclimates with decreased global radiation, cooler Ta, and increased humidity are forest characteristics that might also impact FHB initiation. In Zala, the number of smallholder farmers (with a capital shortage) is also high, causing diversity in winter wheat cultivation. The correlations with winter wheat yield affected by FHB were −0.5 (p < 0.001) and 0.31 (p < 0.05) for sunshine hours and monthly PR sums, respectively (Sang et al., 2019). The higher forest cover suggested that lower solar radiation, declined Ta, and only the same amount of P could create more humid weather conditions in Zala than the microclimates in other regions. Belizán et al. (2019) [50] confirmed that high humidity could promote pathogen (FHB) growth. Increased humidity strongly induced pathogen spore release, while Ta and solar radiation acted as stability factors [51]. Across all seasons, significant infection rate decreases ranged from 42.5% (p = 0.02) in Tolna to 138.4% (p < 0.001) in Heves, related to Zala. Based on the five-season mean Ta of 8.3 °C in Heves, the coolest weather of this site was associated with the lowest and least variable infection rate of 3.9 ± 26.4%, with a standard error = 0.47. The preference for the lowest Ta of Heves in the release and ascospore survival [52] was not confirmed in this study. No significant differences were observed in five-season mean infection rates between Heves and Pest (p = 0.867), Pest and Somogy (p = 0.439), and Somogy and Tolna (p = 0.311).
The inter-seasonal variability of mean meteorological variables was not exceptionally high across all locations (maximum differences in five-season mean Ta: <1 °C; average seasonal P sums: <50 mm), although an irregular intra-annual PR distribution was characteristic of the study location (Carpathian basin). To analyze the effect of the causal agents (Ta and PR) on infection rates, May and June were selected (Table 3) because FHB infection usually occurs in these months [53]. Previous studies, however, have demonstrated that the influence of different Ta values in FHB epidemics is very complex, whether occurring during the pathogen’s development or the infection stage [54]. David et al. (2016) [51] identified high PR with low solar radiation as effective predictors of Fusarium graminearum ascospore release in wheat, although they found that PR (and soil temperature) was not consistent in their two observation years in Kentland Farm (Blacksburg, VA, USA).
The measured five-season average infection rates of the counties ranged from 3.9% in Heves to 21.7% in Zala. The meteorological elements of PR and Ta together may significantly contribute to FHB outbreaks in wheat. Shah et al. (2019) [18] revealed that the single Ta variable cannot be used as an indicator to estimate FHB outbreaks. Moreover, the combined interactive effect of the two meteorological variables Ta and PR on wheat FHB epidemics can vary significantly from the results obtained from examining Ta alone [14]. This is why the monthly mean Ta and PR sums accounted for weather class formation around the critical period of FHB infections (May and June) (Table 3). Out of the five counties included, the highest measured FHB outbreaks were enhanced in three counties in 2018 (Zala, Pest, and Heves) and two in 2019 (Tolna and Somogy). These high FHB outbreaks coincided with warm and wet weather during critical periods in Zala (2018) and Somogy (2019). Except for in Heves, cool/dry weather in at least one out of the two months of May and June reduced FHB disease development during 2017. The magnitude and direction of the FHB risk varied across the wheat-growing counties, in agreement with the review results of Vaughan et al. (2016) [15] for multiple worldwide locations.

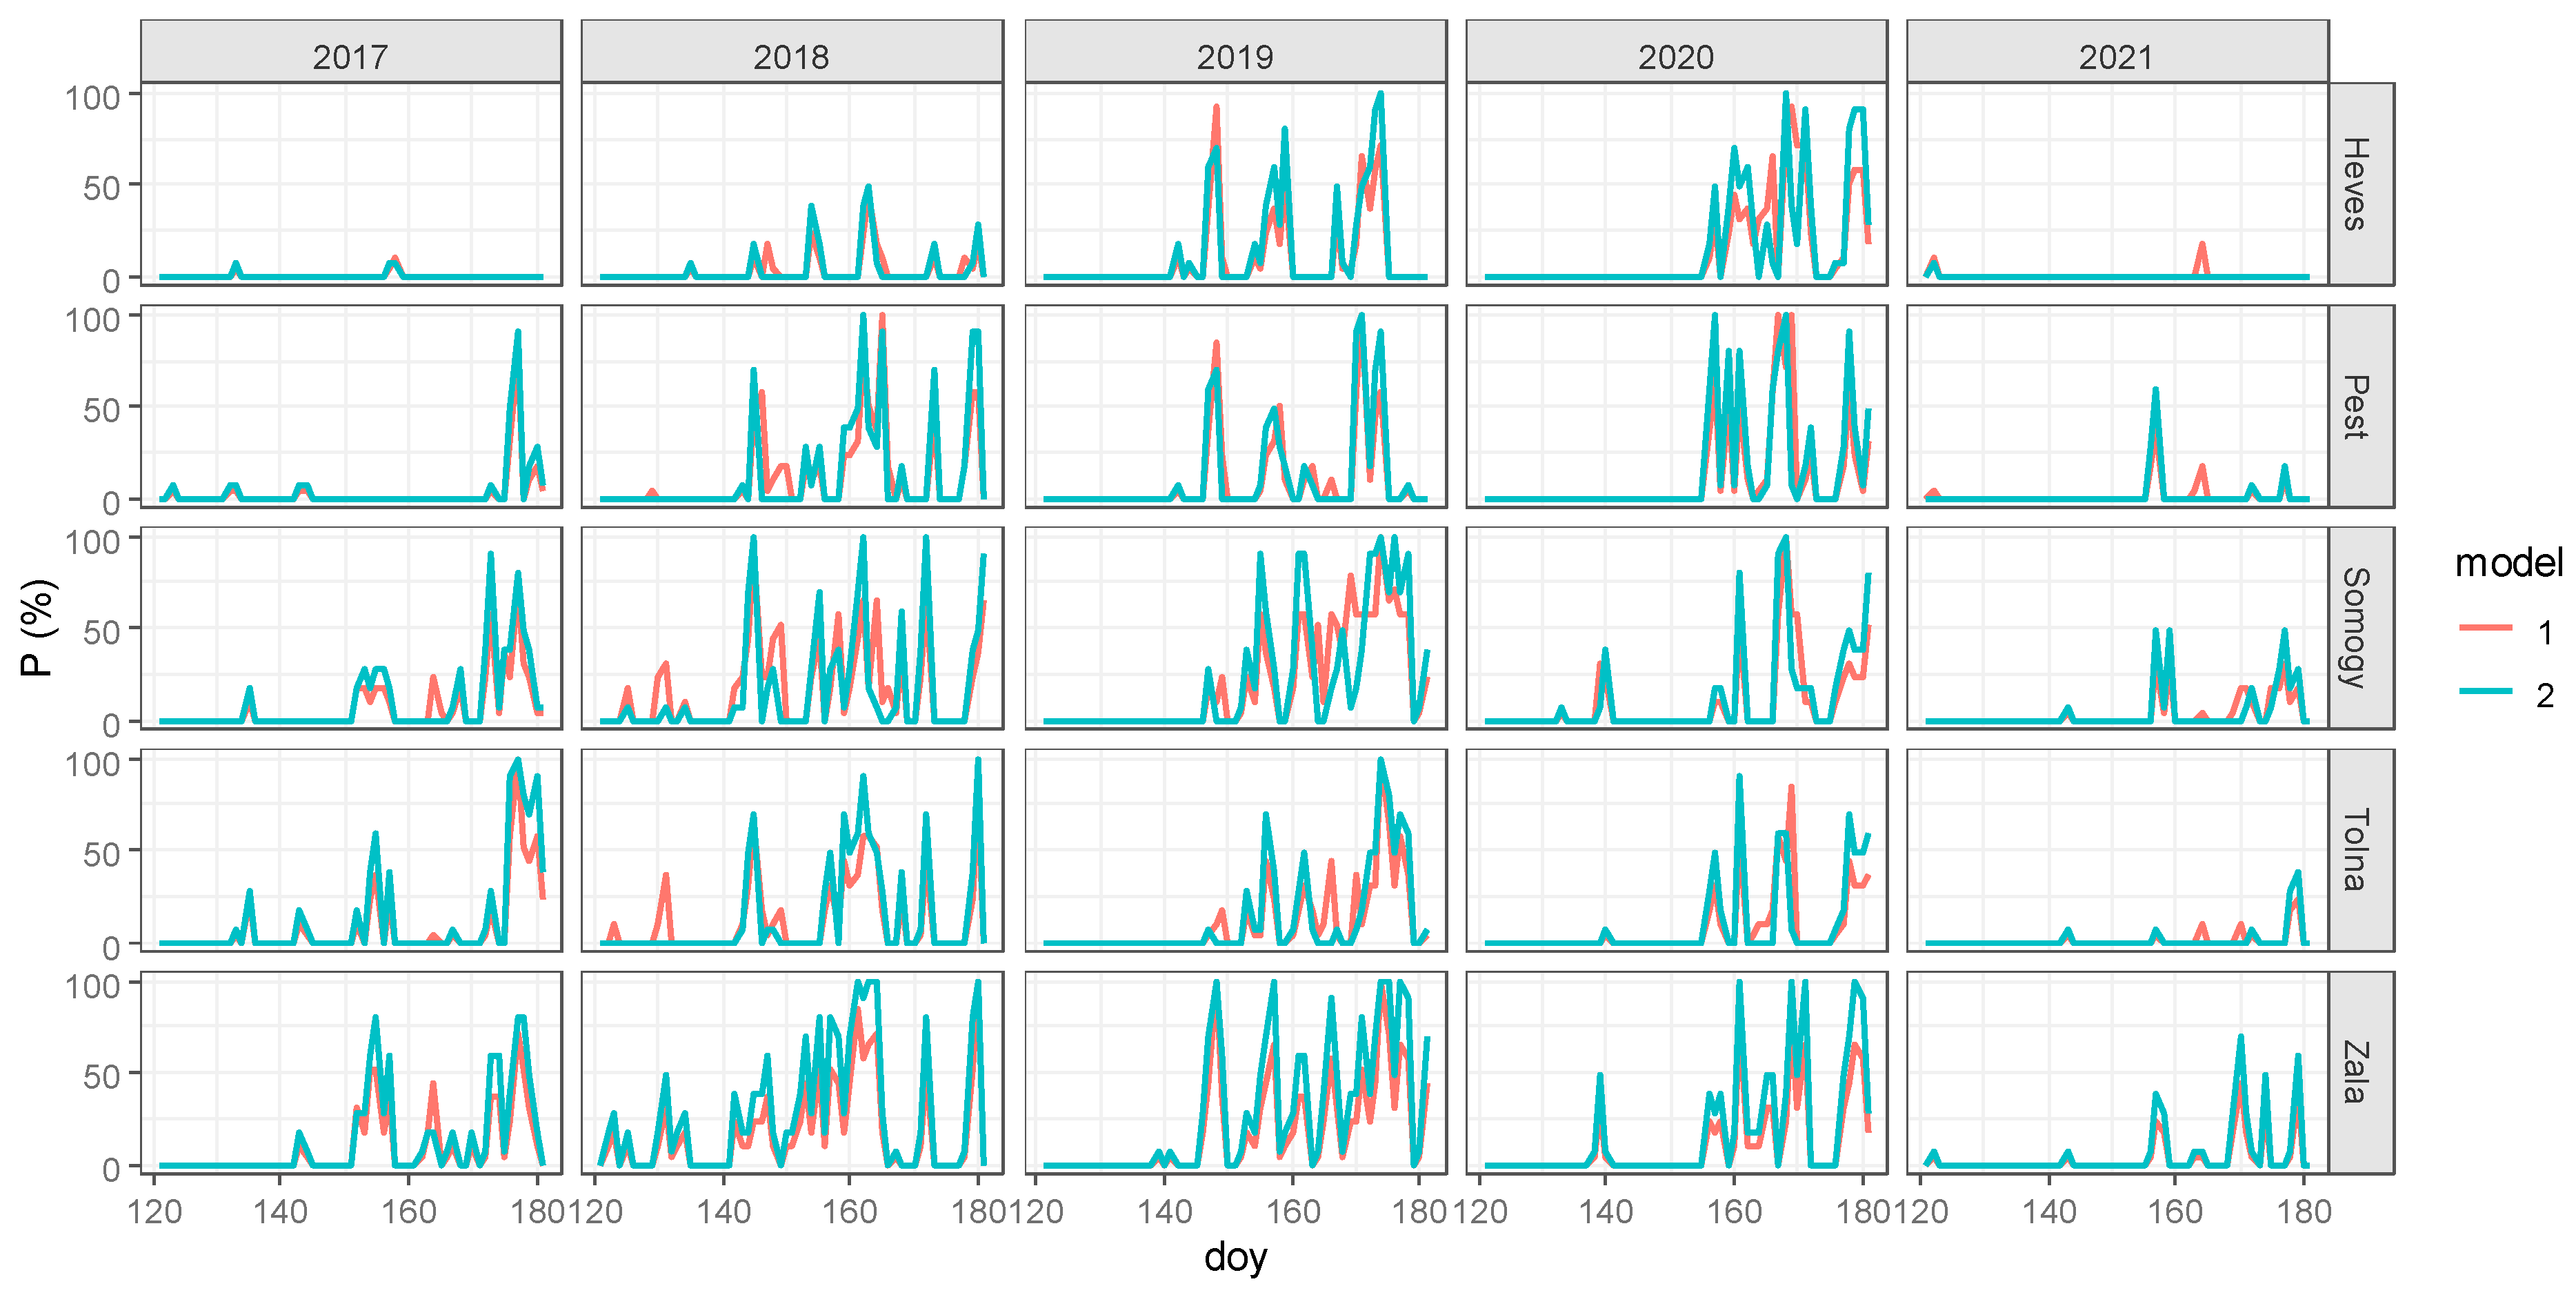
3.4. Assessment of FHB

The differences in epidemic pressure detected in the five studied sites might also be impacted by disparities in their weather. Complex ecological adaptations within Fusarium species have encouraged widespread epidemic distribution under different environmental conditions worldwide [33]. In forecasting FHB incidence in wheat, it is necessary to have an easily accessible and limited number of meteorological variables as model inputs. Ta and PR are the most frequently applied meteorological elements for this role. Summed results in previous investigations on FHB infections and meteorological elements were obtained by Shah et al. (2013) [55], who collected 380 weather-based predictors from the variables of air humidity (vapor pressure deficit, dewpoint depression, RH), Ta, PR, and pairwise interactions between Ta and RH or between RH and P. The timeframes of the above measurements ranged from hourly to daily meteorological data with different longevity rates in the pre- or post-anthesis period from 5 to 15 days. However, the timeframe for FHB probability projections based on meteorological data varied from 120 days before to 14 days after anthesis [28].
Across this study, eight of fifty months (May and June) were characterized by warm–wet monthly weather, among which only six months experienced FHB infections (Table 3). At the same time, the number of months with annual measured FHB outbreaks above 10% infection rates (bold numbers in Table 3) was doubled (12). Similarly, Turkington et al. (2016) [56] reported the existence of a pathogen–environment relationship in winter wheat FHB at nine sites across western Canada, totaling 26 environments over three growing seasons. Paul et al. (2007) [57] concluded that the earlier effect of Ta related to pathogen inoculum production may limit epidemics in the wet UK but not in continental Europe, where Hungary is located. According to previous observations [28, 30], to bridge the gap in analyzing the weather impacts on wheat FHB disease, more detailed (hourly) meteorological data are needed.
Each of the two models adopted from De Wolf et al. (2003) [30] was capable of estimating FHB epidemics. The seasonal mean P rates in model 1 ranged from 0.3% in Pest (2017) to 21.0% in Somogy (2019), while the model 2 projected P rates ranged from 0.4% in Heves (2019) to 27.8% in Zala (2019).
The number of days with FHB infection varied across the wheat-growing regions and seasons. Irrespective of the model, the most days with FHB infection (p > 10%; 34 out of 60), probably induced by heavy rains, were observed in Zala during 2018. In the same season, out of 60 days in May–June, the number of infected days ranged from 4 (Somogy, model 2) to 23 (Tolna, model 1). With the exception of Zala, over the warm and moderately dry season of 2021, infected days were limited to a few (2–4) or 0 days (in Somogy) (Figure 5). The five-season average number of infected days (model 1: 4 days; model 2: 1 day) was the lowest in Somogy across the study.
Comparing seasonal mean model performances with measured infection rates, model 1 produced closer results in Heves, Somogy, and Pest, while model 2 better estimated the infection rates in Zala and Tolna across the study period. The mean number of daily probability values above 10% is a good indicator of the FHB infection level (Figure 5). Regardless of the model, there was insufficient disease pressure, creating a high number of epidemic days with FHB > 10% in most of the counties during 2021 (a cool May across Hungary). This remained the case in the northern regions during 2017. Both models displayed a high number of infected days in 2018 and 2019.
The seasonal P rates of the models were close to those of the seasonal measured ones, ranging from 2.5% to 30.2% for the investigation period. The model 1 and 2 epidemic performances were compared with the measured infection P rates using the difference in predicted against measured P rates from the 1:1 line through the origin (Figure 6). Based on the circle positions, the two model prediction accuracies differed. In model 1, more circles positioned above the 1:1 line represented an underestimation of infection rates compared to the measured data. More circles below the 1:1 line suggested an overestimation of FHB infections in model 2. The prediction accuracy of model 2, which measured Ta and RH with variable interactions, was higher than that of model 1, which used the interaction term. The values of projected infection rates were, on average, 70.4% and 93.2% of the measured epidemic for models 1 and 2, respectively.
The highest differences between the measured and projected infection rates occurred in Zala (model 1) and Heves (model 2). The comparison of the seasonal mean measured with projected infection rates indicated that the errors were mostly false negatives in Tolna and Heves. False positive errors dominated the remaining three counties, with only a few exceptions in each county. Out of twenty-five model outputs, there were six (from model 1) and two (from model 2) in which the deviation slightly exceeded 10%. During the warm and dry season of 2021, with the exception of Zala, the projection errors were false negatives. In the remaining four study seasons, the differences in measured and projected data were variable (signs).
Model 2 outperformed model 1, as confirmed by the RMSE and MAE values (RMSE1 = 6.45; RMSE2 = 5.58; MAE1 = 4.99; MAE2 = 4.61). Model 2 was particularly outstanding in estimating a high infection rate (Figure 7).
The Pearson correlations between residuals and estimated data were small and non-significant (model 1: R = −0.16; p = 0.44, model 2: R = −0.33; p = 0.10). This confirms the applicability of the models in the region examined. It is striking that both models overestimate low infection rates and underestimate high ones (Figure 7). This suggests that reformulating the models in nonlinear forms may improve their accuracy.
Across all counties, the seasonal mean FHB infection rates (x) did not exhibit a significant decrease in wheat yield (y) (y = −13.762x + 5730.1, R2 = 0.0473, p = 0.296, RMSE = 581.56; figure not shown), although the negative slope of regression suggested a 13.76 kg ha−1 decline in the average yield for one % increase in the seasonal mean FHB infection rate. Earlier studies also revealed that it was not so much the yield as the quality that may be impacted during FHB infection due to the disease’s polycyclic nature in wheat [58,59].

4. Conclusions

In northern counties with a slightly cooler seasonal mean Ta and intensely cold winters, a five-season average loss of 0.87 t ha−1 in wheat yield was observed compared to provinces in southern counties. The warm winters in 2020 and 2021 were the most favorable for wheat production in the south and north. The ranking of the counties’ FHB infection rates (Zala > Tolna > Somogy > Pest > Heves) was consistent across the investigation period. The lowest infection rates occurred during the coolest seasons, regardless of province. Hourly weather variables (combination of Ta 15 ≤ Ta ≤ 30 °C and RH ≥ 90%) (model 1) and the use of the special interaction term (model 2) for the entire pre- and post-anthesis period accounted for 70.4% and 93.2% of the overall variance in models 1 and 2, respectively. The weather-based projection of FHB probability benefited from both regression models with varying accuracy. Of the model outputs, there were six false negative projections in model 1 and two in model 2. The best model performances were observed in Pest and Somogy (the differences in the measured and projected seasonal mean infection P rates were below ±10%). In three out of the five counties, the differences in the measured and calculated seasonal mean P rates exceeded 10% only a couple of times.
This work was limited to five wheat-growing seasons only, without representing all possible weather conditions. Further extended investigations are necessary to build and validate new models contributing long-term meteorological and crop datasets.

Author Contributions

Conceptualization, AA. and L.M.; methodology, L.M. and B.S.-G.; software, L.M. and G.S.; validation, A.A. and G.S.; formal analysis, S.S. and L.M.; investigation, B.S.-G.; data curation, B.S.-G. and S.S.; writing—original draft preparation, A.A.; writing—review and editing, A.A. All authors have read and agreed to the published version of the manuscript.

Funding

This research was funded by the Ministry of Innovation and Technology within the framework of the Thematic Excellence Programme 2021, National Defense, National Security Subprogramme (TKP2021-NVA-22).

Institutional Review Board Statement

Not applicable.

Data Availability Statement

The raw data supporting the conclusions of this article will be made available by the authors upon request.

Acknowledgments

We acknowledge our debt to the NÉBIH for their kindness in supplying us with five counties’ annual mean infection data in winter wheat.

Conflicts of Interest

The funders had no role in the design of the study; in the collection, analyses, or interpretation of data; in the writing of the manuscript; or in the decision to publish the results.

References

  1. De Wolf, E.D.; Madden, L.V.; Lipps, P.E. Risk assessment models for wheat fusarium head blight epidemics based on within-season weather data. Phytopathology 2003, 93, 428–435. [Google Scholar] [CrossRef]
  2. Zaji, A.; Liu, Z.; Xiao, G.; Bhowmik, P.; Sangha, J.S.; Ruan, Y. Wheat spike localization and counting via hybrid UNet architectures. Comput. Electron. Agric. 2022, 203, 107439. [Google Scholar] [CrossRef]
  3. Bao, W.; Yang, X.; Liang, D.; Hu, G.; Yang, X. Lightweight convolutional neural network model for field wheat ear disease identification. Comput. Electron. Agric. 2021, 189, 106367. [Google Scholar] [CrossRef]
  4. FAOSTAT (Food and Agriculture Organization Statistics). Agricultural Data: Production and Indices Data Crop Primary. 2018. Available online: http://www.fao.org/faostat/en/#data/QC/visualize (accessed on 1 January 2023). (In Hungarian).
  5. KSH. 2023. Available online: https://www.ksh.hu/stadat_files/mez/hu/mez0071.html (accessed on 1 January 2023). (In Hungarian).
  6. Huang, L.; Wu, K.; Huang, W.; Dong, Y.; Ma, H.; Liu, Y.; Liu, L. Detection of Fusarium head blight in wheat ears using continuous wavelet analysis and PSO-SVM. Agriculture 2021, 11, 998. [Google Scholar] [CrossRef]
  7. McMullen, M.; Bergstrom, G.; De Wolf, E.; Dill-Macky, R.; Hershman, D.; Shaner, G.; Van Sanford, D. A unified effort to fight an enemy of wheat and barley: Fusarium head blight. Plant Dis. 2012, 96, 1712–1728. [Google Scholar] [CrossRef]
  8. Mesterházy, A.; Bartók, T.; Kászonyi, G.; Varga, M.; Tóth, B.; Varga, J. Common resistance to different Fusarium spp. causing Fusarium head blight in wheat. Eur. J. Plant Pathol. 2005, 112, 267–281. [Google Scholar] [CrossRef]
  9. Zhang, D.Y.; Luo, H.S.; Wang, D.Y.; Zhou, X.G.; Li, W.F.; Gu, C.-Y.; Zhang, G.; He, F.M. Assessment of the levels of damage caused by Fusarium head blight in wheat using an improved YoloV5 method. Comput. Electron. Agric. 2022, 198, 107086. [Google Scholar] [CrossRef]
  10. Mengesha, G.G.; Abebe, S.M.; Mekonnen, A.A.; Esho, A.G./M.; Lera, Z.T.; Shertore, M.M.; Fedilu, K.B.; Tadesse, Y.B.; Tsakamo, Y.T.; Issa, B.T.; et al. Effects of cultivar resistances and chemical seed treatments on fusarium head blight and bread wheat yield-related parameters under field condition in southern Ethiopia. Heliyon 2023, 24, e08659. [Google Scholar] [CrossRef]
  11. Spolti, P.; Del Ponte, E.M.; Dong, Y.; Cummings, J.A.; Bergstrom, G.C. Triazole Sensitivity in a Contemporary Population of Fusarium graminearum from New York Wheat and Competitiveness of a Tebuconazole-Resistant Isolate. Plant Dis. 2014, 98, 607–613. [Google Scholar] [CrossRef] [PubMed]
  12. Dill-Macky, R. Fusarium Head Blight (Scab). In Compendium of Wheat Diseases and Pests; APS Press: St. Paul, MN, USA, 2010; pp. 34–36. [Google Scholar]
  13. Xu, X.-M.; Monger, W.; Ritieni, A.; Nicholson, P. Effect of temperature and duration of wetness during initial infection periods on disease development. fungal biomass and mycotoxin concentrations on wheat inoculated with single. or combinations of. Fusarium species. Plant Pathol. 2007, 56, 943–956. [Google Scholar] [CrossRef]
  14. Madgwick, J.W.; West, J.S.; White, R.P.; Semenov, M.A.; Townsend, J.A.; Turner, J.A.; Fitt, B.D.L. Impacts of climate change on wheat anthesis and fusarium ear blight in the UK. Eur. J. Plant Pathol. 2011, 130, 117–131. [Google Scholar] [CrossRef]
  15. Vaughan, M.; Backhouse, D.; Ponte, E.D. Climate change impacts on the ecology of Fusarium graminearum species complex and susceptibility of wheat to Fusarium head blight: A review. World Mycotoxin J. 2016, 9, 685–700. [Google Scholar] [CrossRef]
  16. Ayers, J.E.; Pennypacker, S.P.; Nelson, P.E.; Penny-packer, P.W. Environmental factors associated with airborne ascospores of Gibberelia zeae in corn and wheat fields. Phytopathology 1975, 65, 835. [Google Scholar]
  17. Sutton, J.C. Epidemiolograin yield of wheat head blight and maize ear rot caused by Fusarium graminearum. Can. J. Plant. Pathol. 1982, 4, 195–209. [Google Scholar] [CrossRef]
  18. Shah, D.; De Wolf, E.; Paul, P.; Madden, L. Functional data analysis of weather variables linked to Fusarium head blight epidemics in the United States. Phytopathology 2019, 109, 96–110. [Google Scholar] [CrossRef]
  19. Bondalapati, K.D.; Stein, J.M.; Neate, S.M.; Halley, S.H.; Osborne, L.E.; Hollingsworth, C.R. Development of weather-based predictive models for Fusarium head blight and deoxynivalenol accumulation for spring malting barley. Plant Dis. 2012, 96, 673–680. [Google Scholar] [CrossRef]
  20. Schaafsma, A.W.; Hooker, D.C. Climatic models to predict occurrence of Fusarium toxins in wheat and maize. Int. J. Food Microbiol. 2007, 119, 116–125. [Google Scholar] [CrossRef]
  21. Birr, T.; Verreet, J.A.; Klink, H. Prediction of deoxynivalenol and zearalenone in winter wheat grain in a maize-free crop rotation based on cultivar susceptibility and meteorological factors. J. Plant. Dis. Protect. 2019, 126, 13–27. [Google Scholar] [CrossRef]
  22. Rossi, V.; Giosue, S.; Pattori, E.; Spanna, F.; Del Vecchio, A. A model estimating the risk of Fusarium head blight on wheat. EPPO Bulletin. 2003, 33, 421–425. [Google Scholar] [CrossRef]
  23. Anda, A.; Simon, S.; Simon-Gáspár, B. Impacts of wintertime meteorological variables on decomposition of Phragmites australis and Solidago canadensis in the Balaton System. Theor. Appl. Climatol. 2023, 151, 1963–1979. [Google Scholar] [CrossRef]
  24. Kocsis, T.; Kovács-Székely, I.; Anda, A. Homogeneity tests and non-parametric analyses of tendencies in precipitation time series in Keszthely; Western Hungary. Theor. Appl. Climatol. 2020, 139, 849–859. [Google Scholar] [CrossRef]
  25. Hay, W.T.; McCormick, S.P.; Vaughan, M.M. Effects of atmospheric CO2 and temperature on wheat and corn susceptibility to Fusarium graminearum and deoxynivalenol contamination. Plants 2021, 12, 2582. [Google Scholar] [CrossRef] [PubMed]
  26. Garrett, K.A.; Dendy, S.P.; Frank, E.E.; Rouse, M.N.; Travers, S.E. Climate change effects on plant disease: Genomes to ecosystems. Annu. Rev. Phytopathol. 2006, 44, 489–509. [Google Scholar] [CrossRef] [PubMed]
  27. Matengu, T.T.; Bullock, P.R.; Mkhabela, M.S.; Zvomuya, F.; Henriquez, M.A.; Ojo, R.E.; Fernando, D.W.G. Weather-based models for forecasting Fusarium head blight risks in wheat and barley: A review. Plant Pathol. 2023, 73, 492–505. [Google Scholar] [CrossRef]
  28. Nuttall, J.G.; O’Leary, G.J.; Panozzo, J.F.; Walker, C.K.; Barlow, K.M.; Fitzgerald, G.J. Models of grain quality in wheat—A review. Field Crops Res. 2017, 202, 136–145. [Google Scholar] [CrossRef]
  29. Regulation in Evaluation of Certain Food Additives with Sampling and Analytical Prescriptions. (In Hungarian: Rendelet az élelmiszerek mikotoxin-tartalmának hatósági ellenőrzéséhez használandó mintavételi és elemzési módszerek megállapításáról). 2006; NÉBIH, Budapest (Hungary). Available online: https://portal.nebih.gov.hu/documents/10182/21384/Fuzarium+t%C3%A1j%C3%A9koztat%C3%B3.pdf/f1a6858e-77f3-4bf0-a3a3-f42a5797bad4 (accessed on 1 January 2023).
  30. WHO Technical Report Series 966. Evaluation of Certain Food Additives, Seventy-fourth report of the Joint FAO/WHO Expert Committe on Food Additives, Fumonisins. 2011. Available online: http://www.inchem.org/documents/jecfa/jecmono/v966je01.pdf (accessed on 1 January 2023).
  31. Madden, L.V.; Hughes, G.; van den Bosch, F. Temporal Analysis I Quantifying and Comparing Epidemics. In The Study of Plant Disease Epidemics; The American Phytopathological Society: St. Paul, MN, USA, 2017; pp. 63–116. [Google Scholar]
  32. Landschoot, S.; Waegeman, W.; Audenaert, K.; Van Damme, P.; Vandepitte, J.; De Baets, B.; Haesaert, G. A field-specific web tool for the prediction of fusarium head blight and deoxynivalenol content in Belgium. Comput. Electron. Agr. 2013, 93, 140–148. [Google Scholar] [CrossRef]
  33. Giroux, M.-E.; Bourgeois, G.; Dion, Y.; Rioux, S.; Pageau, D.; Zoghlami, S.; Parent, C.; Vachon, E.; Vanasse, A. Evaluation of forecasting models for Fusarium head blight of wheat under growing conditions of Quebec, Canada. Plant Dis. 2016, 100, 1192–1201. [Google Scholar] [CrossRef] [PubMed]
  34. Wickham, H. ggplot2: Elegant Graphics for Data Analysis; Springer: New York, NY, USA, 2016. [Google Scholar]
  35. R Core Team. R: A Language and Environment for Statistical Computing; R Foundation for Statistical Computing: Vienna, Austria, 2023; Available online: https://www.R-project.org/ (accessed on 1 January 2023).
  36. Maaz, T.M.; Sapkota, T.B.; Eagle, A.J.; Kantar, M.B.; Bruulsema, T.W.; Majumdar, K. Meta-analysis of yield and nitrous oxide outcomes for nitrogen management in agriculture. Glob. Chang. Biol. 2021, 27, 2343–2360. [Google Scholar] [CrossRef] [PubMed]
  37. Asseng, S.; Martre, P.; Maiorano, A.; Rötter, R.P.; O’Leary, G.J.; Fitzgerald, G.J.; Girousse, C.; Motzo, R.; Giunta, F.; Babar, M.A.; et al. Climate change impact and adaptation for wheat protein. Glob. Chang. Biol. 2019, 25, 155–173. [Google Scholar] [CrossRef]
  38. Li, Y.B.; Hou, R.X.; Tao, F.L. Interactive effects of different warming levels and tillage managements on winter wheat growth. physiological processes. grain yield and quality in the North China Plain. Agric. Ecosyst. Environ. 2020, 295, 106923. [Google Scholar]
  39. Bai, H.Z.; Xiao, D.P.; Wang, B.; Liu, D.L.; Tang, J.Z. Simulation of wheat response to future climate change based on coupled model inter-comparison project phase 6 multi-model Ensemble projections in the North China plain. Front. Plant Sci. 2022, 13, 829580. [Google Scholar] [CrossRef] [PubMed]
  40. Wang, Y.; Peng, Y.; Lin, J.; Wang, L.; Jia, Z.; Zhang, R. Optimal nitrogen management to achieve high wheat grain yield, grain protein content, and water productivity: A meta-analysis. Agric. Water Manag. 2023; 290, 108587. [Google Scholar]
  41. Burton, A.; Häner, L.L.; Schaad, N.; Strebel, S.; Vuille-dit-Bille, N.; Bongiovani, P.F.; Holzkämper, A.; Pellet, D.; Herrera, J.M. Evaluating nitrogen fertilization strategies to optimize yield and grain nitrogen content in top winter wheat varieties across Switzerland. Field Crops Res. 2024, 307, 109251. [Google Scholar] [CrossRef]
  42. Rogger, J.; Hund, A.; Fossati, D.; Holzkämper, A. Can Swiss wheat varieties escape future heat stress? Eur. J. Agron. 2021, 131, 126394. [Google Scholar] [CrossRef]
  43. Giordano, N.; Sadras, V.O.; Lollato, R.P. Late-season nitrogen application increases grain protein concentration and is neutral for yield in wheat. A global meta-analysis. Field Crops Res. 2023, 290, 108740. [Google Scholar] [CrossRef]
  44. Prerostova, S.; Vankova, R. Phytohormone-Mediated Regulation of Heat Stress Response in Plants. In Plant Hormones and Climate Change; Ahammed, G.J., Yu, J., Eds.; Springer: Singapore, 2023. [Google Scholar]
  45. Zhang, D.; Liu, J.; Li, D.; Batchelor, W.D.; Wu, D.; Zhen, X.; Ju, H. Future climate change impacts on wheat grain yield and protein in the North China Region. Sci. Total Environ. 2023, 902, 166147. [Google Scholar] [CrossRef] [PubMed]
  46. Hasheminasab, K.S.; Shahbazi, K.; Marzi, M.; Zare, A.; Yeganeh, M.; Bazargan, K.; Kharazmi, R. A study on wheat grain zinc. iron. copper. and manganese concentrations and their relationship with grain yield in major wheat production areas of Iran. J. Agric. Food Res. 2023, 14, 100913. [Google Scholar] [CrossRef]
  47. Belizán, M.M.; Gomez, A.D.L.A.; Baptista, Z.P.T.; Jimenez, C.M.; Matías, M.D.H.S.; Catalán, C.A.; Sampietro, D.A. Sampietro Influence of water activity and temperature on growth and production of trichothecenes by Fusarium graminearum sensu stricto and related species in maize grains. Int. J. Food Microbiol. 2019, 305, 108242. [Google Scholar] [CrossRef]
  48. David, R.F.; Bozorg Magham, A.E.; Schmale, D.G.; Ross, S.D.; Marr, L.C. Identification of meteorological predictors of Fusarium graminearum ascospore release using correlation and causality analyses. Eur. J. Plant Pathol. 2016, 145, 483–492. [Google Scholar] [CrossRef]
  49. Gilbert, J.; Tekauz, A. Review: Recent developments in research of fusarium head blight in Canada. Can. J. Plant Pathol. 2000, 22, 1–8. [Google Scholar] [CrossRef]
  50. Song, Y.; Hans, W.L.; Wang, C.; Tian, J.; Huo, Z.; Gao, P.; Song, Y.; Guo, A. The influence of excess precipitation on winter wheat under climate change in China from 1961 to 2017. Sci. Total Environ. 2017, 690, 189–196. [Google Scholar] [CrossRef]
  51. Zhu, Y.; Xi, J.; Yao, Y.; Xu, H.; Tang, C.; Wu, L. Characterizing the dynamic linkages between environmental changes and wheat Fusarium head blight epidemics. Ecol. Inform. 2024, 80, 102524. [Google Scholar] [CrossRef]
  52. Shah, D.A.; Molineros, J.E.; Paul, P.A.; Willyerd, K.T.; Madden, L.V.; De Wolf, E.D. Predicting Fusarium head blight epidemics with weather-driven pre- and post-anthesis logistic regression models. Phytopathology 2013, 103, 906–919. [Google Scholar] [CrossRef] [PubMed]
  53. Lobell, D.B.; Burke, M.B. On the use of statistical models to predict crop yield responses to climate change. Agric. Forest Meteorol. 2010, 150, 1443–1452. [Google Scholar] [CrossRef]
  54. Turkington, T.K.; Beres, B.L.; Kutcher, H.R.; Irvine, B.; Johnson, E.N.; O’Donovan, J.T.; Harker, K.N.; Holzapfel, C.B.; Mohr, R.; Peng, G.; et al. Winter Wheat Yields Are Increased by Seed Treatment and Fall-Applied Fungicide. Agron. J. 2016, 108, 1379–1389. [Google Scholar] [CrossRef]
  55. Paul, P.A.; Lipps, P.E.; De Wolf, E.; Shaner, G.; Buechley, G.; Adhikari, T.; Ali, S.; Stein, J.; Osborne, L.; Madden, L.V. A distributed lag analysis of the relationship between Gibberella zeae inoculum density on wheat spikes and weather variables. Phytopathology 2007, 97, 1608–1624. [Google Scholar] [CrossRef] [PubMed]
  56. Xiao, Y.X.; Dong, Y.Y.; Huang, W.J.; Liu, L.Y. Regional prediction of Fusarium head blight occurrence in wheat with remote sensing based Susceptible Exposed-Infectious-Removed model. Int. J. Appl. Earth Obs. Geoinf. 2022, 114, 103043. [Google Scholar] [CrossRef]
  57. Zhang, H.; Zhao, J.; Huang, L.; Huang, W.; Dong, Y.; Ma, H.; Ruan, C. Development of new indices and use of CARS-Ridge algorithm for wheat fusarium head blight detection using in-situ hyperspectral data. Biosyst. Eng. 2024, 237, 13–25. [Google Scholar] [CrossRef]
  58. Tschanz, A.T.; Horst, R.K.; Nelson, P.E. The effect of environment on sexual reproduction of Gibberella zeae. Mycologia 1976, 68, 327–340. [Google Scholar] [CrossRef]
  59. Kocsis, T.; Pongrácz, R.; Hatvani, I.G.; Magyar, N.; Anda, A.; Kovács-Székely, I. Seasonal trends in the Early Twentieth Century Warming (ETCW) in a centennial instrumental temperature record from Central Europe. Hung. Geogr. Bull. 2024, 73, 3–16. [Google Scholar] [CrossRef]
Figure 1. Five studied counties (Heves, Pest, Somogy, Tolna, and Zala in red) in the wheat production regions of the MATE (Hungarian University of Agriculture and Life Sciences, Gödöllő) with five-season mean yield classes ranging from 4.92 to 6.1 t ha−1. Meteorological stations are highlighted in black. Schemes follow the same formatting.
Agriculture 14 01093 g001
Figure 2. Comparison of winter wheat grain yield in five counties (Hungary) between 2017 and 2021. Boxplot presents the range, the median, and the inter-quantile range.
Agriculture 14 01093 g002
Figure 3. Five-season average air temperatures from December to February between 2017 and 2021.
Agriculture 14 01093 g003
Figure 4. Comparison of measured Fusarium head blight infection rates (P%) in the winter wheat of five Hungarian counties during vegetation seasons between 2017 and 2021. Boxplot presents the range, the median, and the inter-quantile range.
Agriculture 14 01093 g004
Figure 5. Daily infection probabilities p < 10% in the two models (De Wolf et al., 2003, [1]) for five Hungarian counties in May and June (2017–2021).
Agriculture 14 01093 g005
Figure 6. Comparison of seasonal mean measured annual infection rates, Me%, and the simulated counterparts, Mo%, for (a) model 1 and (b) model 2 by De Wolf et al. (2003) [1]. Solid line is the 1:1 line.
Agriculture 14 01093 g006
Figure 7. Correlation between residuals and measured data.
Agriculture 14 01093 g007
Table 1. Winter wheat grain yield and growing areas for five studied counties (Heves, Pest, Somogy, Tolna, and Zala) in the MATE production area from 2017 to 2021.
County/YearZalaHevesTolnaSomogyPest
Grain yield (kg ha−1)
201755005140651055404960
201851304760588053904770
201957905440592059704740
202064104980619063204580
202163205670598061605570
Mean yield (kg/ha)58305198609658764924
SD±542.44±361.97±260.44±398.66±385.53
CV (%)9.306.964.246.787.83
Wheat-growing area (ha)
201728,03043,38050,69358,67253,993
201830,68242,98751,50657,86457,723
201929,55644,17249,16355,07857,286
202026,40344,34147,26649,00344,610
202124,86235,58047,07253,26741,013
Table 2. Monthly mean air temperatures, Ta °C, and monthly precipitation sums, PR mm, with their five-season means ± SD in five Hungarian counties during the winter wheat-growing periods (from October to June) between 2017 and 2021.
Mean Air Temperatures, Ta (°C)
Zala CountyOctoberNovemberDecemberJanuaryFebruaryMarchAprilMayJune
2016/20179.85.1−0.4−4.62.99.310.816.621.2
2017/201810.85.62.73.4−0.33.715.318.920.5
2018/201912.87.31.80.33.78.4121322.8
2019/202012.694.30.66.67.211.814.419.2
2020/202111.55.83.32.12.85.99.11422.1
Five-season mean Ta ± SD 8.8 ± 0.6
Tolna County
2016/20179.45−0.5−5.23.19.510.816.621.5
2017/201811.55.93.33.7−0.13.515.819.320.6
2018/2019136.71.4−0.23.98.7121322.5
2019/202012.38.23.6−0.55.96.71214.519.5
2020/202111.75.43.123.25.78.813.922.1
Five-season mean Ta ± SD 8.7 ± 0.6
Heves County
2016/201794.7−1.9−6.11.9910.416.321
2017/201810.95.31.52.2−0.43.11619.320.4
2018/201913.37.30.2−1.43.68.61313.922.9
2019/2020139.22.4−1.44.8712.11419.6
2020/202111.44.23.40.41.75.28.31422.1
Five-season mean Ta ± SD 8.3 ± 0.8
Pest County
2016/20179.34.6−0.7−61.99.110.516.621.7
2017/201811.65.52.12−0.52.91619.420.6
2018/201913.76.70.5−13.98.912.713.923.0
2019/202013.28.32.7−15.2712.314.519.8
2020/202111.64.93.11.22.35.98.713.922.6
Five-season mean Ta ± SD 8.6 ± 0.7
Somogy County
2016/20179.96.1−0.6−54.39.410.916.722.1
2017/201811.26.53.84.60.24.415.71920.7
2018/201912.86.920.64.291213.422.8
2019/202012.98.84.50.177.311.914.820.0
2020/202112.7642.84.16.19.314.422.1
Five-season mean Ta ± SD 9.2 ± 0.6
Precipitation, PR (mm)
Zala CountyOctoberNovemberDecemberJanuaryFebruaryMarchAprilMayJune
2016/201797.850.9425.844.615.320.938.861.1
2017/20186661.872.112.953.495.213.468.1101.2
2018/201923.442.811.328.217.212.828.7128.850.4
2019/202025.2118.690.513.230.818.627.232.793
2020/2021102.311.563.722.6198.527.592.53
Five-season PR mean ± SD 409.5 ± 86.7
Tolna County
2016/20176340.10.717.645.216.739.74886.8
2017/201877.547.158.313.658.3101.210.421.3118.6
2018/201911.134.915.222.918.612.945.6127.949.1
2019/2020289173.720.636.338.31534.1108.6
2020/202184.77.141.516.729.712.63291.114
Five-season PR mean ± SD 395.5 ± 77.2
Heves County
2016/201766.348.70.432.831.89.676.279.9117.5
2017/201846.243.844.818.253.951.832.843.886.6
2018/20193045.536.818.47.15.340.8112.3131.5
2019/202015.8103.248.515.728.134.37.619.1151.0
2020/2021146.229.242.540.152.56.856.37821.4
Five-season PR mean ± SD 441.8 ± 24.3
Pest County
2016/201758.745.32.230.133.933.366.970.539.5
2017/201872.647.637.321.666.968.916.127.9121.9
2018/20191453.426.7217.27.430.9192.333.4
2019/20208.178.654.614.728.236.55.716.4144.2
2020/2021102.221.137.115.135.36.732.374.822.2
Five-season PR mean ± SD 396.3 ± 50.1
Somogy County
2016/201763.263.60.618.754.618.434.678.568.6
2017/201881.756.581.229.868.9121.615.569.1125.6
2018/201915.636.312.427.114.318.262.7130.574.1
2019/202024.2106.762.717.131.522.219.939.252.8
2020/2021106.26.449.329.931.512.432.874.414.2
Five-season PR mean ± SD 435.1 ± 121.2
Table 3. Infection rates (%) in the growing seasons and weather classes in May and June for the studied counties related to Fusarium outbreaks. Growing seasons with outbreaks above 10% and infection rates are in bold. Abbreviations are as follows: H, A, N, and P5s are wet (P > P5s), dry (P < P5s), normal (P = P5s), and five-season monthly mean precipitation totals; while W, C, N, and Ta5 indicate warm (Ta > T5a), cool (Ta < T5a), normal (Ta = Ta5s), and five-season monthly average air temperatures. See also the details in Material and Methods. Five counties were included in the observation (Zala, Heves, Tolna, Somogy, and Pest).
Zala county
SeasonInfection rate%Ta °CP mmWeather classes
MayJuneMayJuneMayJune
201712.8WW *A *A *Warm–dryWarm–dry
201830.2W *WHH *Warm–wetWarm–wet
201925.7C *W *H *A *Cool–wetWarm–dry
202027.2C *CA *H *Cool–dryCool–wet
202112.6C *W *H *A *Cool–wetWarm–dry
Heves county
SeasonInfection rate%Ta °CP mmWeather classes
MayJuneMayJuneMayJune
20172.5WNH *H *Warm–wetNormal–wet
20185.3W *CA *AWarm–dryCool–dry
20194.4C *W *H *H *Cool–wetWarm–wet
20204.0C *CA *H *Cool–dryCool–wet
20213.5C *WH *A *Cool–wetWarm–dry
Tolna county
SeasonInfection rate%Ta °CP mmWeather classes
MayJuneMayJuneMayJune
20179.0WWA *H *Warm–dryWarm–wet
201813.7W *CA *H *Warm–dryCool–wet
201920.6C *W *H *A *Cool–wetWarm–dry
202015.5C *C *A *H *Cool–dryCool–wet
202111.7CWH *A *Cool–wetWarm–dry
Somogy county
SeasonInfection rate%Ta °CP mmWeather classes
MayJuneMayJuneMayJune
20175.1WWNHWarm–normWarm–wet
201813.1W *W *AH *Warm–dryWarm–wet
201916.4C *W *H *HCool–wetWarm–wet
20209.4C *C *A *A *Cool–dryCool–dry
20214.8C *CAA *Cool–dryCool–dry
Pest county
SeasonInfection rate%Ta °CP mmWeather classes
MayJuneMayJuneMayJune
20172.6W NA *A *Warm–dryNorm–dry
201810.4W *CA *H *Warm–dryCool–wet
20195.5C *W *H *A *Cool–wetWarm–dry
20208.1C *C *A *H *Cool–dryCool–wet
20213.6C *W *AA *Cool–dryWarm–dry
* Change in monthly mean of meteorological variables exceeded ±10% (PR) and ±1 °C (Ta).
Disclaimer/Publisher’s Note: The statements, opinions and data contained in all publications are solely those of the individual author(s) and contributor(s) and not of MDPI and/or the editor(s). MDPI and/or the editor(s) disclaim responsibility for any injury to people or property resulting from any ideas, methods, instructions or products referred to in the content.

