Article

Root Exudates Promoted Microbial Diversity in the Sugar Beet Rhizosphere for Organic Nitrogen Mineralization

1
Key Laboratory of Sugar Beet Genetics and Breeding, Heilongjiang Province Common College, College of Advanced Agriculture and Ecological Environment, Heilongjiang University, Harbin 150080, China
2
National Beet Medium-Term Gene Bank, Heilongjiang University, Harbin 150080, China
*
Author to whom correspondence should be addressed.
Agriculture 2024, 14(7), 1094; https://doi.org/10.3390/agriculture14071094
Submission received: 13 June 2024 / Revised: 1 July 2024 / Accepted: 4 July 2024 / Published: 7 July 2024
(This article belongs to the Special Issue Integrated Management and Efficient Use of Nutrients in Crop Systems)

Abstract

:
Rhizosphere environments play a vital role in the nutrient cycling of crops and soil organic nitrogen mineralization. Sugar beet is a highly nitrogen (N)-demanding crop, and it is necessary to explore the relationship between the sugar beet root exudates, the microbial community, and nitrogen utilization. In this study, a special separation method was employed to create rhizosphere (H3) and non-rhizosphere (H2 and H1) environments for sugar beet. After 50 d of cultivation in nearly inorganic-free soil, the microbial diversity and its correlation with root metabolites and N were examined. The results showed that in H3, the inorganic N content was over 23 times higher than in H1 and H2, with a 13.1% higher relative abundance of ammonia-oxidizing bacteria compared to H2 and a 32% higher abundance than H1. The relative abundance of nitrite-oxidizing bacteria was also 18.8% higher than in H1. Additionally, a significant positive correlation was observed between inorganic nitrogen content and serine (Ser) and isoleucine (Ile). The organic nitrogen content exhibited positive correlations with glycine (Gly), alanine (Ala), and tyrosine (Tyr) but displayed negative correlations with certain amino acids, organic acids, and glucose. The co-linearity network indicated that the microbial composition in H3 also exhibited higher node connectivity. It can be inferred that under the influence of sugar beet root exudates, the changes in the rhizosphere’s microbial diversity were more intricate, thereby benefiting soil nitrogen cycling and inorganic N accumulation. These findings provide profound insight into sugar beet soil organic nitrogen mineralization and contribute to the sustainable and environmentally friendly development of modern agriculture.

1. Introduction

Nitrogen is the primary limiting nutrient for plant growth in terrestrial ecosystems. Excessive fertilization can cause nitrogen to enter the environment through various pathways, leading to serious pollution problems within the ecosystem. The majority of the nitrogen in the soil exists in the form of organic nitrogen [1]. While plants can directly absorb some organic nitrogen from the soil, the absorption and utilization of nitrogen by plants primarily occur in the form of inorganic nitrogen, namely ammonium nitrogen (NH4+) and nitrate nitrogen (NO3) [2]. These processes rely on soil nitrogen mineralization to convert organic nitrogen into inorganic nitrogen [3]. Therefore, the rate of organic nitrogen mineralization serves as a key parameter in controlling ecosystem productivity [4].
The mineralization of soil organic nitrogen is a crucial process in the nitrogen cycle, influenced by both biochemical and physiological factors. Soil microorganisms play a major role in this process by decomposing soil organic matter through their metabolic activities [5]. These microorganisms break down organic nitrogen into inorganic nitrogen, which can be taken up and utilized by plants and other microorganisms [6]. Numerous studies have demonstrated that the potential availability of nitrogen for plant growth, provided by the soil, is closely related to the species, quantity, population dynamics, and functional roles of soil animals and microorganisms [7,8]. Guo et al. [9] found the microbial community of plants changes under different fertilization treatments. Their results demonstrate that long-term fertilization influences the microbial community. Microbes are the main players in soil biochemical processes, and their abundance, activity, and composition are often closely related to soil organic carbon mineralization processes. Thus, understanding the response of the microbial community in different soil types is crucial in understanding the impact of long-term fertilization on the ecosystem.
The rhizosphere is the interface where crops, soil, and microorganisms interact, serving as the primary pathway for nutrients, water, and other substances to enter plants from the soil. The rhizosphere’s effects usually lead to the release of a large amount of energy substances and available nutrients into the soil through root activities. This results in distinct nutrient cycling and microbial communities in rhizosphere soil compared to non-rhizosphere soil [10]. Roots release a significant amount of fixed carbon in the form of secretions and can also deposit polysaccharide mucus and boundary cells at the root crown [11], collectively known as root exudates [12]. Root exudates generally refer to the organic substances actively or passively released into the surrounding environment during root growth. These include low-molecular-weight compounds (organic acids, amino acids, soluble sugars, soluble proteins, polypeptides, plant hormones, etc.), high-molecular-weight compounds (root cap cells, mucilage substances, mucus, extracellular enzymes, etc.), and cell debris (root hairs, cell fragments, etc.). Root exudates serve as the main carbon and energy source for rhizosphere microorganisms, as well as providing information on and controlling determining factors for the interaction between plants, rhizosphere microorganisms, soil, and environmental factors [13]. Root exudates can be directly taken up into microbial cells, providing an ideal C source to support energy-intensive N transformations. Therefore, root exudates have the potential to stimulate SOM decomposition in relation to N acquisition or alter N fixation rates and ultimately control soil N availability [5]. For example, Meier et al. [14] found root exudates increase the gross N mineralization in both fertilized and unfertilized soils. The type and quantity of root exudates determine the composition of rhizosphere microorganisms. Specific root exudates can stimulate fungal spore germination, thereby influencing the distribution of beneficial or harmful microorganisms in the rhizosphere. Rhizosphere microorganisms actively participate in the interaction between roots and the soil and play a crucial role in plant growth. The intricate interactions among plant roots, soil, and microorganisms can be harnessed to facilitate sustainable agricultural development, potentially reducing fertilizers. However, the success of such strategies largely depends on an in-depth understanding of the rhizosphere environment [15,16,17].
Sugar beet, as an important biennial sugar crop, requires high levels of nutrients for its growth and development, especially N [18]. Meanwhile, sugar beet appears to be a nitrophilous plant, showing optimal performance with pure nitrate nitrogen, which can be attributed to the stable and efficient activities of nitrate reductase, glutamine synthetase, and glutamate dehydrogenase [19]. Different genotypes of sugar beet also exhibit varying organic nitrogen utilization efficiencies [20]. However, the specific microbial communities in the rhizosphere that promote organic nitrogen mineralization in sugar beet are still not well understood. In this study, a distribution gradient of root exudates was created along the surface of sugar beet roots using filter cloth. This allowed for the investigation of changes in the microbial community structure with variations in the rhizosphere environment. Additionally, this study aimed to compare the soil microbial communities between the rhizosphere and non-rhizosphere regions and observe the relationship between the rhizosphere environment, root exudates, and microorganisms involved in organic nitrogen mineralization. The findings of this study will contribute to efficient nitrogen utilization in sugar beet production.

2. Materials and Methods

2.1. Plant Material and Experimental Design

In this study, sugar beet variety KWS8138 (KWS, Einbeck, Germany) was used as the material. Through previous study, it was found that it can utilize organic nitrogen in the soil more effectively [20]. The soil used was collected from the top 10 cm of chernozem soil in Hulan, Harbin, China (45°59′46.84″ N, 126°38′1.62″ E). The organic matter, available nitrogen, phosphorus, and potassium; total nitrogen, phosphorus (P2O5), and potassium (K2O); and pH of the basic soil sample were determined according to Liu et al. [21]. It was soaked and washed with 0.01 mol/L of CaCl2 to remove inorganic nitrogen and a small amount of water-soluble organic nitrogen. The soil was then dried and sterilized at a high temperature and artificially rehydrated to approximately 18%.
As shown in Figure 1, a total of 1.8 kg of the as-prepared soil was put into a cylindrical container with a height of 25 cm and a diameter of 10 cm and a soil bulk density of 1.2 g/cm3. Two layers of 300-mesh filter cloth were used to separate the rhizosphere (H3) from the non-rhizosphere environments (H1 and H2). A total of 40 sugar beet seeds were sown on the soil surface, located 5 cm above the upper layer of filter cloth. Then, 2 cm of soil was placed over them. Capillary force was used to manage the water during the growth of the sugar beet seedlings. The experiment was replicated four times. The seedlings were cultured under a photoperiod of 10/14 h, with a light intensity of 200 µmol/(m2·s) and a temperature of 25/20 °C. The soil microorganisms, amino acids, organic acids, and sugar content were analyzed after 50 days of cultivation.

2.2. Soil Sampling and Determination of Soil Nitrogen, Amino Acids, Organic Acids, Soil Microbial Biomass, and Sugar Content

After cultivation, the tested soil samples were collected from the H1, H2, and H3, respectively. After removing roots and debris, the samples were divided into two sub-samples. One was for bacterial amplicon sequencing. The other was used for determination of the soil nitrogen, amino acids, organic acids, and sugar content. The air-dried soil samples were ground and sieved through a 100-mesh sieve cloth. Total soil nitrogen (TN) and total inorganic nitrogen (TIN) were determined according to Lu [22]. The acid digestion method [23] was employed to determine the acidolysis of the total organic nitrogen (AHON), ammonia nitrogen (AN), amino sugar nitrogen (ASN), and amino acid nitrogen (AAN) contents. The amino acid, organic acid, and sugar content were determined using high-performance liquid chromatography [24]. The amino acids analyzed include histidine (His), serine (Ser), arginine (Arg), glycine (Gly), aspartic acid (Asp), glutamic acid (Glu), threonine (Thr), alanine (Ala), proline (Pro), cysteine (Cys), lysine (Lys), tyrosine (Tyr), methionine (Met), valine (Val), isoleucine (Ile), leucine (Leu), and phenylalanine (Phe). The organic acids examined were formic acid and oxalic acid. The tested sugar was glucose.

2.3. Soil Bacterial Amplicon Extraction and Sequencing

Total genomic DNA of the H1, H2, and H3 soil samples was extracted using the CTAB/SDS method. The concentration and purity of the DNA were detected using 1% agarose gel. Amplification of the 16S V3-V4 variable region was performed using the general primers 515F (5′-GTGCCAGCMGCCGCGGTAA-3′) and 806R (5′-GGACTACHVGGGTWTCTAAT-3′). High-throughput sequencing of the 16S rRNA was performed by Novogene Co., Ltd. (Beijing, China).

2.4. Sequencing Data Processing

Based on the amplified 16S region, a paired-end sequencing approach was employed to construct short fragment libraries using the Illumina HiSeq sequencing platform. After filtering and merging the reads, Operational Taxonomic Units (OTUs) were clustered. Subsequently, species annotation and abundance analysis were performed.
Sequencing analysis was conducted using UPARSE software (UPARSE v7.0.1001, http://drive5.com/uparse/, accessed on 3 May 2023) [25]. Sequences sharing ≥97% similarity were grouped into the same OTUs. A representative sequence was selected from each OTU for further annotation. The taxonomic information on each representative sequence was annotated using the GreenGene database (https://greengenes.lbl.gov/Download/, accessed on 5 June 2023) [26] with the RDP 3 classifier (Version 2.2, http://sourceforge.net/projects/rdp-classifier/, accessed on 5 June 2023) [27] algorithm.

2.5. Data Analyses

The soil nitrogen, amino acid, sugar, and organic acid contents were analyzed using one-way analysis of variance (ANOVA) (p < 0.05) with the SPSS statistical software package (version SPSS 21.0). A heatmap was generated online (https://www.bioinformatics.com.cn, accessed on 3 July 2023).
Alpha diversity was calculated using QIIME software (Version 1.7.0) and displayed using R software (Version 2.15.3). Beta diversity, based on both weighted and unweighted UniFrac calculations, was also determined using QIIME software (Version 1.7.0). To examine and visualize the differences in the structure of the bacterial communities, displacement multivariate analysis of variance (PERMANOVA) and non-metric multidimensional scaling analysis (NMDS) were used. These techniques were employed to identify biomarkers associated with important microbial taxa. Taxa that could not be identified at any taxonomic level in the samples were collectively referred to as “Unidentified”, the taxa ranking after ten in relative abundance were combined and collectively referred to as “Others”, and the top 25 most abundant microbial species were referred to as “Dominant taxa”.
The co-occurrence network analysis was conducted using the WGCNA package in R, employing a Spearman’s correlation matrix. The OTU matrix underwent filtering based on abundance. OTUs with a minimum abundance below 13 were removed. The network was constructed using the igraph package. Only significant correlations (r > 0.7 and p < 0.05) were visualized using Gephi 0.9.2 (https://github.com/gephi/gephi, accessed on 8 July 2023). For the identification of species that significantly influenced the sample differentiation under different grouping conditions, the LEfSe (Lefse 2.0) analysis software (available at biomicroclass.com, accessed on 10 July 2023) was used. This software performs linear discriminant analysis (LDA) based on the taxonomic composition. To perform functional annotation of the bacterial gene sequences from the SILVA database, the FAPROTAX 1.1 package was employed for the 16S rRNA analysis.

3. Results

3.1. The Structure of the Soil Microbial Community

The basic soil contained 69,630 mg/kg of organic matter, 246.17 mg/kg of available nitrogen, 104.88 mg/kg of available phosphorus, 1303.73 mg/kg of available potassium, 3.02 g/kg of total nitrogen, 0.30% of total phosphorus (P2O5), 3.12% of total potassium (K2O), and a pH of 6.62. After 50 d of cultivation, the sugar beet rhizosphere soil samples were evaluated, yielding a total of 2,147,339 high-quality sequences after quality control.
Alpha diversity analysis, using the Shannon (Figure 2a) and ACE (Figure 2b) indices, revealed higher values in the H3 region compared to H1 and H2, suggesting greater species diversity in the microbial community of H3. The non-metric multidimensional scaling (NMDS) plot using the Bray–Curtis dissimilarity algorithm demonstrated distinct clustering of bacterial communities from different environments (Figure 2c). Specifically, H2 and H3 clustered closely together and were significantly separated from H1, illustrating the substantial impact of rhizosphere environment on the composition of bacterial communities.
A Venn diagram illustrated the overlap and unique operational taxonomic units (OTUs) among the different samples (Figure 2d). H1, H2, and H3 collectively shared 3016 OTUs, which accounted for 85.03% of the total OTUs. Among these, H3 exhibited the highest number of OTUs (3385), followed by H1 (3381) and H2 (3291). The number of unique OTUs among the samples did not differ significantly (H1, 24; H2, 7; H3, 20). The total number of shared OTUs between any two samples was 479.
At the phylum level of species composition (Figure 2e), Actinobacteriota, Proteobacteria, Acidobacteriota, Gemmatimonadetes, Chloroflexi, Planctomycetes, Bacteroidota, Firmicutes, and Verrucomicrobiota were identified as the dominant phyla in both the non-rhizosphere and rhizosphere bacterial communities. The relative abundance of non-dominant species (Others) in the soil microbial community showed little variation. This suggests that dominant species are more responsive to environmental changes compared to non-dominant species. Furthermore, analysis of the bacterial biomass across different regions revealed significant variations (Table 1). H3 exhibited 11% more bacterial biomass than H2 and 27% more than H1, indicating that the rhizosphere environment influences the types and quantities of microorganisms.

3.2. Effects of the Sugar Beet Rhizosphere on Bacterial Co-Occurrence Patterns

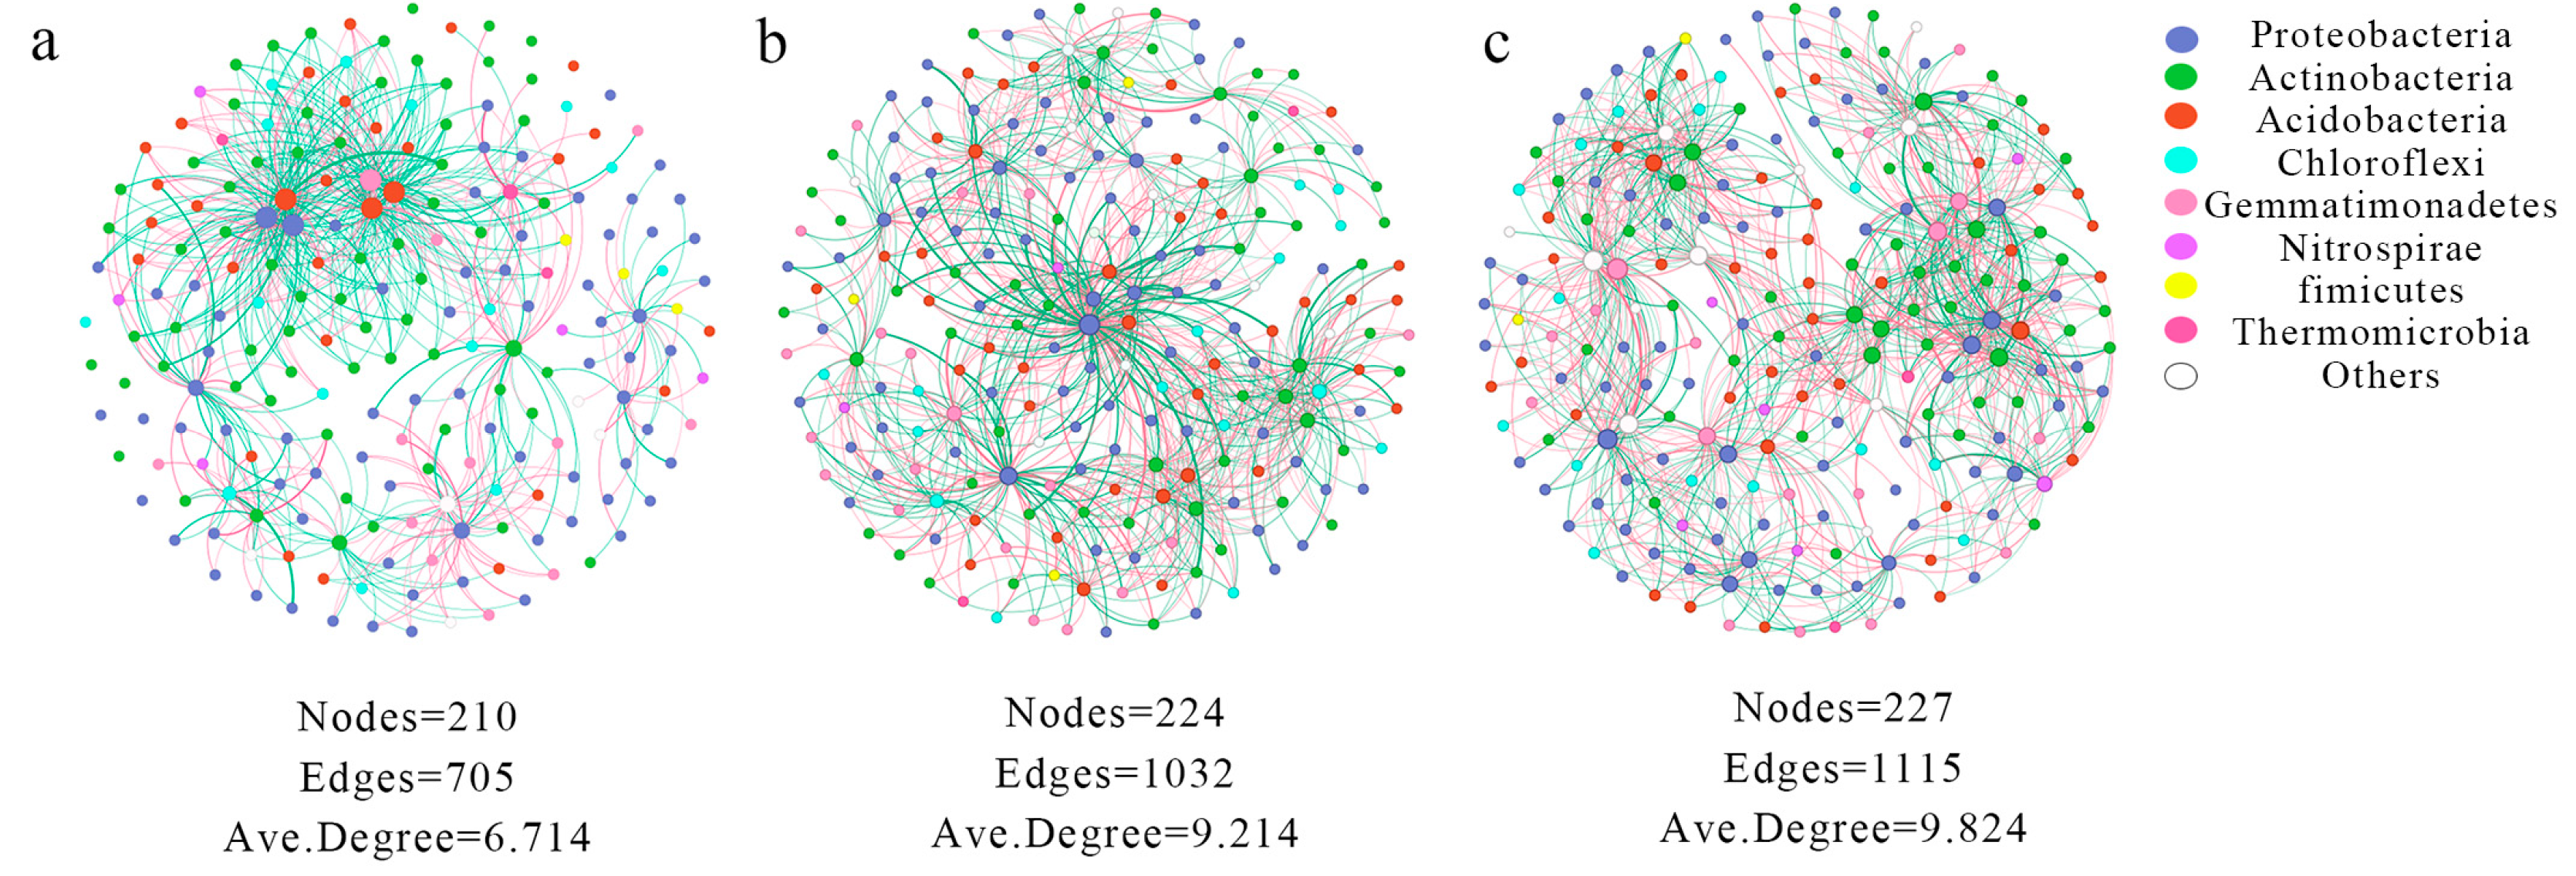
The study evaluated individual co-occurrence networks to determine the co-occurrence patterns of soil bacterial communities in different sugar beet root environments (Figure 3). Compared to H1 (201 nodes and 705 edges), both H2 and H3 had a higher number of associated nodes (224, 227) and edges (1032, 1115). The H2 and H3 networks also exhibited a higher degree of node connectivity. The average degree of the H2 network was increased by 37% compared to the H1 network, while the average degree of the H3 network was increased by 46%. Both H2 and H3 had a higher percentage of positive connections (50.48% and 51.57%), whereas the H1 network showed a negative connection percentage of 58.01%. The dominant phyla in each network remained Proteobacteria, Actinobacteria, and Acidobacteria, accounting for over 60% of the microbial community. Overall, the soil near the sugar beet roots exhibited a higher complexity in its bacterial community.
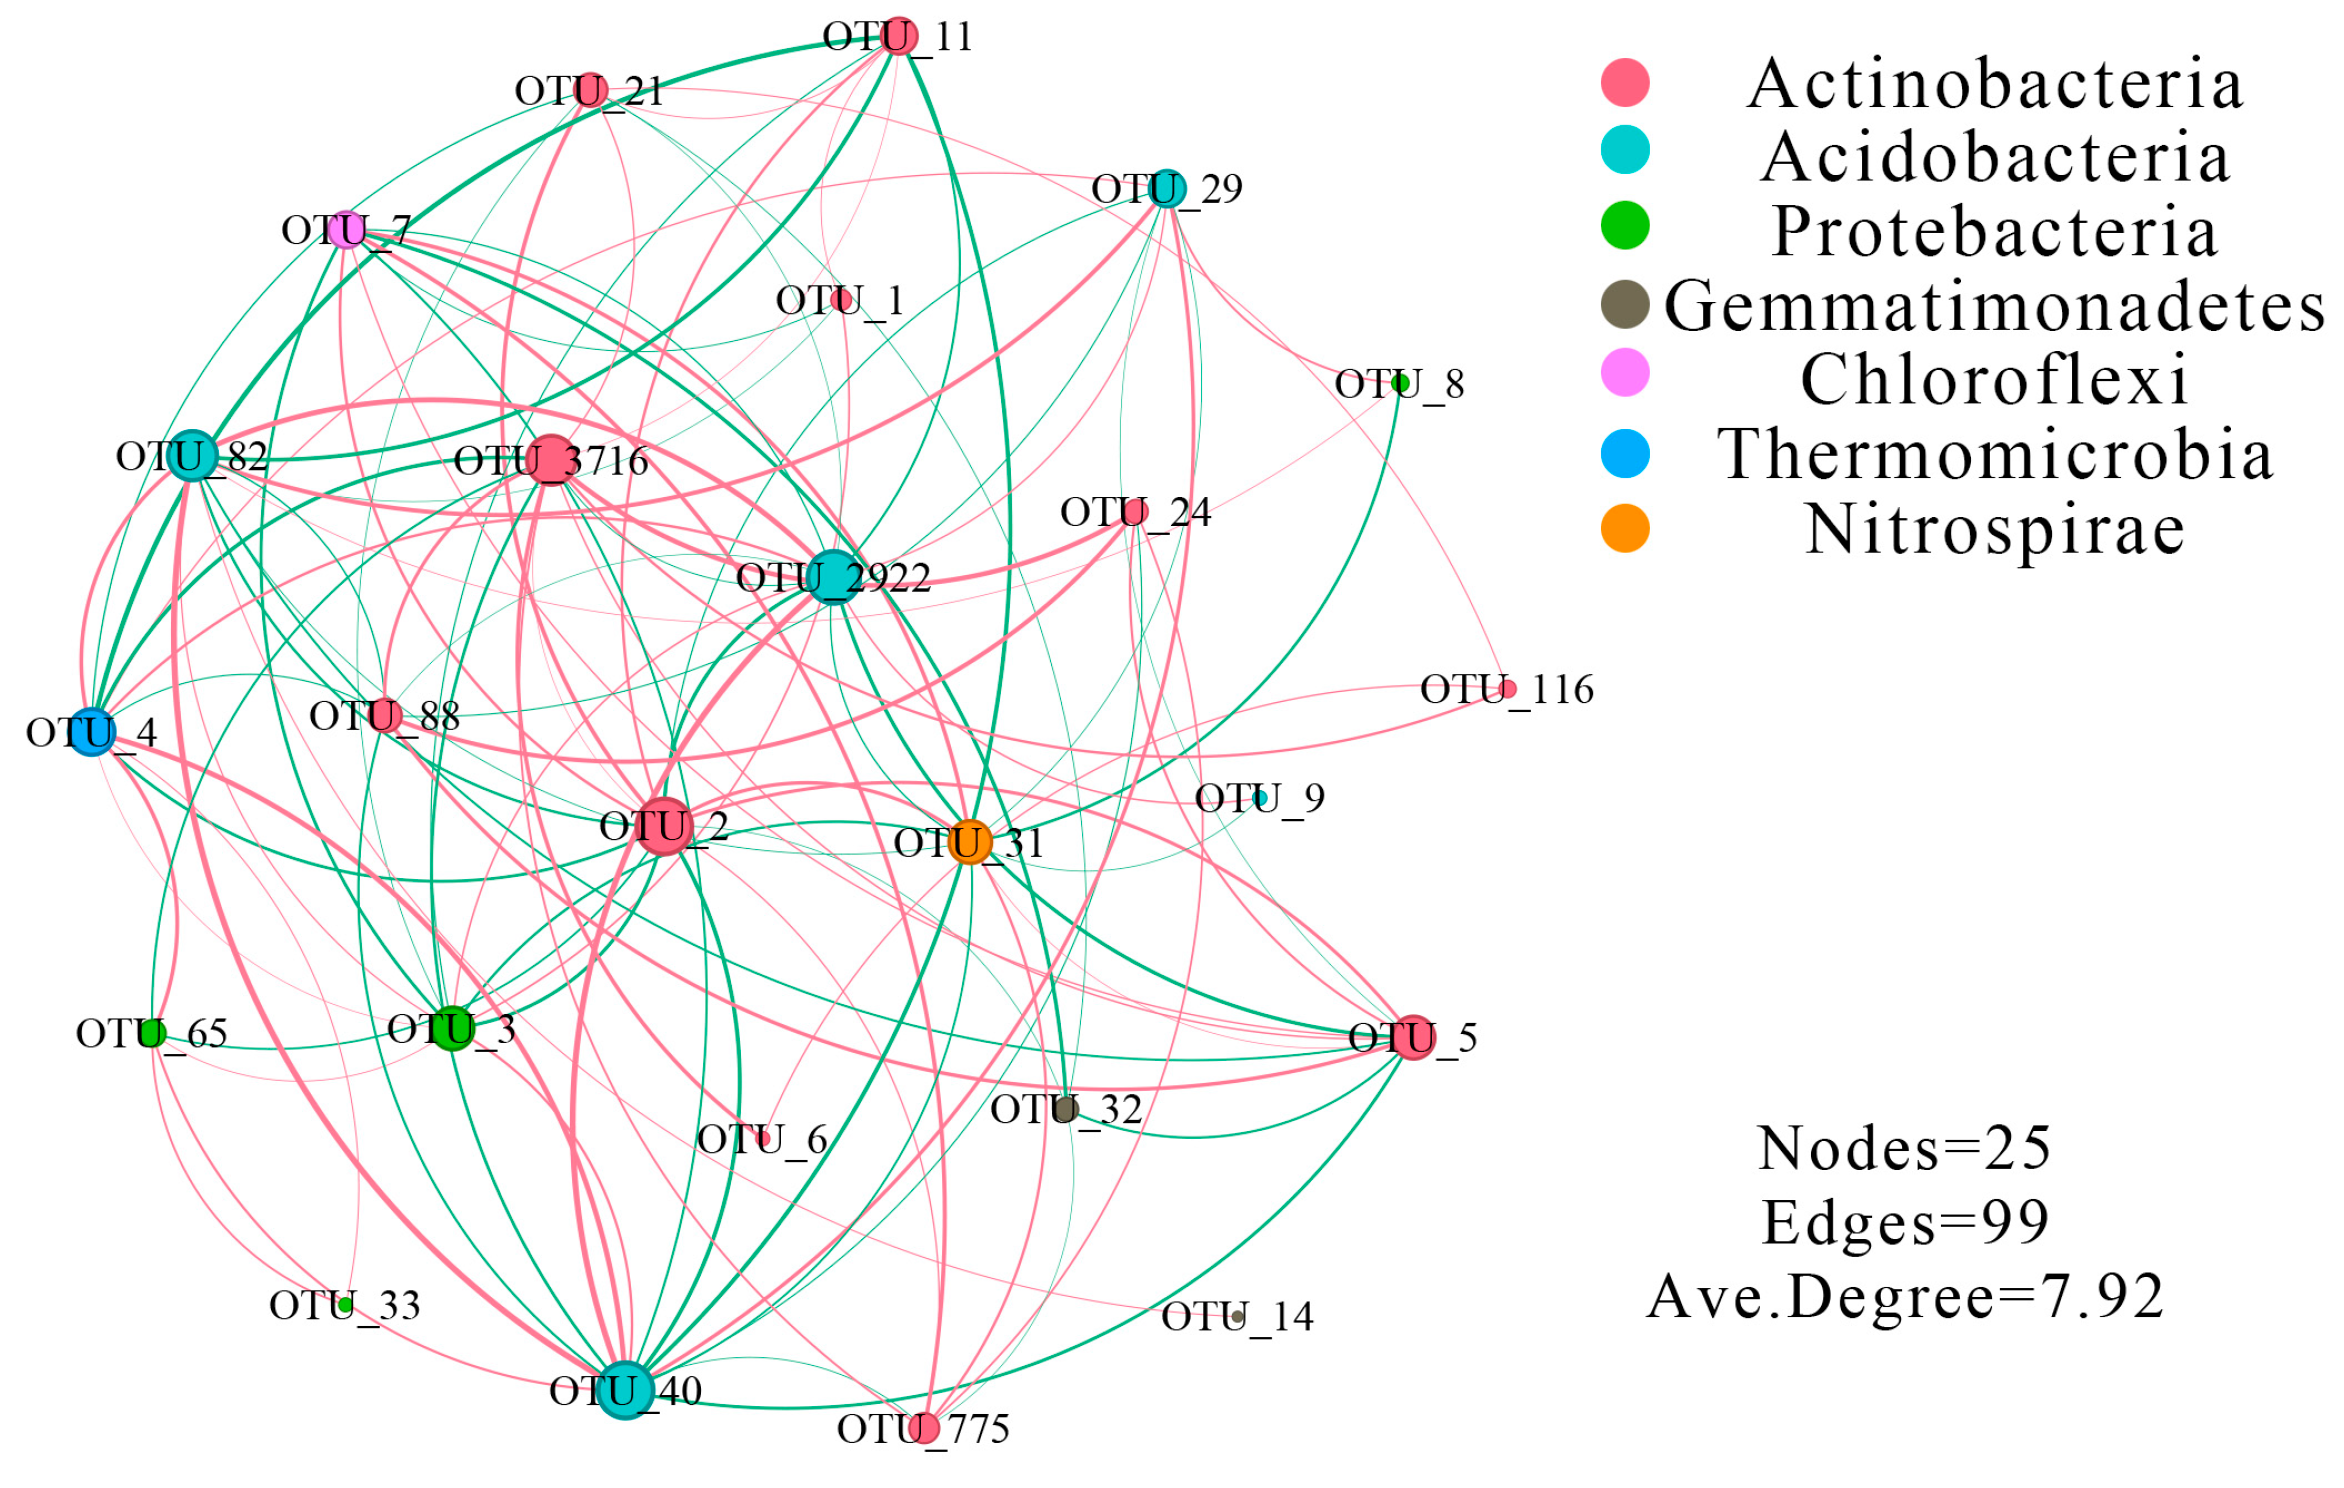
Furthermore, to explore the correlation between the dominant OTUs in the bacterial communities, we combined the three samples and selected the top 25 most abundant OTUs for co-occurrence analysis (Figure 4). The network had a total of 99 edges, with 52 edges representing positive correlations and 47 edges indicating negative correlations. The average degree of the network was 7.92, indicating good connectivity. Notably, OTU_65, classified as an ammonia-oxidizing bacteria, displayed strong positive correlations with OTU_3, OTU_4, OTU_33, and OTU_40. Specifically, OTU_4, representing nitrite-oxidizing bacteria, only exhibited a positive correlation with OTU_3.

3.3. Diversity Analysis of Microbial Communities by LEfSe

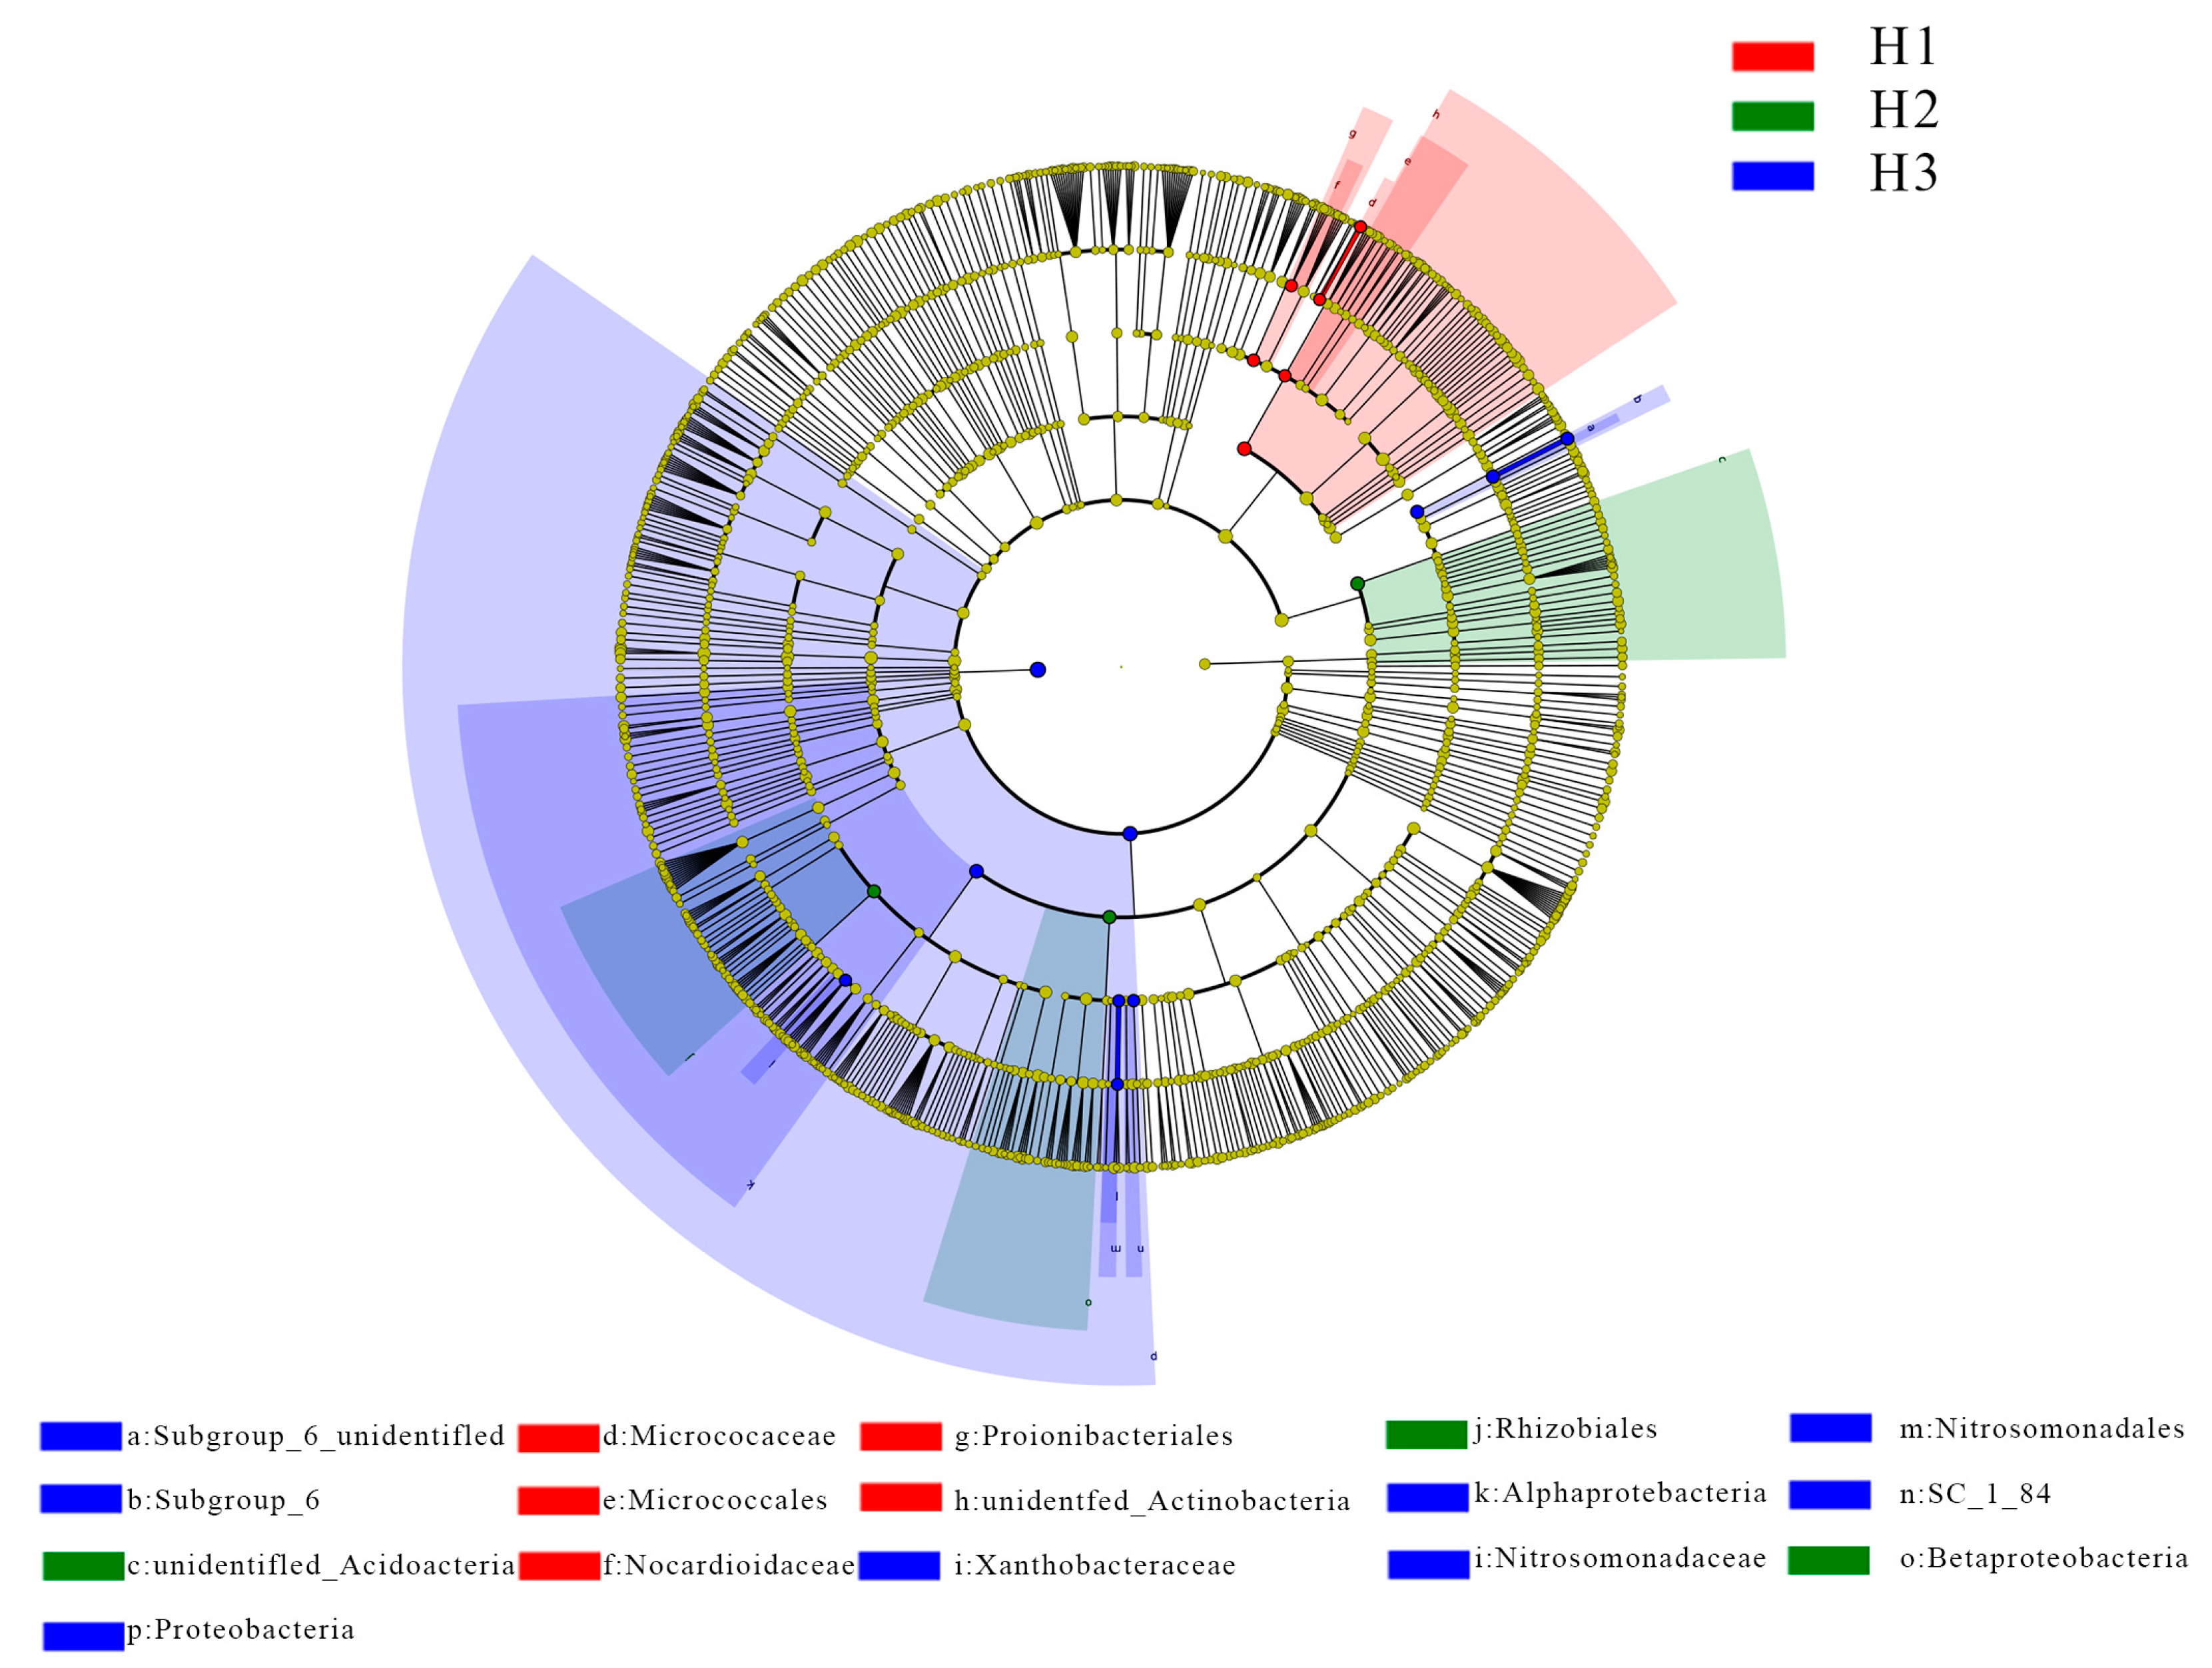
In linear discriminant analysis (LDA) with a threshold of 3.5, there were a total of 19 significantly different bacterial populations. The H1, H2, and H3 samples had 6, 3, and 10 different populations, respectively. Linear discriminant analysis effect size (LEfSe) was employed to assess the differences in the bacterial community composition (from “Phylum” to “Genus”). As shown in Figure 5, in the microbial community of H1 was predominantly enriched with Actinobacteria, including Nocardioidaceae, Propionibacteriales, and Micrococcaceae, which are less associated with nitrogen cycling. H2 showed enrichment primarily in Rhizobiales and Betaproteobacteria, which enhance nitrogen cycling functions. H3 exhibited enrichment in nitrogen-fixing Alphaproteobacteria, the organic-matter-degrading bacteria Xanthobacteraceae, and Nitrosomonadaceae, involved in the oxidation of ammonia into nitrites. Among them, H3 had a greater number of differential populations. This indicates that the roots of beets induce specific bacterial taxa, leading to distinct rhizosphere microbial communities compared to those in non-rhizosphere environments.
Functional annotation of the OTUs was conducted using FAPROTAX 1.1 to explore differences in the soil microbial functions and the expression patterns in their abundance under different rhizosphere environments. As shown in Figure 6a, a total of 64 functional pathways were predicted, with 14 pathways (28.1%) related to nitrogen cycling, predominantly found in H3. The nitrogen cycling pathways that exhibited significant differences were nitrogen fixation, nitrification, and aerobic ammonia oxidation (Figure 6b–d). The results indicated that compared to H1 and H2, the soil bacteria in H3 (sugar beet rhizosphere environment) were notably enriched in functional pathways related to nitrogen mineralization, which might be positively correlated with the soil inorganic nitrogen content.

3.4. Differential Analysis of Sugar Beet Root Exudates and Soil Nitrogen Content

The distance from the root surface significantly affected the content of sugar beet root metabolic products in the soil (Table 2). Overall, compared to H2 and H1, H3 had higher levels of serine, methionine, isoleucine, leucine, phenylalanine, lysine, histidine, arginine, oxalic acid, formic acid, and glucose. The levels of glycine, alanine, and cysteine were lower in H3. Next, we measured various nitrogen contents in the soil (Table 3), and the results showed that H3 had the highest total nitrogen (TN) content and total acid hydrolysis organic nitrogen (AHON) content, while it had the lowest total organic nitrogen (TON) content. Specifically, the inorganic nitrogen content in H3 was 24.3 times higher than in H1 and 23.3 times higher than in H2.

3.5. Correlation between Sugar Beet Root Exudates, Soil Nitrogen Content, and Bacterial Communities

As shown in Figure 7, the root exudates that affected the absorption and utilization of organic nitrogen in the soil mainly included amino acids, organic acids, and sugars (Figure 7a). The abundance of Actinobacteriota and Thermomicrobia was positively correlated with the content of total amino acids, oxalic acid, formic acid, and glucose, while it was negatively correlated with the abundance of Proteobacteria, Acidobacteriota, and Planctomycetes; furthermore, an increase in the abundance of Actinobacteriota and Thermomicrobia was associated with an increase in the soil inorganic nitrogen content, while an increase in the abundance of Proteobacteria, Acidobacteriota, and Planctomycetes was associated with a decrease in the soil inorganic nitrogen content (Figure 7b).

4. Discussion

Different crops exhibit variations in the diversity and composition of their rhizosphere microbial communities, which can be attributed to changes in the root characteristics (morphology and physiology) and root exudates (composition and concentration) [6]. Sugar beet is no exception. As a high-biomass crop with high nitrogen requirements, the organic nitrogen utilization of sugar beet in its rhizosphere environment is particularly important for its growth and biomass accumulation.

4.1. Complexity of Microbial Diversity and Networks in the Sugar Beet Rhizosphere Environment

After rinsing and high-temperature treatment, the basic soil was nearly devoid of inorganic nitrogen and microorganisms. After 50 days of sugar beet growth, certain microorganisms entered and became enriched in the rhizosphere of sugar beet through interactions with water and the surrounding environment. Different rhizosphere environments could attract different microbial communities [28]. In this study, our findings revealed a significant influence of increasing distance from the root surface on bacterial community diversity. Specifically, the closest region to the root surface, H3, exhibited a higher ACE index, indicating greater microbial diversity (Figure 2b). The NMDS analysis further demonstrated distinct separation of bacterial communities among the three soil samples (Figure 2c). Analysis of the dominant bacterial phyla (Figure 2e) identified Actinobacteriota, Proteobacteria, and Acidobacteriota, consistent with recent studies [29,30]. Notably, H3 exhibited a higher abundance of Proteobacteria, in which α-Proteobacteria includes photosynthetic species, as well as species involved in C1 compound metabolism and plant symbiosis, such as Rhizobium, and β-Proteobacteria contains many aerobic or facultative bacteria, whose variation in degradation capability can influence bacterial soil nitrogen mineralization. Additionally, there were also some chemolithotrophic groups within this phylum, such as Nitrosomonas, which is involved in nitrification [31].
The rhizosphere environment reshapes the composition of bacterial networks. Bacteria within key taxa exhibit more complex interactions in the co-occurrence networks [32]. Our study reveals significant differences in the co-occurrence networks among H1, H2, and H3 (Figure 3a–c). Specifically, H3 exhibited a more intricate network structure, with higher numbers of edges and nodes, indicating a more interconnected and diverse microbial community, compared to H1 and H2. Furthermore, it was found that the most dominant operational taxonomic units (Figure 4) played unique and critical roles in community stability and structuring microbial interactions, providing valuable insights into the functional dynamics of complex microbial ecosystems. Among these, ammonia-oxidizing bacteria and nitrite-oxidizing bacteria exhibited key correlations with specific OTUs, indicating their roles in the nitrification pathway. This observation highlights their potential role in nitrogen cycling processes within the beet rhizosphere. Linear discriminant analysis (Figure 5) revealed distinct taxonomic enrichments in microbial communities across H1, H2, and H3, and they were not randomly specific but rather structured according to phylogeny, suggesting an adaptation towards nitrogen metabolism in regions closer to beet roots. Notably, the rhizosphere environment of H3 had a greater diversity of distinct microbial populations, particularly those beneficial for soil nitrogen mineralization, such as Nitrosomonadaceae. This family is known for its involvement in converting nitrite into nitrate, crucial for plant nutrient uptake [33]. Lowering the LDA threshold further revealed additional distinctive microbial populations associated with H3, emphasizing its ecological complexity and functional diversity.

4.2. The Role of the Root Exudates in Regulating Microbial Community Structure and Soil Nitrogen Mineralization

Amino acid metabolism promotes the growth and activity of microorganisms by providing them with more carbon, nitrogen, and energy [34]. Microbes attracted by root exudates can increase enzyme production by utilizing carbon- or amino-acid-rich products, extracting nitrogen from them, and increasing the content of inorganic nitrogen in the soil [35]. Therefore, the types and quantities of carbohydrates, amino acids, organic acids, and other substances released by plant roots directly influence the composition, abundance, and activity of rhizosphere microorganisms, indirectly affecting the conversion of total nitrogen, organic nitrogen, and inorganic nitrogen in the soil. We measured the contents of 17 amino acids, 2 organic acids, glucose, and 7 nitrogen forms (Table 2 and Table 3). Among them, aspartic acid (Asp), glutamic acid (Glu), serine (Thr), proline (Pro), and valine (Val) showed negligible concentrations, indicating their minimal impact on bacterial community changes. Compared to H2 and H1, H3 exhibited higher concentrations of almost all amino acids, glucose, and organic acids, except for glycine (Gly), alanine (Ala), and cysteine (Cys). Notably, H3 showed a significantly higher inorganic nitrogen content than H1 and H2, up to 24.3 and 23.3 times higher, respectively, indicating a potential link between exudate composition and soil nitrogen mineralization. Subsequent correlation analysis between the measured exudates and soil nitrogen content (Figure 7a) revealed a significant positive correlation between soil inorganic nitrogen content and serine (Ser) and isoleucine (Ile). In addition, organic nitrogen content showed a positive correlation with glycine (Gly), alanine (Ala), and tyrosine (Tyr) but a negative correlation with the amino acids, organic acids, and glucose.
The process of nitrogen transformation driven by root exudates, which is participated in by microorganisms, is usually described as a cycle consisting of six sequential reactions. A nitrogen molecule (N2) is first converted into ammonia through nitrogen fixation and then transformed into biologically organic nitrogen through assimilatory absorption. The organic nitrogen further undergoes ammonification to form ammonium, which is then oxidized into nitrate through nitrification (NH4+ → NO2 → NO3). Finally, the nitrate is reduced back into a nitrogen molecule through denitrification (NO3 → NO2 → NO → N2O → N2) or reduced into a nitrogen molecule through anaerobic ammonium oxidation (NO2 + NH4+ → N2). Therefore, nitrogen mineralization is commonly described as consisting of two stages, namely ammonification and nitrification [36]. In our study, we found a higher predicted abundance of nitrogen cycling functions in the bacterial community of H3 compared to H1 and H2 (Figure 6a). Particularly, the abundance of ammonia-oxidation and nitrite-oxidation functions was significantly increased, indicating the important role of rhizosphere microorganisms in soil nitrogen mineralization. Additionally, the bacterial biomass in the rhizosphere of H3 was higher than that in the non-rhizosphere environments of H1 and H2 (Table 1). Thus, root exudates might attract more microbial colonization, with these microbes participating in soil nitrogen mineralization. Furthermore, soil inorganic nitrogen content was positively correlated with the abundance of Proteobacteria and negatively correlated with the abundance of Actinobacteriota (Figure 7b). In addition, the content of oxalic acid, formic acid, and glucose increased the abundance of Proteobacteria, Acidobacteriota, and Planctomycetes while decreasing the abundance of Actinobacteriota and Thermomicrobia (Figure 7b). These results suggested that the content of total amino acids, oxalic acid, formic acid, and glucose in the root exudates could influence the composition and abundance of soil bacterial communities, thereby affecting the soil’s inorganic nitrogen content. Therefore, our study elucidates the role of beet root exudates (mainly organic acids and amino acids) in regulating microbial community structure and co-linearity networks in influencing soil nitrogen mineralization.

5. Conclusions

Organic nitrogen mineralization in the sugar beet rhizosphere soil is a highly complex network that is closely related to variations in root exudate content and composition across different rhizosphere environments, as well as soil bacterial community diversity (Figure 8). Sugar beet roots attract a greater variety and quantity of bacteria through their exudates. As the average degree of co-linearity networks of different bacterial communities increases, their functional roles within the rhizosphere (such as nitrification, nitrogen fixation, and nitrite oxidation) strengthen, promoting the accumulation of inorganic nitrogen in soil. This ultimately results in higher accumulation of inorganic nitrogen content in the sugar beet rhizosphere environment compared to the non-rhizosphere environment. This study elucidates the role of root exudates (mainly organic acids and amino acids) in regulating the microbial community structure and co-linearity networks in influencing soil nitrogen mineralization. Future research could specifically analyze the potential coupling effects among microbial metabolism, root exudates, and microbial community, providing a more theoretical basis for the sustainable development of modern sugar beet cultivation.

Author Contributions

Conceptualization, Q.W.; methodology, L.X. and H.W.; software, L.X. and H.W.; validation, D.L. and L.X.; formal analysis, Q.W. and L.X.; data curation, D.L. and Q.W.; writing—original draft preparation, D.L. and L.X.; writing—review and editing, D.L. and L.X.; supervision, D.L., B.S., W.X. and Q.W.; funding acquisition, D.L., W.X. and B.S. All authors have read and agreed to the published version of the manuscript.

Funding

This research was funded by the earmarked fund CARS-17, the Natural Science Foundation of Heilongjiang Province of China (LH2023C090), the Fundamental Research Funds for the Provincial Universities (2022-KYYWF-1070), the Inner Mongolia Autonomous Region “the open competition mechanism to select the best candidates” project, entitled “Creation of Elite Beet Germplasm and Breeding of Varieties Suitable for Mechanized Operation” (2022JBGS0029), and the Precision Identification Project of Germplasm Resources (19240700).

Institutional Review Board Statement

Not applicable.

Data Availability Statement

No new data were created or analyzed in this study.

Acknowledgments

We appreciate the support from the Tianchi Program and the Sugar Beet Breeding Research Project.

Conflicts of Interest

The authors declare no conflicts of interest.

References

  1. Li, Y.C.; Chen, Y.; Tang, M.D.; Li, L.F.; Lin, X.Y.; Wang, Y.H.; Xu, D.H.; Ai, S.Y. Effects of ferrous sulfate and ferric nitrate on cadmium transportation in the rhizosphere soil-rice system. Huan Jing Ke Xue 2020, 41, 5143–5150. (In Chinese) [Google Scholar] [CrossRef] [PubMed]
  2. Liu, X.; Hu, B.; Chu, C. Nitrogen assimilation in plants: Current status and future prospects. J. Genet. Genomics 2022, 49, 394–404. [Google Scholar] [CrossRef] [PubMed]
  3. Chen, D.; Ma, X.; Liu, J.; Wang, C.; Qin, J. Soil net organic nitrogen mineralization kinetics in response to short- and long-term land-use conversion of woodland to tea fields. Pol. J. Environ. Stud. 2021, 30, 4475–4483. [Google Scholar] [CrossRef]
  4. Keuper, F.; Dorrepaal, E.; Van Bodegom, P.M.; Logtestijn, R.; Venhuizen, G.; Hal, J.; Aerts, R. Experimentally increased nutrient availability at the permafrost thaw front selectively enhances biomass production of deep-rooting subarctic peatland species. Global Chang. Biol. 2017, 23, 4257–4266. [Google Scholar] [CrossRef]
  5. Liu, Y.; Evans, S.E.; Friesen, M.L.; Tiemann, L.K. Root exudates shift how N mineralization and N fixation contribute to the plant-available N supply in low fertility soils. Soil. Biol. Biochem. 2022, 165, 108541. [Google Scholar] [CrossRef]
  6. Cheng, Y.; Wang, J.; Chang, S.X.; Cai, Z.; Müller, C.; Zhang, J. Nitrogen deposition affects both net and gross soil nitrogen transformations in forest ecosystems: A review. Environ. Pollut. 2019, 244, 608–616. [Google Scholar] [CrossRef]
  7. Hui, C.; Sun, P.; Guo, X.; Jiang, H.; Zhao, Y.; Xu, L. Shifts in microbial community structure and soil nitrogen mineralization following short-term soil amendment with the ammonifier Bacillus amyloliquefaciens DT. Int. Biodeter. Biodegr. 2018, 132, 40–48. [Google Scholar] [CrossRef]
  8. Zecchin, S.; Mueller, R.C.; Seifert, J.; Stingl, U.; Anantharaman, K.; Bergen, M.; Cavalca, L.; Pester, M. Rice paddy Nitrospirae carry and express genes related to sulfate respiration: Proposal of the new genus “Candidatus Sulfobium”. Appl. Environ. Microbiol. 2018, 84, e02224-17. [Google Scholar] [CrossRef] [PubMed]
  9. Guo, Z.; Han, J.; Li, J.; Xu, Y.; Wang, X. Correction: Effects of long-term fertilization on soil organic carbon mineralization and microbial community structure. PLoS ONE 2019, 14, e0216006. [Google Scholar] [CrossRef]
  10. Mastný, J.; Bárta, J.; Kaštovská, E.; Picek, T. Decomposition of peatland DOC affected by root exudates is driven by specific r and K strategic bacterial taxa. Sci. Rep. 2021, 11, 18612–18677. [Google Scholar] [CrossRef]
  11. Badri, D.V.; Vivanco, J.M. Regulation and function of root exudates. Plant Cell Environ. 2009, 32, 666–681. [Google Scholar] [CrossRef] [PubMed]
  12. Han, B.; Zhang, W.; Hu, F.; Zhao, Q.-Q.; Lu, Y.; Kong, X.; Lü, J.-G. Influence of artificial root exudates and actual root exudates on the microbial community in pyrene-contaminated soil. Huan Jing Ke Xue 2022, 43, 1077–1088. (In Chinese) [Google Scholar] [CrossRef] [PubMed]
  13. Wang, Y.J.; Wang, T.Q.; Hou, Z.J.; Wang, X.H.; Su, G.J.; Liu, Y.Q.; Zhou, Q. Responses of root exudates to intercropping of Chinese milk vetch with rape. Ying Yong Sheng Tai Xue Bao 2021, 32, 1783–1790. (In Chinese) [Google Scholar] [CrossRef] [PubMed]
  14. Meier, I.C.; Finzi, A.C.; Phillips, R.P. Root exudates increase N availability by stimulating microbial turnover of fast-cycling N pools. Soil. Biol. Biochem. 2016, 106, 119–128. [Google Scholar] [CrossRef]
  15. Zhao, M.; Zhao, J.; Yuan, J.; Hale, L.; Wen, T.; Huang, Q.; Vivanco, J.M.; Zhou, J.; Kowalchuk, G.A.; Shen, Q. Root exudates drive soil-microbe-nutrient feedbacks in response to plant growth. Plant Cell Environ. 2021, 44, 613–628. [Google Scholar] [CrossRef] [PubMed]
  16. Dessaux, Y.; Grandclement, C.; Faure, D. Engineering the rhizosphere. Trends Plant Sci. 2016, 21, 266–278. [Google Scholar] [CrossRef] [PubMed]
  17. Zhang, Y.; Ruyter-Spira, C.; Bouwmeester, H.J. Engineering the plant rhizosphere. Curr. Opin. Biotechnol. 2015, 32, 136–142. [Google Scholar] [CrossRef]
  18. Li, J.; Liu, X.; Xu, L.; Li, W.; Yao, Q.; Yin, X.; Wang, Q.; Tan, W.; Xing, W.; Liu, D. Low nitrogen stress-induced transcriptome changes revealed the molecular response and tolerance characteristics in maintaining the C/N balance of sugar beet (Beta vulgaris L.). Front. Plant Sci. 2023, 14, 1164151. [Google Scholar] [CrossRef] [PubMed]
  19. Chang, X.; Zhang, Y.; Xu, L.; Li, J.; Xing, W.; Liu, D. Effects of Different Nitrogen form Ratio on Key Enzymes of Nitrogen Assimilation in Sugar Beet. Crops 2024, 1–9. Available online: http://hfffg5fce84748f1d4cc2h9v90opkpcnww6fqq.fgfy.hlju.cwkeji.cn/kcms/detail/11.1808.S.20240318.1817.002.html (accessed on 13 June 2024).
  20. Wang, Q.H.; Guo, Y.N.; Hu, X.H.; Wang, X.C.; Deng, Y.H.; Zhou, J.C. Screening and variation analysis of soil organic nitrogen efficient in different Beta vulgaris genotypes. Bull. Bot. Res. 2017, 37, 563–571. (In Chinese) [Google Scholar] [CrossRef]
  21. Liu, S.; Song, B.; Sehar, S.; Adil, M.F.; Lin, X.; Huo, J.; Zhao, X.; Riaz, M. Variations in rhizosphere soil dominant and pathogenic flora improve boron-efficient Beta vulgaris L. yield under boron deficit. J. Clean. Prod. 2024, 444, 141241. [Google Scholar] [CrossRef]
  22. Lu, R.K. Analysis Methods of Soil Agricultural Chemistry; China Agricultural Science Technology Press: Beijing, China, 2000. (In Chinese) [Google Scholar]
  23. Devi, N.S.; Saha, D. Influence of organic matter vis-à-vis humic acid on the transformation of inorganic and organic forms of nitrogen in a Typic Haplustept soil. Commun. Soil. Sci. Plant Anal. 2017, 48, 1042–1051. [Google Scholar] [CrossRef]
  24. Díaz, J.; Lliberia, J.L.; Comellas, L.; Broto-Puig, F. Amino acid and amino sugar determination by derivatization with 6-aminoquinolyl-n-hydroxysuccinimidyl carbamate followed by high-performance liquid chromatography and fluorescence detection. J. Chromatogr. A 1996, 719, 171–179. [Google Scholar] [CrossRef]
  25. Edgar, R.C. Uparse: Highly accurate out sequences from microbial amplicon reads. Nat. Methods 2013, 10, 996–998. [Google Scholar] [CrossRef] [PubMed]
  26. DeSantis, T.Z.; Hugenholtz, P.; Larsen, N.; Rojas, M.; Brodie, E.L.; Keller, K.; Huber, T.; Dalevi, D.; Hu, P.; Andersen, G.L. Greengenes, a chimera-checked 16S rRNA gene database and workbench compatible with ARB. Appl. Environ. Microb. 2006, 72, 5069–5072. [Google Scholar] [CrossRef] [PubMed]
  27. Wang, Q.; Garrity, G.M.; Tiedje, J.M.; Cole, J.R. Naive Bayesian classifier for rapid assignment of rRNA sequences into the new bacterial taxonomy. Appl. Environ. Microb. 2007, 73, 5261–5267. [Google Scholar] [CrossRef]
  28. Cui, R.; Geng, G.; Wang, G.; Stevanato, P.; Dong, Y.; Li, T.; Yu, L.; Wang, Y. The response of sugar beet rhizosphere micro-ecological environment to continuous cropping. Front. Microb. 2022, 13, 956785. [Google Scholar] [CrossRef]
  29. Hernández-Álvarez, C.; García-Oliva, F.; Cruz-Ortega, R.; Romero, M.F.; Barajas, H.R.; Piñero, D.; Alcaraz, L.D. Squash root microbiome transplants and metagenomic inspection for in situ arid adaptations. Sci. Total Environ. 2022, 805, 150136. [Google Scholar] [CrossRef]
  30. Bertoldo, G.; Della Lucia, M.C.; Squartini, A.; Concheri, G.; Broccanello, C.; Romano, A.; Ravi, S.; Cagnin, M.; Baglieri, A.; Stevanato, P. Endophytic microbiome responses to sulfur availability in Beta vulgaris (L.). Int. J. Mol. Sci. 2021, 22, 7184. [Google Scholar] [CrossRef]
  31. Kim, H.-S.; Lee, S.-H.; Jo, H.Y.; Finneran, K.T.; Kwon, M.J. Diversity and composition of soil Acidobacteria and Proteobacteria communities as a bacterial indicator of past land-use change from forest to farmland. Sci. Total Environ. 2021, 797, 148944. [Google Scholar] [CrossRef]
  32. Chen, L.; Jiang, Y.; Liang, C.; Luo, Y.; Xu, Q.; Han, C.; Zhao, Q.; Sun, B. Competitive interaction with keystone taxa induced negative priming under biochar amendments. Microbiome 2019, 7, 77. [Google Scholar] [CrossRef] [PubMed]
  33. Daims, H.; Nielsen, J.L.; Nielsen, P.H.; Schleifer, K.-H.; Wagner, M. In situ characterization of nitrospira-like nitrite-oxidizing bacteria active in wastewater treatment plants. Appl. Environ. Microb. 2001, 67, 5273–5284. [Google Scholar] [CrossRef] [PubMed]
  34. Liao, W.; Tong, D.; Li, Z.; Nie, X.; Liu, Y.; Ran, F.; Liao, S. Characteristics of microbial community composition and its relationship with carbon, nitrogen and sulfur in sediments. Sci. Total Environ. 2021, 795, 148848. [Google Scholar] [CrossRef] [PubMed]
  35. Gan, D.; Zeng, H.; Zhu, B. The rhizosphere effect on soil gross nitrogen mineralization: A meta-analysis. Soil. Ecol. Lett. 2022, 4, 144–154. [Google Scholar] [CrossRef]
  36. Kuypers, M.M.M.; Marchant, H.K.; Kartal, B. The microbial nitrogen-cycling network. Nat. Rev. Microb. 2018, 16, 263–276. [Google Scholar] [CrossRef]
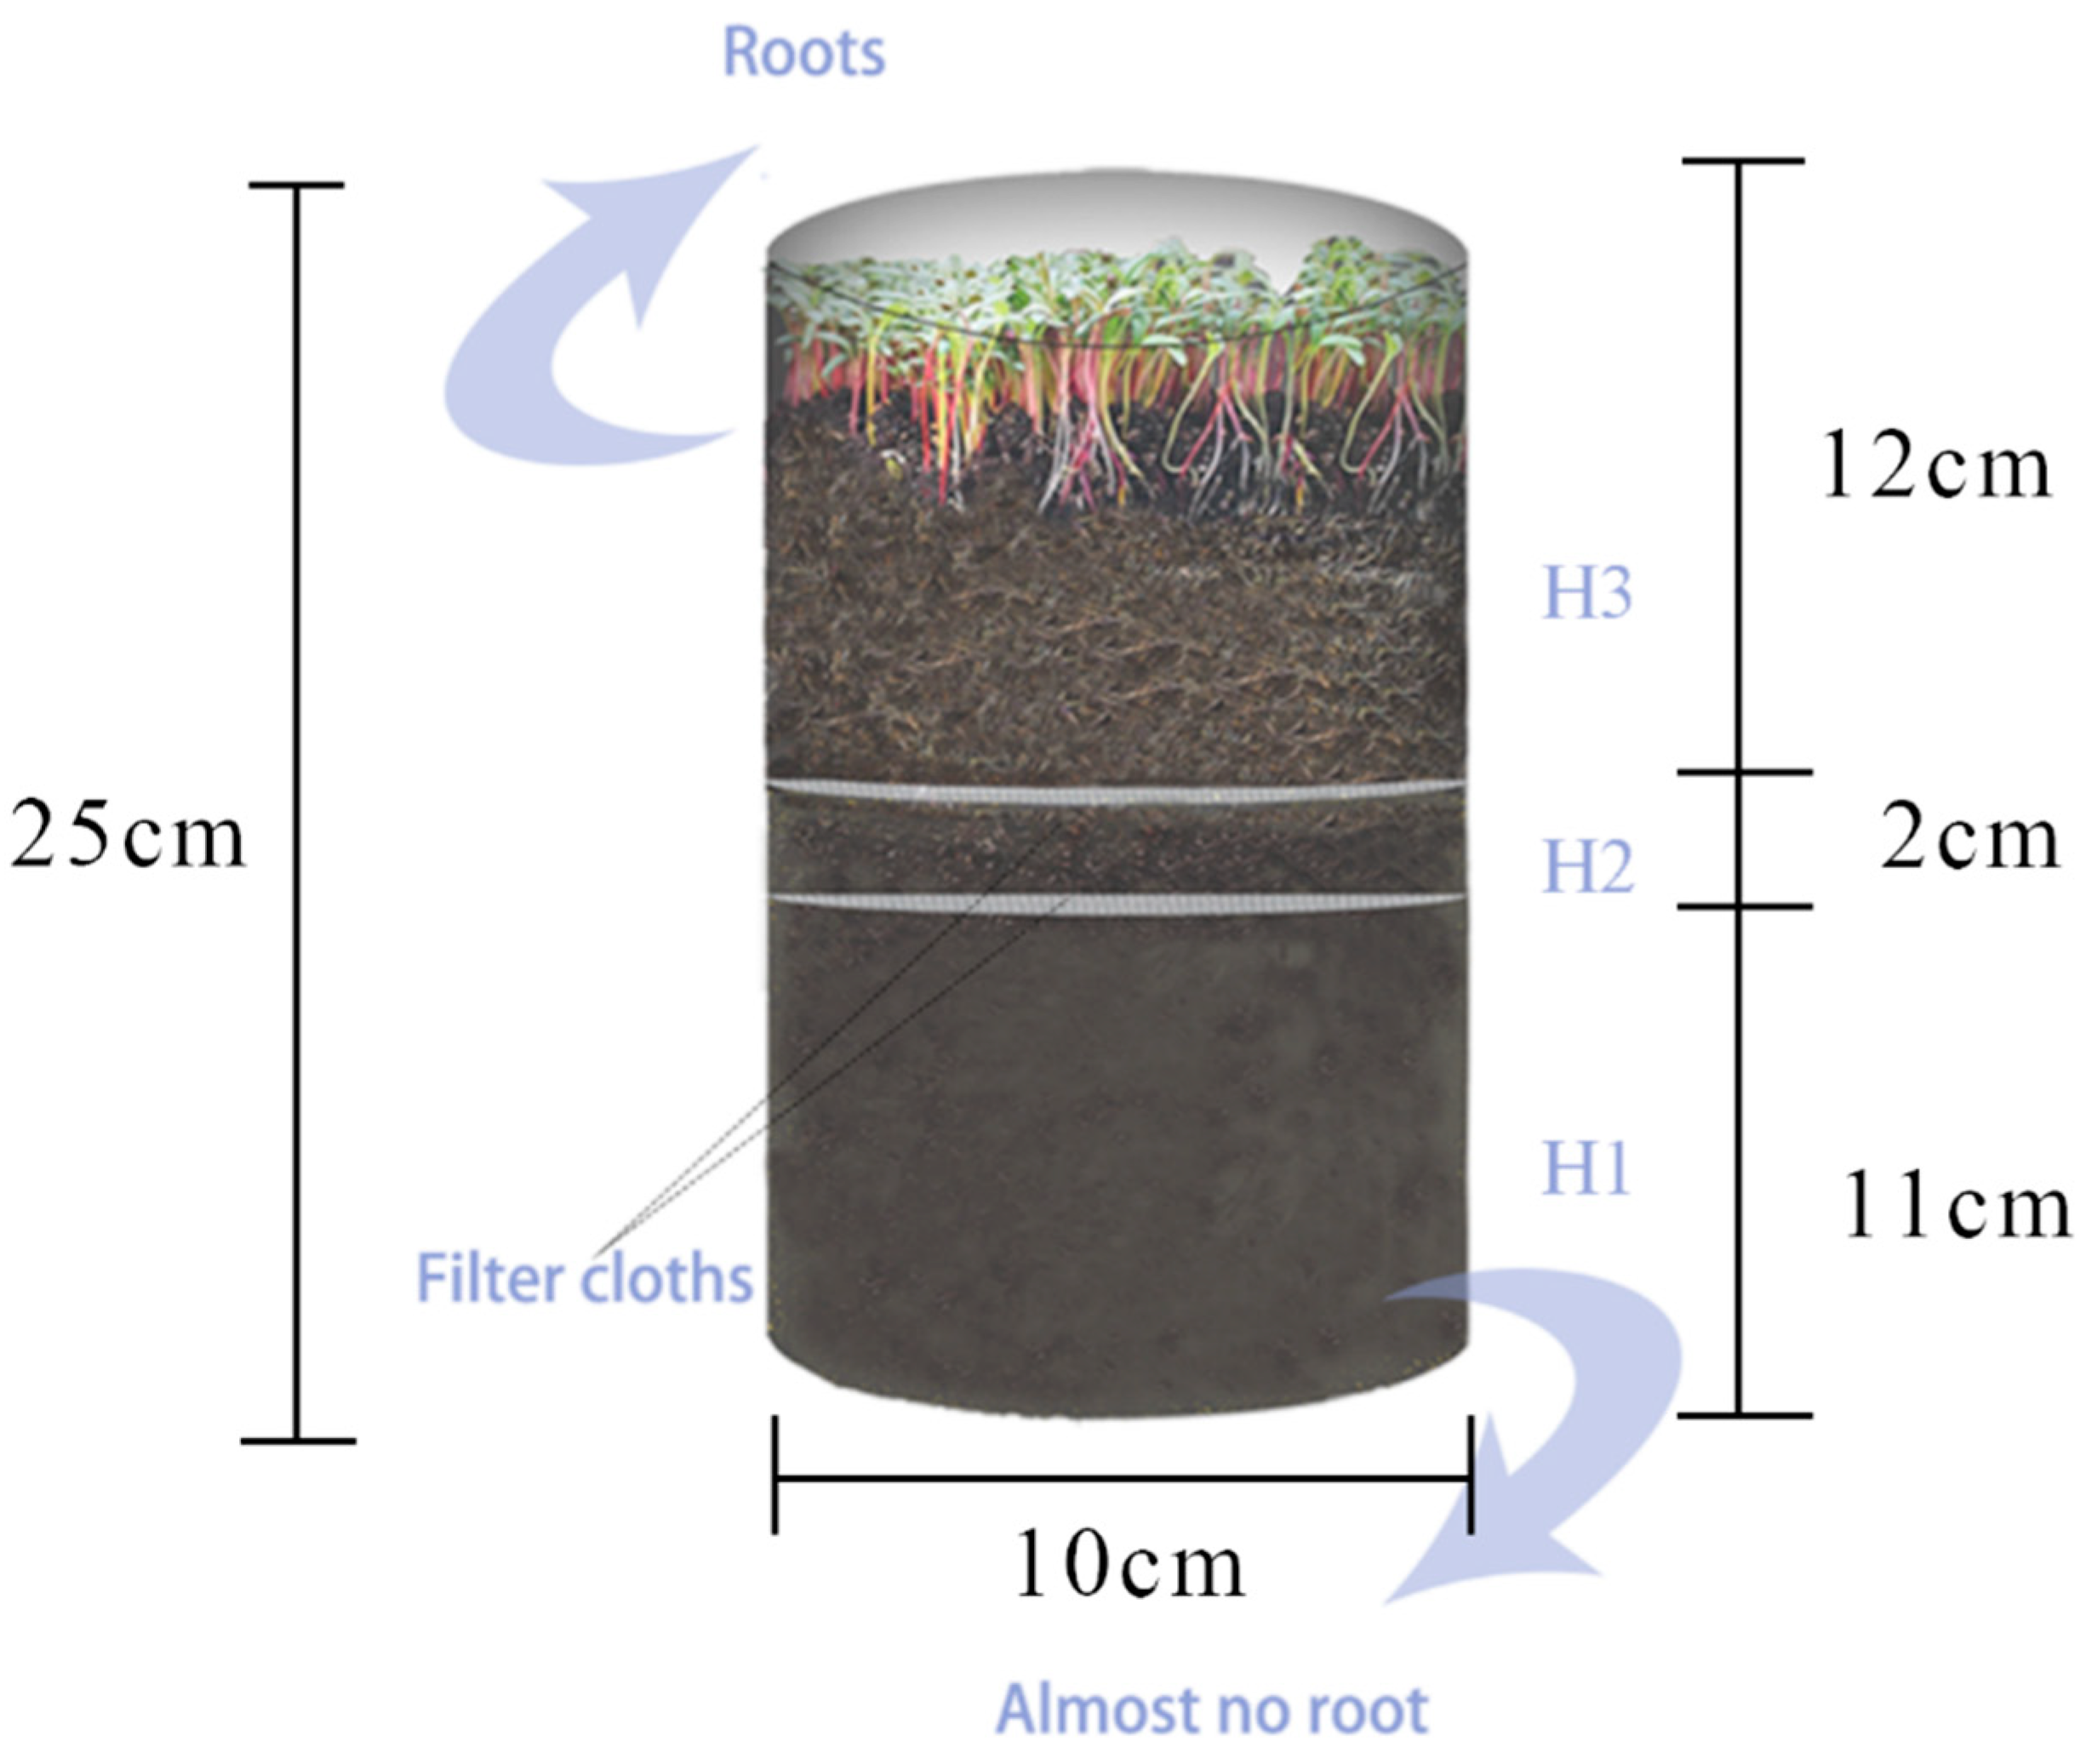
Figure 1. Experimental design. H1, H2, and H3 are soil environments ranging from distant from to close to sugar beet roots. The same applies below.
Agriculture 14 01094 g001
Figure 2. Soil bacterial community structures in rhizosphere and non-rhizosphere environments of sugar beet. (a,b) Shannon and ACE indices of soil bacteria, respectively; (c) NMDS plot illustrating the composition of soil bacterial communities; (d) Venn diagram representing the overlap of major taxonomic groups at the phylum level of soil bacteria; (e) relative abundance of major taxonomic groups at the phylum level of soil bacteria and their replicates.
Agriculture 14 01094 g002
Figure 3. The co-occurrence networks of bacteria in H1 (a), H2 (b) and H3 (c) based on Spearman’s correlation matrices. Nodes in the networks represent bacterial phyla, and the size of each node indicates the relative abundance of a specific OTU. Red lines between nodes denote positive correlations, while green lines indicate negative correlations. The thickness of the lines represents the strength of correlation at the phylum level, and each node is depicted in a different color.
Agriculture 14 01094 g003
Figure 4. The co-occurrence network of dominant OTUs in bacterial communities. Nodes in the network represent bacterial phyla, with the size of each node proportional to the relative abundance of each specific OTU. Red lines between nodes indicate positive correlations, while green lines indicate negative correlations. The thickness of the lines reflects the strength of correlation.
Agriculture 14 01094 g004
Figure 5. Changes in bacterial abundances by LEfSe analysis. The circles radiating from inside to outside represent taxonomic levels from phylum to genus. Different colored nodes on the branches represent microbial communities that play important roles in each group. a–p denote the species names.
Agriculture 14 01094 g005
Figure 6. Microbial functional prediction. (a) Heatmap of the predicted functional profile for the microbial communities at the OUT level based on the Functional Annotation of Prokaryotic Taxa (FAPROTAX 1.1) database. The color code indicates relative abundance, ranging from blue (negative correlation) to red (positive correlation). (bd) Boxplots for nitrogen fixation, nitrification, and aerobic ammonia oxidation, respectively.
Agriculture 14 01094 g006
Figure 7. Correlation analysis between soil components and dominant bacteria. (a) Heatmap of the correlations between soil nitrogen content and root exudates. (b) Heatmap of the correlations between dominant bacterial community and soil nitrogen content and root exudates. *** means p < 0.001; ** means p < 0.01; * means p < 0.05. The color codes indicate relative abundance, ranging from blue (negative correlation) to red (positive correlation).
Agriculture 14 01094 g007
Figure 8. Response model for sugar beets regulating soil microbial-mediated accumulation of inorganic nitrogen through exudate secretion.
Agriculture 14 01094 g008
Table 1. Soil microbial biomass in rhizosphere and non-rhizosphere environments of sugar beet.
Distance from the Root Surface (cm)Bacteria (×104 cfu/g)
H3H2H1
KWS813860.3 ± 1.45a54.0 ± 1.20b47.0 ± 1.14c
Note: The values in the table are means ± SE, and different letters indicate the significance between different groups (p < 0.05).
Table 2. The content of amino acids, organic acids, and nitrogen in H1, H2, and H3.
Substance (µg/L)H1H2H3
Ser23.45 ± 0.04c26.12 ± 0.25b28.8 ± 0.28a
Gly10.35 ± 0.04a6.22 ± 0.12b3.95 ± 0.98c
Ala36.65 ± 0.04a33.46 ± 0.12b31 ± 0.21c
Cys61.5 ± 0.70b60.13 ± 0.59c59.45 ± 0.01c
Met31.6 ± 0.84c50.32 ± 1.81b54.85 ± 2.54b
Ile23.55 ± 0.53c26.21 ± 0.11b28.9 ± 0.16a
Leu38.25 ± 0.83c43.11 ± 0.57b46.4 ± 0.14a
Tyr22.3 ± 0.45a19.67 ± 0.55c18.95 ± 0.38c
Phe16.6 ± 0.42c18.05 ± 0.09b18.6 ± 0.28b
Lys28.25 ± 1.32c29.07 ± 0.19c29.4 ± 0.10c
His5.25 ± 0.02b5.41 ± 0.11c5.45 ± 0.07c
Arg22.7 ± 0.31c23.98 ± 0.014b24.3 ± 0.56b
Oxalic acid41.1 ± 0.56c130 ± 2.26b161.6 ± 1.66a
Formic acid5.3 ± 0.07c12.4 ± 0.14b16.5 ± 0.25a
Glucose0.45 ± 0.04c1.22 ± 0.01b1.52 ± 0.002a
Note: Different letters indicate the significance between different groups (p < 0.05; Wilcoxon test).
Table 3. Soil nitrogen content in H1, H2, and H3.
N (g/kg)H1H2H3
AHON1.444 ± 0.075ab1.284 ± 0.018b1.576 ± 0.094a
AN0.466 ± 0.060b0.432 ± 0.001b0.597 ± 0.047a
ASN0.083 ± 0.012b0.077 ± 0.298a0.0436 ± 0.034b
AAN0.463 ± 0.089ab0.375 ± 0.018b0.531 ± 0.077a
TN2.186 ± 0.068b2.213 ± 0.350b2.48 ± 0.181a
TIN0.0197 ± 0.005b0.0206 ± 0.004b0.480 ± 0.069a
TON2.166 ± 0.069b2.213 ± 0.328a2.008 ± 0.130b
Note: Different letters indicate the significance between different groups (p < 0.05; Wilcoxon test).
Disclaimer/Publisher’s Note: The statements, opinions and data contained in all publications are solely those of the individual author(s) and contributor(s) and not of MDPI and/or the editor(s). MDPI and/or the editor(s) disclaim responsibility for any injury to people or property resulting from any ideas, methods, instructions or products referred to in the content.