
Dietary Crude Protein Reduction with Addition of Crystalline Amino Acids in Growing Pekin Ducks Housed in Cascading Cages: Influence on Growth Performance, Carcass Traits, and Apparent Nutrient Digestibility

 , ,
, ,
Abstract
1. Introduction
2. Materials and Methods
2.1. Birds and Housing
2.2. Experimental Design and Diets
2.3. Growth Performance
2.4. Carcass Characteristics
2.5. Measurement of Nutrient Digestibility
2.6. Statistical Analysis
3. Results
3.1. Growth Performance
3.2. Carcass Traits
3.3. Nutrient Apparent Digestibility
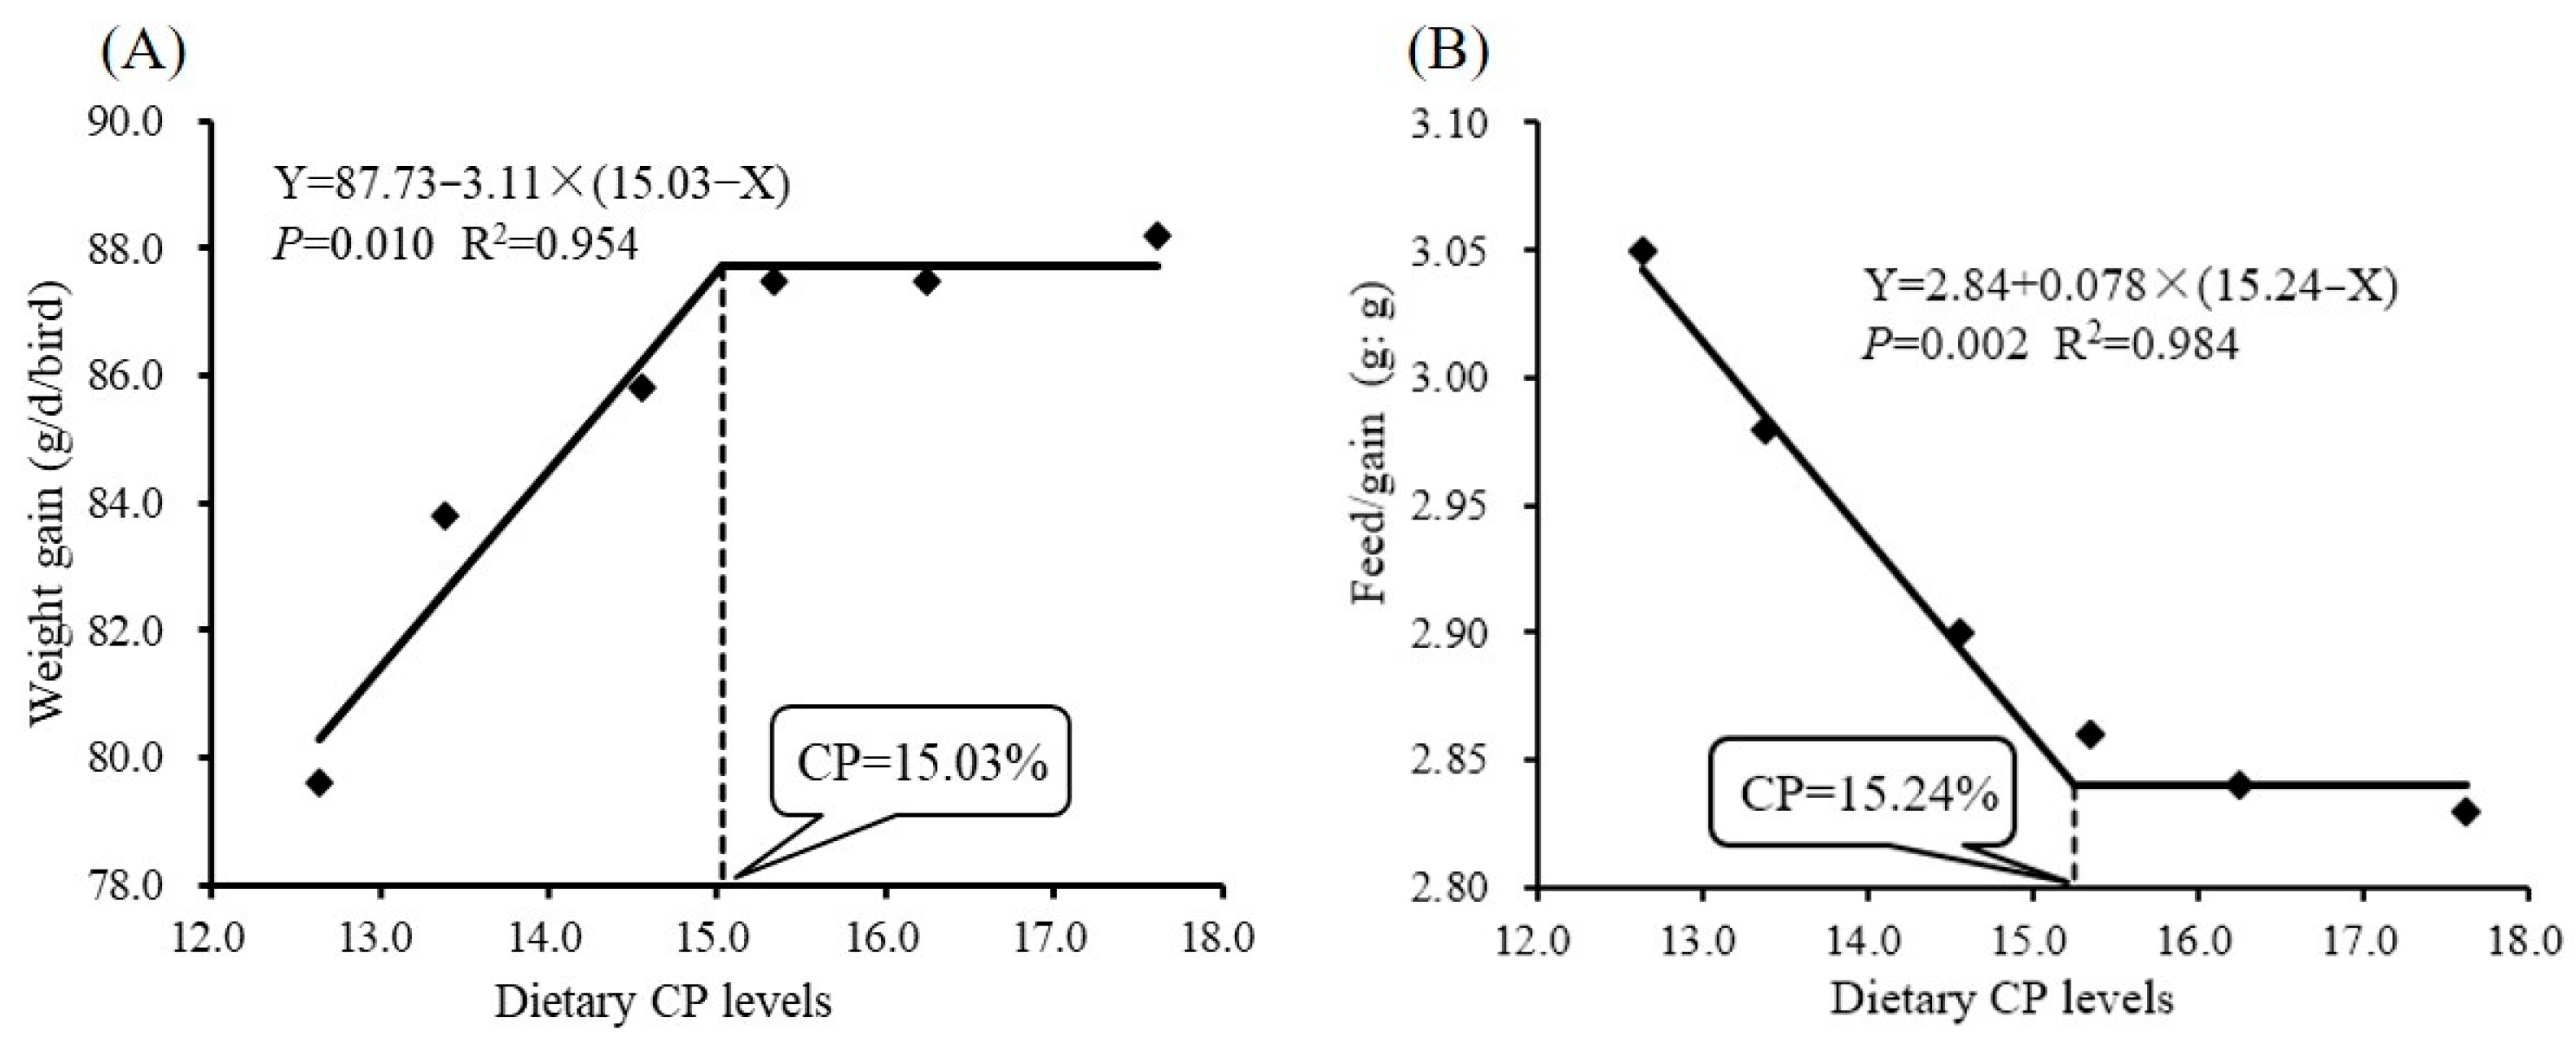
3.4. Dietary CP Requirement
4. Discussion
5. Conclusions
Author Contributions
Funding
Institutional Review Board Statement
Data Availability Statement
Conflicts of Interest
References
- Hou, S.; Liu, L. Waterfowl industry status, future development trend and suggestions in 2023. Chin. J. Anim. Sci. 2024, 60, 318–321. [Google Scholar]
- Ospina-Rojas, I.C.; Murakami, A.E.; Duarte, C.R.; Eyng, C.; Oliveira, C.A.; Janeiro, V. Valine, isoleucine, arginine and glycine supplementation of low-protein diets for broiler chickens during the starter and grower phases. Br. Poult. Sci. 2014, 55, 766–773. [Google Scholar] [CrossRef] [PubMed]
- Xie, M.; Jiang, Y.; Tang, J.; Wen, Z.G.; Zhang, Q.; Huang, W.; Hou, S.S. Effects of low-protein diets on growth performance and carcass yield of growing White Pekin ducks. Poult. Sci. 2017, 96, 1370–1375. [Google Scholar] [CrossRef] [PubMed]
- Zeng, Q.F.; Cherry, P.; Doster, A.; Murdoch, R.; Adeola, O.; Applegate, T.J. Effect of dietary energy and protein content on growth and carcass traits of Pekin ducks. Poult. Sci. 2015, 94, 384–394. [Google Scholar] [CrossRef] [PubMed]
- Wen, Z.G.; Du, Y.K.; Xie, M.; Li, X.M.; Wang, J.D.; Yang, P.L. Effects of low-protein diets on growth performance and carcass yields of growing French meat quails (France coturnix coturnix). Poult. Sci. 2017, 96, 1364–1369. [Google Scholar] [CrossRef] [PubMed]
- NRC. Nutrient Requirements of Poultry; National Academy of Sciences: Washington, DC, USA, 1994. [Google Scholar]
- Sinclair, K.D.; Allegrucci, C.; Singh, R.; Gardner, D.S.; Sebastian, S.; Bispham, J.; Thurston, A.; Huntley, J.F.; Rees, W.D.; Maloney, C.A.; et al. DNA methylation, insulin resistance, and blood pressure in offspring determined by maternal periconceptional B vitamin and methionine status. Proc. Natl. Acad. Sci. USA 2007, 104, 19351–19356. [Google Scholar] [CrossRef] [PubMed]
- Divakaran, S.; Obaldo, L.G.; Forster, I.P. Note on the Methods for Determination of Chromic Oxide in Shrimp Feeds. J. Agric. Food Chem. 2002, 50, 464–467. [Google Scholar] [CrossRef] [PubMed]
- Wen, Z.; Xie, M.; Fouad, A.; Tang, J.; Maqbool, U.; Huang, W.; Hou, S. effect of feed consumption levels on growth performance and apparent digestibility of nutrients in White Pekin ducks. J. Appl. Anim. Res. 2015, 43, 112–117. [Google Scholar] [CrossRef]
- Robbins, K.R.; Saxton, A.M.; Southern, L.L. Estimation of nutrient requirements using broken-line regression analysis. J. Anim. Sci. 2006, 84, E155–E165. [Google Scholar] [CrossRef] [PubMed]
- Burley, H.K.; Patterson, P.H.; Elliot, M.A. Effect of a reduced crude protein, amino acid-balanced diet on hen performance, production costs, and ammonia emissions in a commercial laying hen flock. J. Appl. Poult. Res. 2013, 22, 217–228. [Google Scholar] [CrossRef]
- Xie, M.; Jiang, Y.; Tang, J.; Zhang, Q.; Huang, W.; Hou, S.S. Starter and subsequent grower response of Pekin ducks to low-protein diets in starter phase. Livest. Sci. 2017, 203, 92–96. [Google Scholar] [CrossRef]
- Blake, J.P.; Hess, J.B. Changes in protein level for bobwhite quail. J. Appl. Poult. Res. 2013, 22, 511–515. [Google Scholar] [CrossRef]
- Siegert, W.; Ahmadi, H.; Rodehutscord, M. Meta-analysis of the influence of dietary glycine and serine, with consideration of methionine and cysteine, on growth and feed conversion of broilers. Poult. Sci. 2015, 94, 1853–1863. [Google Scholar] [CrossRef] [PubMed]
- Bregendahl, K.; Sell, J.L.; Zimmerman, D.R. Effect of low-protein diets on growth performance and body composition of broiler chicks. Poult. Sci. 2002, 81, 1156–1167. [Google Scholar] [CrossRef] [PubMed]
- Hernandez, F.; Lopez, M.; Martinez, S.; Megias, M.D.; Catala, P.; Madrid, J. Effect of low-protein diets and single sex on production performance, plasma metabolites, digestibility, and nitrogen excretion in 1- to 48-day-old broilers. Poult. Sci. 2012, 91, 683–692. [Google Scholar] [CrossRef] [PubMed]
- Such, N.; Pál, L.; Strifler, P.; Horváth, B.; Koltay, I.A.; Rawash, M.A.; Farkas, V.; Mezőlaki, Á.; Wágner, L.; Dublecz, K. Effect of Feeding Low Protein Diets on the Production Traits and the Nitrogen Composition of Excreta of Broiler Chickens. Agriculture 2021, 11, 781. [Google Scholar] [CrossRef]
- Ruan, D.; Fouad, A.M.; Fan, Q.; Xia, W.; Wang, S.; Chen, W.; Lin, C.; Wang, Y.; Yang, L.; Zheng, C. Effects of dietary methionine on productivity, reproductive performance, antioxidant capacity, ovalbumin and antioxidant-related gene expression in laying duck breeders. Br. J. Nutr. 2018, 119, 121–130. [Google Scholar] [CrossRef] [PubMed]
- Wu, Y.; Tang, J.; Wen, Z.; Zhang, B.; Cao, J.; Zhao, L.; Guo, Z.; Xie, M.; Zhou, Z.; Hou, S. Dietary methionine deficiency stunts growth and increases fat deposition via suppression of fatty acids transportation and hepatic catabolism in Pekin ducks. J. Anim. Sci. Biotechnol. 2022, 13, 61. [Google Scholar] [CrossRef] [PubMed]
- Zhang, Q.; Xu, L.; Doster, A.; Murdoch, R.; Cotter, P.; Gardner, A.; Applegate, T.J. Dietary threonine requirement of Pekin ducks from 15 to 35 days of age based on performance, yield, serum natural antibodies, and intestinal mucin secretion. Poult. Sci. 2014, 93, 1972–1980. [Google Scholar] [CrossRef] [PubMed]
- Zhang, Q.; Zeng, Q.F.; Cotter, P.; Applegate, T.J. Dietary threonine response of Pekin ducks from hatch to 14 d of age based on performance, serology, and intestinal mucin secretion. Poult. Sci. 2016, 95, 1348–1355. [Google Scholar] [CrossRef] [PubMed]

| Item | Dietary CP Levels (%) | |||||
|---|---|---|---|---|---|---|
| 17.5 | 16.5 | 15.5 | 14.5 | 13.5 | 12.5 | |
| Ingredients (%) | ||||||
| Corn | 66.10 | 69.16 | 72.22 | 75.28 | 78.34 | 81.40 |
| Soybean meal | 19.30 | 17.44 | 15.58 | 13.72 | 11.86 | 10.00 |
| Rapeseed meal | 8.00 | 6.80 | 5.60 | 4.40 | 3.20 | 2.00 |
| Soybean oil | 2.00 | 1.60 | 1.20 | 0.80 | 0.40 | 0.00 |
| Dicalcium phosphate | 1.30 | 1.39 | 1.48 | 1.57 | 1.66 | 1.75 |
| Limestone | 1.20 | 1.18 | 1.16 | 1.14 | 1.12 | 1.10 |
| Salt | 0.30 | 0.30 | 0.30 | 0.30 | 0.30 | 0.30 |
| DL-methionine | 0.15 | 0.16 | 0.17 | 0.18 | 0.19 | 0.20 |
| L-lysine•HCl | 0.15 | 0.20 | 0.26 | 0.31 | 0.37 | 0.42 |
| L-threonine | - | 0.03 | 0.07 | 0.10 | 0.14 | 0.17 |
| L-tryptophan | - | 0.01 | 0.02 | 0.03 | 0.04 | 0.05 |
| L-arginine | - | 0.06 | 0.12 | 0.18 | 0.24 | 0.30 |
| L-isoleucine | - | 0.03 | 0.06 | 0.10 | 0.13 | 0.16 |
| L-valine | - | 0.04 | 0.08 | 0.12 | 0.16 | 0.20 |
| L-Serine | - | 0.05 | 0.10 | 0.14 | 0.19 | 0.24 |
| Glycine | - | 0.04 | 0.08 | 0.13 | 0.17 | 0.21 |
| Chromium sesquioxide | 0.50 | 0.50 | 0.50 | 0.50 | 0.50 | 0.50 |
| Premix 1 | 1.00 | 1.00 | 1.00 | 1.00 | 1.00 | 1.00 |
| Total | 100.00 | 100.00 | 100.00 | 100.00 | 100.00 | 100.00 |
| Nutrient levels 2 | ||||||
| Metabolizable energy (MJ/kg) | 12.17 | 12.17 | 12.17 | 12.17 | 12.16 | 12.16 |
| Crude protein (%) | 17.61 | 16.25 | 15.34 | 14.55 | 13.38 | 12.64 |
| Calcium (%) | 0.86 | 0.86 | 0.86 | 0.86 | 0.86 | 0.86 |
| Total phosphorus (%) | 0.62 | 0.62 | 0.62 | 0.62 | 0.62 | 0.62 |
| Non-phytate phosphorus (%) | 0.35 | 0.36 | 0.38 | 0.40 | 0.41 | 0.43 |
| Methionine (%) | 0.44 | 0.44 | 0.44 | 0.43 | 0.43 | 0.42 |
| Methionine + cystine (%) | 0.78 | 0.76 | 0.73 | 0.71 | 0.71 | 0.70 |
| Lysine (%) | 0.94 | 0.94 | 0.93 | 0.92 | 0.92 | 0.91 |
| Threonine (%) | 0.69 | 0.68 | 0.67 | 0.66 | 0.65 | 0.64 |
| Tryptophan (%) | 0.20 | 0.20 | 0.19 | 0.19 | 0.18 | 0.18 |
| Arginine (%) | 1.02 | 1.01 | 1.00 | 0.99 | 0.98 | 0.97 |
| Valine (%) | 0.77 | 0.77 | 0.76 | 0.76 | 0.75 | 0.74 |
| Isoleucine (%) | 0.62 | 0.61 | 0.60 | 0.59 | 0.58 | 0.57 |
| Serine + glycine (%) | 1.58 | 1.58 | 1.56 | 1.56 | 1.54 | 1.54 |
| Phenylalanine (%) | 0.85 | 0.80 | 0.75 | 0.70 | 0.65 | 0.60 |
| Phenylalanine + tyrosine (%) | 1.46 | 1.38 | 1.29 | 1.20 | 1.13 | 1.04 |
| Cage Layer | Dietary CP Levels (%) | Body Weight (g/bird) | Weight Gain (g/d/bird) | Feed Intake (g/d/bird) | Feed/Gain (g:g) | Mortality (%) |
|---|---|---|---|---|---|---|
| Lower | 17.61 | 2895 | 86.1 | 242.7 | 2.82 | 0 |
| 16.25 | 2876 | 85.2 | 241.5 | 2.83 | 0 | |
| 15.34 | 2820 | 84.5 | 243.0 | 2.88 | 1.11 | |
| 14.55 | 2840 | 83.5 | 241.2 | 2.89 | 1.11 | |
| 13.38 | 2732 | 79.7 | 239.6 | 3.01 | 2.22 | |
| 12.64 | 2700 | 77.1 | 237.4 | 3.08 | 0 | |
| Middle | 17.61 | 2955 | 89.2 | 252.0 | 2.82 | 0 |
| 16.25 | 2967 | 88.9 | 252.0 | 2.83 | 0 | |
| 15.34 | 2958 | 88.8 | 251.8 | 2.84 | 0 | |
| 14.55 | 2890 | 86.8 | 250.4 | 2.89 | 1.11 | |
| 13.38 | 2877 | 86.2 | 253.0 | 2.94 | 0 | |
| 12.64 | 2751 | 81.2 | 243.8 | 3.01 | 1.11 | |
| Upper | 17.61 | 2989 | 89.3 | 254.2 | 2.85 | 0 |
| 16.25 | 2932 | 88.5 | 253.2 | 2.86 | 0 | |
| 15.34 | 2963 | 89.2 | 254.4 | 2.85 | 0 | |
| 14.55 | 2924 | 87.2 | 253.9 | 2.91 | 0 | |
| 13.38 | 2890 | 85.6 | 255.8 | 2.99 | 0 | |
| 12.64 | 2747 | 80.6 | 246.7 | 3.06 | 1.11 | |
| Pooled SEM | 22 | 0.9 | 1.4 | 0.03 | 0.67 | |
| Main effects | ||||||
| Cage layer | Lower | 2811 b | 82.7 b | 240.9 c | 2.92 | 0.19 |
| Middle | 2900 a | 86.9 a | 250.5 b | 2.89 | 0.37 | |
| Upper | 2908 a | 86.7 a | 253.0 a | 2.92 | 0.74 | |
| Pooled SEM | 9 | 0.4 | 0.6 | 0.01 | 0.27 | |
| Dietary CP level (%) | 17.61 | 2946 a | 88.2 a | 249.7 a | 2.83 b | 0 |
| 16.25 | 2925 a,b | 87.5 a,b | 248.9 a | 2.84 b | 0 | |
| 15.34 | 2913 a,b | 87.5 a,b | 249.7 a | 2.86 b | 0.37 | |
| 14.55 | 2885 b,c | 85.8 b,c | 248.5 a | 2.90 b | 0.74 | |
| 13.38 | 2833 c | 83.8 c | 249.5 a | 2.98 a | 0.74 | |
| 12.64 | 2733 d | 79.6 d | 242.6 b | 3.05 a | 0.74 | |
| Pooled SEM | 13 | 0.5 | 0.8 | 0.02 | 0.39 | |
| p-value | ||||||
| Two-way ANOVA | Cage layer | <0.001 | <0.001 | <0.001 | 0.180 | 0.3505 |
| Dietary CP level | <0.001 | <0.001 | <0.001 | <0.001 | 0.4987 | |
| Cage layer × Dietary CP level | 0.117 | 0.830 | 0.510 | 0.974 | 0.4009 | |
| Polynomial Contrast | Linear (CP) | <0.001 | <0.001 | 0.010 | <0.001 | - |
| Quadratic (CP) | <0.001 | <0.001 | 0.053 | <0.001 | - | |
| Cage Layer | Dietary CP Levels (%) | Breast Meat | Leg Meat | Abdominal Fat | |||
|---|---|---|---|---|---|---|---|
| Weight (g) | Yield (%) | Weight (g) | Yield (%) | Weight (g) | Yield (%) | ||
| Lower | 17.61 | 290.5 | 10.02 | 246.5 | 8.52 | 44.7 | 1.54 |
| 16.25 | 291.3 | 10.13 | 250.5 | 8.71 | 44.7 | 1.55 | |
| 15.34 | 271.0 | 9.61 | 239.7 | 8.50 | 45.0 | 1.60 | |
| 14.55 | 282.8 | 9.95 | 242.0 | 8.52 | 46.2 | 1.63 | |
| 13.38 | 276.2 | 10.12 | 239.0 | 8.74 | 46.7 | 1.71 | |
| 12.64 | 276.5 | 10.24 | 228.5 | 8.44 | 47.8 | 1.77 | |
| Middle | 17.61 | 293.5 | 9.94 | 249.0 | 8.43 | 45.8 | 1.55 |
| 16.25 | 307.7 | 10.37 | 257.0 | 8.67 | 47.0 | 1.59 | |
| 15.34 | 294.0 | 9.94 | 263.5 | 8.91 | 46.8 | 1.58 | |
| 14.55 | 296.5 | 10.26 | 246.0 | 8.51 | 48.0 | 1.66 | |
| 13.38 | 287.5 | 9.99 | 252.3 | 8.76 | 49.3 | 1.71 | |
| 12.64 | 280.7 | 10.21 | 243.5 | 8.86 | 49.0 | 1.78 | |
| Upper | 17.61 | 309.0 | 10.34 | 264.0 | 8.83 | 46.7 | 1.56 |
| 16.25 | 286.8 | 9.78 | 243.5 | 8.31 | 46.2 | 1.58 | |
| 15.34 | 294.7 | 9.96 | 245.5 | 8.30 | 47.7 | 1.61 | |
| 14.55 | 307.7 | 10.54 | 256.2 | 8.77 | 48.2 | 1.65 | |
| 13.38 | 292.3 | 10.12 | 239.5 | 8.29 | 48.7 | 1.68 | |
| 12.64 | 269.2 | 9.83 | 237.5 | 8.67 | 47.2 | 1.72 | |
| Pooled SEM | 8.3 | 0.30 | 8.2 | 0.29 | 1.3 | 0.05 | |
| Main effects | |||||||
| Cage layer | Lower | 281.4 b | 10.01 | 241.0 | 8.57 | 45.8 b | 1.63 |
| Middle | 293.3 a | 10.12 | 251.9 | 8.69 | 47.7 a | 1.65 | |
| Upper | 293.3 a | 10.09 | 247.7 | 8.53 | 47.4 a,b | 1.63 | |
| Pooled SEM | 3.4 | 0.12 | 3.4 | 0.12 | 0.5 | 0.02 | |
| Dietary CP levels (%) | 17.61 | 297.7 a | 10.1 | 253.2 | 8.59 | 45.7 | 1.55 c |
| 16.25 | 295.3 a | 10.09 | 250.3 | 8.56 | 45.9 | 1.57 c | |
| 15.34 | 286.6 a,b | 9.83 | 249.6 | 8.57 | 46.5 | 1.60 b,c | |
| 14.55 | 295.7 a | 10.25 | 248.1 | 8.60 | 47.4 | 1.65 a,b,c | |
| 13.38 | 285.3 a,b | 10.07 | 243.6 | 8.60 | 48.2 | 1.70 a,b | |
| 12.64 | 275.4 b | 10.09 | 236.5 | 8.65 | 48.0 | 1.76 a | |
| Pooled SEM | 4.8 | 0.17 | 4.7 | 0.17 | 0.8 | 0.03 | |
| p-value | |||||||
| Two-way ANOVA | Cage layer | 0.020 | 0.808 | 0.074 | 0.606 | 0.039 | 0.862 |
| Dietary CP levels | 0.016 | 0.693 | 0.170 | 0.999 | 0.097 | <0.001 | |
| Cage layer × Dietary CP | 0.380 | 0.743 | 0.606 | 0.736 | 0.987 | 0.998 | |
| Polynomial Contrast | Linear (CP) | 0.002 | 0.856 | 0.011 | 0.759 | 0.003 | <0.001 |
| Quadratic (CP) | 0.303 | 0.744 | 0.378 | 0.786 | 0.907 | 0.093 | |
| Cage Layer | Dietary CP Levels (%) | CP Intake (g/d/bird) | Nitrogen Intake (g/d/bird) | Nitrogen Excretion (g/d/bird) |
|---|---|---|---|---|
| Lower | 17.61 | 42.7 | 6.82 | 1.51 a |
| 16.25 | 39.2 | 6.24 | 1.35 c,d | |
| 15.34 | 37.3 | 5.95 | 1.18 f | |
| 14.55 | 35.1 | 5.59 | 1.12 f,g | |
| 13.38 | 32.1 | 5.10 | 0.96 i | |
| 12.64 | 30.0 | 4.75 | 0.81 j | |
| Middle | 17.61 | 44.4 | 7.09 | 1.51 a |
| 16.25 | 41.0 | 6.59 | 1.39 b,c | |
| 15.34 | 38.6 | 6.20 | 1.26 e | |
| 14.55 | 36.4 | 5.76 | 1.17 f | |
| 13.38 | 33.9 | 5.47 | 1.08 g,h | |
| 12.64 | 30.8 | 4.93 | 0.84 j | |
| Upper | 17.61 | 44.8 | 7.08 | 1.44 b |
| 16.25 | 41.1 | 6.50 | 1.32 d,e | |
| 15.34 | 39.0 | 6.19 | 1.26 e | |
| 14.55 | 36.9 | 5.99 | 1.18 f | |
| 13.38 | 34.2 | 5.49 | 1.04 h | |
| 12.64 | 31.2 | 5.09 | 0.96 i | |
| Pooled SEM | 0.2 | 0.04 | 0.02 | |
| Main effects | ||||
| Cage layer | Lower | 36.1 c | 5.74 b | 1.16 |
| Middle | 37.5 b | 6.01 a | 1.21 | |
| Upper | 37.9 a | 6.06 a | 1.20 | |
| Pooled SEM | 0.1 | 0.02 | 0.01 | |
| Dietary CP levels (%) | 17.61 | 44.0 a | 7.00 a | 1.49 |
| 16.25 | 40.4 b | 6.44 b | 1.35 | |
| 15.34 | 38.3 c | 6.11 c | 1.23 | |
| 14.55 | 36.2 d | 5.78 d | 1.15 | |
| 13.38 | 33.4 e | 5.35 e | 1.03 | |
| 12.64 | 30.7 f | 4.92 f | 0.87 | |
| Pooled SEM | 0.1 | 0.03 | 0.01 | |
| p-value | ||||
| Two-way ANOVA | Cage layer | <0.001 | <0.001 | <0.001 |
| Dietary CP levels | <0.001 | <0.001 | <0.001 | |
| Cage layer × Dietary CP | 0.449 | 0.067 | 0.001 | |
| Polynomial Contrast | Linear (CP) | <0.001 | <0.001 | <0.001 |
| Quadratic (CP) | 0.115 | 0.435 | 0.064 | |
| Cage Layer | Dietary CP Levels (%) | Metabolizable Energy (%) | Crude Protein (%) | Dry Matter (%) |
|---|---|---|---|---|
| Lower | 17.61 | 84.9 | 77.8 h | 82.0 |
| 16.25 | 85.4 | 78.3 g,h | 81.6 | |
| 15.34 | 85.5 | 80.2 b,c,d | 82.5 | |
| 14.55 | 86.2 | 80.0 c,d,e | 84.0 | |
| 13.38 | 86.3 | 81.1 b,c | 83.8 | |
| 12.64 | 86.7 | 82.9 a | 84.1 | |
| Middle | 17.61 | 85.1 | 78.7 f,g,h | 82.5 |
| 16.25 | 85.5 | 78.9 e,f,g | 83.1 | |
| 15.34 | 85.6 | 79.7 d,e,f | 82.6 | |
| 14.55 | 86.0 | 79.7 d,e,f | 83.3 | |
| 13.38 | 86.5 | 80.3 b,c,d | 83.8 | |
| 12.64 | 86.9 | 83.0 a | 84.2 | |
| Upper | 17.61 | 84.8 | 79.6 d,e,f | 82.4 |
| 16.25 | 84.9 | 79.7 d,e,f | 82.3 | |
| 15.34 | 85.7 | 79.6 d,e,f | 82.8 | |
| 14.55 | 86.4 | 80.4 b,c,d | 83.8 | |
| 13.38 | 86.1 | 81.0 b,c | 83.8 | |
| 12.64 | 86.6 | 81.2 b | 84.6 | |
| Pooled SEM | 0.3 | 0.3 | 0.3 | |
| Main effects | ||||
| Cage layer | Lower | 85.8 | 80.1 | 83.0 |
| Middle | 86.0 | 80.1 | 83.3 | |
| Upper | 85.7 | 80.3 | 83.3 | |
| Pooled SEM | 0.1 | 0.1 | 0.1 | |
| Dietary CP levels (%) | 17.61 | 84.9 d | 78.7 | 82.3 b |
| 16.25 | 85.3 c,d | 79.0 | 82.3 b | |
| 15.34 | 85.6 b,c | 79.8 | 82.6 b | |
| 14.55 | 86.2 a,b | 80.0 | 83.7 a | |
| 13.38 | 86.3 a | 80.8 | 83.8 a | |
| 12.64 | 86.7 a | 82.4 | 84.3 a | |
| Pooled SEM | 0.1 | 0.2 | 0.2 | |
| p-value | ||||
| Two-way ANOVA | Cage layer | 0.360 | 0.522 | 0.163 |
| Dietary CP levels | <0.001 | <0.001 | <0.001 | |
| Cage layer × Dietary CP | 0.860 | 0.002 | 0.083 | |
| Polynomial Contrast | Linear (CP) | <0.001 | <0.001 | <0.001 |
| Quadratic (CP) | 0.939 | 0.010 | 0.079 | |
| Response Criteria | Cage Layer | Broken-Line Models 1 | R2 | p-Value | Dietary CP Requirement (%) |
|---|---|---|---|---|---|
| Weight gain | Lower | Y = 85.27 − 3.34 × (15.07 − X) | 0.979 | 0.003 | 15.07 ± 0.28 |
| Middle | Y = 88.97 − 2.71 × (15.08 − X) | 0.884 | 0.040 | 15.08 ± 0.69 | |
| Upper | Y = 89.00 − 3.27 × (14.91 − X) | 0.928 | 0.022 | 14.91 ± 0.48 | |
| Feed/gain | Lower | Y = 2.83 + 0.078 × (15.76 − X) | 0.971 | 0.005 | 15.76 ± 0.35 |
| Middle | Y = 2.83 + 0.060 × (15.57 − X) | 0.986 | 0.002 | 15.57 ± 0.23 | |
| Upper | Y = 2.85 + 0.078 × (15.24 − X) | 0.995 | <0.001 | 15.24 ± 0.14 |
Disclaimer/Publisher’s Note: The statements, opinions and data contained in all publications are solely those of the individual author(s) and contributor(s) and not of MDPI and/or the editor(s). MDPI and/or the editor(s) disclaim responsibility for any injury to people or property resulting from any ideas, methods, instructions or products referred to in the content. |
© 2024 by the authors. Licensee MDPI, Basel, Switzerland. This article is an open access article distributed under the terms and conditions of the Creative Commons Attribution (CC BY) license (https://creativecommons.org/licenses/by/4.0/).
Share and Cite
Wu, Y.; Feng, Y.; Cao, J.; Jiang, Y.; Wang, Q.; Hou, S.; Wen, Z. Dietary Crude Protein Reduction with Addition of Crystalline Amino Acids in Growing Pekin Ducks Housed in Cascading Cages: Influence on Growth Performance, Carcass Traits, and Apparent Nutrient Digestibility. Agriculture 2024, 14, 1102. https://doi.org/10.3390/agriculture14071102
Wu Y, Feng Y, Cao J, Jiang Y, Wang Q, Hou S, Wen Z. Dietary Crude Protein Reduction with Addition of Crystalline Amino Acids in Growing Pekin Ducks Housed in Cascading Cages: Influence on Growth Performance, Carcass Traits, and Apparent Nutrient Digestibility. Agriculture. 2024; 14(7):1102. https://doi.org/10.3390/agriculture14071102
Chicago/Turabian StyleWu, Yongbao, Yulong Feng, Junting Cao, Yong Jiang, Qimeng Wang, Shuisheng Hou, and Zhiguo Wen. 2024. "Dietary Crude Protein Reduction with Addition of Crystalline Amino Acids in Growing Pekin Ducks Housed in Cascading Cages: Influence on Growth Performance, Carcass Traits, and Apparent Nutrient Digestibility" Agriculture 14, no. 7: 1102. https://doi.org/10.3390/agriculture14071102
APA StyleWu, Y., Feng, Y., Cao, J., Jiang, Y., Wang, Q., Hou, S., & Wen, Z. (2024). Dietary Crude Protein Reduction with Addition of Crystalline Amino Acids in Growing Pekin Ducks Housed in Cascading Cages: Influence on Growth Performance, Carcass Traits, and Apparent Nutrient Digestibility. Agriculture, 14(7), 1102. https://doi.org/10.3390/agriculture14071102