Article

Assessment of Spatiotemporal Distribution of Herbicides in European Agricultural Land Using Agri-Environmental Indices

by
Vassilios Triantafyllidis
Department of Food Science & Technology, University of Patras, Ch. Trikoupi, 30100 Agrinio, Greece
Agriculture 2024, 14(7), 1171; https://doi.org/10.3390/agriculture14071171
Submission received: 26 May 2024 / Revised: 4 July 2024 / Accepted: 16 July 2024 / Published: 17 July 2024
(This article belongs to the Section Crop Protection, Diseases, Pests and Weeds)

Abstract

:
Short-term estimates are not suitable for monitoring and comparing fluctuating pesticide use in EU agricultural land. A discriminative and comparable (HI) herbicide index was evaluated to elucidate herbicide use in the 21st century. The HI was 0.66 kg of active substances per hectare of conventional agricultural land across the EU. However, the HI varied between the 27 EU Member States. The highest mean values of HI were observed in Belgium, the Netherlands, Cyprus, Germany, France, and Denmark, with the lowest in Romania, Greece, Bulgaria, and Latvia. The results showed that the distribution of the HI variable was independent of the geographical location of each country, such as from North to South or from West to East in the EU. It seems that country-level agri-environmental parameters ultimately influenced the herbicide use. To assess the causes of this variability, 31 agri-environmental parameters (formatted into indices to be comparable) were investigated, emphasizing the structural characteristics of the agricultural sector in each EU Member State. Using only the significant independent variables (13 out of 31), linear discriminant analysis (LDA) was applied to explore the differentiation potential of EU27 by creating a discrimination model. The assessment of each one variable in the HI could contribute to the reduction in environmental impacts and the faultless implementation of the European agricultural policy in the near future.

1. Introduction

Herbicides and their use are an important aspect of modern weed management techniques among many methods for solving most weed problems. Although in recent decades the use of chemical herbicides has also contributed to the increase in European food production, herbicides are no longer considered friendly, but rather a threat to humans due to their irresponsible use. Thus, intensive use of herbicides causes risks to human health, pollution of water and soil resources, loss of biodiversity, and a headache to farmers due to the loss of productivity and economic losses caused by herbicide-resistant weed populations [1]. Herbicides account for more than 30% of all pesticides used in the EU [2]. In this context, each of the 27 EU Member States has drawn up a national action plan for sustainable weed management, applying multiple control tactics and alternative methods to combat weed infestations, including integrated weed management (IWM) as well as biological methods for weed control in agricultural land and urban or other areas [3].
Data obtained for the period 2000–2021 by the FAO (Food and Agriculture Organization) showed that the EU agricultural land, where the herbicides were widely used, was covered by 162,907,753 hectares, reduced by 10.8%, compared to 2000. Most of this EU agricultural land was covered by cropland (68.7%), presenting a decrease of 9.4% for the above examined period [4]. Despite the reduction in agricultural land in the EU (from 2000 to 2021) as well as the implementation of the above actions aimed at reducing the use of herbicides at the national level, sales of herbicides increased by approximately 11.9% from 2000 to 2021 in the 27 EU Member States [5]. Antier et al. [6] reported that the most widespread used herbicide in the world with the active substance glyphosate increased its total sales in the EU28 countries by 6% from 2013 to 2017.
Herbicide use on agricultural land is influenced by numerous agro-environmental parameters such as agricultural land use (e.g., crop land versus pastureland), farming systems (e.g., organic versus conventional), land cover (e.g., horticultural versus industrial crops), growing season, herbicide chemical families, herbicide-resistant weeds, farming structure, climate conditions, herbicide cost, and EU environmental legislation, as reported in previous studies [7,8,9]. The environmental footprint of herbicides used on European farmland depends mainly on the activity of herbicides (herbicide companies), the environmental impact of active substances (environmental legislation and EU authorities) and a series of farmers’ decisions, who are the end users of herbicides. Previous studies have reported that it is difficult to obtain accurate data on herbicide use. However, pesticide sale statistics could be used under certain conditions, limiting their disadvantages [3,9,10]. Thus, national data of herbicide sale statistics available from the FAO since 1990 were used to assess the progress of herbicide use in the 21st century in the EU.
Another defining point of this effort that has attracted the attention of many authors is that the available information (herbicide sale/use of herbicides or other pesticides) does not equate to their exclusive use on agricultural land [6,9,10,11,12,13]. A small amount of pesticides are also applied to other areas such as lawns, gardens, railways, urban amenity areas, etc. In a recent US market survey of herbicide spending in different sectors, it was reported that 85% was spent on agriculture, 8% on industrial/commercial/government, and 7% on the home and garden sector [11]. Previous studies [12,13] estimated that approximately 10% of pesticides are applied to non-agricultural land, with herbicide application being dominant, in developed countries. Also, the US Pesticide Market Survey reported that among widely used pesticides, twelve (12) of the twenty-five (25) active substances (a.s.) were herbicides (glyphosate > Atrazine > Metolachlor-S > 2,4-D > Acetochlor > pendimethalin > Metolachlor > Propanil > Dicamba > trifluralin > Paraquat > Glufosinate), with glyphosate being the most commonly used [11]. In a previous study, Woodburn [14] showed that global glyphosate use, developed in the early 1970s, in non-crop areas was increased from 5.7% in 1994 to 8.1% in 1996. At the same time, an average annual volume consumption of 20% in recent years has been recorded in agricultural use. In 2008, glyphosate was reported as the main herbicide applied in non-agricultural land in seven European countries [15]. Eight years later, this herbicide continued to be the most widely used globally, with its application in agricultural and non-agricultural settings at 90% and 10%, respectively [16]. By 2020, the percentage of glyphosate sales used in the non-agricultural sector in the EU28 averaged 9%, while this varied greatly among EU countries, ranging from 2% in Austria to 40% in Belgium [6]. This variation in glyphosate use among the EU countries is mainly due to alternative weed control methods in national, regional, or local regulations and policies of herbicides use in non-agricultural/urban amenity areas [15]. Following the above studies, it is estimated that up to 9% of herbicides are applied to non-agricultural land in the EU. Since the European Union supports sustainable agriculture, understanding and evaluating the above agro-environmental parameters affecting herbicide use is expected to contribute to the reduction in pesticide use, through targeted agricultural policy measures.
Considering the aforementioned, this effort aims to assess the use of herbicides on EU agricultural land, with a comparative herbicide index (HI). Priority was given to the evaluation of the spatiotemporal distribution of herbicides, as well as to the distinction of the agro-environmental variables that influence this intensive use, among 27 EU Member States. The interaction of HI with key agro-environmental variables such as (a) agricultural land use, (b) farming systems, (c) farm size classification, (d) agricultural land cover types, (e) classification of herbicides by chemical family, and (f) long-term herbicide use was examined. Finally, a discriminant model was designed and tested that can incorporate the crucial indices shaping herbicide use in the 27 EU Member States. The interpretation of the model results can be used as a control/support tool in order to reduce herbicide use and their adverse environmental impact on EU agricultural land.

2. Data Analysis and Methods

2.1. Study Area

The European agricultural land of the 27 Member States (EU27) was the study area. The following country codes for EU countries have been used in the text according to ISO 3166 [17] (except Greece, for which EL is recommended instead of the ISO GR code): Austria (AT); Belgium (BE); Bulgaria (BG); Croatia (HR); Cyprus (CY); Czechia (CZ); Denmark (DK); Estonia (EE); Finland (FI); France (FR); Germany (DE); Greece (EL); Hungary (HU); Ireland (IE); Italy (IT); Latvia (LV); Lithuania (LT); Luxemburg (LU); Malta (MT); the Netherlands (NL); Poland (PL); Portugal (PT); Romania (RO); Slovakia (SK); Slovenia (SI); Spain (ES); Sweden (SE).

2.2. Data Collection

Data of the agricultural sector for the 27 EU Member States were collected from three major statistical databases (FAOSTAT, Eurostat, and FiBL Statistics) for the period 2000–2021 and are described in Figure 1.
The selected agri-environmental indicators used in this study to assess herbicide use in the EU agricultural sector are analyzed below. About half (44%) of the world’s habitable land is agricultural land (AL) [18] used for permanent crops, arable crops, and livestock rearing in the form of land (pastureland—pmL) under permanent meadows and pastures and can be described as follows:
(i)
Based on land use, agricultural land (AL) can be divided into three (3) categories as follows (see list of abbreviations):
A L = a r L + p c L + p m L
where pmL is land in long-term use (≥5 years) to grow herbaceous fodder, forage crops, through cultivation (sown) or naturally (self-seeded). However, the sum of pcL (land under permanent crops) and arL (arable land) makes up the crop land area (cropL), so
A L = c r o p L + p m L
In the calculations, the ratios of each agricultural land use (ha) to the total agricultural land (ha) were used, forming the IcropL (cropland index) and the IpmL (pastureland index), respectively.
(ii)
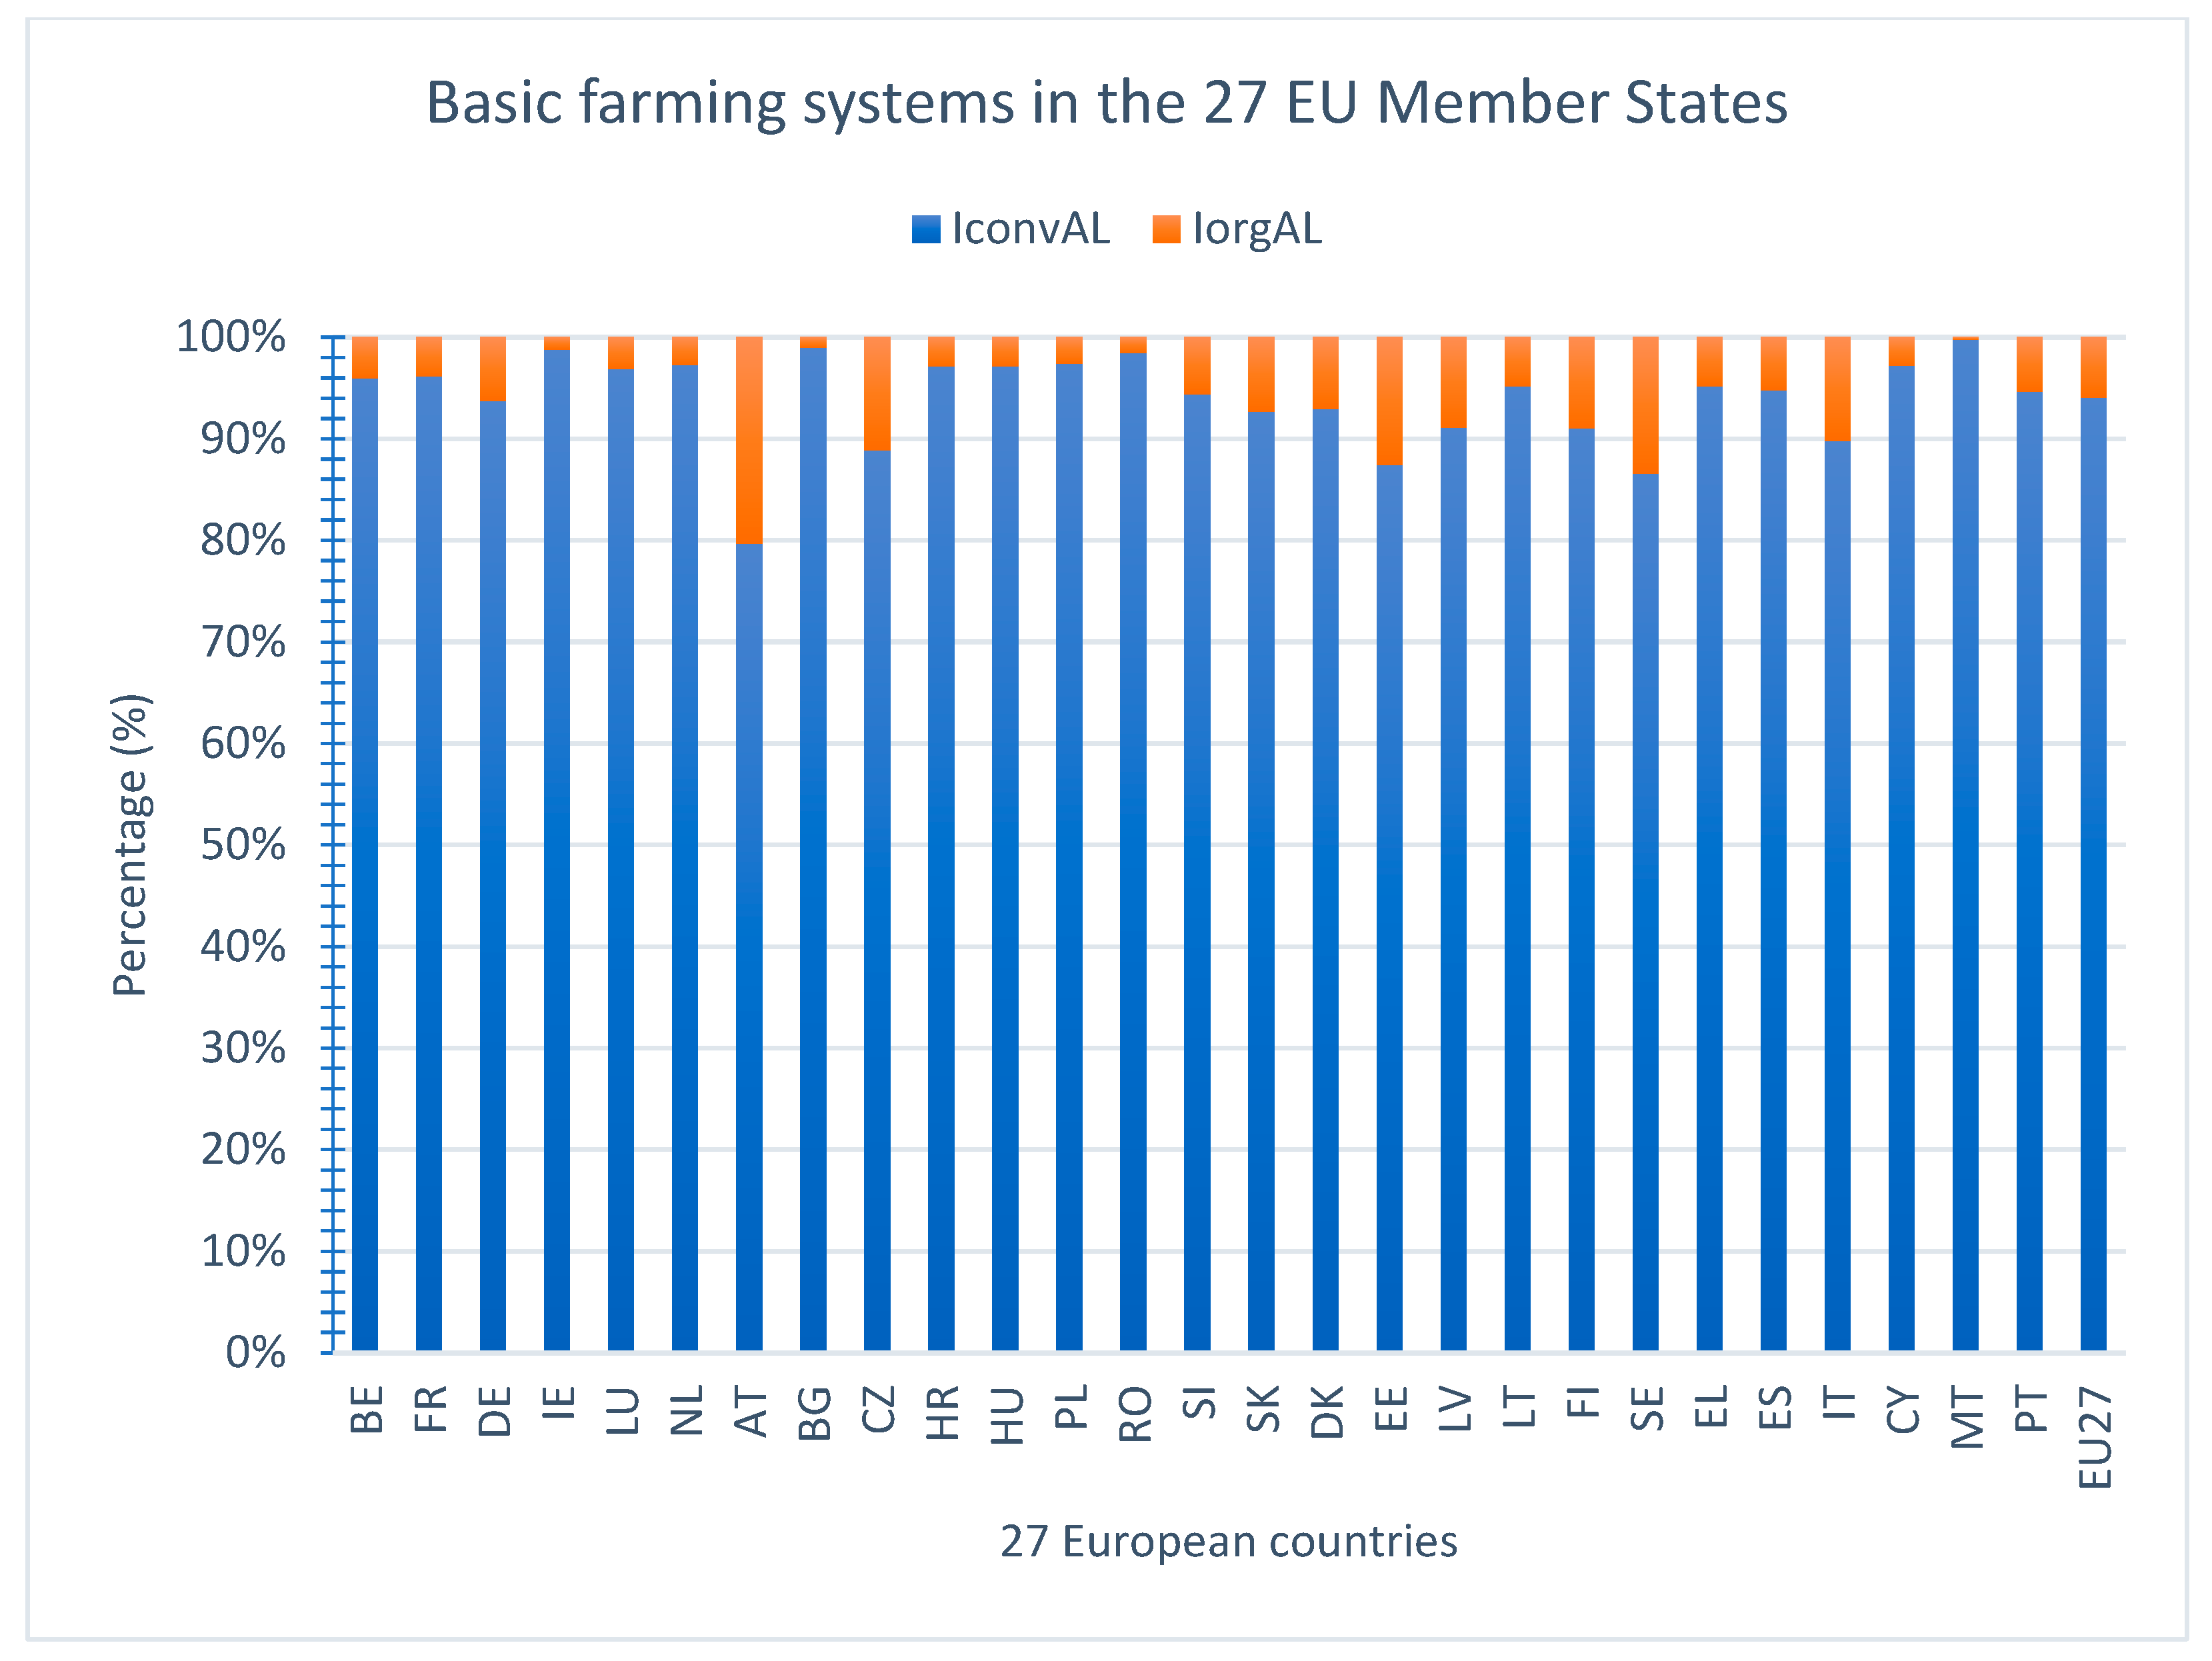
Based on farming systems, AL (agricultural land) can be divided into 2 categories as follows (see list of abbreviations):
A L = c o n v A L + o r g A L
In the calculations, the ratios of each farming systems (ha) to total agricultural land (ha) were used, forming the IconvAL (conventional AL index) and the IorgAL (organic AL index).
(iii)
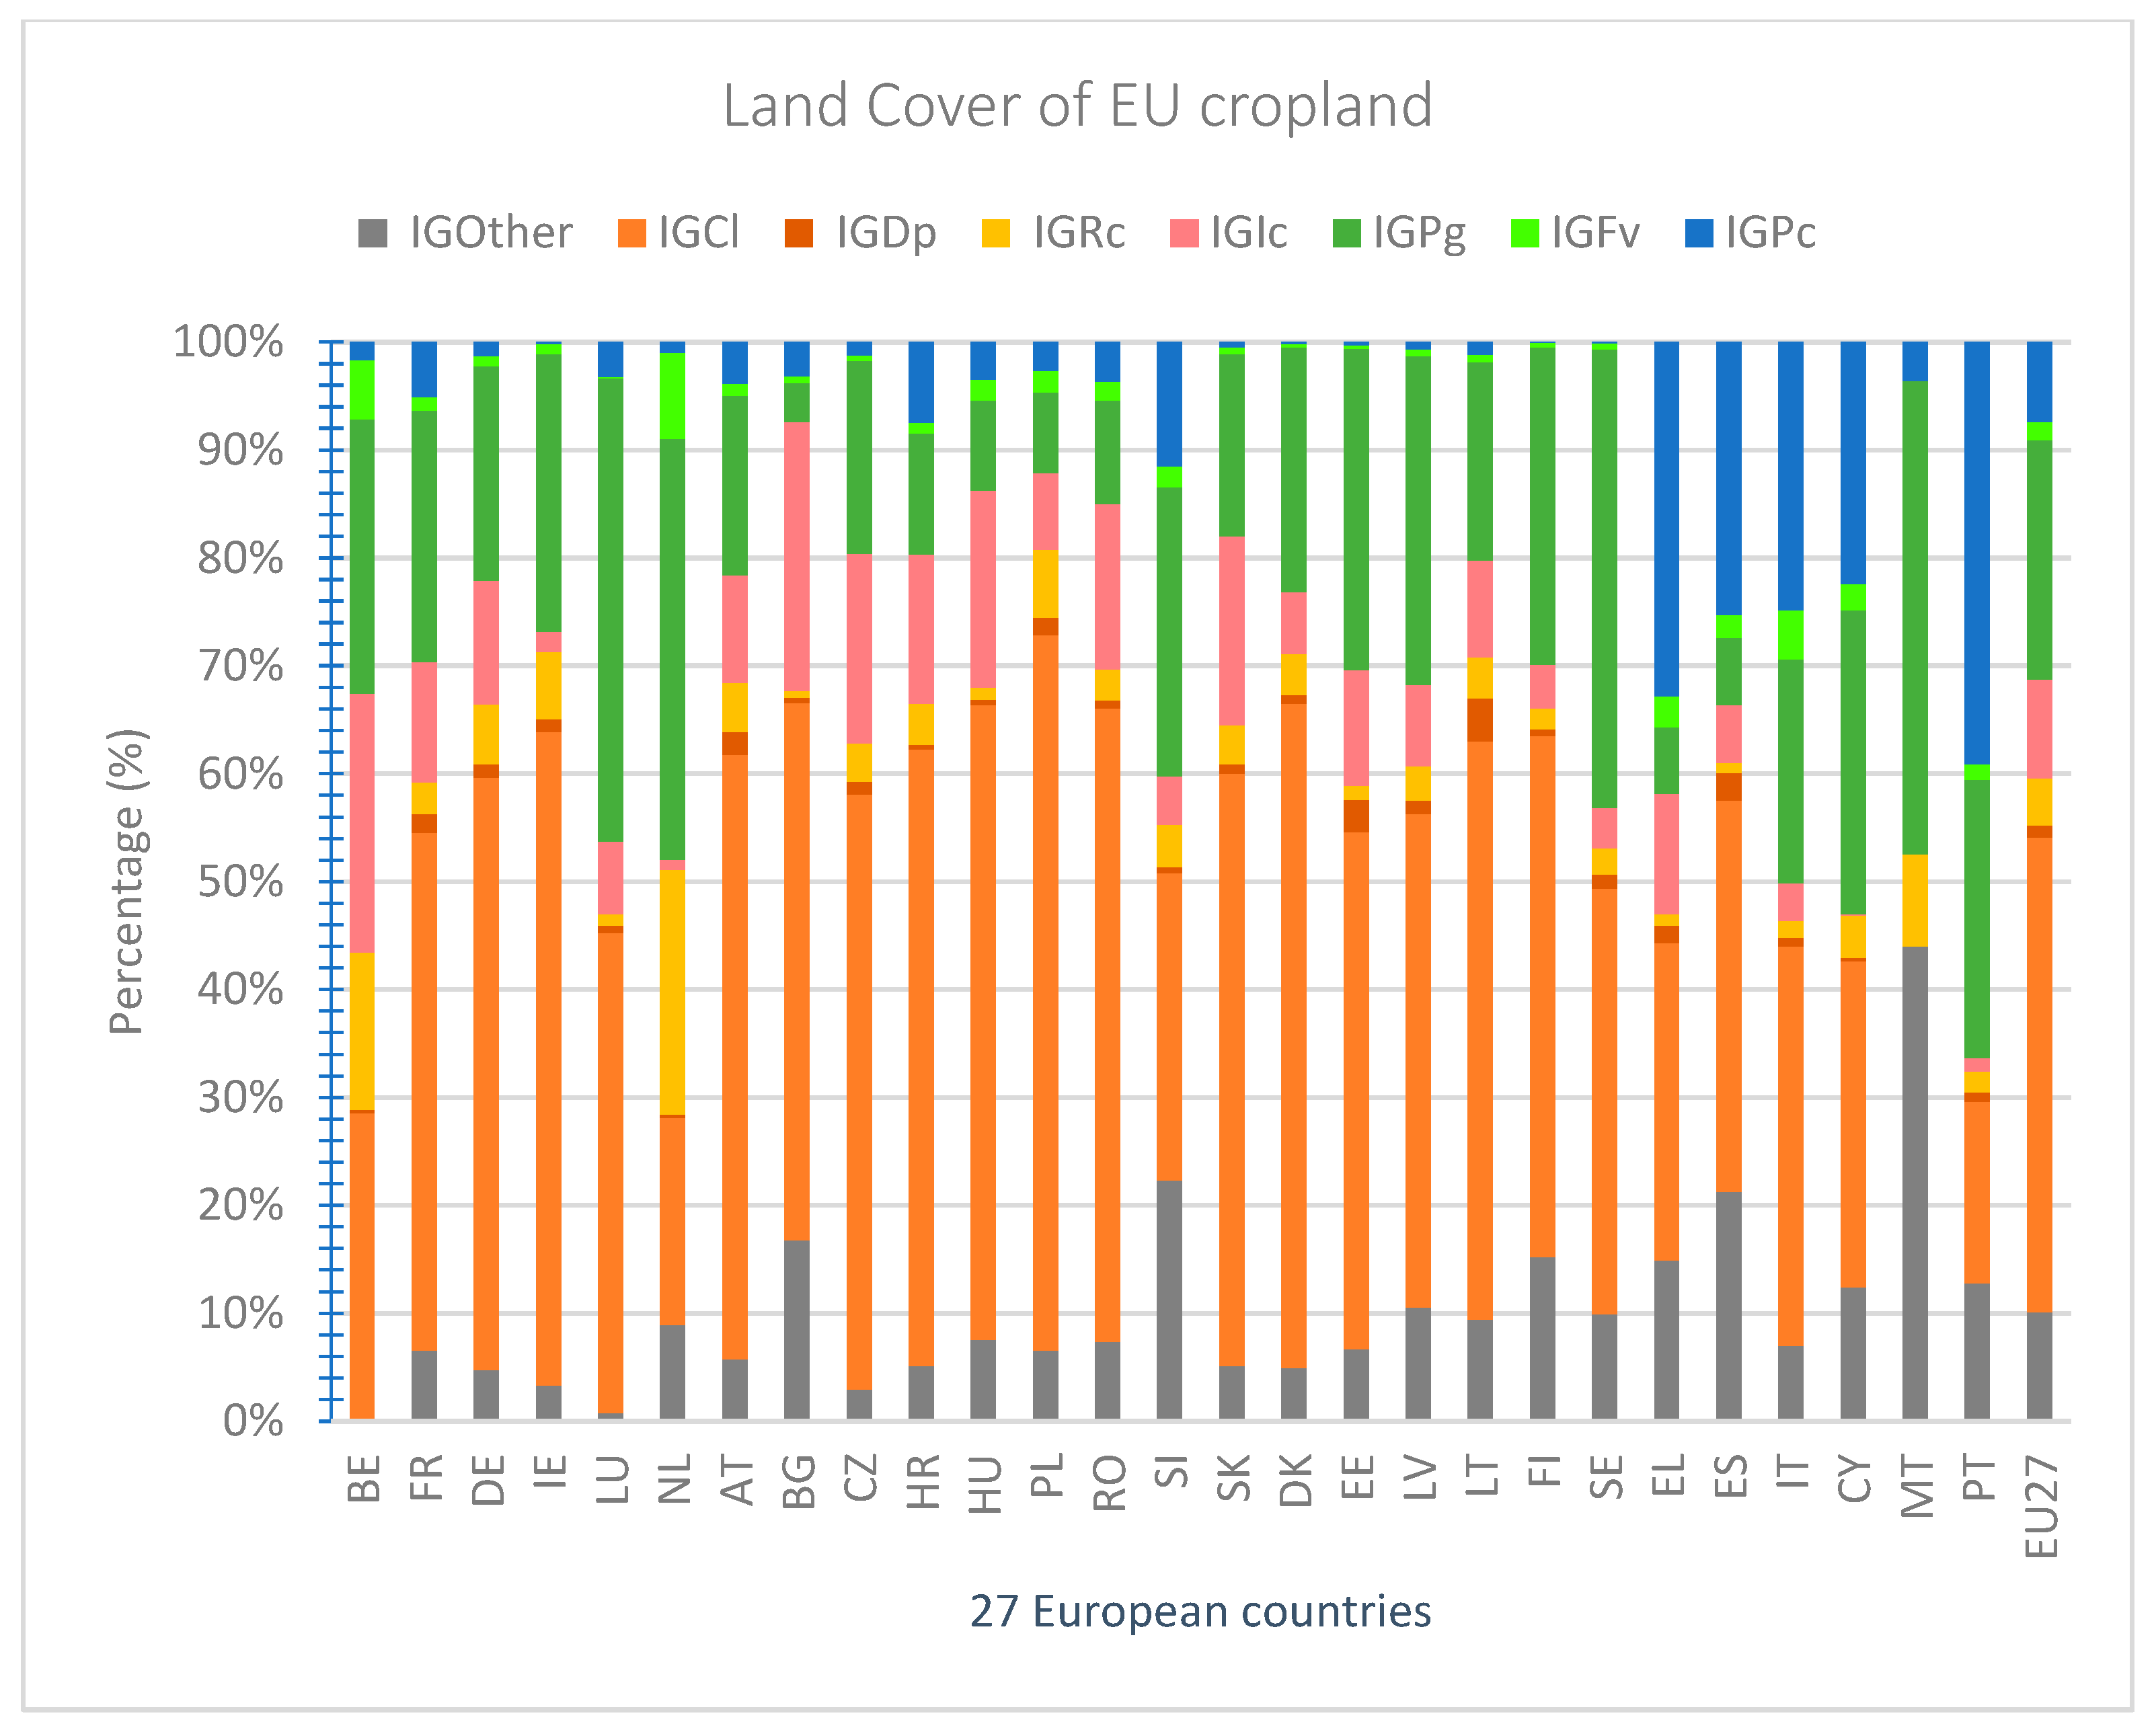
Based on land cover of cropland (cropL) where it is also the main recipient of herbicides due to their intensive use, it was divided into eight (8) categories (land cover groups or crop groups) as follows (see list of abbreviations):
c r o p L = G C l + G D p + G R c + G I c + G P g + G F v + G P c + G O t h e r
According to the structure of the EU27 crop production, seven principal crop groups (Cl, Dp, Rc, Ic, Pg, Fv, Pc) were observed, as shown in Figure 1; another crop group (οther) was added as it emerged after subtracting data on the area of cultivated land from FAOSTAT minus Eurostat data [4].
In the calculation, the ratios of each crop group (ha) to the total cropland (ha) were used, forming the crop group index (IG) for each category (IGcl, IGDp, IGRc, IGIc, IGPg, IGFv, IGPc, IGOther).
(iv)
Based on farm size (FS) of cropland can be divided into 8 categories (Figure 1) as follows (see list of abbreviations):
c r o p L = F S 1 + F S 2 + F S 3 + F S 4 + F S 5 + F S 6 + F S 7 + F S 8
In the calculations, the ratios of each member of the farm size group to the total cropland (ha) were used, forming the farm size index (IFS) for each category (IFS1, IFS2, IFS3, IFS4, IFS5, IFS6, IFS7, IFS8).
(v)
Based on herbicide chemical families (HCFs), the active substances (a.s.) with different modes of action and herbicidal activity where they are widely used in agricultural land (AL) can be divided into 10 categories (Figure 1). Total herbicide use (in kg of a.s.) is the sum of the quantities of each HCF class (kg of a.s.) and can be described as follows (see list of abbreviations):
H C F t o t a l = H p h y + H t r z + H a m d + H c a r + H d i n + H s u l f + H u r c + H b p d + H u r e a + H o t h e r
In the calculations, the ratios of the quantity of each HCF class to the total quantity of herbicides were used, forming the herbicide chemical family index (IHCF) for each category (IHphy, IHtrz, IHamd, IHcar, IHdin, IHsulf, IHurc, IHbpd, IHurea, IHother).
(vi)
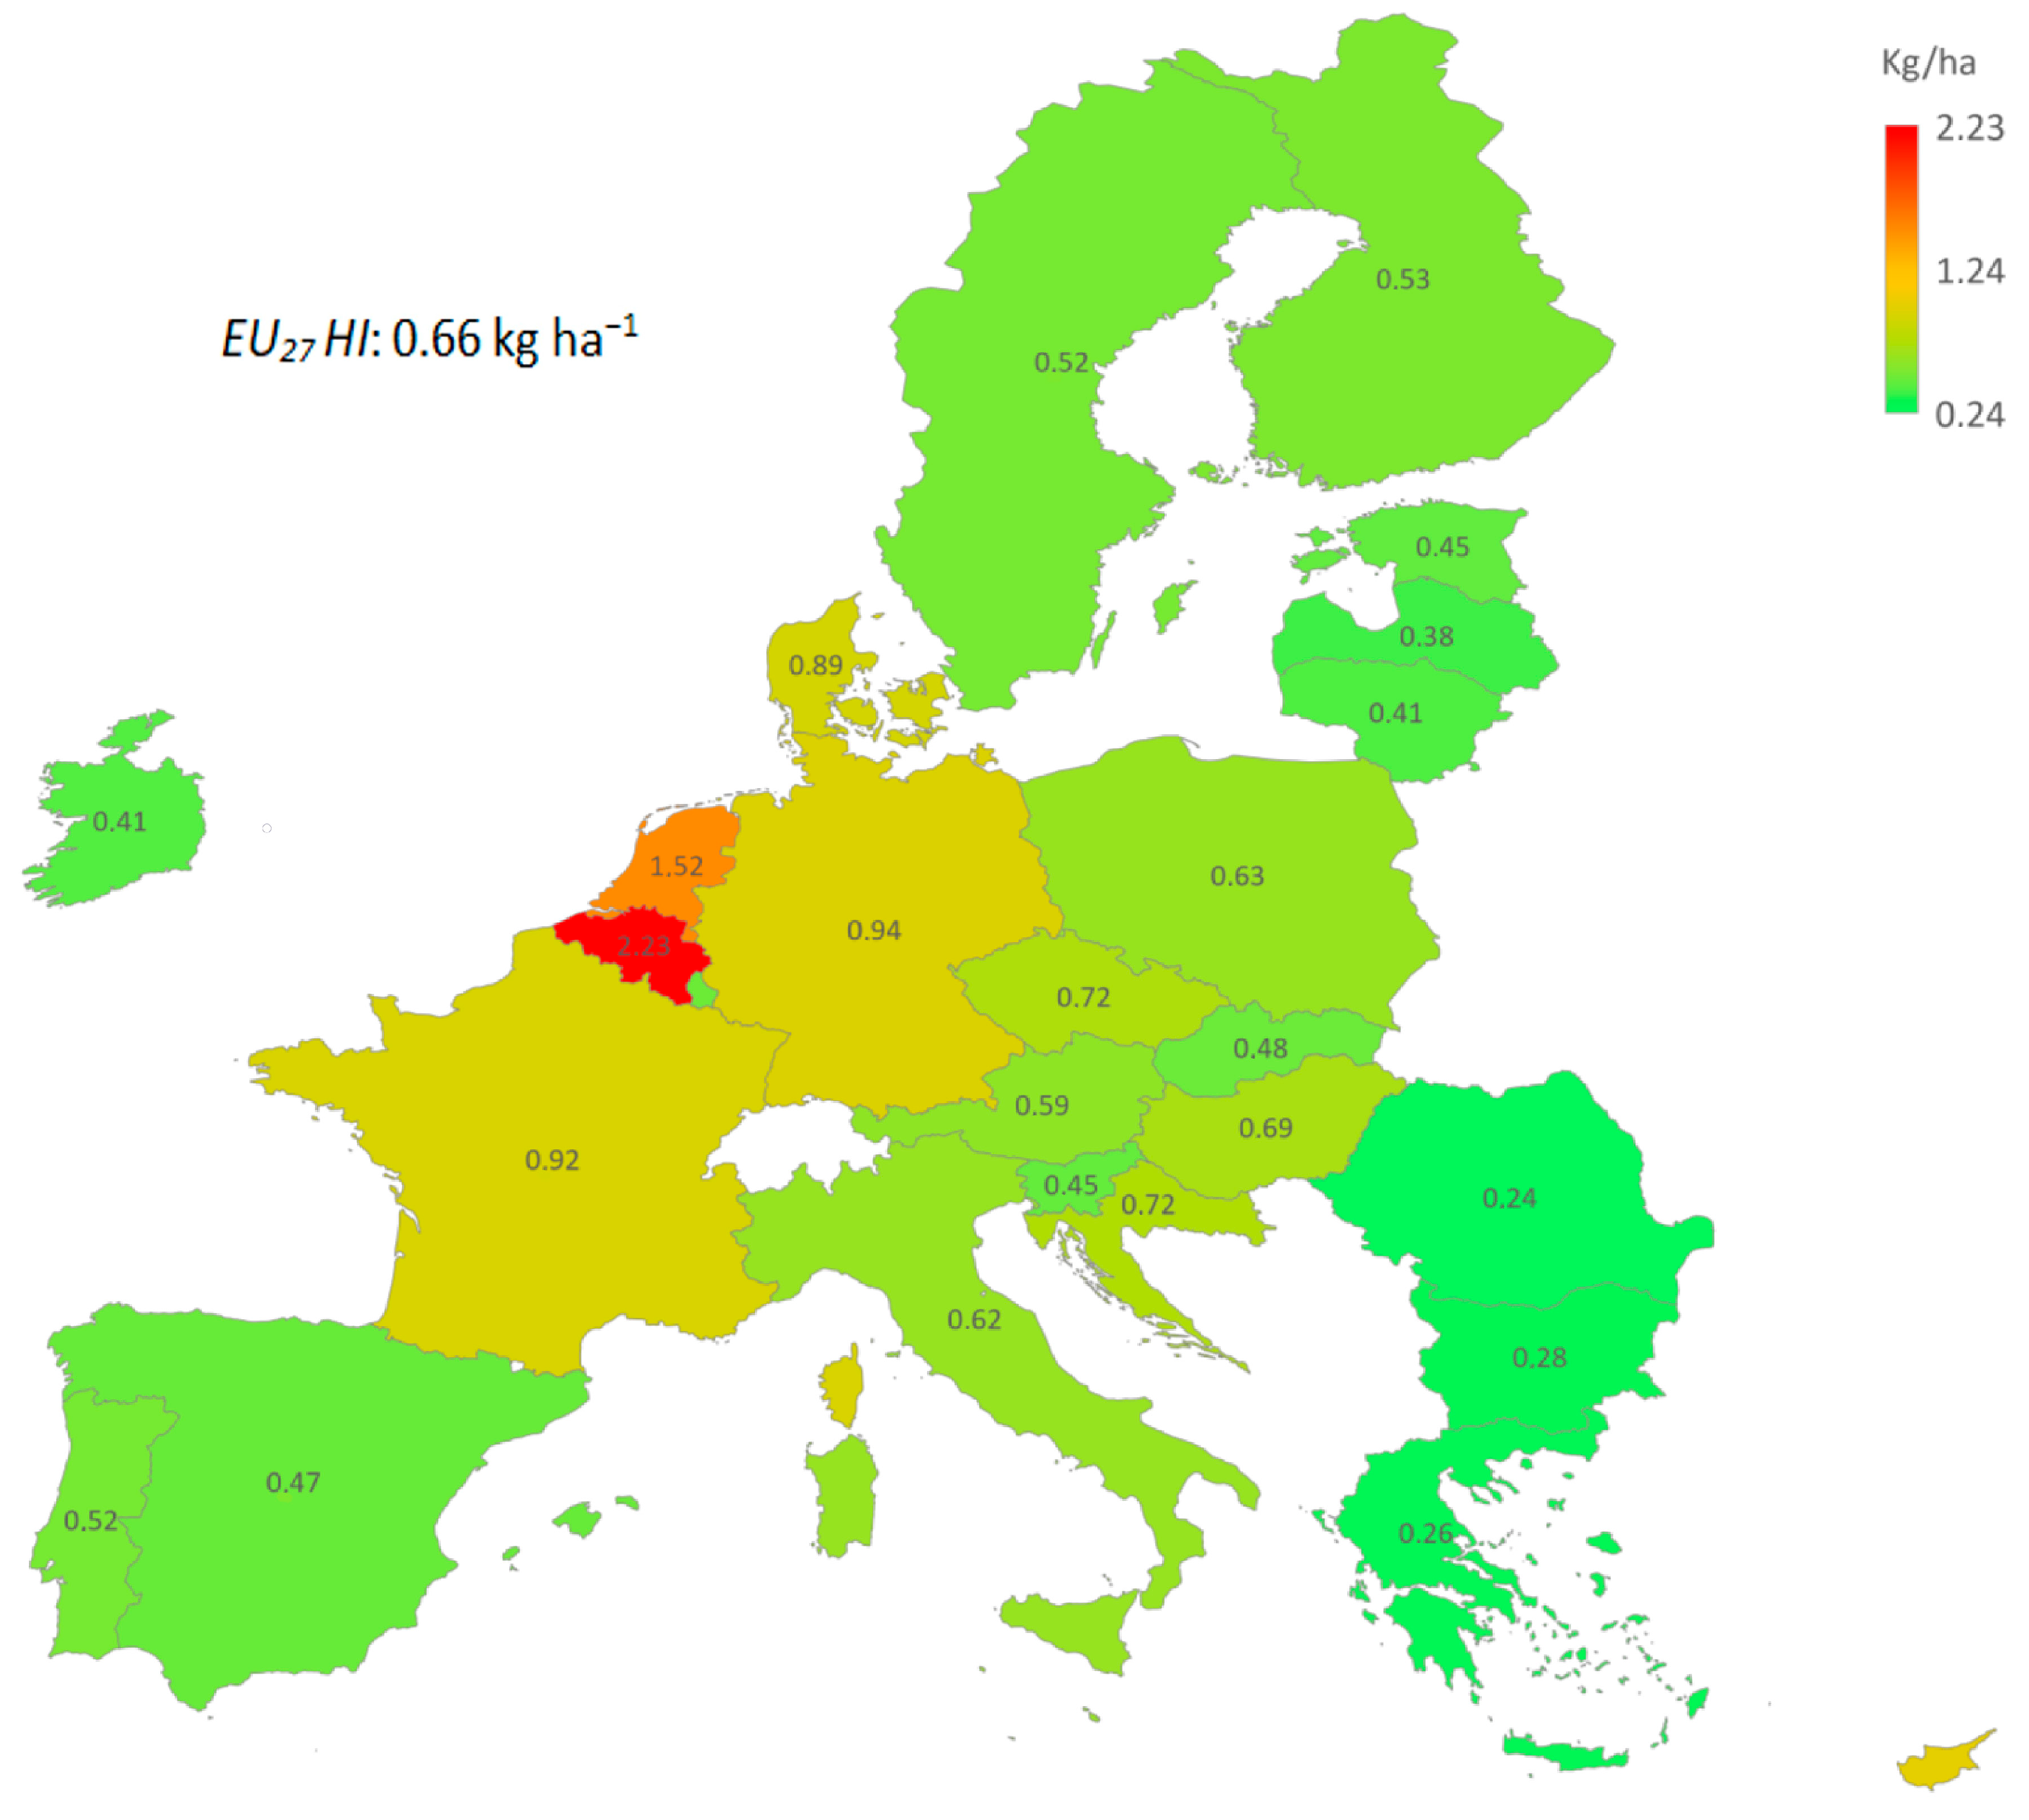
An attempt was made to create a comparative indicator of herbicide use in the EU conventional agricultural land (convAL), using the following equation:
H e b i c i d e s   s a l e s   k g   i n   c o n v A L = T o t a l   h e b i c i d e   s a l e s   k g × 0.91
where 0.91 or 91% of total herbicide sales is the estimated herbicide amount applied in the conventional agricultural land (convAL) or at 39% of the total land area of the EU (based on 2016 land area Eurostat data); the rest (9%) was estimated as being used for urban or other purposes in the EU [6,12,13,15,16]. Finally, the herbicide index could be expressed by following equation:
H I   k g h a 1 = T o t a l   h e b i c i d e   s a l e s   k g × 0.91   c o n v A L   ( h a )
The conventional area of agricultural land (convAL) as the denominator of this equation was based on the fact that the use of chemical herbicides is prohibited on organically cultivated land [12].

2.3. Statistical Analysis

To evaluate the collected data, descriptive statistics were used as described in a previous analysis by Triantafyllidis et al. [9]. The statistical package SPSS version 26 was used as well as the MANOVA (multivariate analysis of variance) with Pillai’s Trace and Wilks’ Lambda indices of the multivariate testing.
Using solely the significant independent variables, linear discriminant analysis (LDA) was applied to explore the differentiation potential of EU countries by creating a discriminant model. The EU countries were treated as the grouping variables, while the determined parameters were taken as the independent variables. The mathematical model expressing the LDA in n-selected variables consisting of i dividing a linear function (F) is of the following form:
F i = ( c i 1 v 1 + c i 2 v 2 + + c i n v n )
where v1vn are the values of each variable that were examined and ci1, ci2, … cin are the correlation coefficients among variables [19].

3. Results

3.1. Spatiotemporal Distribution of the Herbicide Index (HI) in the Agricultural Sector of the European Union

The mean estimated value (n = 594) of the herbicide index (HI) across the European Union was 0.66 kg ha−1 from 2000 to 2021 (Table S1). Despite the decline in conventional agricultural land, no (p > 0.05) differences were observed in the HI mean values among the years across the EU (Table S1); the trend of the HI index during the period 2000–2021 is described in Figure 2. Across the EU, the results showed that the agri-environmental indices IGRc and IGFv (root crop and fresh vegetable cultivation), IFS7 and IFS6 (farms with area from 30 to 99.9 ha), and IHcarb (carbamate herbicides) had a higher positive correlation (0.63, 0.53, 0.47, 0.41, 0.51, respectively) with the HI index (Table S2). The above results suggest that in root crop (Rc) and fresh vegetable (Fv) cultivation and on farms with an area of 30 to 99.9 ha, herbicides are widely used, while the widespread use of carbamide herbicides also increases the HI index. On the contrary, the agri-environmental indices IGCl (Cereal crops), IFS2, and IFS3 (farms with area from 2 to 9.9 ha) had higher negative correlation (−0.22, −0.24, −0.23, respectively).
After examining the geographical distribution of HI at the country level (Figure 3) (p < 0.05), differences were observed among EU Member States (Tables S3 and S4). Referring to the period from 2000 to 2021, the highest average values with S.D. of the HI in kg ha−1 were observed in Belgium (2.23 ± 0.80), the Netherlands (1.52 ± 0.13), Cyprus (0.99 ± 0.29), Germany (0.94 ±0.09), France (0.92 ± 0.12), and Denmark (0.89 ± 0.26) (Tables S3 and S4). On the other hand, the lowest mean values with S.D. of the HI in kg ha−1 were observed in Romania (0.24 ± 0.02), Greece (0.26 ± 0.09), and Bulgaria (0.28 ± 0.16) from 2000 to 2021 (Tables S3 and S4). The results showed that the distribution of the HI was independent of the geographical position of the European countries, such as from north to south or from west to east in the EU. It seems that other agro-environmental parameters also influence herbicide use in European Union countries. To assess the causes of this variability, selected agri-environmental parameters (formatted into indices to be comparable) were investigated, emphasizing the structural characteristics of the agricultural sector of each EU country.

3.2. Assessment of Selected Agri-Environmental Indices

After examining all selected agri-environmental indicators for the period from 2000 to 2021, the results showed that there are differences between EU Member States (Tables S4–S28), which suggests that the agricultural sector in the EU is not uniform. Regarding the land use of agricultural areas, the results showed that both the cropland index (IcropL) and pastureland index (IpmL) were not uniform among the 27 EU Member States (Figure 4). Differences were observed (Tables S5 and S6); the lowest values of IcropL were observed in Ireland (0.10), Slovenia (0.39), Luxemburg (0.49), and Greece (0.50). As shown in the above countries that had a low cropland index (or had more pastureland), the use of herbicides (HI) was also low (Tables S4–S6). Across the EU27, the estimated (n = 594, from 2000 to 2021) mean values for IcropL and IpmL were 0.68 and 0.32, respectively (Figure 4).
According to the cropping systems followed by farmers, who are the end users of agrochemicals, the results showed that among the 27 EU Member States, differences were observed (Tables S7 and S8). The highest organic agricultural land index (IorgAL) values were observed in Austria (0.203), Sweden (0.134), and Estonia (0.126), while the lowest values were observed in Malta (0.002), Bulgaria (0.010), and Ireland (0.012). Although in some EU countries organic agricultural land occupied more than 10% [such as Austria (20.3%), Sweden (13.4%), and Estonia (12.6%)], in the EU, the mean organic agricultural land occupied only 6.0% for the period of 2000–2021 (Figure 5). Nevertheless, in 2021, the mean organic agricultural land occupied about 10% (IorgAL = 0.100), showing a linear increase (R2 = 0.9929) in the IorgAL index over the period from 2000 to 2021 (Figure S1, Table S9). During the twenty-first century, both the increase in organic agricultural land and the decrease in conventional agricultural land of approx. 17.7% in 2021 compared to 2000 (Table S1) in the EU do not appear to affect HI values (Table S3).
Regarding land cover of cropland by main crop groups (Figure 6), the mean (n = 594) values of eight crop group indices (IG) during the period 2000–2021 showed that the crop group index IGcl, “cereals for the production of grain including seed (Cl)”, had the highest mean value in the EU27 (Table S18). However, differences were observed among all eight crop groups in the 27 EU Member States (Tables S10–S18).
The estimated farm size index (IFS) in the European Union was not uniform, as shown in Figure 7. Farms with size up to 9.9 ha (FS1–3) had a mean index value of 0.175 (IFS1–3), while farms with size over 10 ha (FS4–8) had a mean index value of 0.825 (IFS4–8), as shown (Table S19). Meanwhile, differences in mean IFS values (n = 160) were observed among all eight farm size groups in the 27 EU Member States (Tables S20–S27). The highest mean values of the farm size index (IFS1–3) were observed in Malta (0.805), Slovenia (0.467), Cyprus (0.411), Romania (0.422), and Greece (0.391), while the lowest mean values of IFS1–3 were observed in Czechia (0.014), Luxemburg (0.016), France (0.020), and Denmark (0.024), as shown in Tables S20–S22.
Also, the estimated herbicide chemical family index (IHCF) varied among the ten different chemical families (nine initial herbicide chemical families (HCFs) plus a HCF group of “other herbicides” as shown in Figure 8. Across the EU27, the highest mean value (0.560) of this index (IHother) was observed from the HCF group of “other herbicides”, followed by phenoxy hormone products (phy) with a mean value of 0.140 for IHphy and amides (amd) with a value of 0.122 for IHamd, while the lowest mean value (0.0002) for IHurc was observed in the uracil chemical family, as shown in Table S28. However, statistical analysis of chemical pesticide families at the EU country level, due to a lack of values within the respective years, does not allow reliable conclusions to be drawn.

3.3. Assessment of the Herbicides Use in the 27 EU Member States

The qualitative criteria of MANOVA (multivariate analysis of variance), namely Pillai’s Trace = 7.273 (F = 27.698, df = 338, p = 0.000) and Wilks’ Lambda = 0.000 (F = 68.942, df = 338, p = 0.000), suggested that there was an impact of the 27 EU Member States on the examined variables (agri-environmental indices) (Table 1). Thirteen (13) of the thirty one (31) tested variables (agri-environmental indices) had values of p < 0.05 and were then subjected to linear discriminant analysis. The summary results of the LDA processing showed that all 594 cases (data values), which refer to the values of the variables that distinguish the values within the groups, were 100% valid.
Eleven DFs (1st–11th) were formed by the results of the LDA. All (11) DFs accounted for 100% of the total variance. However, the first four DFs could explain 89.8% of the total variance. Thus, the first DF accounted for 40.4% of the total variance and had the highest eigenvalue (40.616) and canonical correlation (0.988). The second DF had an eigenvalue of 21.954 and a canonical correlation of 0.978, while it accounted for 21.8% of the total variance. The third DF had an eigenvalue of 17.170 and a canonical correlation of 0.972, accounting for 17.1% of the total variance. The fourth DF had an eigenvalue of 10.577 and a canonical correlation of 0.956, accounting for 10.5% of the total variance.
The eigenvalues of the DFs are an indicator of how well the function differentiates the initial groups (27 Member States of the EU) [20]. In Figure 9, a clear separation of the 27 Member States of the EU is shown based on the considered variables. The classification rate was 93.9% using the original method and 92.4% using the cross-validation method. The obtained classification rates were 100% for 17 of the 27 EU Member States (FR, DE, IE, LU, NL, AT, HU, PL, RO, SI, DK, FI, SE, EL, IT, MT, PT); 95.5% for BE; 90.9% for ES, CZ, and CY; 86.4 for BG; 81.8% for LT; 77.3% for HR; 72.7% for LV; 59.1% for SK; and 50% for EE (Table S29a,b). Figure 9 also illustrates the group centroid values. It is noteworthy that the group centroid values are considered for the estimation of the classification ability of the LDA model and refer to the unstandardized canonical DFs evaluated based on group means. Fisher’s linear discriminant function coefficients for each of the 27 EU Member States are shown in Table S30.

4. Discussion

Short-term estimates are not suitable for monitoring and comparing fluctuating pesticide use [9,21]. For this reason, data from the agricultural sector of the EU 27 Member States (FAO, Eurostat, FiBL statistics) [4,22,23] during the first two decades of the 21st century were used to assess the HI of conventional agricultural land (convAL). The mean value of the HI was estimated to be 0.66 kg ha−1 in the EU (Figure 3). However, this high value of the HI was lower compared to the estimated fungicide index (FI: 0.79 kg ha−1) as determined in a recent study [9]. Despite the changes, concerning the climate or other factors, no differences have been observed in the HI from year to year in the European Union over the last 22 years (Table S1). The results show that farmers usually apply conventional weed control strategies, using chemical herbicides intensively and for a long time to avoid crop yield losses. However, optimizing herbicide performance and using good cultivation practices, such as crop rotation, the cultivation of competing crops/varieties, seed rate and sowing time control, formulation/adjuvants, and application techniques, could contribute to the reduction in herbicide doses [24,25,26,27,28]. Additionally, the use of non-chemical methods of weed control in organic farmland areas and beyond minimizes the risk of side effects to the agri-environment [29,30]. Although the organic agricultural land index (IorgAL) showed a linear increase (Figure S1), the HI remained relatively stable in the period from 2000 to 2021. This is probably due to the fact that organic land covers only 6% of the EU’s agricultural land (Figure 5). Several studies have shown that agri-environment schemes and organic farming do not always deliver the expected benefits [31,32,33]. However, the organic agriculture area was increased in 2020 and 2021, occupying 9.6% and 10.0%, respectively. This finding indicates that this farming system could have a positive environmental impact on the HI in the future (Table S9).
Geiger et al. [34] supported the urgent need to restore biodiversity in Europe by minimizing the use of pesticides in cropland and especially in intensive crops where large areas are cultivated. The results of this study showed that agricultural land use has an impact on HI formation; it appears that in pastureland (pmL), the HI tends to be decreased, while in cropland (cropL), the HI is increased, probably due to intensive cultivation practices. It is obvious that cropL is the area where herbicides are mainly used. Nevertheless, the results showed that the claim that the higher the cropland index (ratio of cropland to agricultural land), the more herbicides are used is not a rule. Specifically, among the 27 EU Member States, pastureland covered more than 40% of agricultural land in 7 of the 27 countries, such as Ireland (89%), Slovenia (61%), Luxembourg (51%), Greece (50%), Austria (48%), Portugal (48%), and the Netherlands (43%) (Table S5). However, the HI in these countries was not lower in all cases compared to the other 20 EU countries (Figure 3). As it turns out, there are other factors that have a great influence on HI formation and need to be taken into account, such as land cover by crops.
Land cover by crops appears to have a role in herbicide use in the EU agricultural sector. Our results showed that mainly the crop groups “root crops (Rc)”, “fresh vegetables (including melons) as well as strawberries (Fv)”, “the plants harvested green from arable land (Pg)”, and “the industrial crops (Ic)” were the crop groups which had a negative impact on the HI over the last two decades in the EU27 (Table S2). In contrast, the crop groups GCl, GDp, and GPc (see abbreviations) reduced the HI, showing their positive environmental impact. The results of this study suggest different effects on HI formation by the different crop groups, which is consistent with previous studies [16,35,36]. It appears that higher amounts of herbicide were mainly applied to high-value crops to control weeds and reduce economic losses. Similar results were reported by Berkhout and van Bruchem [37], stressing that the amounts of herbicides applied on potato and onion fields were three times and twice as much compared to arable land, respectively. Also, vegetable growers in Bangladesh applied more pesticides to achieve high yields and improve income [35]. Geiger et al. [34], studying the impacts on biodiversity due to agricultural intensification, showed that the number of wild plant species declined as the use of herbicides on cultivated land in cereal crops increased. As shown in this study, any changes in land cover affect weed management in turn. In particular, weed management using herbicides is carried out in high-value crops (e.g., root crops, fresh vegetables) with the aim of high yield per hectare and increased income. In the above land cover crop groups, weed management through sustainable agricultural systems or cultivation practices took place in a small part; on the contrary, weed control in the above crops seems to be treated either with frequent applications or with an increased dose of herbicides. The results reinforce the view that agricultural intensification to increase yields has disproportionately negative environmental impacts. However, although the use of herbicides per hectare was lower in the “arable land under cereals (including seeds)” crop group than in other crop groups, the larger area covered by this crop group resulted in a greater use of herbicides across the EU27; similar results for pesticide use have been reported [38].
Also, among farm size classes (FS1–8), the highest use of herbicides was observed in farms FS6 and FS7 (FS6: 30–49.9 ha; FS7: 50–99.9 ha), which covered about 25% of total cropland (cropL) in the EU (Tables S2 and S19). In contrast, the lowest use of herbicides occurred on farms FS2 and FS3 (FS2: 2–4.9 ha; FS3: 5–9.9 ha), which covered about 13%, from 2000 to 2021. The results denote the role of farm size classes in the sustainable use of herbicides. On the other hand, the differences in the application dose between the chemical families of herbicides [39,40] indicate their crucial role in the use of herbicides per hectare in the 27 Member States of the European Union; this effect of herbicide chemical families on the use of herbicides was observed. Carbamate herbicides have the strongest correlation (Table S2) with the HI compared with other chemical families. Piel et al. [41] reported that some a.s. of the carbamate herbicides such as propham and chlorpropham have been mostly used on potato crops as herbicides but also as plant growth regulators. Chlorpropham has been widely used until recently in root crops (potatoes, carrots, onions) and fresh vegetables such as lettuce to control annual and perennial broadleaved weeds and annual grasses [42]. Also, phenmedipham was used as a post-emergence herbicide on sugar beet/fodder beet, as proposed by the applicants. Moreover, cycloate is a carbamate herbicide which has been used only on beets, a crop particularly dependent on herbicide treatments (on average, in France, 15 of the 16 annual pesticide treatments on this crop are with herbicides) [41]. Nevertheless, the most used herbicide chemical family group was the “other herbicides chemical families” across the EU27 from 2000 to 2021 (Table S28). The results showed that the use of this group of chemical herbicides, “other”, represents about 50.6% of the total use of herbicides in the EU; the highest use (84.4%) of this group occurs in Greece, while in 16 of the 25 countries (in 2 countries, no data were available), use of this group of herbicides accounted for more than 50% of total herbicide use on conventional EU farmland (Figure 8). Many chemical families belong to this group (HCFother), such as organophosphorus, nitrile, anilide, cyclohexanedione, chloroacetanilide, pyridyloxyacetic-acid, aryloxyphenoxyproprionic, thiadiazine, benzoic-acid, pyridinecarboxylic-acid, thiocarbamate, imidazolinone, triketone, and diphenyl ether herbicides. However, the ratio of glyphosate—an organophosphate—compared to all herbicides in 2017 (%) was 34% in the EU28 as reported by Antier et al. [6]; this explains the high values observed in the herbicide chemical families index in the group “other herbicidal chemical families”. However, the extensive use of herbicides imposed selection pressure on weed communities, and as a result, the first herbicide-resistant (HR) weed populations emerged [43]. Farmers often apply herbicides at doses higher than those recommended in order to control HR weeds [44], thus perpetuating this vicious cycle. Currently, more than 260 weed species have been reported globally to evolve resistance to more than 160 herbicides [45], including glyphosate, the most successful synthetic herbicide [46]. In addition to the emergence of noxious HR weeds and their limited control options by farmers, the extensive use of herbicides has adverse effects on the agri-environment.
After examining the above agri-environmental indices, an attempt was made to combine their structural variability in each of the 27 EU Member States. Using only the significant independent variables, linear discriminant analysis (LDA) was applied to explore the differentiation potential of the 27 Member States of the EU by creating a discrimination model. Each EU country was treated as a clustering variable, providing the grouping variables, while the determined parameters were taken as the independent variables. Linear discriminant analysis (LDA) of 11 variables was examined to describe this differentiation of the 27 EU Member States (Table 1). The examined agri-environmental indices were related to agricultural land use (IpmL), farming system (IconvAL), land cover of cropland (IGFv IGPc IGPg IGCl IGIc IGRc IGDp IGoth), and the HI, and pooled within-group correlations between the discriminant variables and the standardized normal discriminant functions (DFs) were able to explain this variability across the 27 EU Member States. The highest absolute correlation between each variable and any discriminant function is shown in Table 1.
The results in Table 1 and Table S2 showed that agro-environmental indices (such as agricultural land use, farming systems, land cover by different crop groups, farm size, and different herbicide chemical families) play a decisive role in the intensity of herbicide use, forming the HI across the European Union over the period 2000–2021 (Table S2). Meanwhile, these results, combined with their structural variability in each of the 27 Member States as described by Fisher’s linear discriminant functions (Table S30), could be an effective management tool to reduce the herbicide use. Finally, the assessment of the above eleven agri-environmental indices clearly discriminates the herbicide use in the 27 EU Member States, creating an effective tool to estimate use and further improve herbicide management in the EU27.

5. Conclusions

The herbicide index (HI) calculated in this study showed that herbicide use was 0.66 kg a.s. per hectare of conventional EU agricultural land in the period from 2000 to 2021. However, the HI varied between the 27 EU Member States. This variation appears to be due to the fact that the EU agricultural sector is not uniform. According to the land use of agriculture area, cropland in contrast with pastureland has a negative impact on the formation of the HI, suggesting that the larger the cropland area, the higher the use of herbicides in the EU27. Nevertheless, the results showed that the claim that the higher the cropland index (ratio of cropland to agricultural land), the more herbicides are used is not a rule. As it turns out, there are other factors that have a great influence on HI formation and need to be taken into account, such as land cover by different groups including crops. The land cover by “root crops” and “Fresh vegetables (including melons) and strawberries” (high-value crops) suggested a high negative impact on the herbicide index. Also, farm size is a crucial variable in HI formation across the EU27; the greatest use of herbicides was observed in farms FS6 and FS7 (FS6: 30–49.9 ha; FS7: 50–99.9 ha), which covered about 25% of the total cropland (cropL) in the EU. In parallel, the herbicide chemical family of “carbamates” had a higher negative impact on the formation of the herbicide index (HI) compared to the other chemical families. Using only the significant independent variables (13 out of 31), linear discriminant analysis (LDA) was applied to explore the differentiation potential of the 27 Member States of the EU by creating a discrimination model. The knowledge of the main parameters of the agricultural sector as well as their contribution to the use of herbicides in the European Union and their geographical distribution is expected to be an effective management tool to reduce the use of herbicides, to improve the management of weeds in agricultural land, and to reduce their environmental impact in the EU.

Supplementary Materials

The following supporting information can be downloaded at https://www.mdpi.com/article/10.3390/agriculture14071171/s1: Table S1: The conventional (convAL) agriculture land area and the herbicide index (HI) in the EU27, mean values with S.D. during the period 2000–2021. Table S2: Pearson correlations among agri-environmental parameters across the EU agricultural sector. Table S3: Herbicide index (HI) in each one of the Member States of EU27. Tables S4–S28: Statistical differences for all selected agri-environmental indicators (Table S4: HI; Table S5: IpmpL; Table S6: IcropAL; Table S7: IconvAL; Table S8: IorgAL (between countries); Table S9: IorgAL (between years); Table S10: IGcl; Table S11: IGDp; Table S12: IGRc; Table S13: IGIc; Table S14: IGPg; Table S15: IGFv; Table S16: IGPc; Table S17: IGOther; Table S18: IG; Table S19: IFS; Table S20: IFS1; Table S21: IFS2; Table S22: IFS3; Table S23: IFS4; Table S24: IFS5; Table S25: IFS6; Table S26: IFS7; Table S27: IFS8; Table S28: IHCF) between EU Member States for the period from 2000 to 2021. Table S29a,b: Classification results of the 27 EU Member States based on the significant parameters and LDA. Table S30: LDA to determine the discriminant function coefficients among the 27 EU Member States. Figure S1: Trend of the organic agricultural land index (IorgAL) across the EU for the period 2000 to 2021.

Funding

This research received no external funding.

Institutional Review Board Statement

Not applicable.

Data Availability Statement

The original contributions presented in the study are included in the article; further inquiries can be directed to the corresponding author.

Conflicts of Interest

The author declares no conflicts of interest.

Abbreviations

ALAgricultural land area (ha)FS4From 10 to 19.9 ha (n4)
(i)Agricultural land use abbreviationsIFS4Index of farm size group4 (FS4/cropL)
arLarable land (ha)FS5From 20 to 29.9 ha (n5)
pcLland under permanent crops (ha)IFS5Index of farm size group5 (FS5/cropL)
pmLpastureland in haFS6From 30 to 49.9 ha (n6)
cropLcropland (cropL = arL + pcL) in haIFS6Index of farm size group6 (FS6/cropL)
IcropLcropland index (cropL/AL)FS7From 50 to 99.9 ha (n7)
IpmLpastureland index (mpL/AL)IFS7Index of farm size group7 (FS7/cropL)
(ii)Farming systems abbreviationsFS8100 ha or over (n8)
convALconventional AL (AL–OrgAL) in haIFS8Index of farm size group8 (FS8/cropL)
orgALorganic AL (area) in ha(v)Herbicide chemical families abbreviations
IconvALconvAL index (convAL/AL)a.s.Active substance
IorgALorgAL index (orgAL/AL)HIHerbicide index (a.s. in kg per ha conAL)
(iii)Land cover abbreviationsHCFHerbicide chemical family (a.s. in kg)
CGCrops groups in cropL (n = 8)HCFtotalkg a.s. of all herbicides used in study area
IGcrop group index (CG/cropL)IHCFHCF index (HCF/HCFtotal)
GPcPermanent crops in ha (n1)Hphyphenoxy hormone products—HCF
IGPcPc crop group index (Pc/cropL)IHphyphy herbicide index (Hphy/HCFtotal)
GClCereals for the production of grain. (n2)Htrztriazines—HCF (a.s. in kg)
IGClCl crop group index (Cl/cropL)IHtrztrz herbicide index (trz/HCFtotal)
GDpDry pulses and protein crops. (n3)Hamdamides—HCF
IGDpDp crop group index (Dp/cropL)IHamdamd herbicide index (amd/HCFtotal)
GRcRoot crops in ha (n4)Hcarbcarbamates—HCF
IGRcRc crop group index (Rc/cropL)IHcarbcarbametes herb. index (carb/HCFtotal)
GIcIndustrial crops in ha (n5)Hdindinitroanilines—HCF
IGIcIc crop group index (Ic/cropL)IHdindinitroaniline herb. index (din/HCFtotal)
GPgPlants harvested green from arable. (n6) Hurcuracil—HCF
IGPgPg crop group index (Pg/cropL)IHurcuracil herbicide index (urc/HCFtotal)
GFvFresh vegetables and strawberries (n7)Hsulfsulfonyl ureas—HCF
IGFvFv crop group index (Fv/cropL)IHsulfsulfonyl ureas herb. index (sulf/HCFtotal)
GOtherOther cropland in ha (n8)Hureaureas—HCF
IGOtherOther cr. group index (Other/cropL)IHureaureas herb. index (urea/HCFtotal)
(iv)Farm size abbreviationsHbpdbipiridils—HCF
FSFarm size group in cropL (n = 8)IHbpdbipiridils her. index (bpd/HCFtotal)
FS1Less than 2 ha (n1)Hotherother herbicides—HCF
IFS1Index of farm size group1 (FS1/cropL)IHotherother herbicides index (other/HCFtotal)
FS2From 2 to 4.9 ha (n2)(vi)Other abbreviations
IFS2Index of farm size group2 (FS2/cropL)EU27European Union of 27 Member States
FS3From 5 to 9.9 ha (n3)LDALinear discriminant analysis
IFS3Index of farm size group3 (FS3/cropL)

References

  1. Zimdahl, R.L. Chapter 12—Properties and uses of herbicides. In Fundamentals of Week Science; Zimdahl, R.L., Ed.; Academic Press: Cambridge, MA, USA, 1993; pp. 225–269. [Google Scholar]
  2. Triantafyllidis, V.; Mavroeidis, A.; Kosma, C.; Karabagias, I.K.; Zotos, A.; Kehayias, G.; Beslemes, D.; Roussis, I.; Bilalis, D.; Economou, G.; et al. Herbicide use in the era of farm to fork: Strengths, weaknesses, and future implications. Water Air Soil Pollut. 2023, 234, 94. [Google Scholar] [CrossRef] [PubMed]
  3. Müller-Schärer, H.; Collins, A.R. Integrated Weed Management. In Encyclopedia of Environmental Management; Jorgensen, S.E., Ed.; Taylor and Francis: New York, NY, USA, 2012. [Google Scholar]
  4. FAOSTAT, 2024. Domain: Land Use, Element: Area, Area: Separately each of 27 Member States of EU, Item Codes: 6610, 6620, 6621, 6650, 6655. Available online: https://www.fao.org/faostat/en/#data/RL (accessed on 7 November 2023).
  5. FAOSTAT, 2024. Domain: Pesticides Use, Element: Agricultural Use, Area: Separately each of 27 Member States of EU, Item Codes: 1320, 1321, 1322, 1323, 1324, 1325, 1326, 1327, 1328, 1329, 1330. Available online: https://www.fao.org/faostat/en/#data/RP (accessed on 10 November 2023).
  6. Antier, C.; Kudsk, P.; Reboud, X.; Ulber, L.; Baret, P.V.; Messéan, A. Glyphosate use in the European agricultural sector and a framework for its further monitoring. Sustainability 2020, 12, 5682. [Google Scholar] [CrossRef]
  7. Powles, S.B. Evolved glyphosate-resistant weeds around the world: Lessons to be learnt. Pest Manag. 2008, 64, 360–365. [Google Scholar] [CrossRef] [PubMed]
  8. Steinmann, H.H.; Dickeduisberg, M.; Theuvsen, L. Uses and benefits of glyphosate in German arable farming. Crop Prot. 2012, 42, 164–169. [Google Scholar] [CrossRef]
  9. Triantafyllidis, V.; Kosma, C.; Karabagias, I.K.; Zotos, A.; Pittaras, A.; Kehayias, G. Fungicides in Europe during the Twenty-first Century: A Comparative Assessment Using Agri-environmental Indices of EU27. Water Air Soil Pollut. 2022, 233, 52. [Google Scholar] [CrossRef]
  10. Thomas, M.R. Guidelines for the Collection of Pesticide Usage Statistics within Agriculture and Horticulture; Organisation for Economic Cooperation and Development (OECD): Paris, France, 1999; p. 40. [Google Scholar]
  11. Atwood, D.; Paisley-Jones, C. Pesticides Industry Sales and Usage 2008–2012 Market Estimates; Environmental Protection Agency, Biological and Economic Analysis Division: Washington, DC, USA, 2017. Available online: www.epa.gov/sites/production/files/2017-01/documents/pesticides-industry-salesusage-2016_0.pdf (accessed on 10 November 2023).
  12. Devault, D.A.; Pascaline, H. Efficiency of pesticide alternatives in non-agricultural areas. In Pesticides—Toxic Aspects; Soloneski, S., Ed.; InTech: Houston, TX, USA, 2014; Available online: https://www.intechopen.com/chapters/45980 (accessed on 15 January 2024).
  13. Hanke, I.; Wittmer, I.; Bischofberger, S.; Stamm, C.; Singer, H. Relevance of urban glyphosate use for surface water quality. Chemosphere 2010, 81, 422–429. [Google Scholar] [CrossRef]
  14. Woodburn, A.T. Glyphosate: Production, pricing and use worldwide. Pest Manag. Sci. 2000, 56, 309–312. [Google Scholar] [CrossRef]
  15. Kristoffersen, P.; Rask, A.M.; Grundy, A.C.; Franzen, I.; Kempenaar, C.; Raisio, J.; Schroeder, H.; Spijker, J.; Verschwele, A.; Zarina, L. A review of pesticide policies and regulations for urban amenity areas in seven European countries. Weed Res. 2008, 48, 201–214. [Google Scholar] [CrossRef]
  16. Benbrook, C.M. Trends in glyphosate herbicide use in the United States and globally. Environ. Sci. Eur. 2016, 28, 3. [Google Scholar] [CrossRef]
  17. Intergovernmental Oceanographic Commission. Ocean Data Standards Volume 1. Recommendation to Adopt ISO 3166-1 and 3166-3 Country Codes as the Standard for Identifying Countries in Oceanographic Data Exchange. Version 1.1. Available online: https://repository.oceanbestpractices.org/handle/11329/287 (accessed on 3 April 2024).
  18. Ritchie, H.; Roser, M. Half of the World’s Habitable Land is Used for Agriculture. Published Online at OurWorldInData.Org. 2019. Available online: https://ourworldindata.org/global-land-for-agriculture (accessed on 16 March 2024).
  19. Field, A. Discovering Statistics Using SPSS, 3rd ed.; Sage Publications Ltd.: London, UK, 2009. [Google Scholar]
  20. Büyüköztürk, Ş.; Çokluk-Bökeoğlu, Ö. Discriminant function analysis: Concept and application. Egit. Arastirmalari-Eurasian J. Educ. Res. 2008, 33, 73–92. [Google Scholar]
  21. Stoate, C.; Boatman, N.D.; Borralho, R.J.; Carvalho, C.R.; De Snoo, G.R.; Eden, P. Ecological impacts of arable intensification in Europe. J. Environ. Manag. 2001, 63, 337–365. [Google Scholar] [CrossRef] [PubMed]
  22. Eurostat, 2024. Online Data Code: APRO_CPSH “Crop Production in EU Standard Humidity”, Online Data Dataset: Pesticide Sales. Available online: https://ec.europa.eu/eurostat/databrowser/view/aei_fm_salpest09/ (accessed on 10 January 2024).
  23. FiBL, 2024. Area Data on Organic Agriculture in Europe 2000–2021. The Statistics.FiBL.Org Website Maintained by the Research Institute of Organic Agriculture (FiBL), Frick, Switzerland. Available online: https://statistics.fibl.org/europe/key-indicators-europe.html (accessed on 5 January 2024).
  24. Liebman, M.; Baraibar, B.; Buckley, Y.; Childs, D.; Christensen, S.; Cousens, R.; Eizenberg, H.; Heijting, S.; Loddo, D.; Merotto, A.; et al. Ecologically sustainable weed management: How do we get from proof-of-concept to adoption? Ecol. Appl. 2016, 26, 1352–1369. [Google Scholar] [CrossRef]
  25. Kudsk, P. Optimising herbicide dose: A straightforward approach to reduce the risk of side effects of herbicides. Environ. Syst. Decis. 2008, 28, 49–55. [Google Scholar] [CrossRef]
  26. Storkey, J.; Meyer, S.; Still, K.S.; Leuschner, C. The impact of agricultural intensification and land-use change on the European arable flora. Proc. R. Soc. B Biol. Sci. 2012, 279, 1421–1429. [Google Scholar] [CrossRef] [PubMed]
  27. Triantafyllidis, V.; Manos, S.; Hela, D.; Manos, G.; Konstantinou, I. Persistence of trifluralin in soil of oilseed rape fields in Western Greece. Int. J. Environ. Anal. Chem. 2010, 90, 344–356. [Google Scholar] [CrossRef]
  28. Triantafyllidis, V.; Hela, D.; Papadaki, M.; Bilalis, D.; Konstantinou, I. Evaluation of mobility and dissipation of mefenoxam and pendimethalin by application of CSTR model and field experiments using bare and tobacco tilled soil columns. Water Air Soil Pollut. 2012, 223, 1625–1637. [Google Scholar] [CrossRef]
  29. Sims, B.; Corsi, S.; Gbehounou, G.; Kienzle, J.; Taguchi, M.; Friedrich, T. Sustainable weed management for conservation agriculture: Options for smallholder farmers. Agriculture 2018, 8, 118. [Google Scholar] [CrossRef]
  30. Harker, K.N.; O’Donovan, J.T. Recent weed control, weed management, and integrated weed management. Weed Technol. 2013, 27, 1–11. [Google Scholar] [CrossRef]
  31. Bengtsson, J.; Ahnström, J.; Weibull, A.C. The effects of organic agriculture on biodiversity and abundance: A meta-analysis. J. Appl. Ecol. 2005, 42, 261–269. [Google Scholar] [CrossRef]
  32. Berendse, F.; Chamberlain, D.; Kleijn, D.; Schekkerman, H. Declining biodiversity in agricultural landscapes and the effectiveness of agri-environment schemes. Ambio 2004, 33, 499–502. [Google Scholar] [CrossRef]
  33. Kleijn, D.; Berendse, F.; Smit, R.; Gilissen, N. Agri-environment schemes do not effectively protect biodiversity in Dutch agricultural landscapes. Nature 2001, 413, 723–725. [Google Scholar] [CrossRef]
  34. Geiger, F.; Bengtsson, J.; Berendse, F.; Weisser, W.W.; Emmerson, M.; Morales, M.B.; Ceryngier, P.; Liira, J.; Tscharntke, T.; Winqvist, C.; et al. Persistent negative effects of pesticides on biodiversity and biological control potential on European farmland. Basic Appl. Ecol. 2010, 11, 97–105. [Google Scholar] [CrossRef]
  35. Ali, M.P.; Kabir, M.M.; Haque, S.S.; Qin, X.; Nasrin, S.; Landis, D.; Holmquist, B.; Ahmed, N. Farmer’s behavior in pesticide use: Insights study from smallholder and intensive agricultural farms in Bangladesh. Sci. Total Environ. 2020, 747, 141160. [Google Scholar] [CrossRef] [PubMed]
  36. Baessler, C.; Klotz, S. Effects of changes in agricultural land-use on landscape structure and arable weed vegetation over the last 50 years. Agric. Ecosyst. Environ. 2006, 115, 43–50. [Google Scholar] [CrossRef]
  37. Berkhout, P.; van Bruchem, C. Agricultural Economic Report 2009 of the Netherlands: Summary; No. 2009-066; LEI WUR: The Hague, The Netherlands, 2009. [Google Scholar]
  38. Bonanno, A.; Materia, V.C.; Venus, T.; Wesseler, J. The plant protection products (PPP) sector in the European Union: A special view on herbicides. Eur. J. Dev. Res. 2017, 29, 575–595. [Google Scholar] [CrossRef]
  39. Boström, U.; Fogelfors, H. Response of weeds and crop yield to herbicide dose decision-support guidelines. Weed Sci. 2002, 50, 186–195. [Google Scholar] [CrossRef]
  40. Kraehmer, H.; van Almsick, A.; Beffa, R.; Dietrich, H.; Eckes, P.; Hacker, E.; Hain, R.; Strek, H.J.; Stuebler, H.; Willms, L. Herbicides as weed control agents: State of the art: II. Recent achievements. Plant Physiol. 2014, 166, 1132–1148. [Google Scholar] [CrossRef]
  41. Piel, C.; Pouchieu, C.; Carles, C.; Béziat, B.; Boulanger, M.; Bureau, M.; Busson, A.; Grüber, A.; Lecluse, Y.; Migault, L.; et al. Agricultural exposures to carbamate herbicides and fungicides and central nervous system tumour incidence in the cohort AGRICAN. Environ. Int. 2019, 130, 104876. [Google Scholar] [CrossRef] [PubMed]
  42. Arena, M.; Auteri, D.; Barmaz, S.; Bellisai, G.; Brancato, A.; Brocca, D.; Bura, L.; Byers, H.; Chiusolo, A.; et al.; European Food Safety Authority (EFSA) Peer review of the pesticide risk assessment of the active substance chlorpropham. EFSA J. 2017, 15, e04903. [Google Scholar]
  43. Gressel, J. Evolving understanding of the evolution of herbicide resistance. Pest Manag. Sci 2009, 65, 1164–1173. [Google Scholar] [CrossRef]
  44. Madsen, K.H.; Streibig, J.C. Benefits and risks of the use of herbicide-resistant crops. In Weed Management for Developing Countries: Addendum 1; FAO: Rome, Italy, 2003. [Google Scholar]
  45. Heap, I. The International Herbicide-Resistant, 2024. Weed Database. Available online: https://www.weedscience.org (accessed on 12 June 2024).
  46. Duke, S.O.; Powles, S.B. Glyphosate: A once-in-a-century herbicide. Pest Manag. Sci. 2008, 64, 319–325. [Google Scholar] [CrossRef] [PubMed]
Figure 1. Data collection on the agricultural sector of the European Union (from 2000 to 2021). * According to Eurostat: (a) wheat and spelt, rye, barley, oats, triticale, sorghum, other cereals, rice. (b) Field peas, broad and field beans, sweet lupins, other dry pulses and protein crops. (c) Potatoes, sugar beet, other root crops. (d) Rape, turnip rape, sunflower seeds, soya, linseed (oilflax), hemp, cotton, tobacco, aromatic, medicinal and culinary plants, other industrial crops. (e) Leguminous plants harvested green, lucerne, green maize, other plants harvested green from arable land. (f) Leafy or stalked vegetables, vegetables cultivated for fruit including melons, root, tuber and bulb vegetables, fresh pulses, strawberries. (g) Fruits, apples, pears, stone fruits, berries, nuts, citrus fruits, pome fruits, grapes, strawberries, fruits from subtropical and tropical climate zones, and other fruits.
Agriculture 14 01171 g001
Figure 2. Herbicide index (HI) in the EU from 2000 to 2021. The HI (mean values with S.E.—Standard Error) expresses the active substances (a.s.) with herbicidal activity in kg used per hectare of conventional agricultural land.
Agriculture 14 01171 g002
Figure 3. Mean values (n = 22) of the herbicide index (HI) in the European Union countries, from 2000 to 2021. The HI (mean values) expresses the active substances (a.s.) with herbicidal activity in kg used per hectare of conventional agricultural land.
Agriculture 14 01171 g003
Figure 4. Percentage of cropland and pastureland in European Union countries, from 2000 to 2021. The ratios of each agricultural land use to total agricultural land were used in the calculations, forming the IcropL (cropland index) and IpmL (pastureland index) for each EU country.
Agriculture 14 01171 g004
Figure 5. Percentage of conventional and organic land in European Union countries, from 2000 to 2021. The ratios of each farming system to total agricultural land (ha) were used in the calculations, forming the IconvAL (conventional AL index) and IorgAL (organic AL index) for each EU country.
Agriculture 14 01171 g005
Figure 6. Land cover of cropland by different groups of crops in the countries of the European Union for the period 2000–2021. The ratios of each area (ha) of crop groups (i.e., Gcl (cereals for the production of grain); GDp (dry pulses and protein crops); GRc (root crops); GIc (industrial crops); GPg (plants harvested green from arable land); GFv (fresh vegetables and strawberries); GPc (permanent crops); GOther (other cropland)) in the total cropland (ha) were used in the calculations, formatting the crop group index (IG) for each category (IGcl, IGDp, IGRc, IGIc, IGPg, IGFv, IGPc, IGOther) in EU countries.
Agriculture 14 01171 g006
Figure 7. Farm size groups in the countries of the European Union, for the period 2000–2021. The ratios of each farm size group in the total cropland (ha) were used in the calculations, formatting the farm size index (IFS) for each category (IFS1, IFS2, IFS3, IFS4, IFS5, IFS6, IFS7, IFS8) in EU countries.
Agriculture 14 01171 g007
Figure 8. Herbicide chemical families (HCFs) used in the countries of the European Union, for the period 2000–2021. Official data from FAO are missing for Bulgaria and Romania. The ratios of the amount of each HCF class (i.e., Hphy: phenoxy hormone products; Htrz: triazines; Hamd: amides; Hcar: carbamates; Hdin: dinitroanilines; Hsulf: sulfonyl ureas;Hurc: uracil; Hbpd: bipiridils; Hurea: ureas; Hother: other herbicides) to the total amount of herbicides were used in the calculations, formatting the herbicide chemical family index (IHCF) for each category (IHphy, IHtrz, IHamd, IHcar, IHdin, IHsulf, IHurc, IHbpd, IHurea, IHother) in EU countries.
Agriculture 14 01171 g008
Figure 9. Discrimination of the 27 Member States of the EU based on the significant parameters and LDA.
Agriculture 14 01171 g009
Table 1. Results of linear discriminant analysis (LDA) to determine the correlation of the significant variables indicated by MANOVA among the 27 Member States of the EU.
Structure Matrix
Functions1234567891011
Eigenvalue40.616 a21.954 a17.170 a10.577 a4.458 a2.124 a1.419 a1.186 a0.605 a0.345 a0.105 a
% of Variance40.421.817.110.54.42.11.41.20.60.30.1
Cumulative %40.462.279.389.894.296.497.899.099.699.9100.0
Canonical Correlation0.9880.9780.9720.9560.9040.8250.7660.7370.6140.5070.308
VariablesCorrelation between each variable and any discriminant function
IpmpL−0.953 *0.1550.0000.0510.113−0.003−0.020.1170.167−0.0220.103
IcropLb0.952 *−0.1550.000−0.05−0.1130.0040.02−0.118−0.1670.022−0.103
IGFv−0.0280.697 *0.318−0.0140.2490.192−0.0260.5490.067−0.08−0.026
IGPc−0.093−0.0980.833 *0.2490.177−0.1270.071−0.208−0.177−0.2860.131
IGPg0.0160.0190.000−0.573 *−0.275−0.0970.4610.181−0.164−0.5140.22
IGCl−0.021−0.143−0.4640.3530.646 *0.390.2070.011−0.071−0.1440.018
IorgALb0.009−0.067−0.053−0.1240.434−0.736 *−0.0960.244−0.4170.0730.000
IconvAL−0.0090.0670.0530.124−0.4340.735 *0.096−0.2440.417−0.0730.001
IGIc0.0180.11−0.2860.602−0.25−0.613 *0.1110.116−0.261−0.0990.026
HI0.0610.326−0.011−0.072−0.029−0.1570.609 *−0.501−0.2460.404−0.118
IGRc−0.0020.5−0.057−0.319−0.1260.134−0.309−0.565 *0.295−0.2190.248
IGDp−0.025−0.053−0.0250.0120.1280.04−0.2880.000−0.894 *0.2820.127
IGoth0.045−0.0610.122−0.091−0.27−0.002−0.452−0.0080.4240.711 *−0.099
a Eleven (11) canonical discriminant functions were used in the analysis. b This variable was not used in the analysis. * Pooled within-group correlations between discriminating variables and standardized canonical discriminant functions: largest absolute correlation between each variable and any discriminant function.
Disclaimer/Publisher’s Note: The statements, opinions and data contained in all publications are solely those of the individual author(s) and contributor(s) and not of MDPI and/or the editor(s). MDPI and/or the editor(s) disclaim responsibility for any injury to people or property resulting from any ideas, methods, instructions or products referred to in the content.

