Abstract
Soil is a heterogeneous medium that exhibits considerable variability in both spatial and temporal dimensions. Proper management of field variability using variable-rate fertilization (VRF) techniques is essential to maximize crop input–output ratios and resource utilization. Implementing VRF technology on a localized scale is recommended to increase crop yield, decrease input costs, and reduce the negative impact on the surrounding environment. This study assessed the agronomic and environmental viability of implementing VRF during the cultivation of summer maize using an on-the-go detector of soil total nitrogen (STN) to detect STN content in the test fields. A spatial delineation approach was then applied to divide the experimental field into multiple management zones. The amount of fertilizer applied in each zone was determined based on the sensor-detected STN. The analysis of the final yield and economic benefits indicates that plots that adopted VRF treatments attained an average summer maize grain yield of 7275 kg ha−1, outperforming plots that employed uniform-rate fertilization (URF) treatments, which yielded 6713 kg ha−1. Through one-way ANOVA, the yield p values of the two fertilization methods were 6.406 × 10⁻¹⁵, 5.202 × 10⁻¹⁵, 2.497 × 10⁻¹⁵, and 3.199 × 10⁻¹⁵, respectively, indicating that the yield differences between the two fertilization methods were noticeable. This led to an average yield increase of 8.37% ha−1 and a gross profit margin of USD 153 ha−1. In plots in which VRF techniques are utilized, the average nitrogen (N) fertilizer application rate is 627 kg ha−1. In contrast, in plots employing URF methods, the N fertilizer application rate is 750 kg ha−1. The use of N fertilizer was reduced by 16.4%. As a result, there is a reduction in production costs of USD 37.5 ha−1, achieving increased yield while decreasing the amount of applied fertilizer. Moreover, in plots where the VRF method was applied, STN was balanced despite the reduced N application. This observation can be deduced from the variance in summer maize grain yield through various fertilization treatments in a comparative experiment. Future research endeavors should prioritize the resolution of particular constraints by incorporating supplementary soil data, such as phosphorus, potassium, organic matter, and other pertinent variables, to advance and optimize fertilization methodologies.
1. Introduction
Nitrogen (N) is an essential element crucial for crop biomass development [1,2] and yield formation [3]. Due to soil’s heterogeneous nature with its diverse characteristics, soil nutrient properties vary across different spatial and temporal locations [4]. In traditional agricultural production, farmers presume uniform fertility levels across different zones within a field, leading to the application of consistent N fertilization across the entire field [5,6]. However, the reality is that most agricultural soils exhibit substantial variability in both spatial distribution and temporal changes, exerting a profound impact on crop yield and the surrounding environment [7,8]. Raun et al. (1998) demonstrated that notable diversity in soil N content persists among various zones, even within small-scale dimensions (0.3 m × 0.3 m), with an R2 coefficient of 31% [9]. Ayoubi et al. (2007) reported comparable results [10]. Precision agriculture endeavors to optimize crop yields by customizing inputs, such as fertilizers, to meet specific field zones’ distinct needs and reduce production inputs and environmental impact [11,12]. Variable-rate fertilization (VRF) leverages the natural variability of soil within fields by reducing fertilizer application in high-fertility areas, increasing it in low-fertility areas, and abstaining from fertilization where deemed unnecessary [13]. This approach aims to optimize agricultural inputs for enhanced production efficiency [14]. Although N fertilizer is essential for plant growth, the overapplication of N leads to increased production costs and adverse environmental impacts [15]. This imbalance between the N supply and the plant’s nutritional needs ultimately causes economic losses and decreases N use efficiency [16,17]. Meena et al. (2022) believed that utilizing VRF technology is a crucial strategy for increasing crop yield, minimizing production inputs, maximizing economic returns, and refining field fertilizer management [18]. Implementing VRF has improved fertilizer efficiency, reduced agricultural costs, and promoted an environmentally sustainable method [19]. Hence, it carries substantial significance for the sustainable development of agriculture.
Therefore, accurately characterizing the spatial variability of soil in each region is an essential step in precision agriculture [20]. According to Rogovska et al. (2018) and Xia et al. (2020), accurate N fertilizer management can significantly improve N utilization efficiency, reducing costs for farmers and mitigating the environmental impact of crop production [21,22]. The method for delineating small-scale management zones (MZs) effectively characterizes soil properties within limited areas [23,24,25]. Using spatial zoning techniques in VRF can significantly improve production efficiency and reduce negative environmental impact [26,27]. Nawar et al. (2017) studied different soil nutrient MZs [28]. They found that applying the VRF method increased efficiency and decreased environmental impact compared to the traditional uniform-rate fertilization (URF) method. This method guarantees the precise alignment of nutrient inputs with the specific requirements of the crop by considering minor variations in soil fertility at a small scale. Yang et al. (2001) observed a notable enhancement in crop yield in areas where VRF was applied, as opposed to areas utilizing URF [29]. The researchers noted that the coefficient of variation in yield data from the VRF areas was lower than the URF-treated areas. Nevertheless, their conclusion underscored that considering the supplementary expenses of soil sampling and data analysis for VRF application would significantly reduce these economic benefits. While VRF technology has demonstrated its ability to boost yields, the potential additional costs of soil testing might outweigh the benefits in yield. Therefore, traditional soil laboratory analysis is often accompanied by substantial expenses, making it impractical for widespread data collection [30]. The primary prerequisite for implementing VRF technology is the capability to delineate the intrinsic variability of soil characteristics. Innovative online soil sensors have been developed, utilizing advanced optical methods to achieve rapid, quantitative, and non-intrusive measurements [31,32]. Visible and near-infrared (vis–NIR) spectroscopy is one of the most commonly used optical technologies for in situ soil scanning. The method is characterized by its speed, reliability, and ability to gather crucial soil attribute measurements. It is a cost-effective method that can generate high-density, on-site scale data [33,34]. Maleki et al. (2008) developed a soil-sensor-based VRF system explicitly designed for phosphorus application during maize cultivation [35]. The evaluation index included leaf count and grain yield. The experimental results indicated that utilizing VRF led to a decrease in the variability of plant leaf count and a notable enhancement in maize yield. These results suggest a uniform phosphorus distribution in the area treated with VRF. These findings are consistent with the study by Yang et al. (2007), who utilized the Green Seeker RT200 VRF (NTech Industries, Inc., Ukiah, CA USA) system to delineate MZs while evaluating the Normalized Difference Vegetation Index (NDVI) for winter wheat [36]. The N fertilizer requirements were determined for each MZ, and on-field VRF experiments were conducted according to the specific N demands within these zones. The experimental results indicated that winter wheat treated with VRF exhibited a reduced normalized vegetation spatial variability index, leading to more uniform crop growth and notably increased yields compared to previous years. Colaço et al. conducted a six-year experiment with VRF in citrus orchards, and the results showed that VRF had good results in soil fertility management and yield improvement, which could improve the agronomic efficiency of chemical fertilizers [26]. Many studies have reported that nutrient imbalance in soil affects crop growth, development, and yield. At present, among the data acquisition methods of VRF, the expensive laboratory chemical analysis method is being replaced by remote-sensing technology. Among all the soil nutrients that affect crop development, N plays a major role, so it is very important to monitor the soil state by a remote-sensing method [37,38]. In a comparative study by Marius et al. (2022) examining the effects of URF versus VRF on winter wheat, the final findings revealed that VRF resulted in a 14.55% increase in yield compared to URF [39]. Additionally, there were potential savings of approximately 1000 kg ha−1 of fertilizer. This research underscores the optimistic prospects of sensor-based VRF technology, both currently and in the future. This technology facilitates a decrease in the use of fertilizers while enhancing crop yields by the tenets of sustainable development [40]. Only some finished sensors are on the market. Moreover, these products have low detection accuracy, high production cost, and low versatility. The development process of VRF equipment is cumbersome, so there are still many limitations and challenges in its development [41].
Despite numerous studies demonstrating significant yield advantages in VRF for crops, some scholars are skeptical about the technology’s potential [42]. There is an increasing need for additional research to evaluate the future advancements and environmental advantages of VRF in the agricultural field. This study aimed to evaluate the economic and ecological advantages of using VRF to improve crop yield and reduce fertilizer consumption during summer maize planting using proximal spectral dynamic sensors. Summer maize leaves in the jointing stage will cover part of the topsoil, which affects the prediction of STN by satellite remote sensing or UAV. The dynamic sensor used in this study can penetrate the bottom soil layer to avoid the influence caused by leaves covering the topsoil. The effectiveness of the two fertilization methods was evaluated by comparing N input, grain yield, and soil nutrient health status in the experimental area. Finally, the limitations of this study are analyzed to help future research in this area.
2. Materials and Methods
2.1. Research Procedure
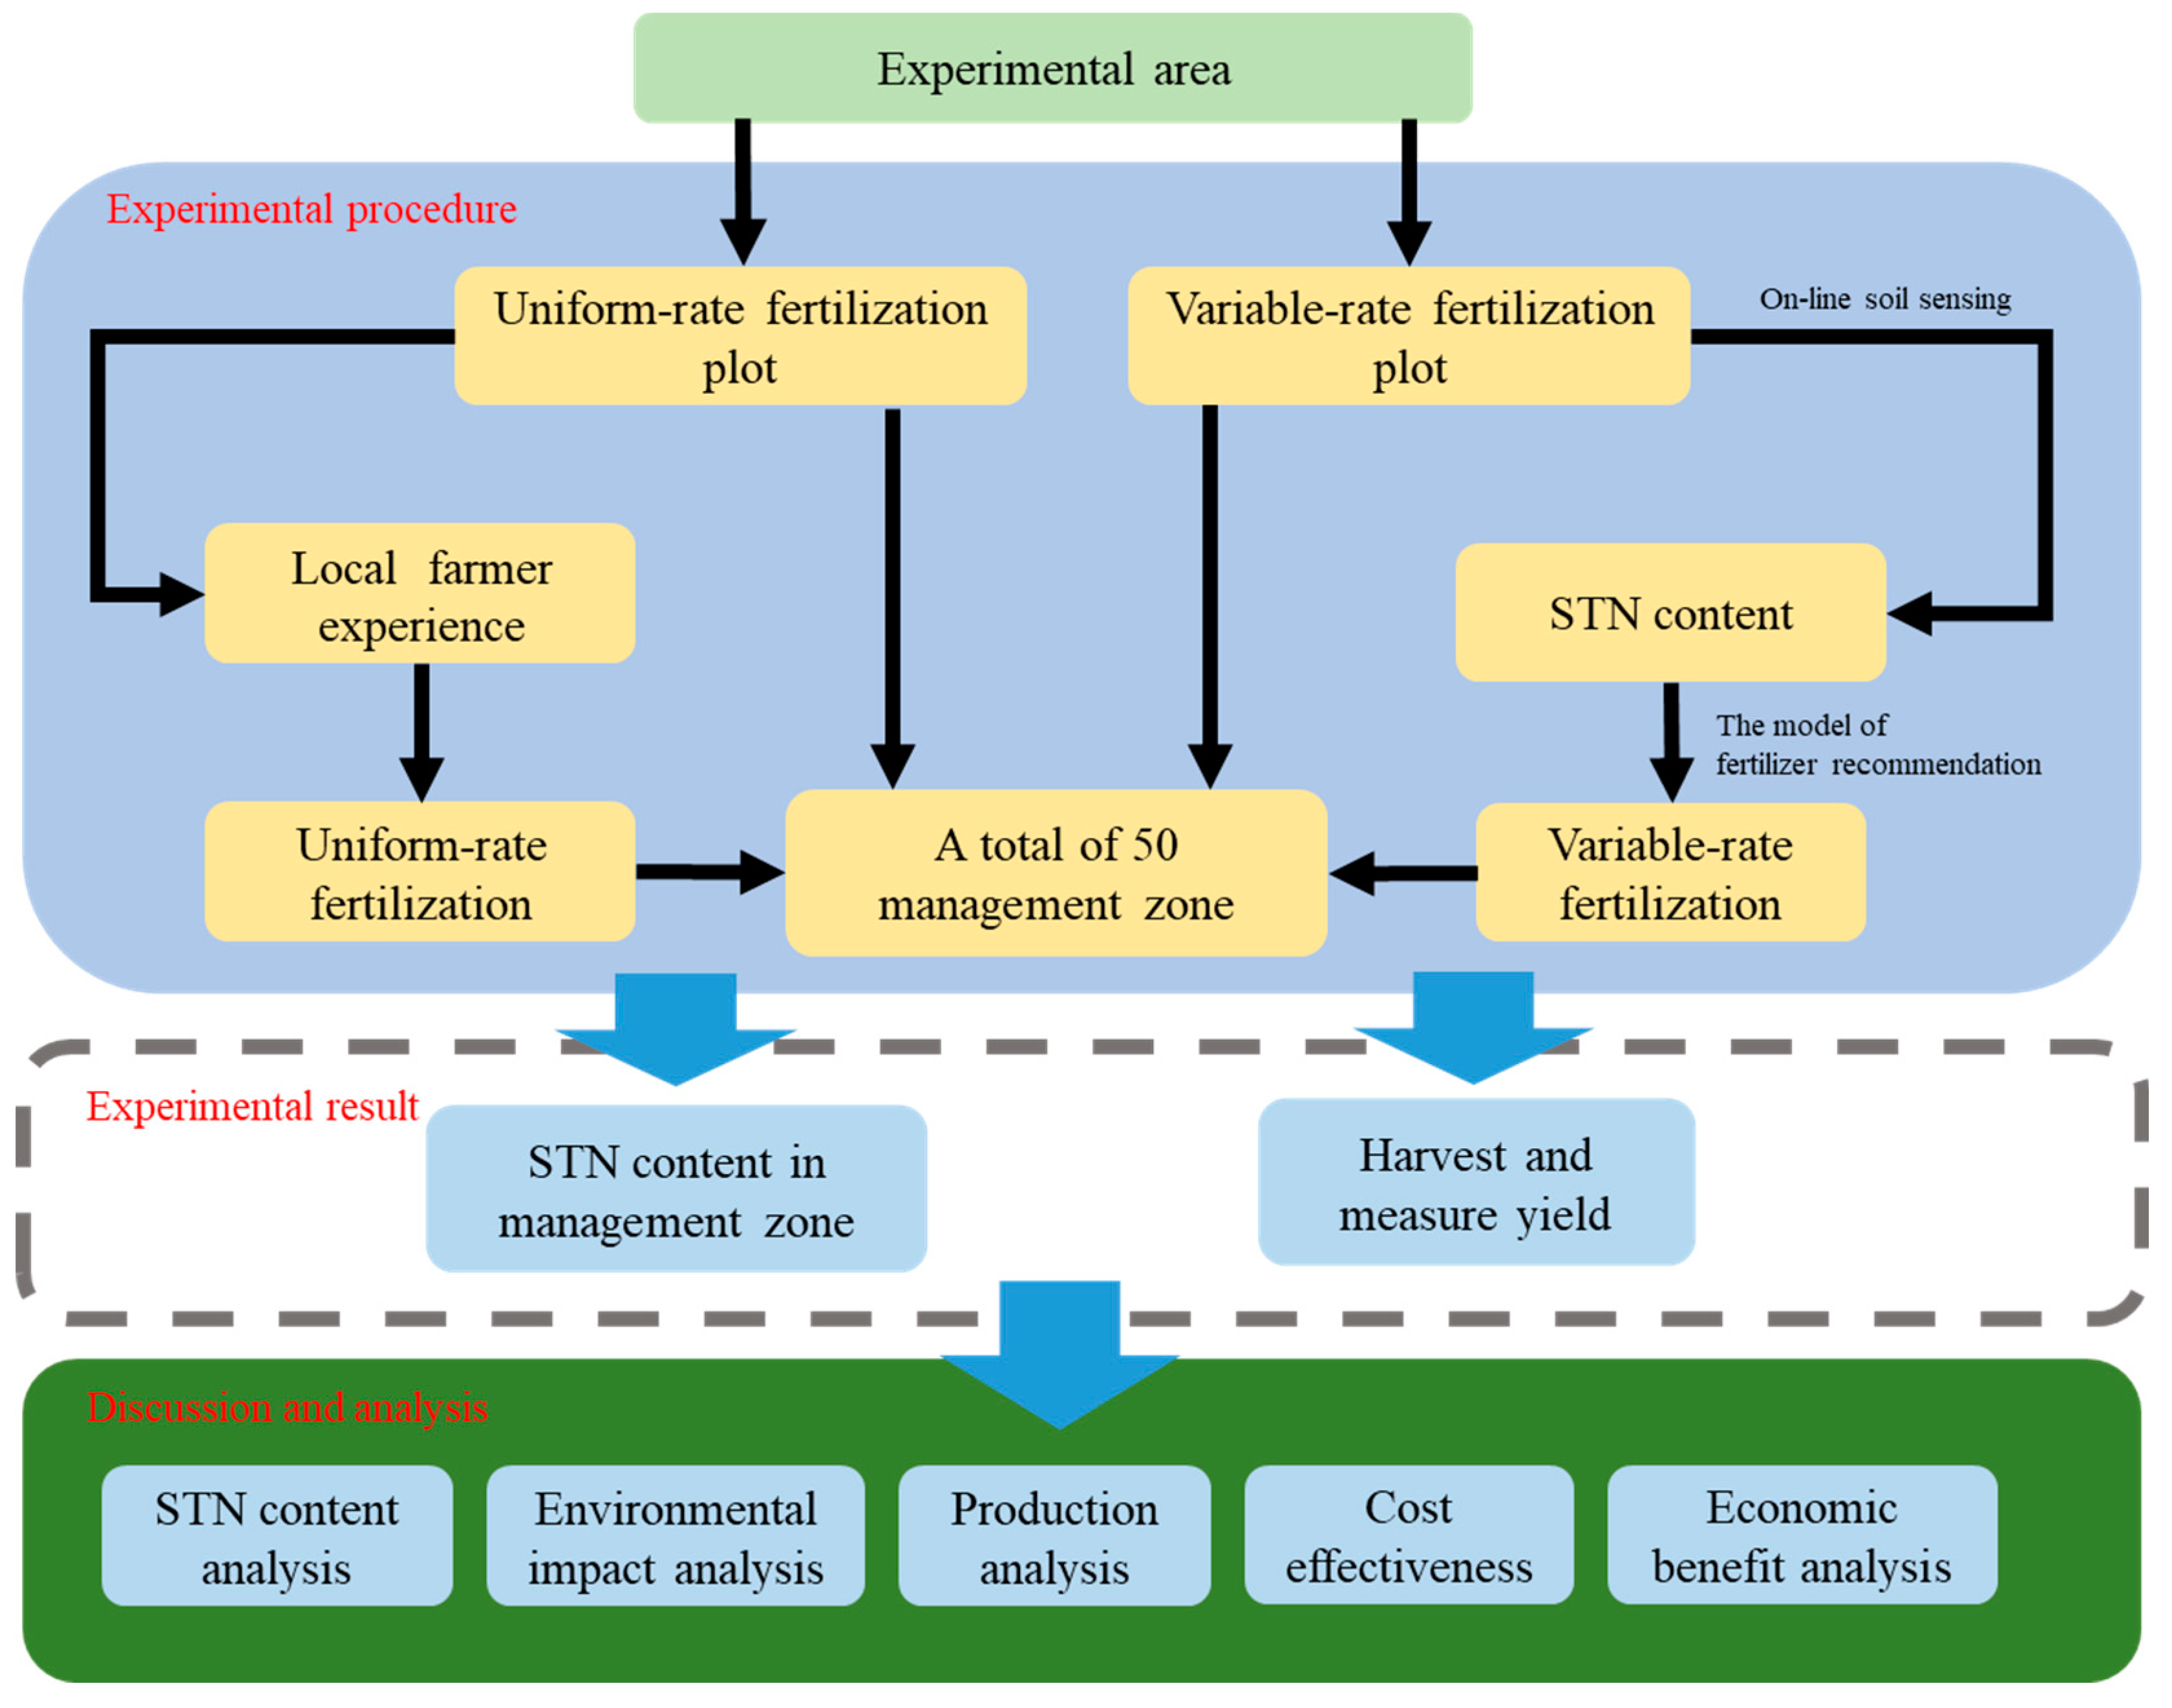
The methodology employed in this study is illustrated in Figure 1. A comparative analysis between URF and VRF treatments was conducted during the growth period of summer maize within the experimental area. During the basal dress stage of crop planting in the experimental plots, an on-the-go detector developed by Zhou et al. (2021) was utilized to measure STN, assessing the fertility characteristics of each MZ and generating maps displaying the distribution of STN content [43]. The STN content was categorized, and a recommended fertilization model for VRF was established by adjusting the URF fertilization rates as a percentage. The STN content obtained from the on-the-go detector served as the input variable for the fertilizer application model, in conjunction with local farmers’ planting experience, to determine the fertilizer requirement of each MZ, and maps guiding VRF were generated using software (ArcGIS 10, Esri, Inc., Redlands, CA, USA) and interpolation methods. The same procedures were repeated during the jointing stage. Importantly, during communication with local farmers, it was suggested to apply 60% of the total N fertilizer during the basal dressing stage, with the remaining 40% applied during the jointing stage. This strategy not only mitigates the environmental impact associated with large-scale fertilization but also enhances N use efficiency, achieving more precise management. Subsequent to the summer maize harvest, manual measurements of grain yields were taken in each MZ to establish yield maps for the zones. One-way ANOVA analysis was performed on summer maize yield data with the null hypothesis that there was no significant yield difference between the two fertilization methods. This method can analyze whether the factors impact the experimental results and evaluate the importance of the experimental results by calculating the effect size. By analyzing the four VRF plots and URF plots, the p values are obtained to judge whether the null hypothesis is true.
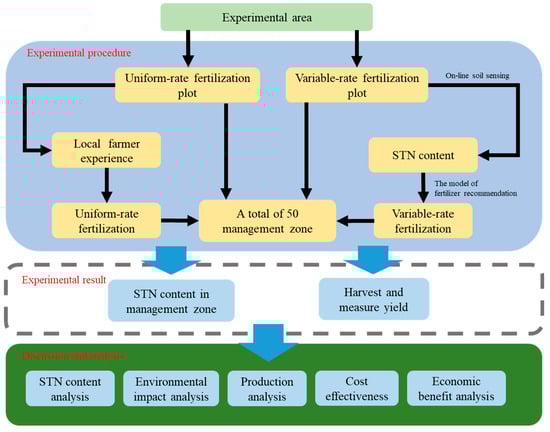
Figure 1.
A flow diagram explaining different steps performed during the study.
2.2. On-Line Soil Sensing
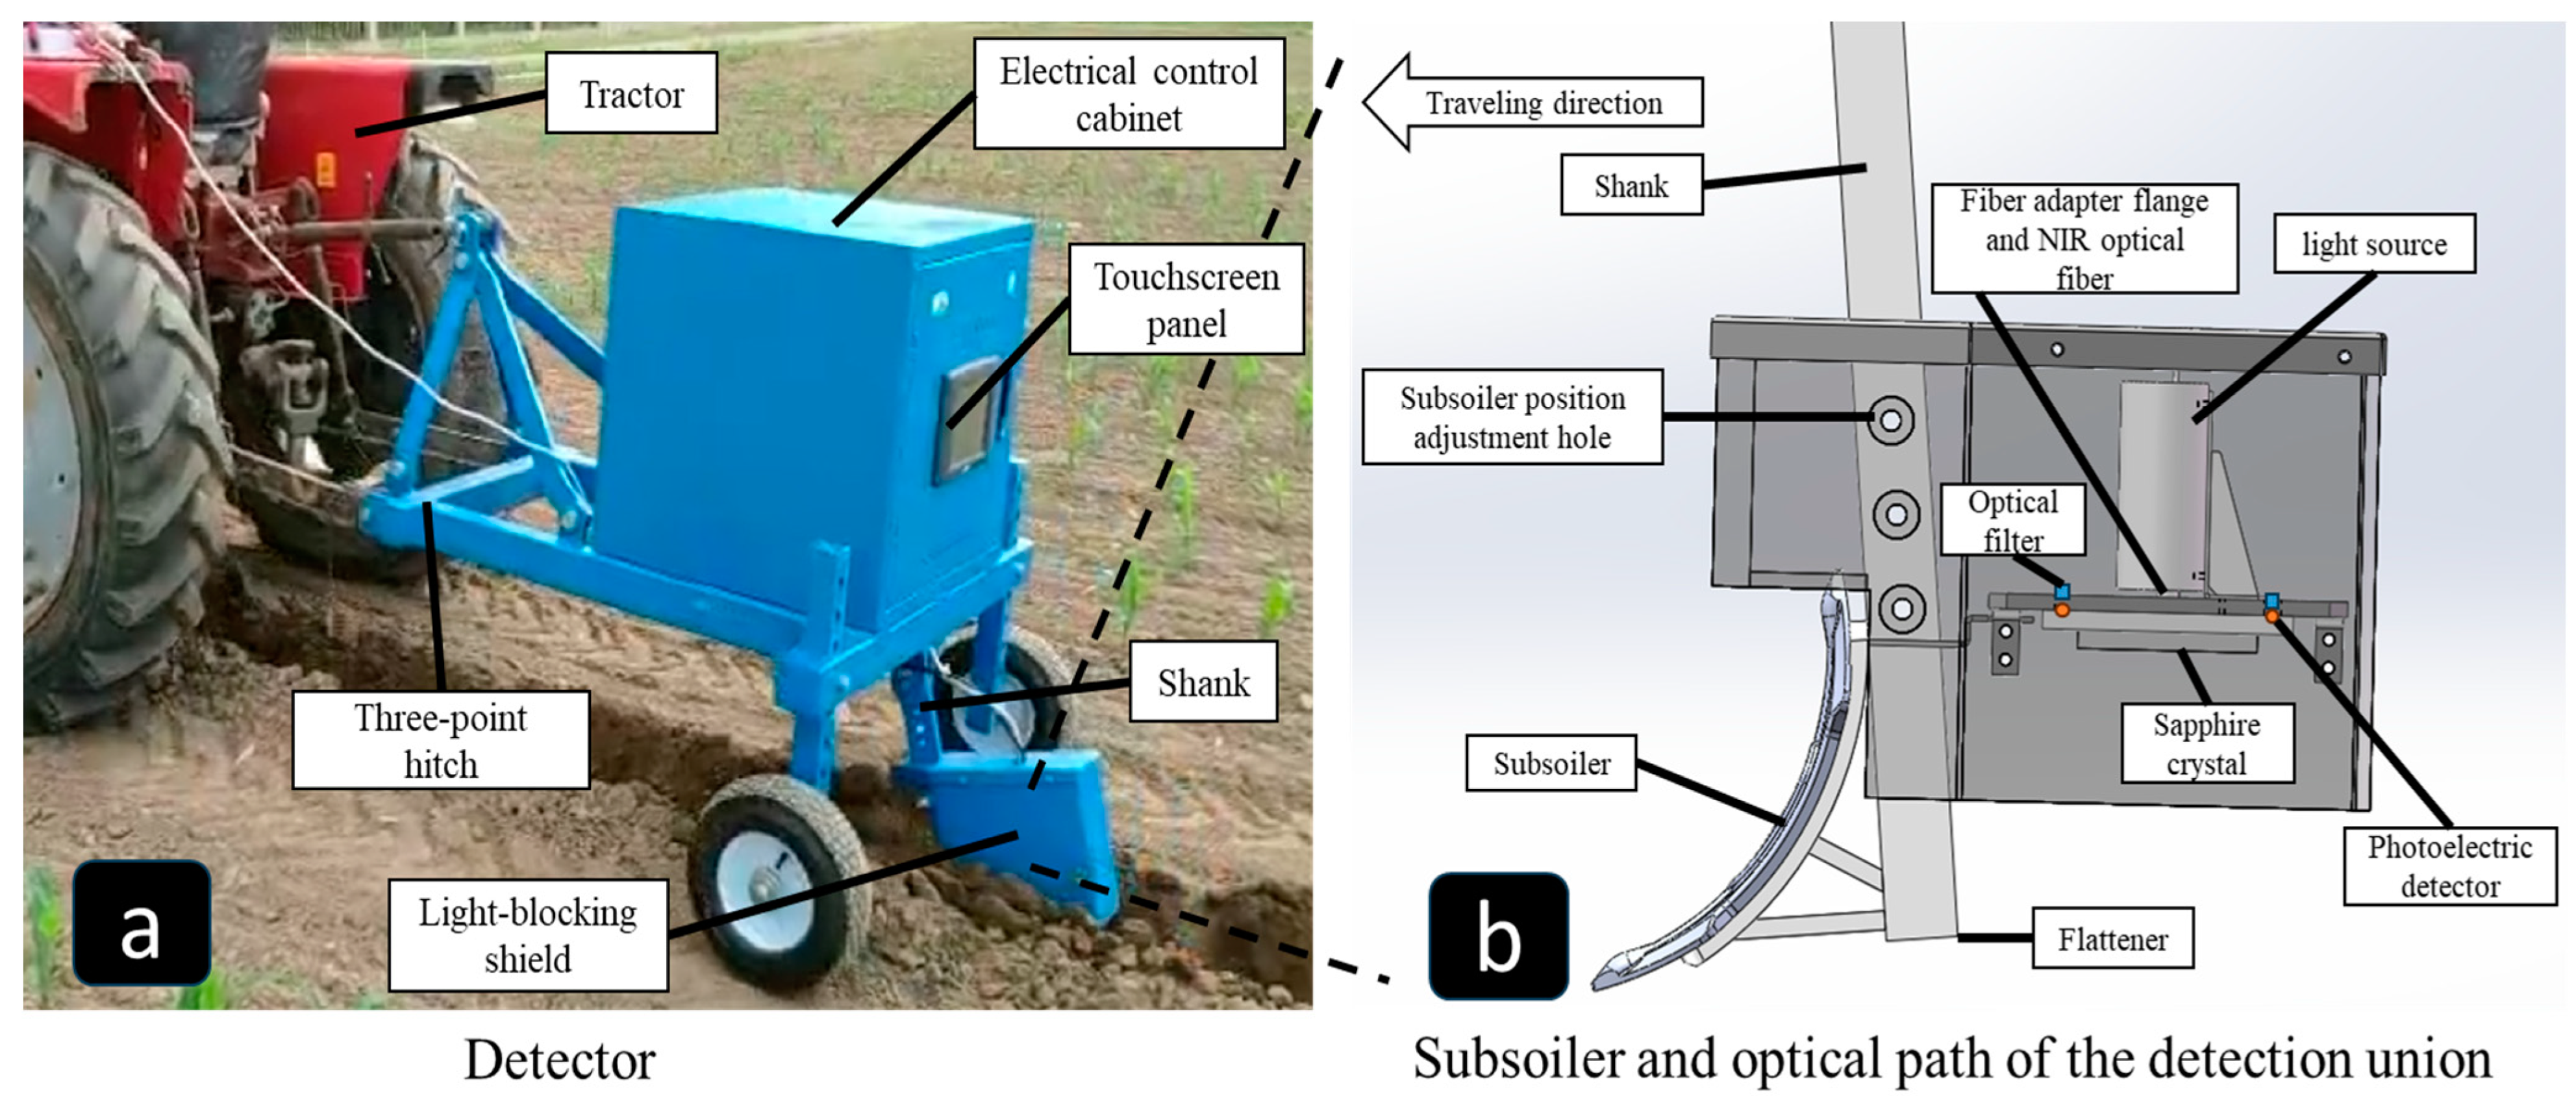
During the summer of 2018, STN was measured in experimental fields using an on-the-go detector, this device was designed and developed by Zhou et al. [43] (Figure 2a). The complete system comprises mechanical, optical, and control units. The mechanical unit is connected to the vehicle via a three-point suspension structure, and the unit includes a subsoiler designed to penetrate the soil at a specified depth (15–25 cm), creating a trench. The bottom of the trench is leveled by the downward pressure applied by the penetration unit. The optical unit is mounted on the back of the subsoiler to acquire soil spectra from the bottom of the opened trench (Figure 2b). The control unit utilizes the MSP430F149 microcontroller (MSP430F149, Texas Instruments, Dallas, TX, USA) as the primary processing chip, which embedded the STN prediction model [44]. This instrument has a fairly fast inspection cycle (0.5 s per cycle) and is rugged with no stray parts.
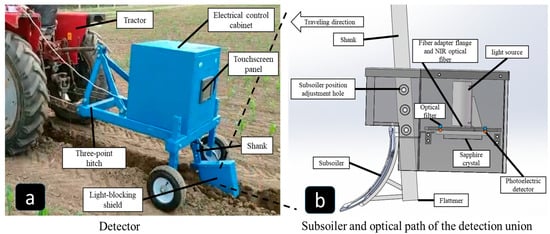
Figure 2.
On-the-go detector, subsoiler, and the optical path of the detection unit; (a) detector and (b) subsoiler and optical path of the detection unit.
2.3. Experimental Field
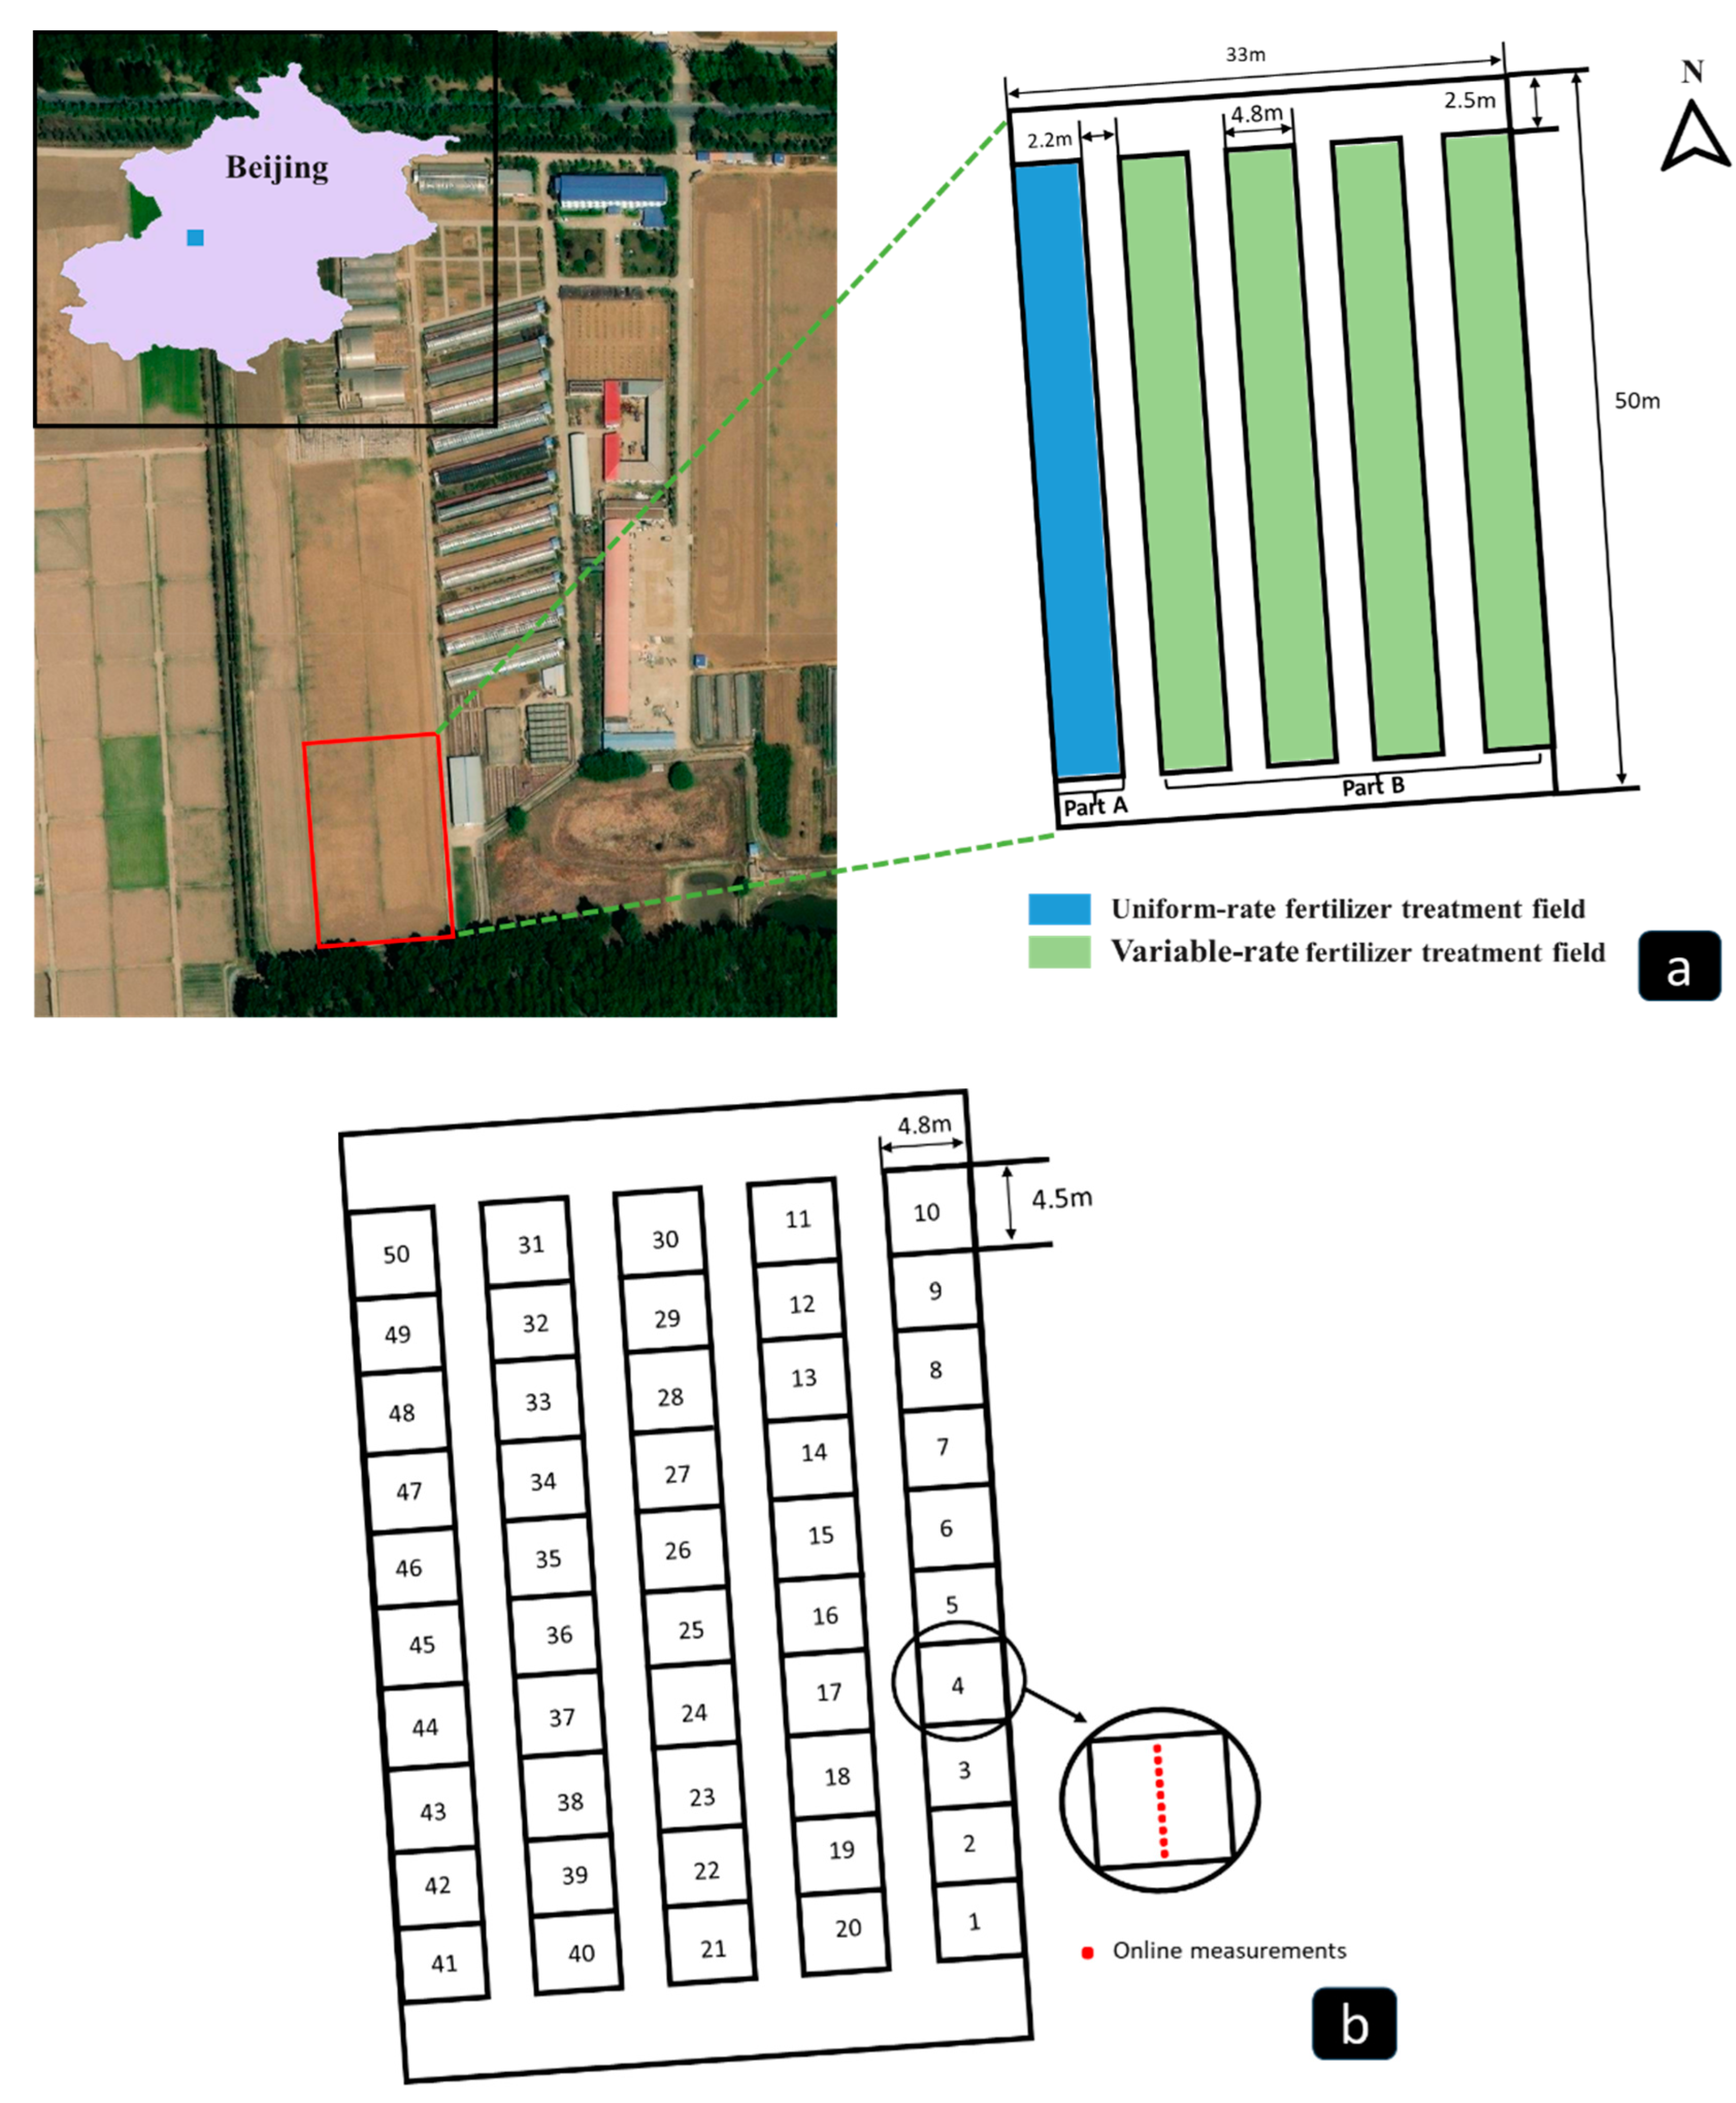
The field experiment took place in 2018 at the Shangzhuang Experimental Station in the Haidian District of Beijing, China. The experimental field spans 50 m × 33 m, covering a total area of 1650 m2, with geographical coordinates of 116.106694° E and 40.079547° N. The climate features of Beijing are four distinct seasons—hot and rainy summers, cold and dry winters, and moderate temperatures during spring and autumn—and minimal annual precipitation, with apparent seasonal variations between dry and wet periods. The average annual temperature is between 9 °C and 19 °C. Over the experimental period, the average annual precipitation remained around 575 mm, with yearly temperatures ranging from 8 °C to 13 °C.
In Figure 3a, the experimental field is delineated with 2.5 m spaces at the front and back to allow for machinery maneuvering, while the rest is divided into two sections. The first part (Part A) covers an area of 360 m2 and is designated for traditional URF experiments. The second part (Part B), covering an area of 1160 m2, is allocated explicitly for conducting VRF experiments. Between parts A and B, there is a deliberate vacant space measuring 45 m × 2.2 m, intentionally left untreated to minimize potential interference among different fertilization methods. Part B is further subdivided into four equal experimental plots, each measuring 45 m in length and 4.8 m in width, with a 2.2 m gap between each pair of plots. This division serves the purpose of conducting VRF experiments four times, ensuring precision by eliminating incidental factors that might impact the accuracy of the experiment. The entire experimental field is cultivated with summer maize. In Part A, N fertilizer is uniformly applied during the basal dressing and jointing stages of the summer maize. In Part B, an on-the-go STN concentration detector is combined with VRF techniques to administer N fertilizer during summer maize cultivation’s basal dressing and jointing stages.

Figure 3.
Geographic location of the experimental field in Beijing; (a) schematic diagram of the experimental design of two parts of the field and (b) the position of each soil spectrum taken by the applicator throughout the two parts.
The implementation of real-time VRF is associated with significant costs that have the potential to surpass the economic benefits due to the heightened labor requirements [14,45]. Additionally, there might be appreciable errors in consecutive soil N values detected by the field-operating detector, likely caused by non-soil elements or mechanical vibrations. To tackle this issue, it is advisable to utilize the mean of 10 successive soil N detection values as the proposed N fertilizer application rate for an MZ (refer to Figure 3b). After conducting tests, the STN concentration detector traverses a distance of 4.5 m for every ten newly collected soil spectral data points. To optimize costs, each plot designated for VRF is divided into 10 MZs, each measuring 4.5 m in length and 4.8 m in width.
2.4. Development of N Fertilizer Application Model
Rational application of fertilizer is the basis for reducing chemical fertilizer usage and ensuring food security. When STN content falls short of enabling optimal crop growth, applying N fertilizers becomes imperative to ensure sufficient nutrients in the soil. In recent years, site-specific N fertilization (SNF) has garnered considerable attention in the agricultural sector. SNF is considered a practical approach for managing field variability by determining the optimal N fertilizer doses for various field locations. The first step in SNF involves dividing field areas into multiple MZs and assessing the N variability within each MZ. Ideally, MZs should consider various soil attributes to determine production potential, as no single indicator can adequately represent the yield potential of a field or MZ [46,47]. Once the production potential of an MZ is determined, the N fertilization rate for URF is typically adjusted by a certain percentage allocated to the MZ as a VRF fertilization rate. Adjustment of N fertilizer application rates depends on the degree of STN variability in the field, and the adjusted N fertilizer application rate was a 30–50% float on top of the URF application rate [48]. Up to now, SNF has two methods: the Kings approach (SNF-KA) and the Robin Hood approach (SNF-RHA) [49,50]. SNF-KA involves using a high N rate in areas with high production potential and a low N rate in areas with low production potential. Conversely, SNF-RHA differs from SNF-KA in that the RHA restricts the amount of N fertilizer inputs in areas of high production potential and increases the amount of N fertilizer inputs in areas of low production potential. Some studies have been conducted to evaluate SNF-KA and SNF-RHA. For example, Maleki (2008) reported a study using sensors for real-time detection of phosphorus nutrients in field soils and real-time adjustment of phosphorus fertilizer application to maize using the SNF-RHA method [35]. Zhang et al. (2021) conducted a VRF application management experiment on wheat to determine the effectiveness of each N application method by comparing two types of VRF applications, KA and RHA, with URF applications, with VRF adjustments of up to 40% during the study [50]. Munnaf et al. (2023) compared the economic aspects of SNF-KA and SNF-RHA in poppy cultivation, affirming that both approaches contribute to increased yields [51]. The RHA consumed 16.4–118.1% less N fertilizer than the KA and 33.3–56.2% than the URF treatment. Compared to SNF-KA, SNF-RHA stands out as a more economical approach with less environmental impact [49]. Most studies above concluded that SNF-RHA is more productive, economically efficient, and environmentally sustainable than SNF-KA.
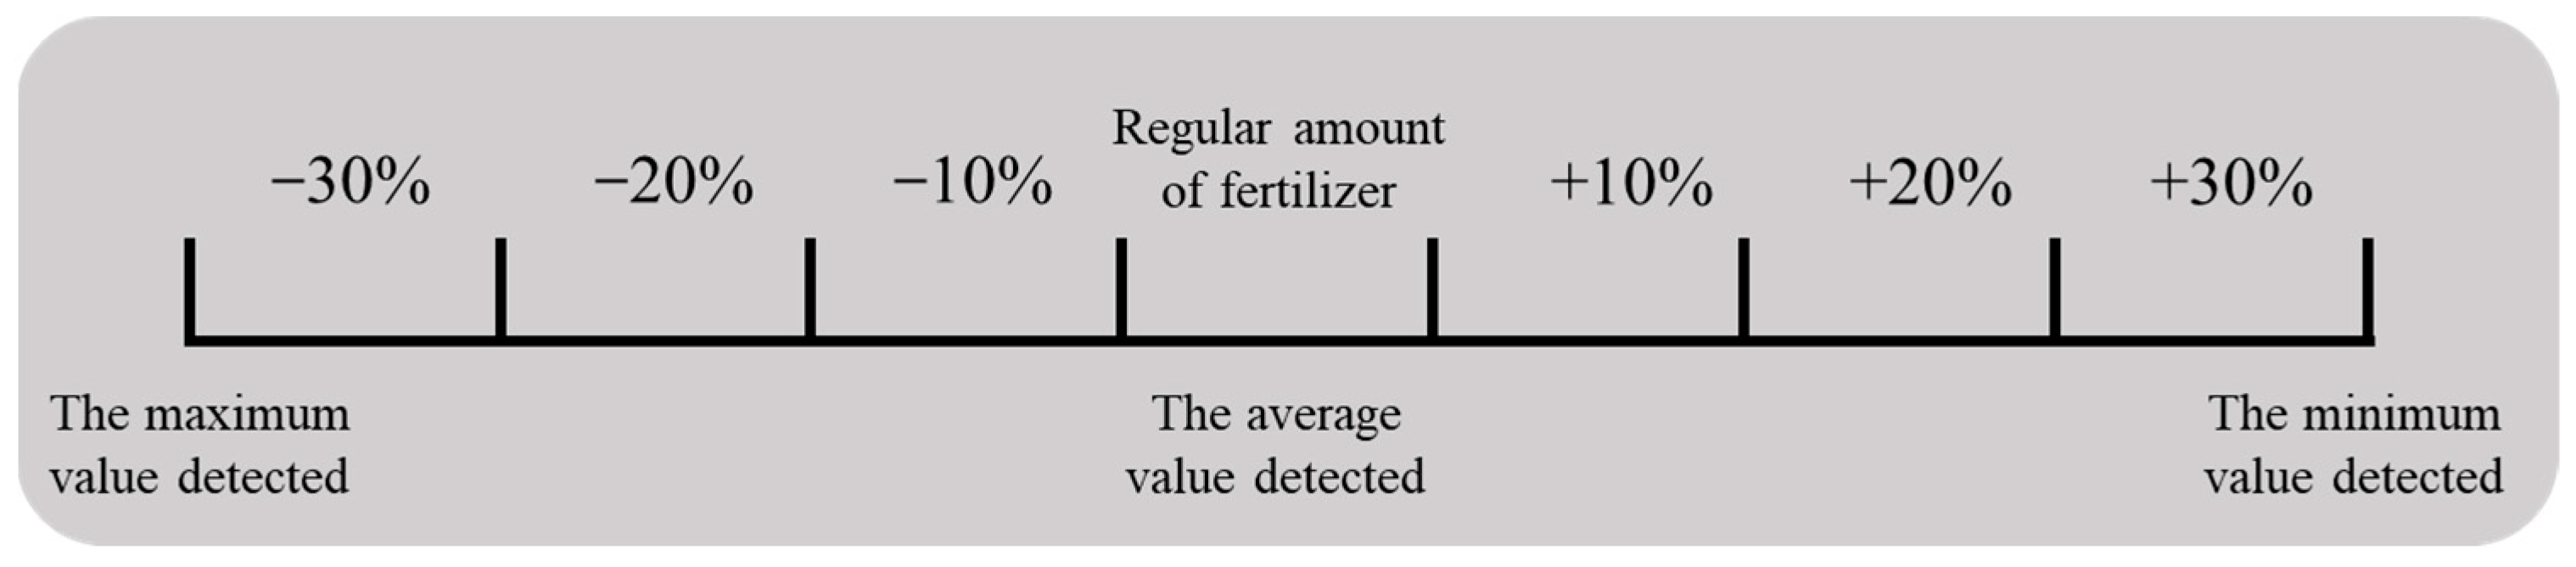
In this study, SNF-RHA was employed, and the recommended fertilizer application for URF was derived from the historical planting experiences of local farmers in the experimental area. The quantity of fertilization is affected by factors such as whether crop residues were returned to the field in previous years, plant density, and weather conditions during the fertilization period. The recommended quantity of fertilizer mentioned above is not specifically tailored for VRF. To develop the VRF plan, insights from Schillaci et al.’s (2021) experiments conducted in Italy in 2017–2018 on the impact of variable-rate N distribution on maize yield were utilized [48]. The VRF plan in this experiment is based on the soil properties of the current MZ. It involves a specific percentage adjustment to the fertilizer quantity of URF, serving as the recommended fertilizer quantity for VRF in that MZ. During the soil nutrient detection process using an on-the-go detector while traversing the field, this fertilization plan was divided into seven fertilizer application levels based on the mean value, as shown in Figure 4. In the fertilization process, VRF was applied only to N fertilizer, while phosphorus and potassium fertilizers were uniformly applied to all 50 MZs based on previous planting experiences. Throughout the entire planting process, fertilizer was applied twice in the MZs. During the basal dressing stage, fertilizer application (at sowing date), N, phosphorus, and potassium fertilizers were used. The second application involved top-dressing with N fertilizer during the jointing stage (at the beginning of stem internode elongation).
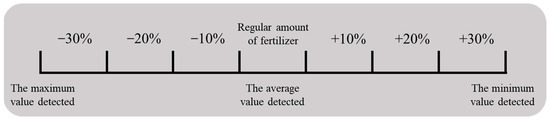
Figure 4.
Schematic representation of the graded fertilization rate for VRF.
3. Results
3.1. Map Development for STN
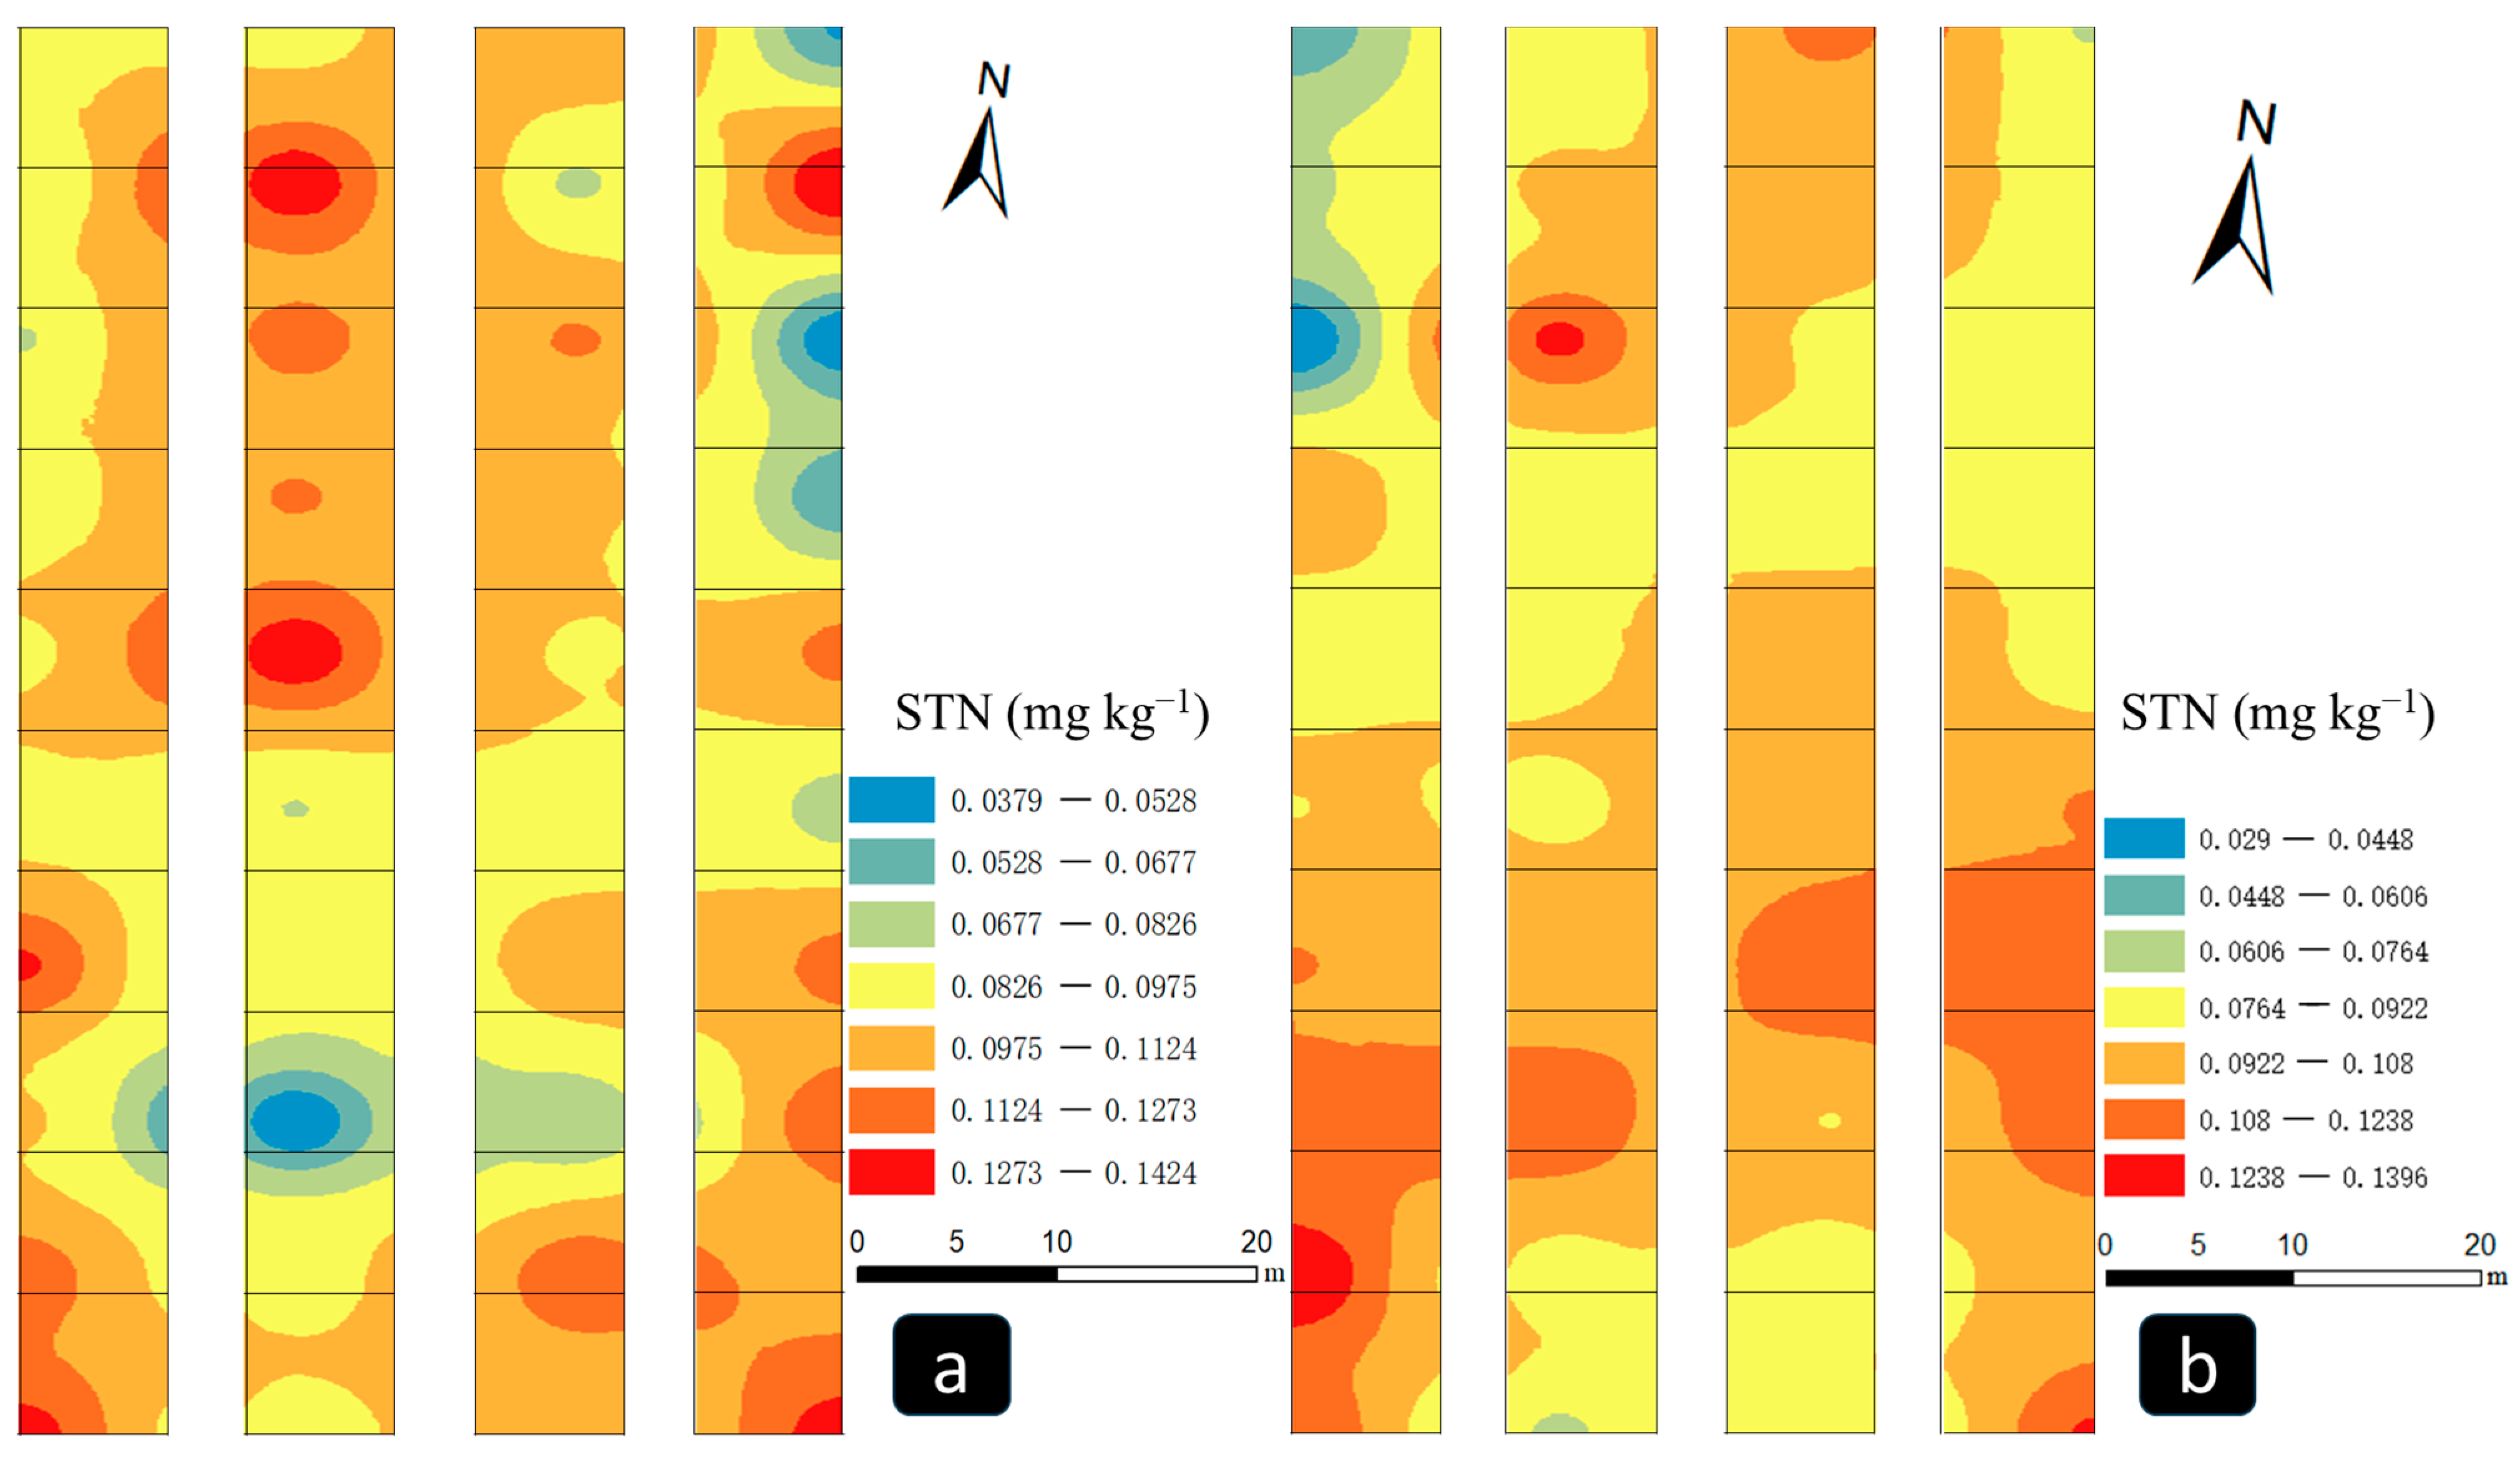
Geostatistical models can directly reveal the spatial variability and will help farmers and decision makers improve soil management [52,53,54]. Utilizing ArcGIS 10.8 software, an STN map was generated using online soil sensing data. The decimal degree coordinates of the GPS-recorded measurement points were converted into Degree–Minute–Second (DMS) coordinates to represent metric values. Subsequently, the DMS coordinates of the measurement points and detected values were imported into ArcGIS 10.8 software. Inverse Distance Weighting (IDW) was employed for data interpolation, providing linear, unbiased, and optimal estimation for unknown sample points. This approach effectively addresses data skewness and mitigates the influence of outliers. The choice of IDW is supported by its superior estimation accuracy compared to alternative methods. The resultant map, illustrating the STN content in VRF plots (as depicted in Figure 5), reveals significant fluctuations (ranging from 0.0379 mg kg−1 to 0.1424 mg kg−1 at the basal dressing stage, and 0.029 mg kg−1 to 0.1396 mg kg−1 at the jointing stage) within the relatively limited sampling area of 1650 m2. This map convincingly showcases the ability of the on-the-go detector to rapidly and accurately predict STN content.
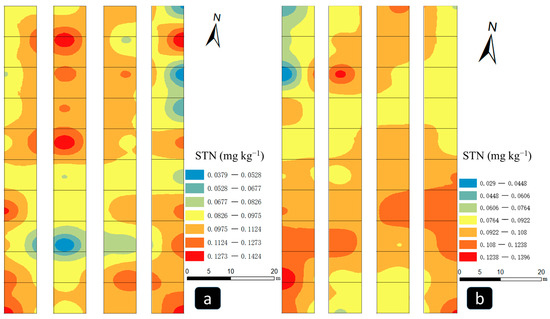
Figure 5.
Map of STN content in VRF plots (plot 1 to plot 4); (a) shows the STN content at the basal dressing stage; (b) shows the STN content at the jointing stage.
In the STN detection map during the basal dressing stage (Figure 5a), it is evident that within the four plots undergoing VRF treatments, the STN content primarily falls between 0.0826 mg kg−1 and 0.1124 mg kg−1, with only a few areas registering below 0.0528 mg kg−1. This indicates that, aside from sporadic low-level zones, the majority of the region maintains a normal STN content level. Contrasting with the STN detection map during the jointing stage (Figure 5b): (1) the prevalence of low-STN areas during the jointing stage is lower compared to the basal dressing stage, (2) regions exhibiting low STN content during the basal dressing stage demonstrate an increase during the jointing stage, and (3) areas with initially high STN content during the basal dressing stage show a decrease during the jointing stage. This highlights the effectiveness of the ‘SNF-RHA’ VRF method employed in this experiment in neutralizing STN, thus fostering a conducive environment for the growth of summer maize in the experimental area.
3.2. Fertilizer Consumption
In this experiment, the selected N fertilizer (urea) has an effective nutrient content of 46%. The historical application dosage of this fertilizer for summer maize in the experimental area in past years was 750 kg ha−1, which is also used as the N dosage for the current URF MZs. During the basal dressing stage, dynamic measurements of STN are conducted using online soil sensors in VRF MZs, based on the N deficiency in the soil of each MZ, and 60% of N fertilizer is applied as basal fertilization. At the jointing stage of summer maize, another round of total N measurements of the dynamic soil is conducted using an on-the-go detector, and 40% of the N fertilizer is applied. During the basal dressing stage, the N fertilizer application for URF MZs (41–50) is 450 kg ha−1, based on the local farmers’ planting experience in the experimental area. For VRF MZs (1–40), the fertilization amount is adjusted according to the VRF recommendation scheme in the “Establishment of N fertilizer recommendation” section, ranging from 315 kg ha−1 to 585 kg ha−1. During the jointing stage, URF MZs receive 300 kg ha−1 of N fertilizer. Based on the VRF recommendation scheme, the additional N fertilizer application varies from 210 kg ha−1 to 390 kg ha−1. To depict the fertilization amounts for the 50 MZs in the experimental area, Figure 6 was developed. Figure 6a illustrates the N fertilizer application during the basal dressing stage for the MZs, and Figure 6b shows the N fertilizer application during the jointing stage. The results indicate that in the VRF MZs, the average N fertilizer application rate is 627 kg ha−1. In contrast, in the MZs with URF, the N fertilizer application rate is 750 kg ha−1. This means that VRF was able to reduce N application by 16.4%.
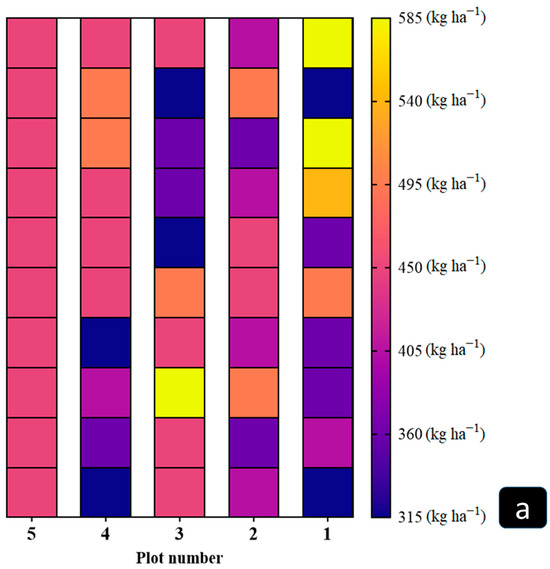
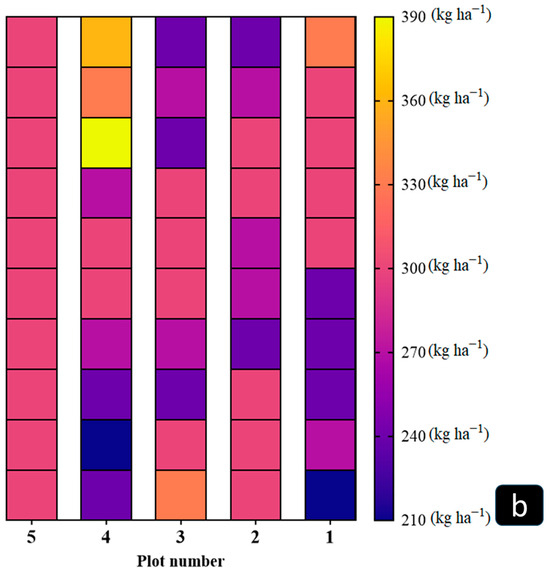
Figure 6.
Fertilizing maps for 50 MZs; (a) shows the N fertilizer application rate at the basal dressing stage for the MZs; (b) shows the N fertilizer application rate at the jointing stage.
3.3. Crop Yield and Economic Benefits
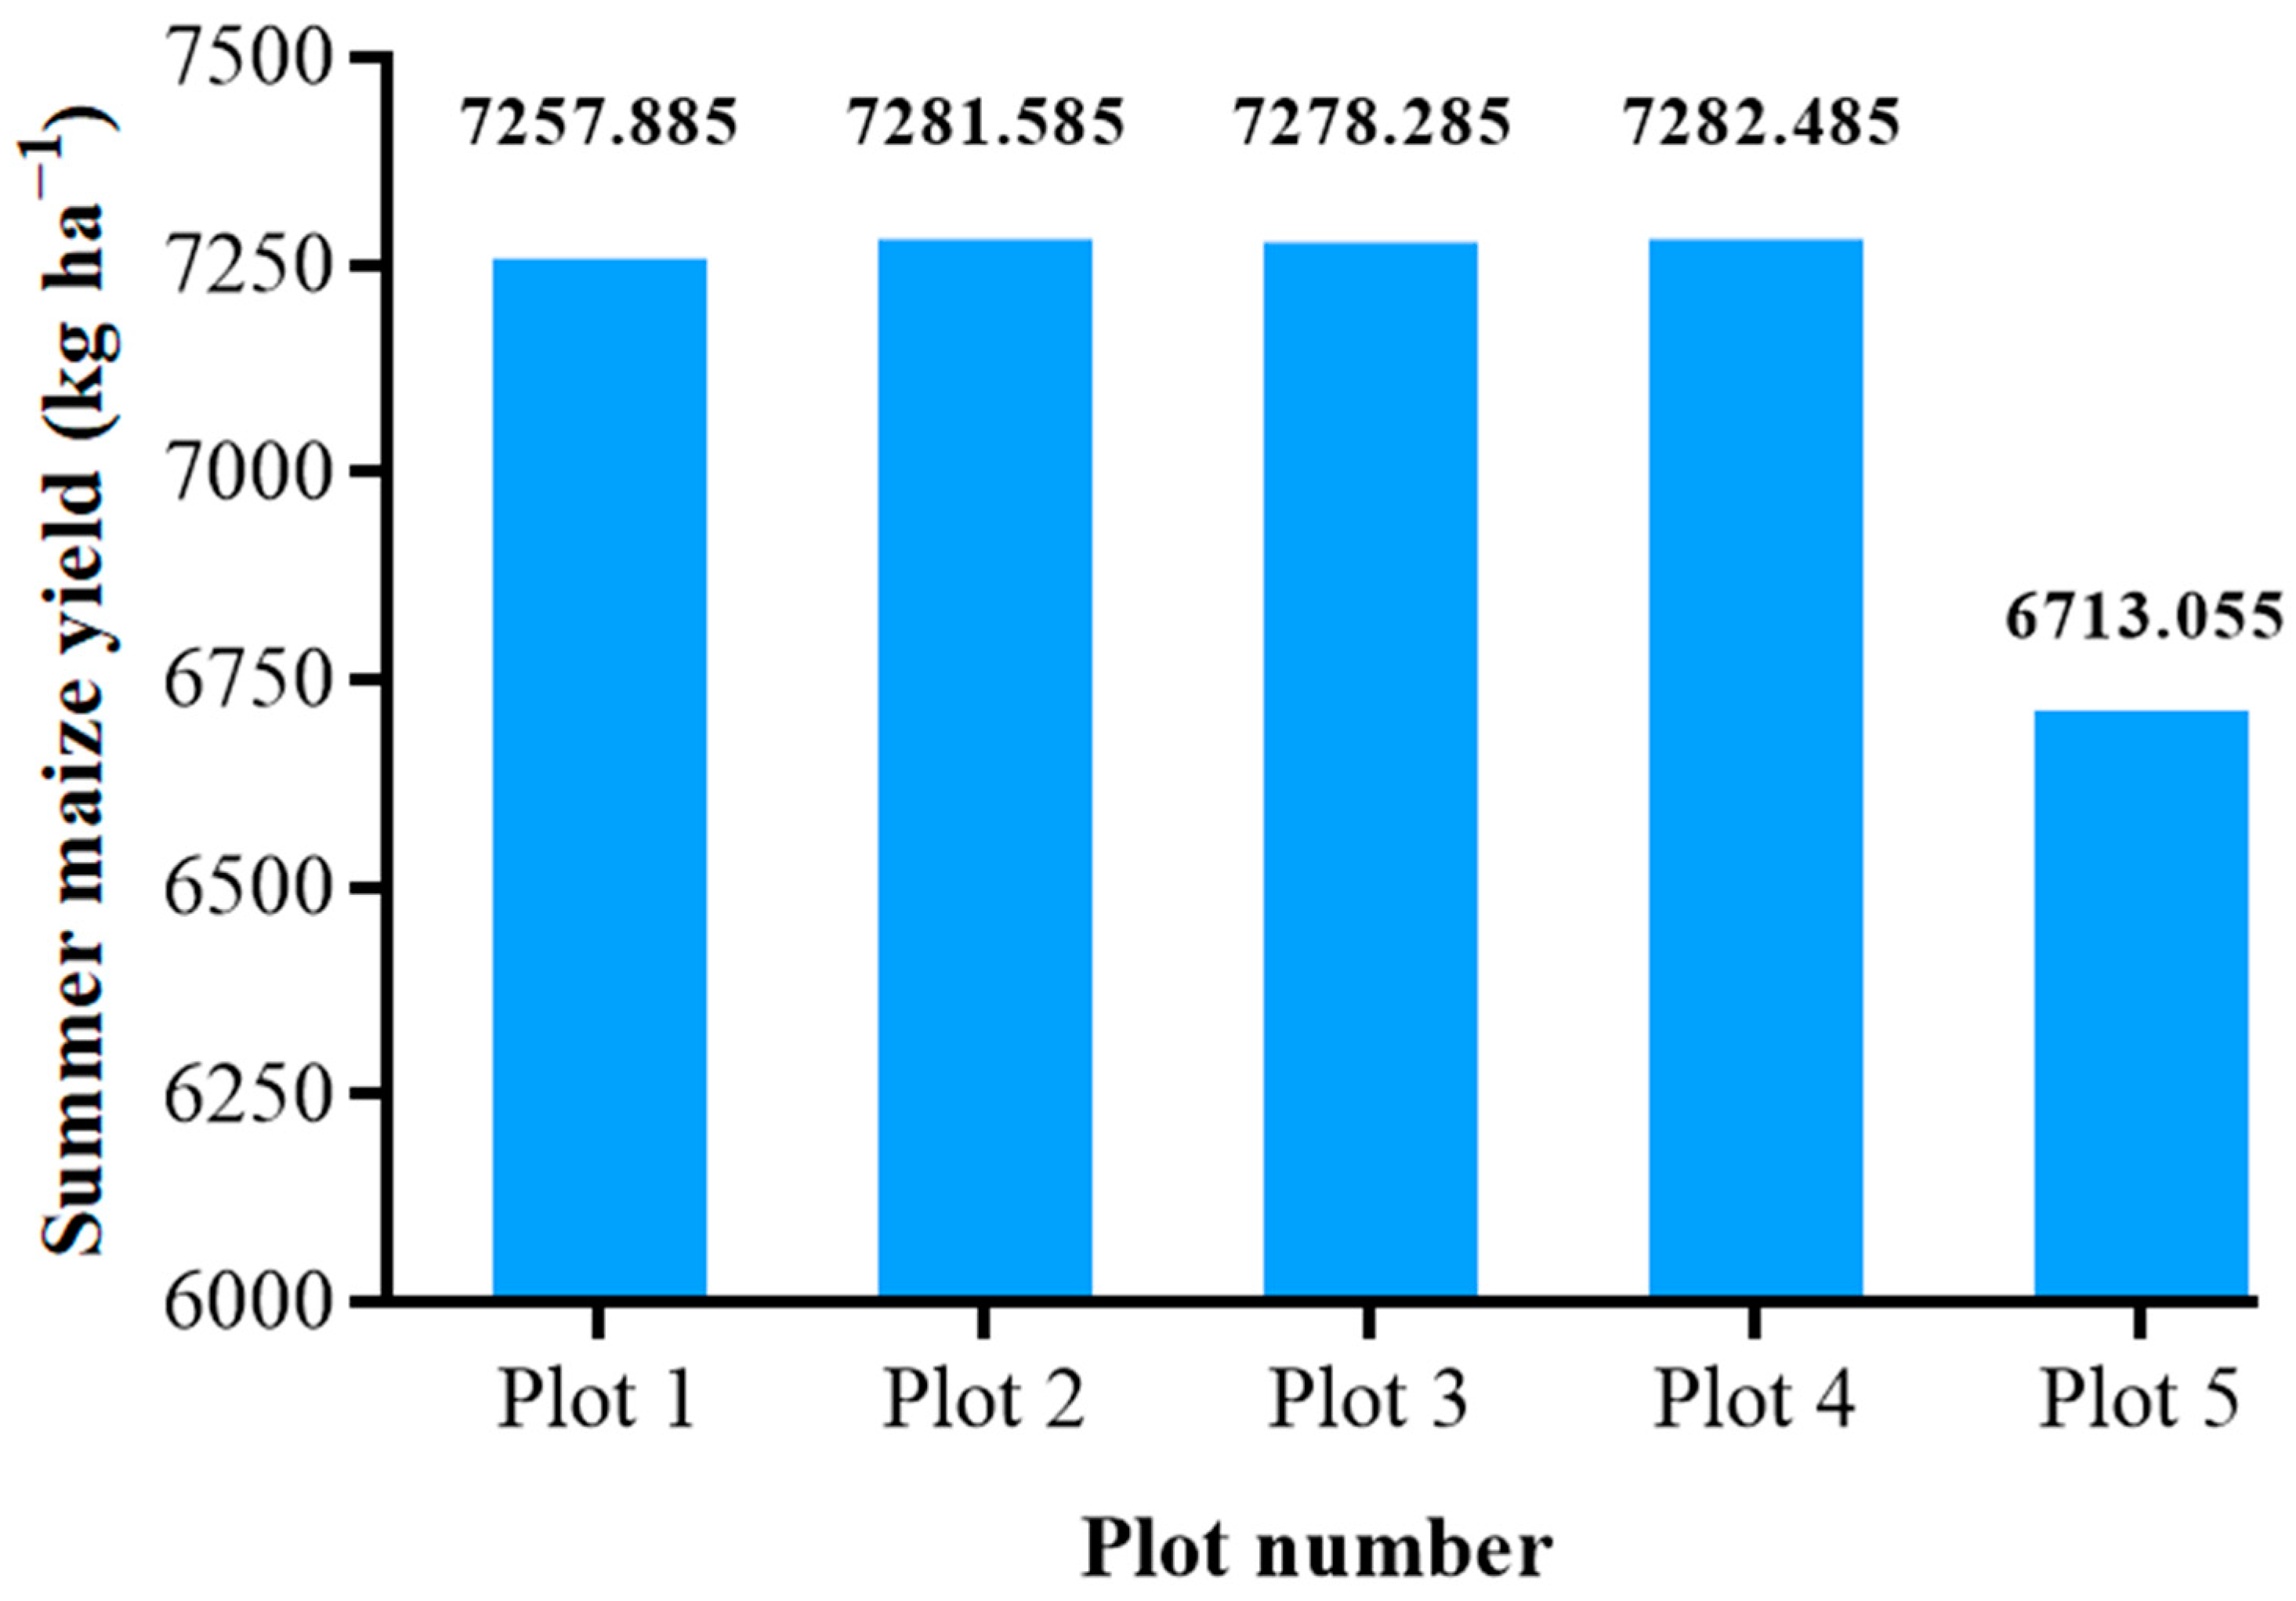
After the summer maize matured and was harvested, meticulous records of the maize yield of every MZ were made, as depicted in Figure 7. Among these, plot 4 exhibited the highest maize yield, averaging 7282.485 kg ha−1. Although plot 1 exhibited the lowest yield at an average of 7257.885 kg ha−1 among the VRF plots, its contrast with the URF plot (plot 5) highlights the substantial production capacity of VRF. The data depicted in the figure indicate minimal variations in yield among the four plots that employed VRF, with a coefficient of variation (STDEV/AVERAGE × 100%) of only 0.16%, which is considered negligible. This highlights that VRF effectively supplements soil N deficiencies, ensuring that each plot attains an optimal N level and maximizes the planting potential of the soil in each plot. Plot 5 utilized URF, resulting in an average grain production of 6713.005 kg ha−1. Plots that employed VRF (averaging 7275.060 kg ha−1) exhibited notably higher maize grain yields than those utilizing the URF approach, resulting in an approximate yield increment of 8.37%. Notably, VRF effectively restores depleted soil N in each plot to an optimum level conducive to the entire summer maize growth cycle, a feat not achieved by URF.

Figure 7.
Histogram of summer maize grain yield data from plots 1 to 5.
For further examination, Figure 8 depicts the distribution of yields among the 50 MZs, representing the most minor descriptive units throughout the experimental field. The data presented the standard deviation values for maize yield data in the ten MZs of VRF plots as 34.320 (plot 1), 39.000 (plot 2), 39.003 (plot 3), and 31.541 (plot 4), and the maximum yields MZs for these plots are 7313.400 kg ha−1, 7327.515 kg ha−1, 7327.335 kg ha−1, and 7332.675 kg ha−1, respectively. In contrast, the standard deviation values for grain yield data within the ten MZs of URF plots exhibit a notable increase, as high as 65.215; the highest yield recorded is only 6804.900 kg ha−1. This indicates that the yield of summer maize was more stable in plots treated with VRF. Among all MZs, MZ 35 exhibits the highest yield of 7332.675 kg ha−1, achieved through the implementation of VRF, and MZ 47 demonstrates the lowest yield of 6613.200 kg ha−1, achieved through the implementation of URF. One-way ANOVA was used for statistical analysis of summer corn yield in VRF plots and URF plots, assuming no significant effect of VRF and URF on yield. At 95% confidence intervals, Cohen’s effect values are 10.455 (plot 1 and plot 5), 10.581 (plot 2 and plot 5), 11.034 (plot 3 and plot 5), and 10.879 (plot 4 and plot 5), respectively, which are very high values, indicating that the effect size of VRF and URF on yield is very large. The p values are 6.406 × 10⁻¹⁵, 5.202 × 10⁻¹⁵, 2.497 × 10⁻¹⁵, and 3.199 × 10⁻¹⁵, respectively, much less than 0.05, indicating that it is statistically significant to reject the null hypothesis that the yield difference between VRF and URF is not significant. From the results of the statistical analysis, the difference in maize yield between the VRF plots and the URF plots was extremely significant. This indicates that different fertilization types have a significant effect on maize yield, and VRF is significantly better than URF.
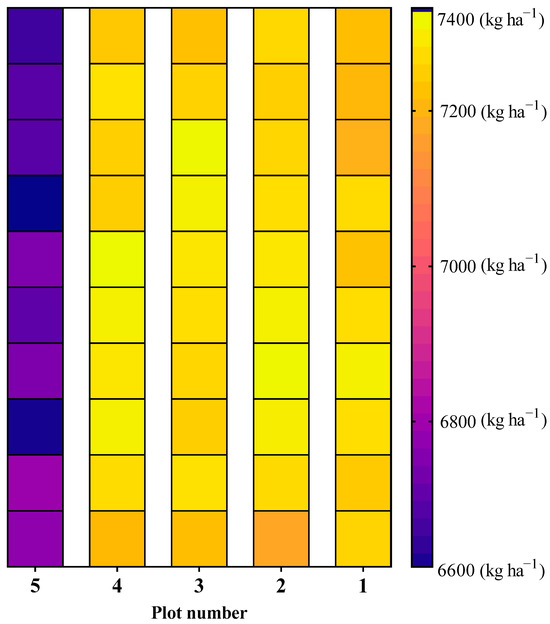
Figure 8.
Heat map of summer maize grain yield in the 50 MZs. The bottom labels represent the respective numbers of plots 1 to 5. The right label indicates the color change of the heat map corresponding to yield variations in the MZs ranging from 6600 kg ha−1 to 7400 kg ha−1.
4. Discussion
4.1. Variation in Soil Total N
The on-the-go detector real-time measurements of STN during the basal dressing stage indicate that the STN levels in the experimental area are generally at a medium-to-low level, suggesting that the soil is not very fertile. This could be due to the region’s long-term rotation cropping system. As shown in Figure 5, we can visually observe the changes in STN in the experimental area between the basal dressing and jointing stages. From Figure 5a, it is evident that during the basal dressing stage, the STN content is higher in the northern part of the experimental field and lower in the southern part, indicating an overall imbalance. After VRF during the basal dressing stage, STN was measured again at the jointing stage using the on-the-go detector. The transition from Figure 5a to Figure 5b represents the effect of the VRF. Figure 5b shows that the distribution of STN during the jointing stage is more uniform compared to the basal dressing stage. Although the southern STN content is slightly higher than that in the north, it is overall more balanced. Comparing Figure 5a,b, areas with extremely low STN content (blue) during the basal dressing stage reached normal levels after VRF by the jointing stage, while areas with extremely high STN content (red) decreased. Although soil nutrients can be transferred, it is a long process, consistent with the Munnaf study; this may be because our VRF method, RHA, supplements more N in MZs with low STN content and limits N application with high STN content [51].
As shown in Figure 5, the significant changes in STN content between the two measurements in the experimental area demonstrate that the on-the-go detector can effectively monitor STN levels in real time. The SNF-RHA method used in this experiment is highly effective, allowing targeted supplementation of STN in small areas.
4.2. Economic Benefits and Environmental Protection by VRF
In the results section, we analyzed the N fertilizer consumption and summer maize yield of this experiment. Analysis of N fertilizer consumption shows that the URF-treated area used 750 kg ha−1 of fertilizer, while the VRF-treated area used an average of 627 kg ha−1, representing a 16.4% reduction in N fertilizer consumption. This shows that VRF can reduce fertilizer input and farmers’ production costs [48,55]. Yield measurements after harvest indicated that the summer maize yield in the VRF-treated area increased by 8.37% compared to the URF-treated area. This shows that VRF can increase the yield of summer maize and increase farmers’ return. Considering the N fertilizer prices during the field experiment and 2018 corn prices, the production cost in VRF-treated plots decreased by USD 37.5 ha−1, while the yield benefit increased by USD 153 ha−1, resulting in an overall profit increase of USD 190.5 ha−1. VRF can bring positive benefits to growers [35,39]. The above analysis is based on the premise of not including the on-the-go detectors used in this research. The finished on-the-go detector will not produce an economic loss in the use process. However, it is not easy to develop and contains high-precision devices such as light sources, optical fibers, and dynamic optical sensors. If the development cost of the on-the-go detector is added to the economic analysis, then the economic benefit will be incredibly reduced or even negative.
The SNF-RHA method can balance regional STN, and compared to KA, RHA has a negligible environmental impact. The reason SNF-KA was not used in this experiment is that it can cause N accumulation in areas with high STN content, posing risks of N leaching and loss. Excessive amounts of fertilizers are related to higher greenhouse gas emissions [56]. Chemical molecular calculation indicates that applying 1 kg less urea per hectare can generate 1.34 kg of carbon dioxide (CO2) when applied to water. Therefore, the adoption of VRF technology could potentially mitigate CO2 emissions by 164.820 kg ha−1. Furthermore, the reduction in urea application would also lead to decreased emissions of related harmful greenhouse gases, including ammonia (NH3), nitric oxide (NO), and nitrogen dioxide (NO2) [57,58,59].
4.3. Feasibility Comparison of Experimental Results
The results of this VRF experiment for summer maize have shown positive impacts and have the potential to promote the development of VRF technology. Our experimental results indicate that the primary advantage of VRF is to increase crop yield without significantly increasing input costs. In fact, it can reduce input costs, demonstrating a clear cost-reduction and efficiency-enhancing effect.
We compared our experimental results with those from related studies on VRF published by peer experts (Table 1). This comparison reveals that most studies on VRF report an increase in crop yield. Even in cases where the yield did not significantly increase, there was still a reduction in production inputs, ultimately generating economic benefits.

Table 1.
Analysis and research on production inputs and yield benefits of VRF by peer experts.
4.4. Limitations of the Experiment and Future Research
This experiment was conducted within a single test field and only measured STN. While the results have significant positive implications, their representativeness is limited. A single soil element does not fully capture soil fertility, and summer maize cannot represent all crop types. Therefore, future research should focus on enhancing the on-the-go detector’s capability to measure multiple soil nutrients, such as phosphorus, potassium, and organic matter, which are critical indicators of soil fertility [35]. Regarding N fertilizer input, the N application rates for each MZ were adjusted based on a percentage of the URF rates, which is not the optimal approach. Ideally, the amount of N fertilizer input to each MZ should be calculated from a soil fertility function derived based on long-term experiments with crops.
Additionally, conducting long-term experiments is crucial. The current study relies on single-site, single-year data, which is particularly relevant for summer maize, a crop suitable for rotation planting. Factors like rainfall and temperature significantly impact crop yield and N use efficiency. Therefore, it is necessary to conduct long-term VRF experiments. Future research should consider multiple field experiments over several growing seasons to derive reliable conclusions regarding economic benefits [51].
5. Conclusions
In our research, we utilized an on-the-go detector based on vis-NIR spectroscopy to measure STN concentration in the experimental field where summer maize was grown. By using STN measurements taken during the basal fertilization and jointing stages, we developed a digital STN content prescription map to guide VRF. Implementing map-based VRF methods resulted in significant success in summer maize production and yield. Current research findings confirm that applying the SNF-RHA VRF method can indeed enhance summer maize productivity, but its accuracy largely depends on the precision of the prescription map. Although previous studies have shown that VRF can promote crop growth, this study found that using the RHA VRF method can additionally supplement soil nutrients, suggesting it is an economically and environmentally friendly VRF approach. Compared to URF, VRF offers several advantages. VRF has the potential to enhance crop yield: the average yield of summer maize in the plots with VRF was higher than that in the plots with URF. VRF has the potential to improve the stability of crop yields. Compared to URF, the plots using the VRF method exhibit more uniform yields across MZs. This indirectly confirms that VRF can supplement missing STN and fully unleash the productivity of field soil. VRF can potentially decrease the amount of fertilizer applied: VRF can limit N fertilizer input in areas with high STN content while increasing N fertilizer input in areas with low STN content, thereby maintaining consistent STN levels across the field while reducing N fertilizer application.
This study’s current phase confirmed that the summer maize production fertilization variables are feasible. However, their feasibility depends mainly on the accuracy of the online soil sensor precision and the N prescription figure. In addition, the present study has some limitations, such as the single information for making prescription charts, the need for more scientific agronomic guidance for fertilizer application, the single-site and single-year experiment, reliance on a single sensor, and the study of a single crop. Therefore, future research should be more scientific, and soil nutrient information should be acquired with accurate methods to make a more accurate map of MZ, carrying the long-term VRF experiment through agronomy to precise guidance to optimize the N fertilizer rate to solve the limitations of the current study.
Author Contributions
Conceptualization, W.Y. and Y.O.; methodology, C.J. and P.Z.; validation, S.H., P.Z. and Y.O.; formal analysis, S.H.; resources, Y.K.; data curation, Y.G.; writing—original draft preparation, Y.O.; writing—review and editing, P.Z.; visualization, Y.Z. All authors have read and agreed to the published version of the manuscript.
Funding
This study was supported by the National Natural Science Foundation of China (no. 62305197), the National Key Research Projects (no. 2021YFD200050205), Shandong University of Technology Doctoral Research Startup (no. 4041/422016 and 4041/422017), and Shandong University of Technology young and middle-aged teachers at home and abroad visiting program (9001/5123039).
Institutional Review Board Statement
Not applicable.
Data Availability Statement
Data are contained within the article.
Conflicts of Interest
The authors declare no conflicts of interest.
References
- Koch, M.; Naumann, M.; Pawelzik, E.; Gransee, A.; Thiel, H. The Importance of Nutrient Management for Potato Production Part I: Plant Nutrition and Yield. Potato Res. 2020, 1, 97–119. [Google Scholar] [CrossRef]
- Martins, R.N.; Pinto, F.; Moura, A.D.; Siqueira, W.C.; Villar, F. Nitrogen Variable Rate Fertilization in Corn Crop Prescribed by Optical Sensor. J. Plant Nutr. 2020, 11, 1681–1688. [Google Scholar] [CrossRef]
- Silva, J.G.; Frana, M.G.C.; Gomide, F.T.F.; Magalhaes, J.R. Different Nitrogen Sources Affect Biomass Partitioning and Quality of Potato Production in a Hydroponic System. Am. J. Potato Res. 2013, 2, 179–185. [Google Scholar] [CrossRef]
- Azizan, F.A.; Roslan, N.; Ruslan, R.; Aznan, A.A.; Yusoff, A.Z.M. Soil NPK Variability Mapping for Harumanis Mango Grown in Greenhouse at Perlis, Malaysia. Int. J. Adv. Sci. Eng. Inf. Technol. 2019, 9, 495–501. [Google Scholar] [CrossRef]
- Jing, T.T.; Hu, H.T.; Qiu, C.X.; Li, C.J.; Zhou, J.P.; Zhang, Q.L.; Bai, C. Spatial Variability and Its Controlling Topographic Factors of Soil Moisture During Spring Plowing Season in Black Soil Hilly Region of Northeast China. Int. Soil Water Conserv. Res. 2022, 1, 58–65. [Google Scholar]
- Sanches, M.G.; Magalhães, G.S.P.; Franco, J.C.H. Site-specific Assessment of Spatial and Temporal Variability of Sugarcane Yield Related to Soil Attributes. Geoderma 2019, 334, 90–98. [Google Scholar] [CrossRef]
- Ichami, S.M.; Shepherd, K.D.; Hoffland, E.; Karuku, G.N.; Stoorvogel, J. Soil Spatial Variation to Guide the Development of Fertilizer Use Recommendations for Smallholder Farms in Western Kenya. Geoderma Reg. 2020, 22, e00300. [Google Scholar] [CrossRef]
- Siqueira, R.D.; Mandal, D.; Longchamps, L.; Khosla, R. Assessing Nitrogen Variability at Early Stages of Maize Using Mobile Fluorescence Sensing. Remote Sens. 2022, 12, 5077. [Google Scholar] [CrossRef]
- Raun, W.R.; Johnson, G.V.; Lees, H.L.; Sembiring, H.; Phillips, S.B. Microvariability in Soil Test, Plant Nutrient, and Yield Parameters in Bermudagrass. Soil Sci. Soc. Am J. 1998, 3, 683–690. [Google Scholar] [CrossRef]
- Ayoubi, S.; Zamani, S.M.; Khormali, F. Spatial Variability of Some Soil Properties for Site Specific Farming in Northern Iran. Int. J. Plant Prod. 2007, 1, 225–236. [Google Scholar]
- Atik, M.; Akdemir, B. Spatial Variability of NDVI and SPAD for Variable-and Fixed-Rate Fertilization in Olive Orchards. Erwerbs-Obstbau. 2022, 64, 647–655. [Google Scholar] [CrossRef]
- Burliai, A. Precision Agriculture as a Direction of Modernization of Agricultural Production. Modern Econ. 2021, 29, 29–34. [Google Scholar] [CrossRef] [PubMed]
- Shi, Y.Y.; Zhu, Y.; Wang, X.C.; Sun, X.; Ding, Y.F.; Cao, W.X.; Hu, Z.C. Progress and Development on Biological Information of Crop Phenotype Research Applied to Real-time Variable-rate Fertilization. Plant Methods 2020, 16, 11. [Google Scholar] [CrossRef] [PubMed]
- Martins, R.N.; Pinto, F.; Moura, A.D.; Siqueira, W.C.; Villar, F. Economic Feasibility of Optical Sensors for Variable Rate Nitrogen Fertilization in Corn. Idesia 2023, 4, 101–111. [Google Scholar]
- Wang, H.Y.; Xu, J.Z.; Chen, B.; Li, Y.W.; Li, S.; Hao, L.; Jiang, Q.J.; He, Y.; Xi, W.J. Performance of an Automatic Variable-Rate Fertilization System Subject to Different Initial Field Water Conditions and Fertilizer Doses in Paddy Fields. Agronomy 2023, 6, 1629. [Google Scholar] [CrossRef]
- Ali, M.M.; Al-Ani, A.; Eamus, D.; Tan, D.K.Y. Leaf Nitrogen Determination Using Non-Destructive Techniques—A Review. J. Plant Nutr. 2017, 40, 928–953. [Google Scholar] [CrossRef]
- Cilia, C.; Panigada, C.; Rossini, M.; Meroni, M.; Busetto, L.; Amaducci, S.; Boschetti, M.; Picchi, V.; Colombo, R. Nitrogen Status Assessment for Variable Rate Fertilization in Maize through Hyperspectral Imagery. Remote Sens. 2014, 6, 6549–6565. [Google Scholar] [CrossRef]
- Meena, R.M.; Jatav, H.S.; Dudwal, B.L.; Kumawat, P.; Meena, S.S.; Singh, V.K.; Khan, M.A.; Sathyanarayana, E.; Jatav, H.S. Fertilizer Recommendations by Using Different Geospatial Technologies in Precision Farming or Nanotechnology. Ecosyst Serv. 2022, 14, 241–257. [Google Scholar]
- Alameen, A.A.; AI-Gaadi, K.A.; Tola, E. Development and Performance Evaluation of a Control System for Variable Rate Granular Fertilizer Application. Comput. Electron. Agric. 2019, 160, 31–39. [Google Scholar] [CrossRef]
- Wang, W.H.; Cai, L.L.; Peng, P.Y.; Gong, Y.D.; Yang, X.Q. Soil Sampling Spacing Based on Precision Agriculture Variable Rate Fertilization of Pomegranate Orchard. Commun. Soil Sci. Plan. 2021, 20, 2445–2461. [Google Scholar] [CrossRef]
- Rogovska, N.; Laird, D.A.; Chiou, C.P.L.; Bond, L.J. Development of Field Mobile Soil Nitrate Sensor Technology to Facilitate Precision Fertilizer Management. Precis. Agric. 2019, 20, 40–55. [Google Scholar] [CrossRef]
- Xia, Y.; Zhang, M.; Tsang, D.; Geng, N.; Lu, D.B.; Zhu, L.F.; Igalavithana, A.D.; Dissanayake, P.D.; Rinklebe, J.; Xiao, Y.; et al. Recent Advances in Control Technologies for Non-point Source Pollution with Nitrogen and Phosphorous from Agricultural Runoff: Current Practices and Future Prospects. J. Appl. Biol. Chem. 2020, 1, 8. [Google Scholar] [CrossRef]
- Akdemir, B.; Saglam, C.; Bellitürk, K.; Makaraci, A.Z.; Urusan, A.Y.; Atar, E.S. Effect of Spatial Variability on Fertiliser Requirement of Olive Orchard Cultivated for Oil Production. J. Environ. Prot. Ecol. 2018, 19, 319–329. [Google Scholar]
- Behera, S.K.; Shukla, A.K.; Prakash, C.; Tripathi, A.; Kumar, A.; Trivedi, V. Establishing Management Zones of Soil Sulphur and Micronutrients for Sustainable Crop Production. Land Degrad Dev. 2020, 32, 3614–3625. [Google Scholar] [CrossRef]
- Rokhafrouz, M.; Latifi, H.; Abkar, A.; Wojciechwoski, T.; Czechlowski, M.; Naieni, A.S.; Maghsoudl, Y.; Niedba ła, G. Simplified and Hybrid Remote Sensing-Based Delineation of Management Zones for Nitrogen Variable Rate Application in Wheat. Agriculture 2021, 11, 1104. [Google Scholar] [CrossRef]
- Colaço, A.F.; Molin, J.P. Variable Rate Fertilization in Citrus: A Long Term Study. Precis. Agric. 2017, 18, 169–191. [Google Scholar] [CrossRef]
- Ortuani, B.; Mayer, A.; Bianchi, D.; Sona, G.; Crema, A.; Modina, D.; Bolognini, M.; Brancadoro, L.; Boschetti, M.; Facchi, A. Effectiveness of Management Zones Delineated from UAV and Sentinel-2 Data for Precision Viticulture Applications. Remote Sens. 2024, 16, 635. [Google Scholar] [CrossRef]
- Nawar, S.; Corstanje, R.; Halcro, G.; Mulla, D.J.; Mouazen, A.M. Delineation of Soil Management Zones for Variable-Rate Fertilization: A Review. Adv. Agron. 2017, 143, 175–245. [Google Scholar]
- Yang, C.; Everitt, J.H.; Bradford, J.M. Comparison of Uniform and Variable Rate Nitrogen and Phosphorus Fertilizer Application for Grain Sorghum. Trans. ASAE 2001, 2, 201–209. [Google Scholar]
- Stenberg, B.; Rossel, R.A.V.; Mouazen, A.M.; Wetterlind, J. Chapter Five-Visible and Near Infrared Spectroscopy in Soil Science. Adv. Agron. 2010, 107, 163–215. [Google Scholar]
- Sishodia, R.; Ray, R.L.; Singh, S.K. Applications of Remote Sensing in Precision Agriculture: A Review. Remote Sens. 2020, 12, 3136. [Google Scholar] [CrossRef]
- Aranguren, M.; Castellón, A.; Aizpurua, A. Wheat Yield Estimation with NDVI Values Using a Proximal Sensing Tool. Remote Sens. 2020, 12, 2749. [Google Scholar] [CrossRef]
- Knadel, M.; Thomsen, A.; Greve, M.H. Multisensor On-The-Go Mapping of Soil Organic Carbon Content. Soil Sci. Soc. Am. J. 2011, 5, 1799–1806. [Google Scholar] [CrossRef]
- Zhang, J.; Sleutel, S.; Mouazen, A.M. Phosphorus-based Variable Rate Manure Application in Wheat and Barley. Precis. Agric. 2024, 25, 1714–1730. [Google Scholar] [CrossRef]
- Maleki, M.R.; Mouazen, A.M.; Ketelaere, B.D.; Ramon, H.; Baerdemaeker, J.D. On-the-go Variable-Rate Phosphorus Fertilization Based on a Visible and Near-Infrared Soil Sensor. Biosyst. Eng. 2008, 1, 35–46. [Google Scholar] [CrossRef]
- Yang, W.; Wang, X.; Ma, W.; Li, M.Z. Variable-Rate Fertilizing for Winter Wheat Based on Canopy Spectral Reflectance. J. Jilin Univ. (Eng. Technol. Ed.) 2007, 6, 1455–1459. [Google Scholar]
- Skendžić, S.; Zovko, M.; Lesic, V.; Živković, I.P.; Lemic, D. Detection and Evaluation of Environmental Stress in Winter Wheat Using Remote and Proximal Sensing Methods and Vegetation Indices-A Review. Diversity 2023, 15, 481. [Google Scholar] [CrossRef]
- Li, T.; Xia, A.Q.; Mclaren, T.I.; Pandey, R.; Xu, Z.H.; Liu, H.D.; Manning, S.; Madgett, O.; Duncan, S.; Rasmussen, P.; et al. Preliminary Results in Innovative Solutions for Soil Carbon Estimation: Integrating Remote Sensing, Machine Learning, and Proximal Sensing Spectroscopy. Remote Sens. 2023, 15, 5571. [Google Scholar] [CrossRef]
- Marius, K.; Egidijus, Š.; Kristina, L.; Vilma, N.; Romaneckas, K.; Bruciene, I.; Buragienė, S.; Steponavičius, D. The Comparison Analysis of Uniform-and Variable-Rate Fertilizations on Winter Wheat Yield Parameters Using Site-Specific Seeding. Processes 2022, 12, 2717. [Google Scholar]
- Mirzakhaninafchi, H.; Singh, M.; Bector, V.; Gupta, O.P.; Singh, R. Design and Development of a Variable Rate Applicator for Real-Time Application of Fertilizer. Sustainability 2021, 16, 8694. [Google Scholar] [CrossRef]
- Moreno, H.; Andújar, D. Proximal Sensing for Geometric Characterization of Vines: A Review of the Latest Advances. Comput. Electron. Agric. 2023, 210, 107901. [Google Scholar] [CrossRef]
- Khakbazan, M.; Moulin, A.; Huang, J. Economic Evaluation of Variable Rate Nitrogen Management of Canola for Zones Based on Historical Yield Maps and Soil Test Recommendations. Sci. Rep. 2021, 1, 4439. [Google Scholar] [CrossRef]
- Zhou, P.; Li, M.; Yang, W.; Yao, X.Q.; Liu, Z.; Ji, R.H. Development and Performance Tests of an On-the-go Detector of Soil Total Nitrogen Concentration Based on Near-Infrared Spectroscopy. Precis. Agric. 2021, 5–6, 1479–1500. [Google Scholar] [CrossRef]
- Zhou, P.; Yang, W.; Li, M.Z.; Zheng, L.; Chen, Y. Soil Total Nitrogen Content Prediction Based on Gray Correlation-extreme Learning Machine. Trans. Chin. Soc. Agric. Mach. 2017, S1, 271–276. [Google Scholar]
- Guerrero, A.; Mouazen, A.M. Evaluation of Variable Rate Nitrogen Fertilization Scenarios in Cereal Crops From Economic, Environmental and Technical Perspective. Soil Till Res. 2021, 213, 105110. [Google Scholar] [CrossRef]
- Guerrero, A.; De Neve, S.; Mouazen, A.M. Current Sensor Technologies for In Situ and On-Line Measurement of Soil Nitrogen for Variable Rate Fertilization: A Review. Adv. Agron. 2021, 168, 1–38. [Google Scholar]
- Munnaf, M.A.; Haesaert, G.; Meirvenne, M.V.; Mouazen, A.M. Multi-Sensors Data Fusion Approach for Site-Specific Seeding of Consumption and Seed Potato Production. Precis. Agric. 2021, 1, 1890–1917. [Google Scholar] [CrossRef]
- Schillaci, C.; Tadiello, T.; Acutis, M.; Perego, A. Reducing Topdressing N Fertilization with Variable Rates Does Not Reduce Maize Yield. Sustainability 2021, 13, 8059. [Google Scholar] [CrossRef]
- Guerrero, A.; De Neve, S.; Mouazen, A.M. Data Fusion Approach for Map-Based Variable-Rate Nitrogen Fertilization in Barley and Wheat. Soil Till Res. 2020, 205, 104789. [Google Scholar] [CrossRef]
- Zhang, J.; Guerrero, A.; Mouazen, A.M. Map-Based Variable-Rate Manure Application in Wheat Using a Data Fusion Approach. Soil Till Res. 2021, 6, 104846. [Google Scholar] [CrossRef]
- Munnaf, M.A.; Guerrero, A.; Calera, M.; Mouazen, A.M. Precision Nitrogen Fertilization for Opium Poppy Using Combined Proximal and Remote Sensor Data Fusion. Remote Sens. 2023, 23, 5442. [Google Scholar] [CrossRef]
- Karapetsas, N.; Alexandridis, T.; Bilas, G.; Munnaf, M.A.; Guerrero, C.A.P.; Calera, M.; Osann, A.; Gobin, A.; Řezník, T.; Moshou, D.; et al. Mapping Soil Properties with Fixed Rank Kriging of Proximally Sensed Soil Data Fused with Sentinel-2 Biophysical Parameter. Remote Sens. 2022, 14, 1639. [Google Scholar] [CrossRef]
- Bhunia, G.S.; Shit, P.K.; Chattopadhyay, R. Assessment of Spatial Variability of Soil Properties Using Geostatistical Approach of Lateritic Soil (West Bengal, India). Ann. Agric. Sci. 2018, 16, 436–443. [Google Scholar] [CrossRef]
- Navidi, M.N.; Seyedmohammadi, J. Mapping and spatial analysis of soil chemical effective properties to manage precise nutrition and environment protection. Int. J. Environ. Anal. Chem. 2022, 8, 1948–1961. [Google Scholar] [CrossRef]
- Kempenaar, X.; Been, T.H.; Booij, J.A.; Evert, F.K.; Michielsen, J.M.G.P.; Kocks, C.G. Advances in Variable Rate Technology Application in Potato in The Netherlands. Eur. Potato J. 2018, 60, 295–305. [Google Scholar] [CrossRef]
- Kazlauskas, M.; Bruciene, I.; Algirdas, J. Comparative Analysis of Energy and GHG Emissions Using Fixed and Variable Fertilization Rates. Agronomy 2021, 1, 138. [Google Scholar] [CrossRef]
- Chen, Y.F.; Zhang, L.; Zhao, Y.H.; Zhang, L.J.; Zhang, J.W.; Liu, M.Y.; Zhou, M.; Luo, B. High-Resolution Ammonia Emissions from Nitrogen Fertilizer Application in China during 2005–2020. Atmosphere 2022, 13, 1297. [Google Scholar] [CrossRef]
- Park, J.R.; Jiang, Y.H.; Kim, E.G.; Lee, G.S.; Kim, K.-M. Nitrogen Fertilization Causes Changes in Agricultural Characteristics and Gas Emissions in Rice Field. Sustainability 2023, 4, 3336. [Google Scholar] [CrossRef]
- Shao, G.D.; Zhou, J.; Liu, B.C.; Alharbi, S.A.; Liu, E.K.; Kuzyakov, Y. Carbon footprint of maize-wheat cropping system after 40-year fertilization. Sci. Total Environ. 2024, 926, 172082. [Google Scholar] [CrossRef]


Disclaimer/Publisher’s Note: The statements, opinions and data contained in all publications are solely those of the individual author(s) and contributor(s) and not of MDPI and/or the editor(s). MDPI and/or the editor(s) disclaim responsibility for any injury to people or property resulting from any ideas, methods, instructions or products referred to in the content. |
© 2024 by the authors. Licensee MDPI, Basel, Switzerland. This article is an open access article distributed under the terms and conditions of the Creative Commons Attribution (CC BY) license (https://creativecommons.org/licenses/by/4.0/).