Article

Impact of Structural Parameters on the Collision Characteristics and Coefficient of Restitution of Soybean Particles on Harvester’s Cleaning Screens

1
School of Agricultural Engineering, Jiangsu University, Zhenjiang 212013, China
2
Key Laboratory Equipment of Modern Agricultural Equipment and Technology, Ministry of Education, Jiangsu University, Zhenjiang 212013, China
3
Xinjiang Academy of Agricultural and Reclamation Science, Shihezi 832000, China
4
School of Mechanical and Electrical Engineering, Shihezi University, Shihezi 832003, China
*
Author to whom correspondence should be addressed.
Agriculture 2024, 14(7), 1201; https://doi.org/10.3390/agriculture14071201
Submission received: 27 June 2024 / Revised: 10 July 2024 / Accepted: 18 July 2024 / Published: 21 July 2024
(This article belongs to the Section Agricultural Technology)

Abstract

:
Inadequate parameter design of the cleaning device in soybean combine harvesters leads to elevated levels of machine harvesting losses and impurity rates. To provide fundamental data for the optimization of structural parameters of soybean cleaning sieves, it is of great significance to study the collision and bouncing characteristics of soybeans on the cleaning sieve surface and the impact of parameters on the coefficient of restitution (COR). The current study designed a collision platform, using soybeans at the harvest stage as the research subject. The experimental factors included drop height, wall inclination angle, wall movement speed, and wall material. Through single-factor experiments and orthogonal experiments, the effects of different collision parameters on the rebound trajectory and COR of soybeans were investigated. This study focuses on soybeans at the harvest stage as the test subjects. Experiments were conducted on a collision platform and recorded with a high-speed camera to capture the three-dimensional motion trajectories of the soybeans using the principle of specular reflection. Through single-factor experiments, the jumping characteristics of the soybeans on sieve surfaces with different motion characteristics were analyzed. The impact of drop height (400–650 mm), wall inclination angle (8–13°), wall movement speed (0.6–1.1 m/s), and wall material (stainless steel plates and polyurethane plates) on the coefficient of restitution (COR) was calculated and clarified. Multi-factor orthogonal experiments were conducted to determine the significance order of the different factors affecting the COR. Three-dimensional models of the soybeans and the collision platform were constructed using SolidWorks software, and the collision between the soybeans and the cleaning wall was simulated using EDEM software. The micro-forces and energy transfer during the soybean collision were analyzed. The results indicated that the COR of soybeans decreases as the drop height increases, but increases with wall inclination angle and wall movement speed. Additionally, the COR is higher when the soybeans collide with stainless steel plates compared to polyurethane plates. The order of influence of the four factors on the COR were: wall material > wall inclination angle > wall speed > drop height. This study provides important reference value for the efficient and low-loss design of cleaning devices.

1. Introduction

Soybeans are cultivated globally due to their high protein content and diverse applications [1,2,3]. However, annual soybean production in China reached 20.84 million tons in 2023 and plays a crucial role in supporting the country’s agricultural economy by contributing to food security and agricultural sustainability [4]. The cleaning device is a key component of the combine harvester [5,6,7], but most of the existing soybean combine harvesters in China are modified from grain combine harvesters. However, due to the significant morphological differences between soybeans and grains, the cleaning device is not entirely suitable. Specifically, during field cleaning, soybeans often bounce out from the tail of the cleaning sieve, which severely increases the soybean loss rate [8]. Additionally, soybeans and stems have similar suspension speeds [9], making it impossible to completely separate them using the fan, leading to an increased impurity rate. Based on the current harvesting methods of combine harvesters, improving the cleaning sieve structure by utilizing the differences in collision and bouncing characteristics between soybeans and stems becomes an effective way to reduce the impurity rate and decrease soybean loss. To design a reasonable cleaning sieve structure, it is urgent to explore the bouncing characteristics of soybeans on the cleaning sieve. Due to their higher density and ellipsoidal shape, soybeans tend to exhibit a bouncing motion on the cleaning sieve surface, while stems, due to their elongated shape and lower density, do not easily exhibit a similar motion. However, relevant research has not fully revealed the interaction mechanism between soybeans and the sieve surface. Therefore, an in-depth analysis of the collision and bouncing characteristics of soybeans on the cleaning sieve and their coefficient of restitution (COR) is a prerequisite for designing a more effective cleaning sieve structure.
In the study of particle collision behavior, recording the experimental process is crucial. By accurately recording the motion trajectory and collision parameters of soybeans on the sieve surface, the structural design of the sieve can be optimized to improve the cleaning effect. In the fields of agriculture and food, researchers have proposed various collision measurement devices [10,11], as shown in Table 1.
Among these, the mirror-single camera measurement method has been widely used in the study of particle–wall collisions [16]. The mirror is placed at a 135° angle to the camera shooting plane, allowing a single camera to record the three-dimensional motion trajectory of particles and obtain data such as rebound speed, rebound angle, and rotation angle. However, the design of related measurement devices is generally costly, and the instantaneous collision characteristics of particles are difficult to fully capture using traditional experimental methods. Therefore, the discrete element method (DEM) numerical simulation has gradually become an important tool for analyzing the interaction between materials and mechanical components in the agricultural and food processing fields [17,18,19]. Through DEM simulation, the behavior of particles under different collision conditions, including collision speed, angle, COR, and other key parameters, can be accurately recorded and analyzed. These simulation data not only compensate for the shortcomings of experimental records but can also be used to verify and optimize experimental designs. Wang Lijun’s team used EDEM to simulate the inclined collision of two corn kernels, visually obtaining the force state and energy conversion process at the moment of collision compression [20], and combined EDEM with collision experiments to obtain the COR of corn kernels of different shapes [21]. Li et al. [22] explored the collision characteristics between rice grains and stainless steel plates at different angles from the same height, providing a basis for the arrangement of grain loss sensors.
The coefficient of restitution (COR) is an important parameter characterizing the collision properties of objects. It directly reflects the elastic properties and energy transformation of objects during collisions [23,24]. The smaller the COR, the greater the energy loss, which is significant for understanding the collision process of soybeans during cleaning [25]. Firstly, the coefficient of restitution (COR) is a critical indicator of energy loss in soybeans after collision, directly influencing their trajectory and final position during the cleaning process. Understanding the COR under various conditions aids in predicting the motion paths of soybeans on the sieve, thereby facilitating the design of more efficient sieving systems to enhance the separation efficiency of soybean grains and stems. Secondly, elucidating the variation patterns of COR is essential for optimizing the sieving process. For instance, by adjusting the material, angle, and aperture size of the sieve, the collision behavior of soybeans can be controlled, leading to the development of sieve structures that effectively distinguish between soybean grains and stems. This not only improves the precision of cleaning but also reduces grain damage, ensuring the quality of the final product. Moreover, COR is a fundamental parameter necessary for numerical simulations in the study of material kinematics and collision mechanics. There are various ways to define COR [26]. Stronge defined COR as the ratio of the separation speed to the collision speed of two objects after collision [27]. Some scholars have derived various COR calculation models based on the changes in speed before and after the collision, obtaining COR under different collision conditions. Jiang et al. [28] used a particle tracking velocimeter to record the speed of maltodextrin particles before and after collision, derived the calculation formula for COR, and studied the relationship between COR and the incident angle and post-collision rotation speed. Wang et al. [29] determined the COR of frozen corn collisions using the particle speed in the direction of the collision contact force. The COR of particles is influenced not only by the basic properties of the material but also by factors such as collision speed, angle, collision location, and contact material [30,31]. Shi et al. [32] analyzed the relationship between the COR of quinoa seeds and different wall materials through collision experiments. Zhang et al. [33] repeatedly conducted collision experiments between Al2O3 particles and different wall surfaces to obtain the variation patterns of reflection angle and rotational angular velocity with wall surface roughness. Vikul et al. [34] investigated the variation in the coefficient of restitution (COR) of spherical particles, with diameters similar to soybeans, as they collided with inclined walls, analyzing how the COR changed with varying angles of inclination. Jakub et al. [35] used the double pendulum method to experiment with various spherical particles with diameters greater than 5 mm and found that impact velocity has a significant effect on the variation of the particles’ COR. Although the above studies have investigated the COR characteristics of the materials studied, the factors considered are not exhaustive. Therefore, this research will thoroughly analyze various factors affecting soybean COR. By determining the influence of these factors on particle motion patterns after collisions under different conditions and predicting soybean bouncing behavior on cleaning sieves, the study aims to provide more accurate guidance for the design of cleaning sieves.
To address the unclear collision mechanism between soybeans and the cleaning sieve, and considering that current research on the collision of agricultural materials with wall surfaces mainly focuses on the movement relationship between the material and a stationary wall, which fails to reflect the complex collision characteristics between soybeans and the cleaning sieve, a collision test bench will be designed. This will be combined with EDEM simulation technology to simulate the actual working conditions of the cleaning sieve and study the energy changes of soybeans at the moment of collision. Further analysis will be conducted on the changes in the bouncing characteristics of soybeans on the cleaning sieve surface under different influencing factors, and the COR will be calculated under different conditions. The significance of various factors on the bouncing characteristics and COR of soybeans will be explored. This will provide a scientific basis and guidance for the designers of cleaning sieves, optimizing the structural design of the cleaning sieve, and reducing the loss rate and impurity rate during cleaning.

2. Materials and Methods

2.1. Experimental Materials and Test Platform

2.1.1. Basic Parameters of Soybeans

The soybeans selected for this study are of the “Xinzhen No. 1” variety, harvested during the harvest season. The soybeans were grown in the experimental fields of the Agricultural Reclamation Academy in Shihezi, Xinjiang (Location: 86°03′31″ N, 44°18′47″ E). The selected soybean grains for the experiment exhibit uniform growth, are plump, structurally intact, and have a smooth, yellow, oval-shaped surface.
Three hundred structurally intact soybeans were randomly selected for dimensional measurement and divided into three groups. A vernier caliper with an accuracy of 0.01 mm (Vernier Caliper, Deli Group Co., Ltd., Ningbo, Zhejiang, China) was used to measure the three-axis dimensions of the soybeans, and the average values were calculated to obtain the basic shape dimensions of the soybeans, as shown in Figure 1. The main dimensions of the soybeans are defined as follows: the length along the direction of the soybean hilum is defined as the length (L) of the soybean, the widest part perpendicular to the sides of the hilum is defined as the thickness (T) of the soybean, and the width (W) of the soybean is defined as the distance from the plane of the hilum to the outermost side of the soybean. The dimensional data are shown in Table 2.

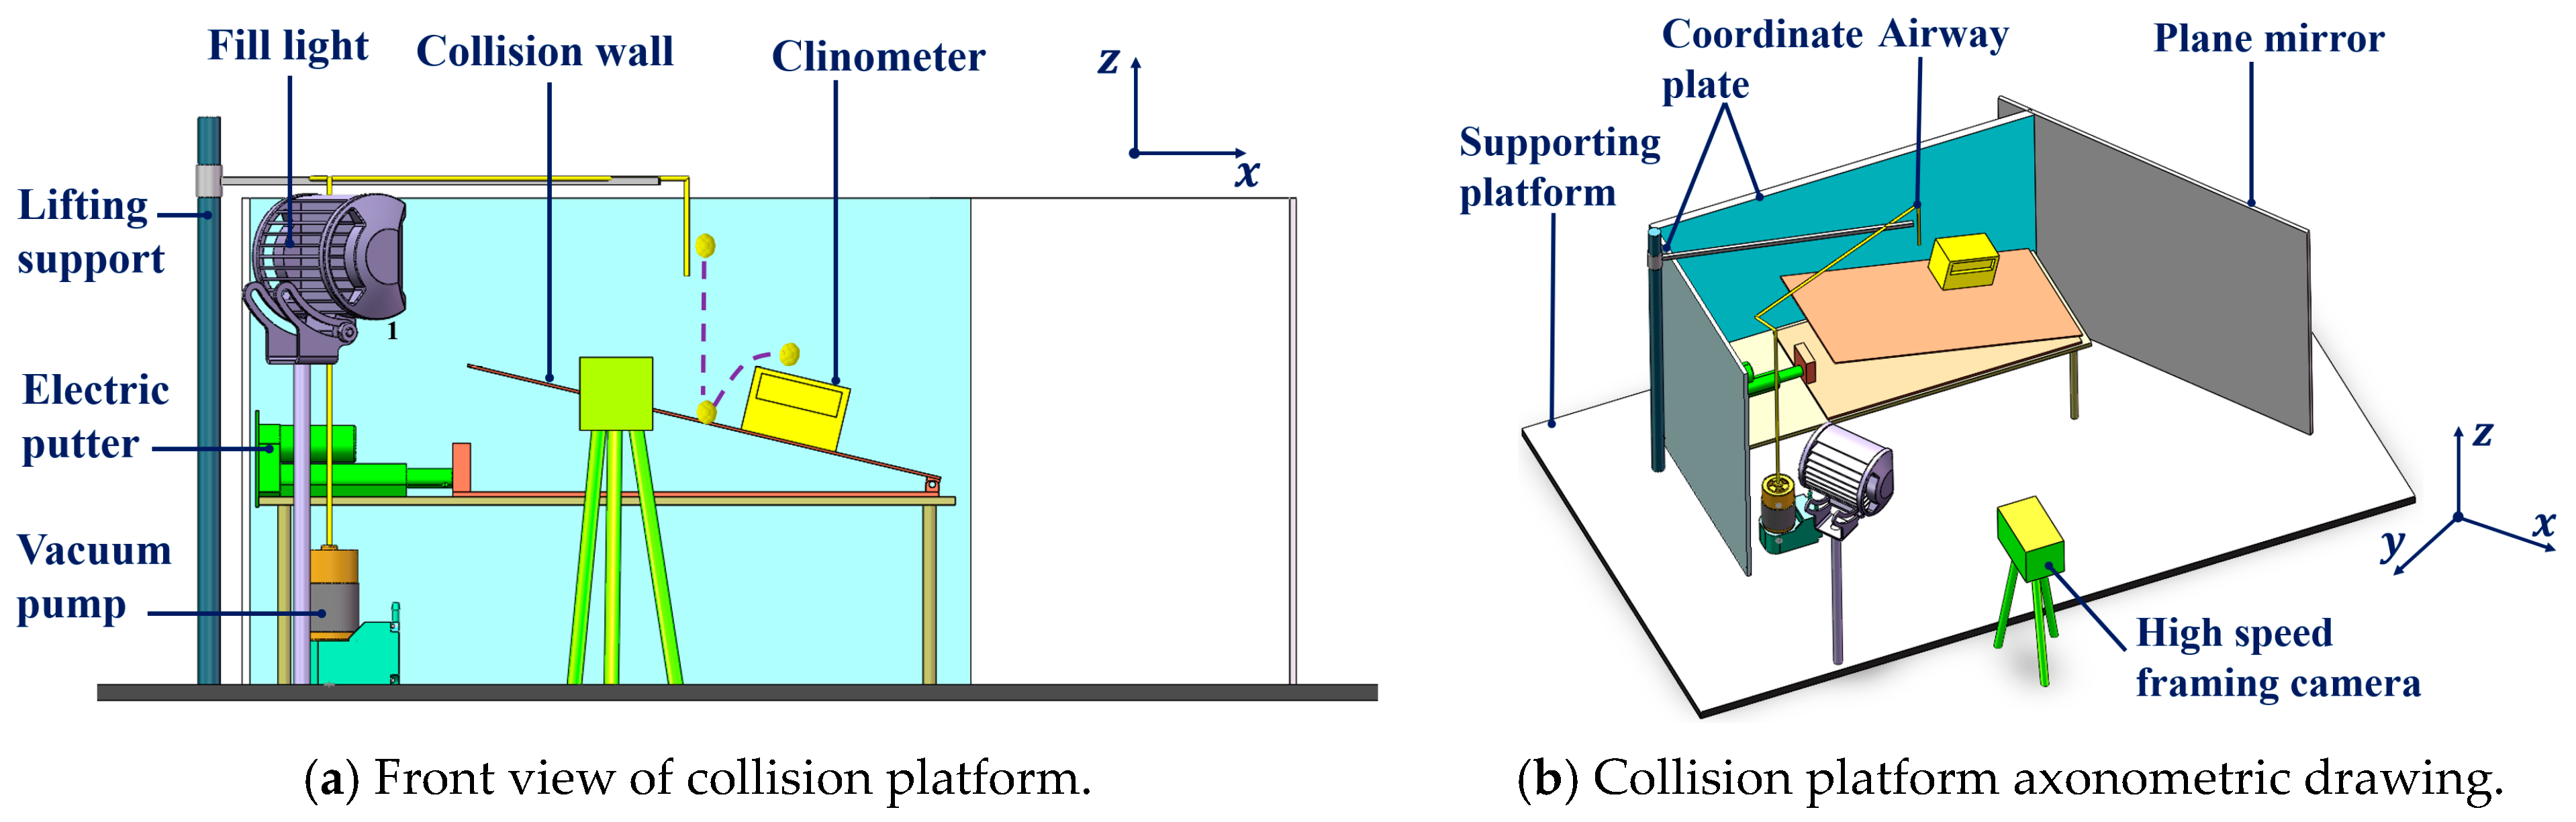
2.1.2. Soybean Particle Collision Platform

During soybean experiments, it is difficult to simulate the complex motion patterns of cleaning sieves using collision test platforms reported in existing literature. Therefore, this study designed and manufactured a novel test platform to simulate both single-factor and composite motions of cleaning sieves. As shown in Figure 2, the test platform consists of four parts: a soybean adsorption device, a high-speed imaging device, a wall adjustment device, and a measurement observation device. The soybean adsorption device is composed of a small vacuum pump, an air duct, and a pneumatic switch. It controls the release of soybeans from a given height H0 with an initial velocity of zero using the negative pressure suction of the vacuum pump. The height H0 ranges from 400 mm to 650 mm. The wall adjustment device can adjust the wall angle within a range of 0° to 90° and displays the angle in real-time using a digital inclinometer (Digital Inclinometer, Delixi, China). The test platform controls the horizontal movement speed of the wall using an electric push rod to simulate the horizontal motion of the soybean cleaning sieve. The measurement observation device consists of a coordinate board with scales and a plane mirror, with an angle of 135° between the mirror and the coordinate board [14]. The mirror reflection captures the soybean’s jumping and rotating movements in different directions. The high-speed imaging device includes a fill light that provides illumination for the entire experiment. The high-speed camera is arranged horizontally (i-SPEED TR, Olympus Corporation, Tokyo, Japan) and continuously records the entire process from the start of soybean motion to collision contact and the end of the first rebound jump at a speed of 200 fps.
Stainless steel is a commonly used material for cleaning sieves in soybean combines, while polyurethane cleaning sieves are mainly used for ore cleaning but are gradually being applied in grain cleaning. Therefore, stainless steel plates and polyurethane plates were selected as the collision walls. In the present experiment, each test was repeated at least six times per group to obtain average values and reduce errors.

2.2. Simulation Platform

2.2.1. Three-Dimensional Model of Soybeans

When modeling irregular particles using EDEM discrete element simulation software, a multi-sphere filling method is typically used to simulate and reproduce the shape of irregular particles [36,37,38]. In this process, a small volume and a large number of spheres are often used for filling. Too few spheres results in insufficient fidelity, but more spheres do not necessarily improve simulation accuracy and can increase simulation time [39]. In the simulation of soybean particles, many scholars have proposed 1-sphere models [40], 4-sphere models [41], 5-sphere models, 9-sphere models, and 13-sphere models [42]. The measurement and simulation modeling process of the soybean’s dimensions is shown in Figure 3. After obtaining the basic dimensions of soybeans, a three-dimensional model of soybeans was created using SOLIDWORKS 2016 (SP02, Dassault Systèmes Americas Corp, Paris, France) and then imported into EDEM. A model was constructed using 9 stacked spheres to accurately match the actual shape of soybeans while considering simulation efficiency.

2.2.2. EDEM Simulation of Soybean Particles Colliding with Moving Walls

The construction of the soybean collision simulation platform involves extracting key structures from the physical platform and simplifying them to mainly include the collision wall, rotating shaft, and support base plate, as shown in Figure 4. The thickness of the collision wall is 1.5 mm, and the angle θ between the wall and the base plate ranges from 0° to 90° to change the collision angle between the soybean and the wall. The initial position of the soybean is set at a height H0 from the wall. By changing the position of the particle factory, the falling height of the soybean can be controlled.
The main physical and mechanical parameters of the soybean and the collision wall are set as shown in Table 3. After setting all the parameters in EDEM (2021.2, Altair Engineering Inc., Troy, MI, USA, https://www.altair.com/edem (accessed on 6 May 2024), the simulation of the collision between the soybean and stainless steel plate as well as polyurethane plate is performed to explore the microscopic collision mechanical characteristics and energy conversion process.

2.3. Calculation Method

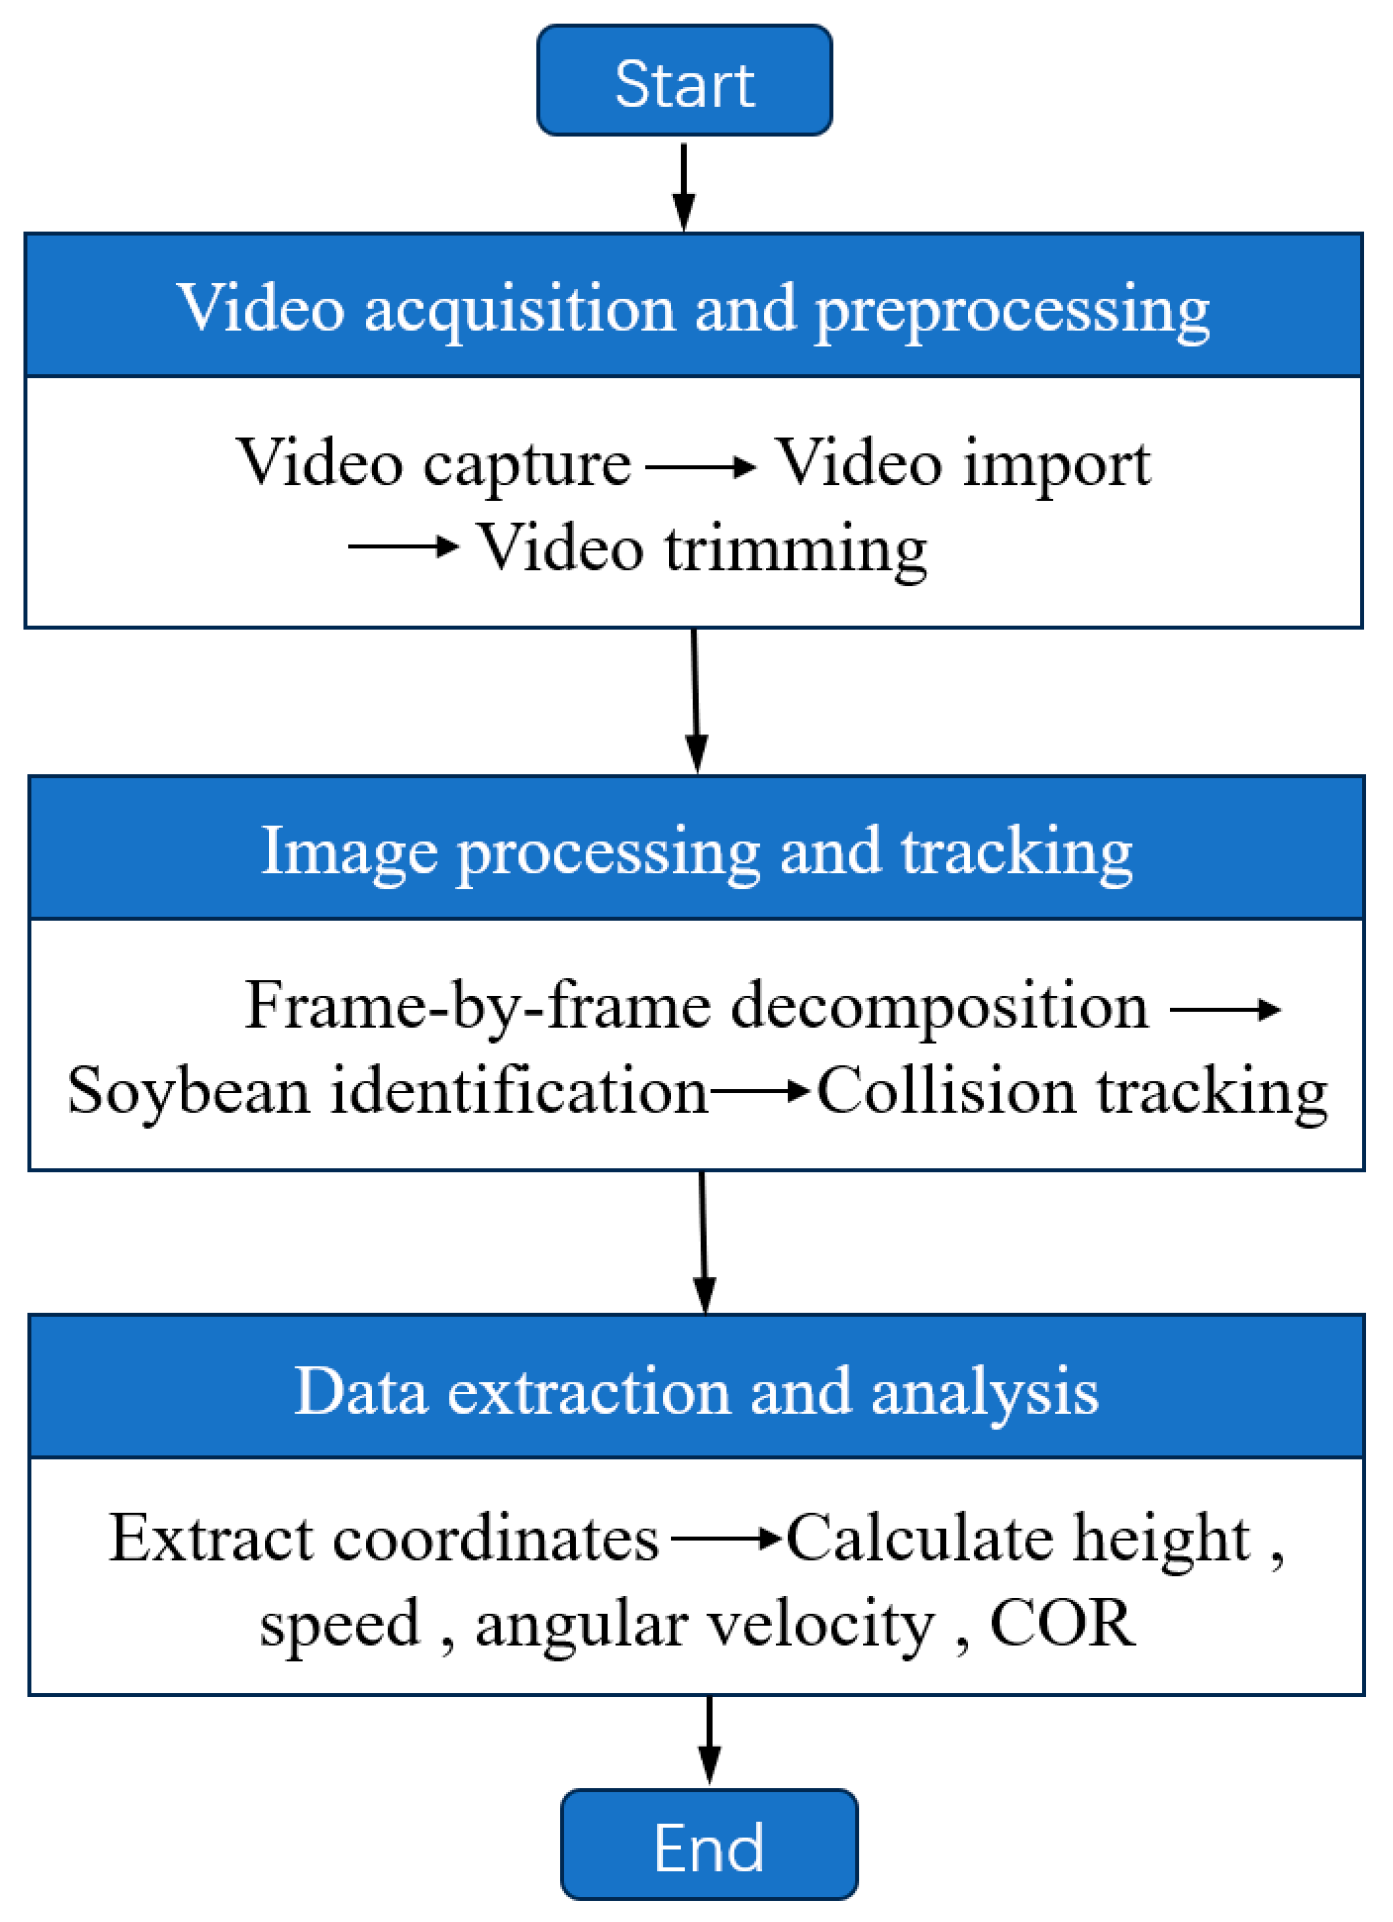
2.3.1. High-Speed Image Processing

High-speed video imaging is a common method for analyzing the kinematic characteristics of impacts [43]. In this study, after excluding images that do not show effective collisions, the i-SPEED Suite software (i-SPEED TR, Olympus Corporation, Tokyo, Japan) was used to mark the center of the soybean frame by frame. The position coordinates were then extracted to calculate the rebound height, incident velocity, reflection velocity, angular velocity, and coefficient of restitution (COR). The specific processing flowchart is shown in Figure 5.

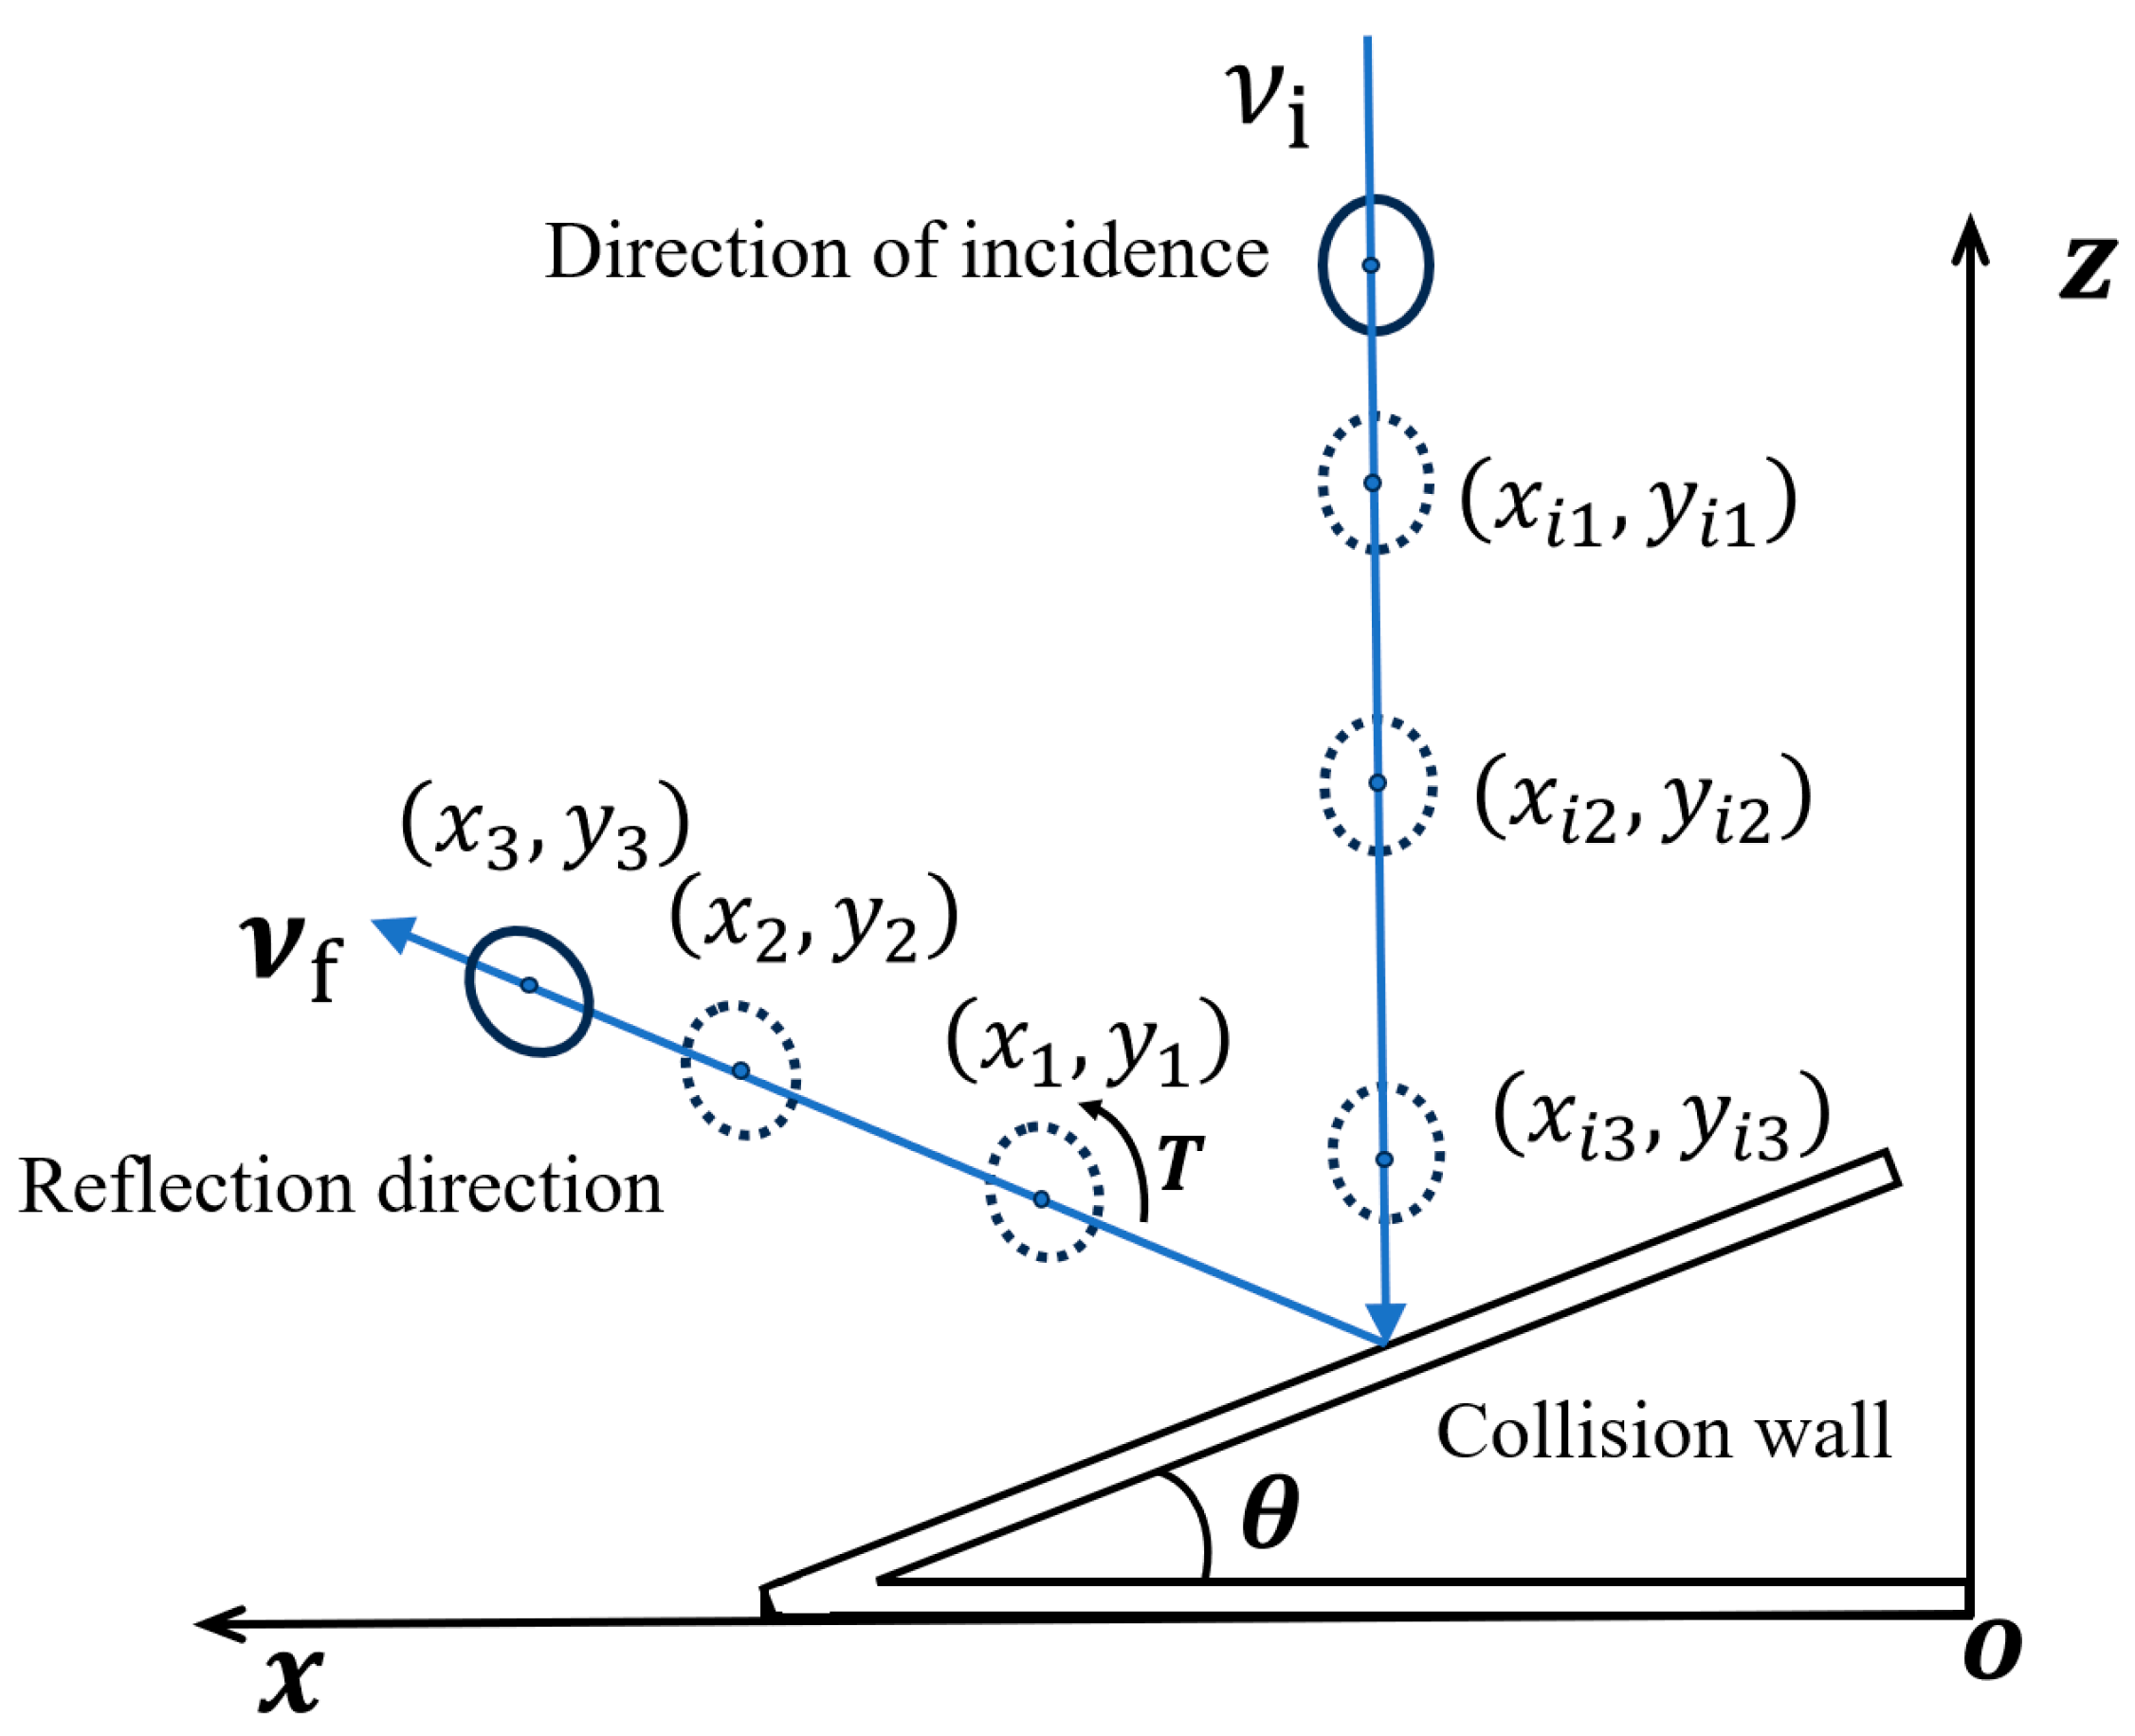
2.3.2. Soybean Collision Velocity

The position coordinates of the soybean in the zox plane can be directly obtained from the high-speed camera images, while the position in the zoy plane is acquired from the mirror image, as shown in Figure 6. By continuously plotting the centroid position of the soybean, the motion trajectory of the soybean during the entire collision process can be obtained. The top view schematic of the collision test platform is shown in Figure 7. In the figure, two perpendicular blue lines represent the coordinate plate. The mirror is positioned at a 135° angle to the horizontal coordinate plate, and the high-speed camera’s viewing angle is parallel to this coordinate plate, recording the soybean collision process. When the soybean moves from point A1 to point A2, the distance moved in the x direction is L, which can be directly obtained from the front-view coordinate plate. The distance moved in the y direction is S, and according to the principle of mirror reflection, the soybean’s coordinates on the zoy plane can be obtained from the reflected image. As shown in Figure 8, by selecting two position points ( x i , y i , z i ) before the soybean collision, the motion trajectory and the distance between the two points can be obtained. Combining the frame interval between the two photos and the shooting frame rate, the time variation between the two points can be calculated, and then the velocities in the x, y, and z directions can be obtained, respectively, as shown in Formulas (1)–(3). By summing the velocities in these three directions, the total incident velocity v i of the soybean before the collision can be obtained, as shown in Equation (4). The calculation method of the rebound velocity is similar to that of the incident velocity. Using the collision point ( x 1 , y 1 , z 1 ) as the reference, the key positions ( x 2 , y 2 , z 2 ) on the rebound path of the soybean after collision with the wall can be extracted to calculate the rebound velocity v f of the soybean.
v f . t . x = x 2 x 1 t 2 t 1
v f . t . y = y 2 y 1 t 2 t 1
v f . t . z = z 2 z 1 t 2 t 1 + 1 2 g t 2 t 1
v f . t = v f . t . x 2 + v f . t . y 2 + v f . t . z 2
where v f . t is the rebound velocity of the soybean, v f . t . x , v f . t . y , and v f . t . z are the components of the rebound velocity in the x, y, and z directions, respectively, x 1 and x 2 are the horizontal coordinates of the soybean centroid at different times during the collision, y 1 and y 2 are the vertical coordinates of the soybean centroid at different times during the collision, t 1 and t 2 are different times, and g is the acceleration due to gravity.

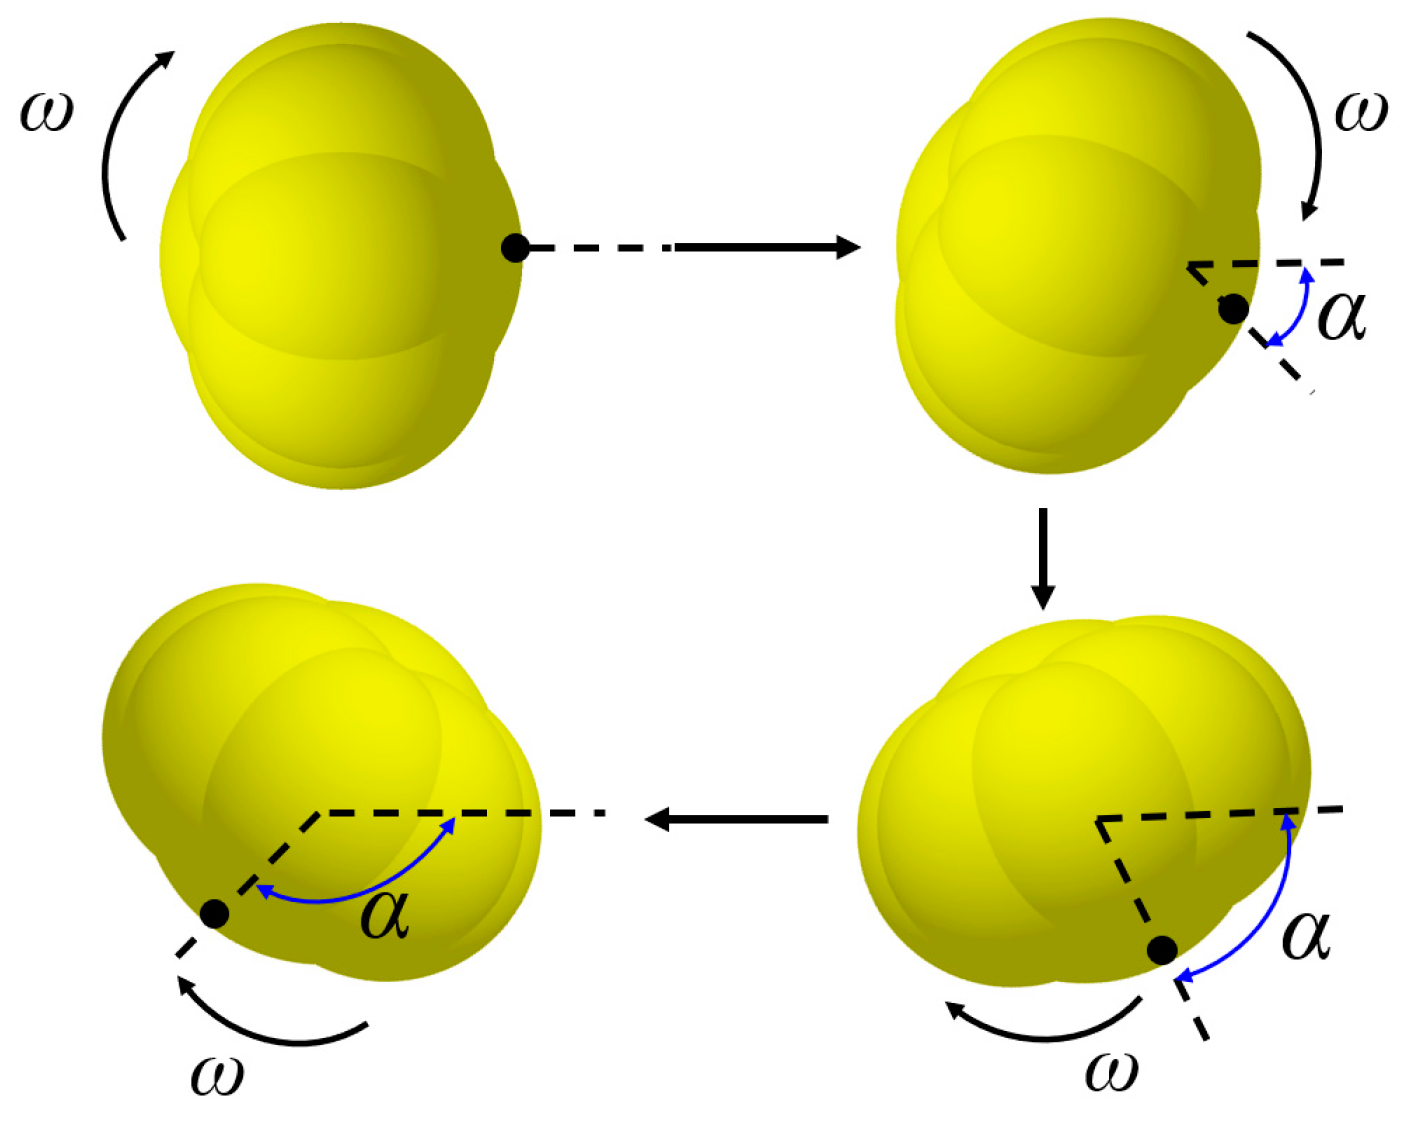
2.3.3. Rotational Angular Velocity

In exploring the changes in soybean motion when colliding with a flat surface, rotational angular velocity is introduced for analysis. After the soybean collides with the wall, the force exerted by the wall creates a torque, converting part of the energy into rotational kinetic energy, causing the soybean to undergo rotational motion and change its angular velocity. Rotational angular velocity not only allows for quantitative analysis of the soybean’s rotational motion post-collision but also reflects the energy conversion process within the system after the collision. The calculation of rotational angular velocity typically uses a marking method. As shown in Figure 9, the navel point on the soybean is marked, and a high-speed camera captures continuous images of the soybean’s rotation after collision. By recording and selecting the frames where the navel point rotates 90°, and combining this with the camera’s frame rate, the time taken for this rotation angle can be determined, thus calculating the soybean’s rotational angular velocity. The formula for soybean rotational angular velocity is shown in Equation (5).
Soybean rotational motion is complex and variable, and post-collision, it may exhibit different forms of motion such as rapid rotation, tumbling, or sliding. High-speed cameras may struggle to accurately capture the marked point’s position, and occlusion issues in the images further increase the uncertainty of the marked point’s position. Therefore, using EDEM simulation technology in combination can better analyze the soybean’s rotational motion.
ω = π 2 / n f = π f 2 n
where ω is the angular velocity, n is the number of frames, f is the camera’s frame rate.

2.3.4. Coefficient of Restitution (COR)

The coefficient of restitution (COR) is primarily used to reflect the elastic properties of a collision, quantifying the nature of the collision and the transfer of kinetic energy. COR typically ranges between [0–1]. When the COR is close to 1, it indicates an elastic collision, meaning there is almost no energy loss after the collision, and the kinetic energy is almost fully transferred. When COR is close to 0, it indicates an inelastic collision, meaning there is significant kinetic energy loss after the collision.
The definition of COR is mainly divided into three types: Newton’s coefficient of restitution, Poisson’s coefficient of restitution, and energy coefficient of restitution. Newton’s coefficient of restitution, also known as the kinematic coefficient of restitution, defines COR as the ratio of the relative velocity after the collision to the relative velocity before the collision, as shown in Equation (6).
e = v u u v
where v is the velocity of the object before the collision, u is the velocity of the obstacle before the collision, v is the velocity of the object after the collision, and u is the velocity of the obstacle after the collision.
In this study, which involves soybeans and the cleaning screen surface, Equation (6) is further simplified and rewritten as Equation (7).
e = v f v i
where v f is the incident velocity of the soybean before the collision, v i is the reflected velocity of the soybean after the collision
The soybean undergoes free fall from a height H to a stationary wall, collides, rebounds, and separates. Its motion involves three-dimensional displacement and velocity changes. During the descent, the soybean moves along the wall’s normal direction without tangential incident velocity. Therefore, the incident velocity v i t consists only of the normal velocity v i . t , as shown in Equation (8). After the collision and rebound, the soybean’s motion becomes three-dimensional. By establishing an absolute spatial coordinate system xyz, its motion can be decomposed into normal and tangential motions. The normal motion is along the z-direction, while the tangential motion lies in the xoy plane, which can be further decomposed into x and y directions. Hence, the reflected velocity ν f is rewritten as Equation (9), and the coefficient of restitution (COR) is rewritten from Equations (7)–(10).
ν i = ν i . t 2 + ν i . n 2 = ν i . n = 2 g H
ν f = ν f . t 2 + ν f . n 2 = ν f . t . x 2 + ν f . t . y 2 + ν f . n . z 2
e = ν f ν i = ν f . t . x 2 + ν f . t . y 2 + ν f . n . z 2 2 g H
The above method is generally only applicable when the wall is stationary. When the incident angle changes or the wall is in motion, the soybean experiences sliding and rotational motion due to the wall’s force. Calculating the coefficient of restitution (COR) based solely on velocity may lead to some deviations. Therefore, when the wall is inclined or in motion, energy calculations are used to determine the COR, as shown in Equation (11). During the descent, the soybean is only affected by gravity, so the pre-collision energy consists solely of kinetic energy, as shown in Equation (12). After the collision, the soybean undergoes rotational motion due to the torque, generating rotational kinetic energy. The point of collision with the wall varies, causing changes in the axis of rotation. For simplification, the soybean is approximated as a uniform sphere to calculate its rotational kinetic energy. Therefore, the post-rebound energy of the soybean is as shown in Equation (13). Equation (10) is further rewritten as Equation (14).
e = E k . f E k
E k = 1 2 m v i 2
E k . f = E l i n e a r . f + E r o t a t i o n a l . f = 1 2 m v f 2 + 1 2 I ω f 2 = 1 2 m ( v f . t . x 2 + v f . t . y 2 + v f . n . z 2 ) + 1 2 2 5 m r 2 ω f 2
e = E k , f E k = ( v f t x 2 + v f t y 2 + v f n z 2 ) + r 2 π 2 f 2 10 n 2 v i 2
where E k and E k . f are the kinetic energies of the soybean before and after the collision, respectively, E l i n e a r . f and E r o t a t i o n a l . f are the linear and rotational kinetic energies of the soybean after the collision, respectively, ω f is the angular velocity of the soybean’s rotation, r is the average radius of the soybean, and I is the moment of inertia of the soybean.

3. Results and Discussion

3.1. Collision and Rebound Characteristics of Soybeans with the Wall

3.1.1. Force and Energy Analysis during Collision

To gain a deeper understanding of the collision mechanism between soybeans and the wall, the force conditions at the moment of soybean collision are investigated. Using discrete element simulation in EDEM, the microscopic force characteristics at the moment of collision are analyzed when a soybean falls freely from a height of 500 mm and collides with a wall inclined at 10° and moving uniformly at a speed of 0.5 m/s.
The soybean undergoes free fall due to gravity and collides with the wall, resulting in a bounce. As shown in Figure 10, before the collision, the soybean is only subjected to gravity, which is 0.002 N. The force magnitude and variation trend in the z-direction are close to the resultant force. The maximum resultant force is 7.784 N, and the maximum force in the z-direction is 7.551 N, indicating that the main force acting on the soybean during the collision comes from the wall’s reactive force in the z-direction. The force in the x-direction also shows a trend of increasing first and then decreasing, with a peak value of only 2.083 N. Since the wall moves horizontally in the x-direction, the force in the x-direction on the soybean mainly comes from the forward motion of the wall. The force in the y-direction is relatively small compared to the other two directions and can be neglected.
In the pre-collision stage I (0.00758–0.007608 s), the soybean is in a free-fall state. As shown in Figure 11 before the motion starts, the potential energy of the soybean is at its maximum, determined by the initial height H 0 . Before the collision, the kinetic energy of the soybean increases to 2.90 × 10⁻⁴ J as it falls freely from H 0 . Since the soybean is only subjected to gravity during this stage, the total energy remains nearly conserved.
In the collision stage II (0.007608–0.007662 s), the soybean undergoes compression deformation after colliding with the wall. The kinetic energy of the soybean reaches its maximum just before the collision as it falls to the lowest point. After the collision, the soybean undergoes elastic deformation and is in a compressed state, causing the kinetic energy to rapidly decrease and convert into the elastic potential energy and some internal energy of the soybean, as shown in Figure 11. Due to the inclined wall and its uniform motion, a torque T is generated after the collision, converting linear kinetic energy into rotational kinetic energy, as shown in Figure 12. The rotational kinetic energy increases from 0 J to a peak value of 2.436 × 10⁻⁶ J, with an increase rate of 4.511 × 10⁻² J/s, while the kinetic energy of the soybean decreases from 2.90 × 10⁻⁴ J to nearly 0 J. It can also be observed that during the collision, the peak value of rotational kinetic energy lags behind the peak value of torque. This is because the angular acceleration caused by the torque takes some time to convert into angular velocity, thereby affecting the rotational kinetic energy.
In the collision recovery stage III (0.007662–0.00774 s), after the elastic deformation reaches its maximum, it starts to recover, and the elastic potential energy of the soybean continues to convert into kinetic energy. Simultaneously, at 0.007662 s, the kinetic energy of the soybean decreases to its minimum. The elastic potential energy stored in the soybean during the collision gradually releases during the recovery stage, converting into linear kinetic energy and gravitational potential energy. From the force perspective, the collision force acting on the soybean rapidly diminishes during the recovery stage, decreasing from 7.79 N to 0 N, and the torque also correspondingly decreases, as shown in Figure 11 and Figure 12.
In the post-collision stage IV (0.00774–0.00776 s), the soybean, under the influence of gravity, gradually slows down, and its kinetic energy decreases. Due to the sliding during the collision between the soybean and the wall, some energy is converted into heat and dissipated due to friction. Therefore, the total energy shows a decreasing trend during this stage, as shown in Figure 11. The energy loss caused by the collision between the soybean and the wall leads to a reduction in total energy. After each bounce, the trends of kinetic energy changes over time are similar, but the magnitude of changes gradually decreases. The total energy of the soybean’s bounce decreases, and the motion stops when the energy is completely dissipated.

3.1.2. The Influence of Wall Velocity on Collision Rebound Height

When soybeans are dropped from a fixed height of 500 mm to a horizontally moving wall, the collision behavior characteristics between the soybeans and the wall change as the wall’s speed increases, as shown by the red curve in Figure 13. As the speed increases from 0.6 m/s to 1.1 m/s, the maximum rebound height of the soybeans gradually decreases, reaching a minimum height of 146 mm at 1.1 m/s. This suggests that when the speed is 0 m/s, the rebound height in the z-direction is at its maximum. This is similar to the motion trend exhibited by Al2O3 particles on moving wall surfaces [33]. However, due to the density difference, the rebound height of soybeans is greater. As the wall speed increases, the relative speed between the soybeans and the wall increases, resulting in greater friction and the generation of torque, which alters the rotation state of the soybeans. The increased friction not only converts more kinetic energy into heat but also transforms part of the vertical kinetic energy into rotational kinetic energy, thereby reducing the rebound kinetic energy in the z-direction and leading to a lower rebound height.
As shown in Figure 13, the trend of the black curve indicates that the maximum horizontal displacement gradually increases with the increase in wall speed. When the wall speed increases from 0.6 m/s to 1.1 m/s, the maximum horizontal displacement increases from 61 mm to 129 mm. Among them, the horizontal displacement increases the fastest at speeds between 0.7 m/s and 0.9 m/s, with values of 61.7 mm, 89.3 mm, and 108.7 mm, respectively. The increased friction causes the force on the soybeans in the horizontal direction to increase, thereby gaining more horizontal kinetic energy. This also increases the horizontal reflection angle, further enhancing the horizontal motion of the soybeans. Consequently, the displacement of the soybeans in the horizontal direction increases.

3.1.3. The Influence of Inclination Angle on Collision Rebound Height

To improve the efficiency of soybean cleaning, the cleaning screen is usually set at a certain angle to the horizontal plane, as shown in Figure 14, which clearly illustrates the impact of wall inclination angle on the soybean’s trajectory. The experiment sets the wall’s motion speed at 0.5 m/s, and the soybeans are dropped from a fixed height of 550 mm. Within the angle range set for this experiment, as the wall inclination increased from 6° to 13°, the rebound heights in the z-direction were 207.4 mm, 196.9 mm, 146.5 mm, 129.6 mm, 105.8 mm, and 84.1 mm, respectively. The corresponding maximum displacements in the x-direction were 116.2 mm, 112.3 mm, 109.9 mm, 111.9 mm, 133.3 mm, 159.2 mm, and 176.8 mm, respectively. From the graph, it can be seen that the maximum rebound height and the horizontal distance at the maximum rebound height have R2 values of 0.9229 and 0.6629 through linear fitting, respectively, indicating a higher fit for the rebound height in the z-direction. It is observed that the two curves intersect between 10° and 11°, indicating that within this range, the maximum rebound height and the maximum horizontal distance are similar.
The inclination angle affects the rebound height and horizontal displacement of the soybeans differently. As the wall’s inclination angle gradually increases, the maximum rebound height gradually decreases, while the corresponding maximum horizontal displacement continuously increases. This is because the vertical force exerted by the wall on the soybeans decreases as the wall’s inclination angle increases, leading to a reduction in vertical kinetic energy. As the inclination angle increases, the sliding tendency of the soybeans on the wall becomes more pronounced, and the friction force increases, resulting in higher energy consumption and thereby reducing the rebound kinetic energy in the vertical direction. The increase in horizontal movement distance is due to the increased horizontal force acting on the soybeans as the inclination angle increases, which enhances the horizontal kinetic energy and extends the horizontal movement distance. Additionally, part of the vertical energy is converted into horizontal kinetic energy, further contributing to the increase in horizontal rebound distance.

3.1.4. Effect of Inclination Angle on Angular Velocity

During the free fall of the soybean, its angular velocity is 0 rad/s. As shown in Figure 15, as the wall inclination angle increases from 8° to 13°, the angular velocity in the x-direction slightly increases but remains within a small range, fluctuating around an average of 42.04 rad/s. It reaches a small peak of 76.69 rad/s at 11 degrees and then remains relatively stable. The rotational angular velocity in the x-direction is influenced by changes in tangential contact force and friction, but since the magnitude of the tangential contact force varies irregularly, there is no obvious pattern in the rotational angular velocity in the x-direction.
When the wall inclination angle is between 8° and 11°, the inclination is relatively small, and the angular velocity in the y-direction increases rapidly from 19.83 rad/s. This is because the normal contact force is larger, converting more translational kinetic energy in the x-direction into rotational kinetic energy in the y-direction, reaching a peak of 242.30 rad/s at 11 degrees before gradually decreasing. As the wall inclination angle continues to increase beyond 11 degrees, the wall becomes more inclined, causing the normal contact force to gradually decrease and the energy conversion to weaken. Consequently, the angular velocity in the y-direction starts to decline, measuring 166.31 rad/s at 12 degrees and 101.87 rad/s at 13 degrees. The rotational angular velocity in the z-direction is less affected by changes in the wall inclination angle, and the conversion effect of the normal contact force on the rotational kinetic energy in the z-direction is not significant. Therefore, the angular velocity in the z-direction remains at a relatively low level, with an average of only 2.53 rad/s, showing slight fluctuations.

3.1.5. Effect of Wall Speed on Angular Velocity

As shown in Figure 16, as the wall speed increases from 0.6 m/s to 1.1 m/s, the rotational angular velocity of the particles also increases accordingly. Similarly, when investigating the variation pattern of angular velocity during the collision of corn, Wang Lijun also found that as the relative velocity increases, the rotational angular velocity gradually rises [31]. A linear fit provides the function y = 22.168 x + 149.08 . This indicates a correlation between the rotational angular velocity and the wall speed. When the wall speed is relatively low, close to 0.6 m/s, the rotational angular velocity of the soybean is lower, at 165 rad/s. As the wall speed increases, the rotational angular velocity rapidly increases, reaching 287 rad/s at a wall speed of 1.1 m/s.
This is mainly because, as the wall motion speed increases, the friction force experienced by the soybean after collision also increases. The increase in friction force results in more kinetic energy being converted into rotational energy, leading to an increase in rotational angular velocity. Additionally, the greater the wall speed, the more tangential momentum the particles acquire during the collision, and the proportion of kinetic energy converted into rotational energy also increases accordingly, resulting in a significant increase in rotational angular velocity.

3.2. Characteristics of COR with Varying Single Factors

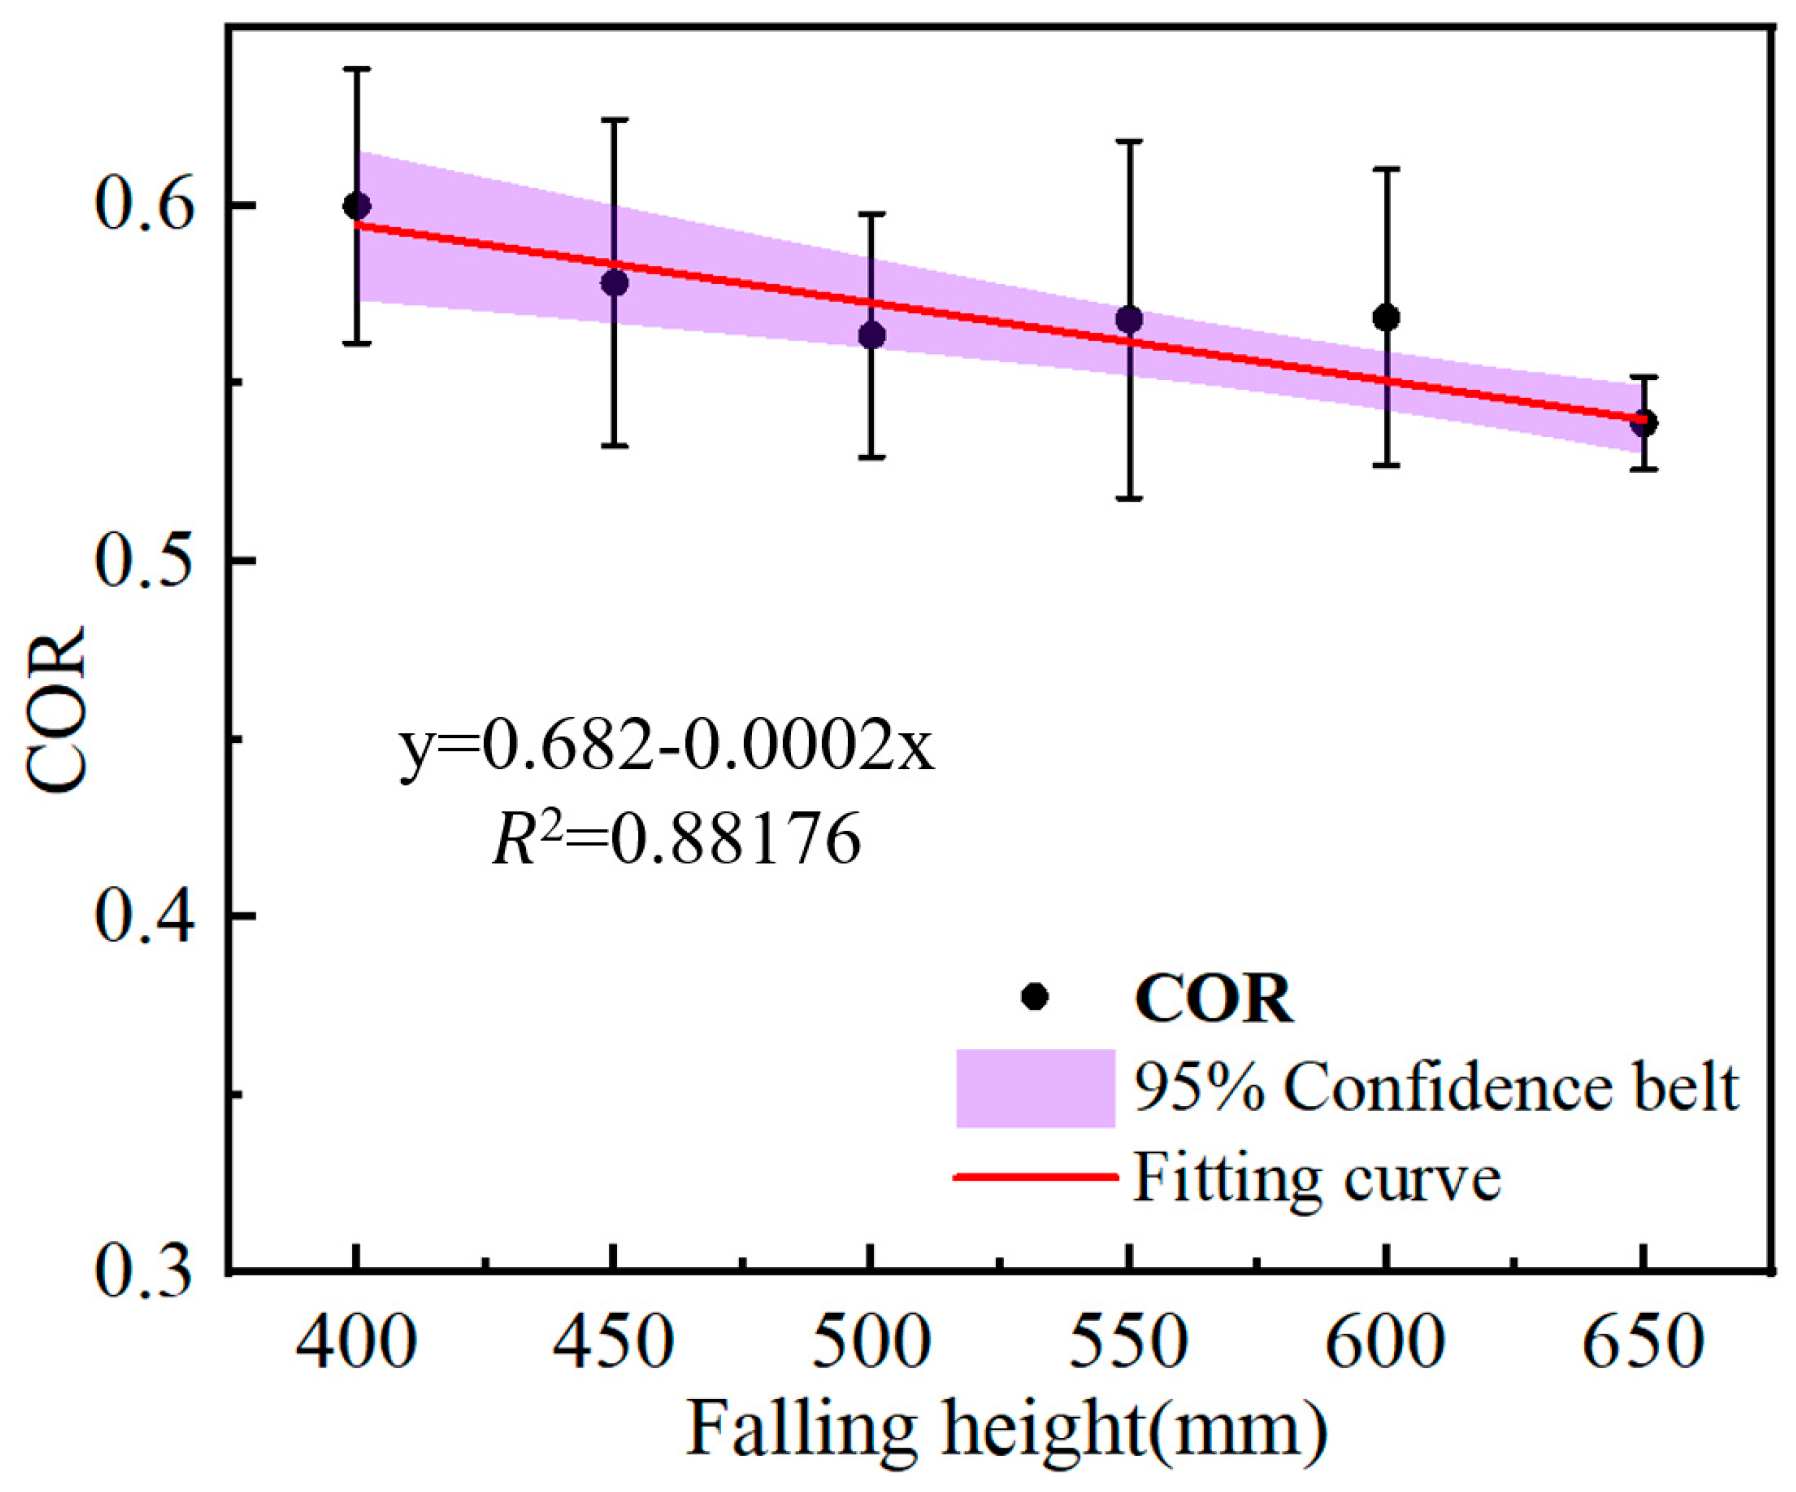
3.2.1. Effect of Soybean Drop Height on COR

According to the experiments conducted, at six different drop heights ranging from 400 mm to 650 mm, the results of soybean collisions with a horizontal wall show that the drop height of the soybeans directly affects their rebound behavior after colliding with the wall, significantly impacting the coefficient of restitution (COR), as shown in Figure 17. When the drop height of the soybeans increased from 400 mm to 650 mm, the corresponding COR values were 0.6001, 0.5784, 0.5636, 0.5681, 0.5686, and 0.5389, respectively. A first-order polynomial was used to fit these points, resulting in an R2 value of 0.7854. The COR of the soybeans ranged between 0.5389 and 0.6001. Although the COR value slightly decreases as the drop height increases, the overall trend is relatively stable. This may indicate that within the drop height range of 400 mm to 650 mm, the rebound characteristics of the soybeans after colliding with the wall are relatively consistent. As shown in Figure 17, with the increase in drop height, the COR value shows a slow downward trend. This indicates that as the height increases, the energy loss during the soybean’s rebound after colliding with the wall gradually increases, leading to a decrease in the COR. This phenomenon is also validated in Jozef Rabik’s study on the variation of soybean grain COR with different drop heights [44]. According to the observed experimental phenomena, an increase in drop height leads to a higher collision velocity for the soybeans. High-speed collisions can result in greater impact forces, increasing deformation and energy loss, thereby reducing the COR value. Especially at higher drop heights, more pronounced deformation effects and energy loss may occur.

3.2.2. Effect of Wall Inclination Angle on COR

According to Figure 18, within the range of wall inclination angles from 8° to 13°, the COR of soybeans shows an overall increasing trend as the wall inclination angle increases. Within the 8–10° range, the change in soybean COR is relatively slow, with values of 0.5404, 0.5382, and 0.5335, respectively. However, once the angle exceeds 10°, the COR increases rapidly to 0.5772, 0.5884, and 0.6241. This phenomenon is due to differences in energy transfer during the collision caused by changes in the wall inclination angle.
At smaller wall inclination angles, the collision between soybeans and the stainless steel plate may be closer to a vertical collision, resulting in greater and more uniform energy loss, hence a lower and more slowly changing COR value. However, when the wall inclination angle exceeds 10°, the collision angle becomes more oblique, leading to greater sliding of the soybeans on the surface after the collision. This reduces the tendency of the soybeans to immediately rebound from the wall, thereby decreasing the energy loss during the collision and causing a rapid increase in COR. A quadratic function was used for fitting analysis, resulting in an R2 value of 0.7954. This indicates a high correlation between the fitted function and the actual COR, further validating the regularity of soybean COR changes with wall inclination angles.

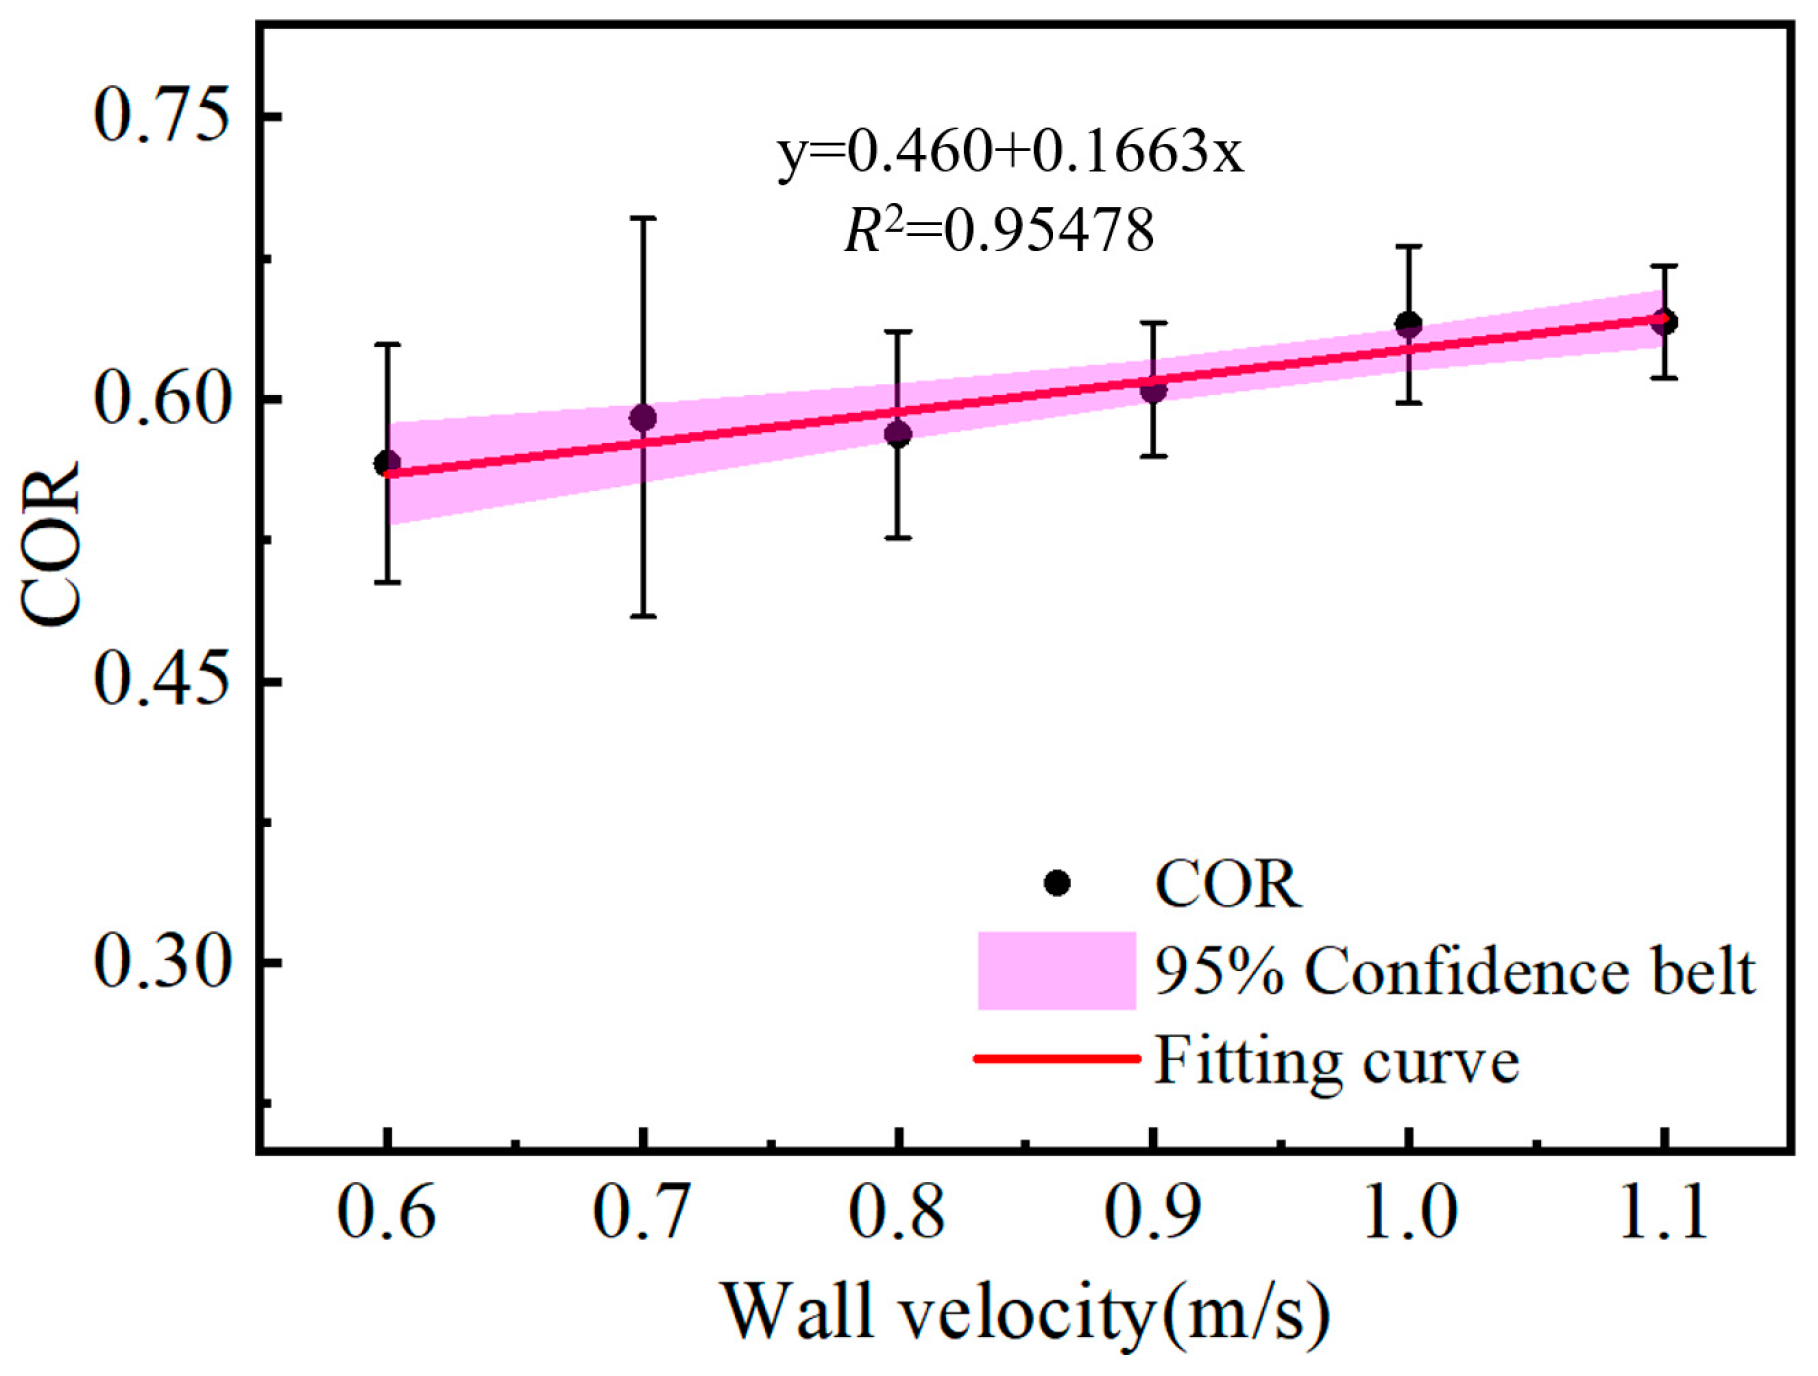
3.2.3. Effect of Wall Movement Speed on COR

The variation of COR with different wall movement speeds is shown in Figure 19. Within a certain speed range, the COR of soybeans gradually increases with the increase in wall movement speed. In the experiments, the commonly used rotational speeds of the cleaning sieve of a soybean combine harvester were chosen and converted into wall movement linear speeds, ranging from 0.8 m/s to 1.2 m/s. Within this range of velocity changes, the COR values for the soybeans are 0.5658, 0.5658, 0.5901, 0.5813, 0.6051, 0.6396, and 0.6411, showing a noticeable increasing trend. A linear function fitting analysis was performed, resulting in an R2 value of 0.8973. This fitting result indicates a high degree of correlation between the experimental results and the linear model.
Experimental observations reveal that as the wall speed increases, the rebound speed of the soybeans also increases. This increase is due to factors such as the increase in kinetic energy and changes in pressure during the collision. As the speed of the stainless steel plate increases, the kinetic energy correspondingly increases. During the collision, the kinetic energy of the plate and the soybeans is transferred to the soybeans, resulting in a higher rebound speed after the collision, thereby increasing the COR of the soybeans. Additionally, the relative speed between the soybeans and the wall increases with the wall speed. High-speed collisions can produce greater pressure, which may cause the soybeans to experience more significant compression during the collision. This allows the soybeans to store more energy, which is released after the collision, increasing the rebound speed of the soybeans and consequently increasing the COR.

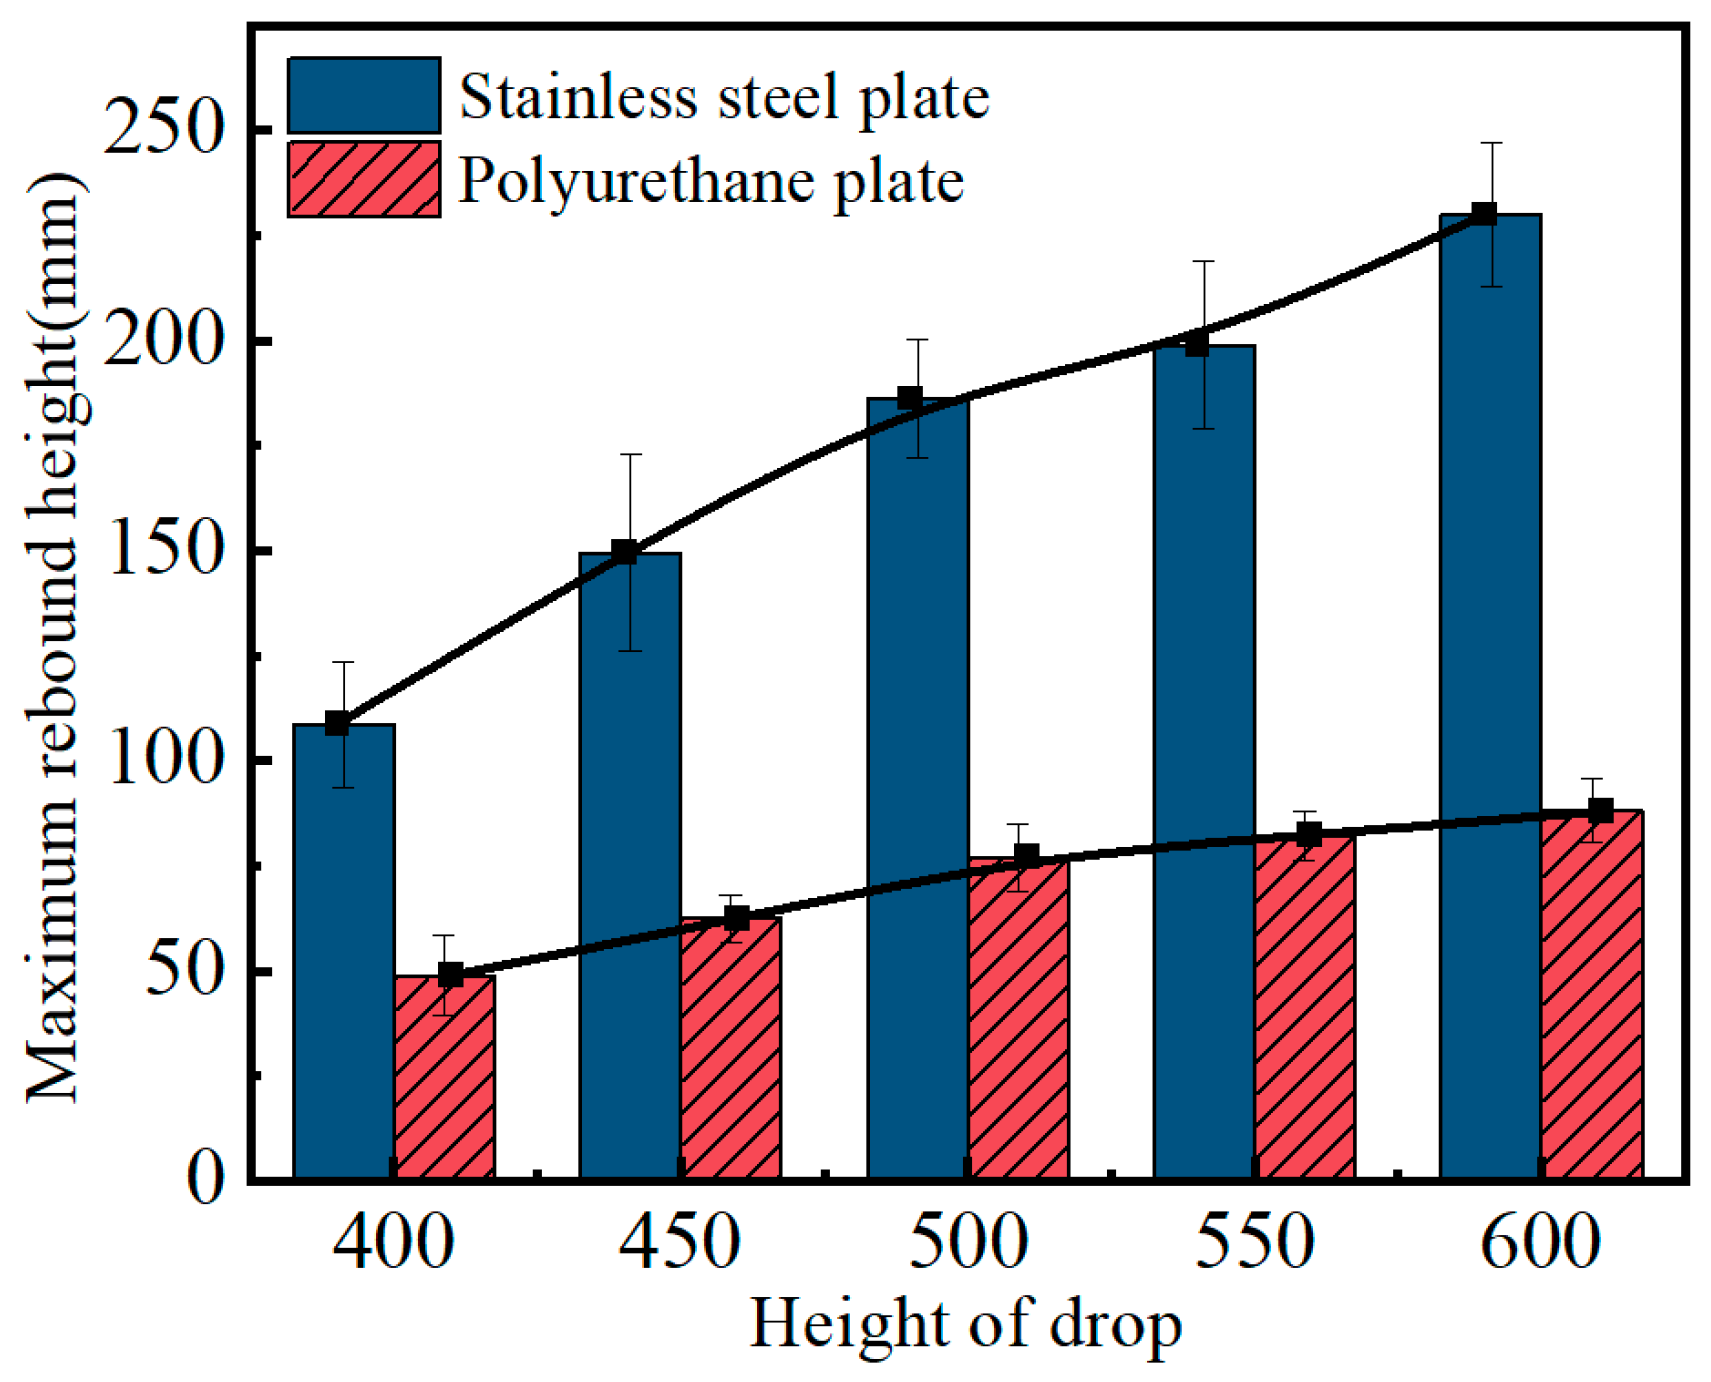
3.2.4. Effect of Wall Material on COR

The maximum rebound heights of soybeans after falling from different heights and colliding with stainless steel and polyurethane plates are shown in Figure 20. As the drop height increases from 400 mm to 600 mm, the rebound heights on the polyurethane board are 48.7 mm, 62.4 mm, 76.8 mm, 82.1 mm, and 88.1 mm, while the rebound heights on the stainless steel board are 108.4 mm, 149.4 mm, 186.1 mm, 198.8 mm, and 230.0 mm. This shows that, at the same drop height, the rebound height on the polyurethane board is significantly lower than that on the stainless steel board, with the rebound height on the polyurethane board being only 42% of that on the stainless steel board. This is because the surface hardness and elastic modulus of the stainless steel plate are higher, while the polyurethane plate has higher energy absorption and deformation capacity. Therefore, during collisions, the stainless steel plate can more effectively retain kinetic energy, resulting in a greater rebound height. In contrast, the polyurethane plate may absorb more energy during the collision, thereby reducing the rebound height. As a result, the stainless steel plate experiences less energy loss during the collision compared to the polyurethane plate, leading to a higher COR. It is evident that the higher the hardness of the collision material, the smaller the deformation during the collision, which results in less energy loss and a higher COR. This conclusion is also supported by the research of Yao Shiqi and Yang, Y. [45,46].

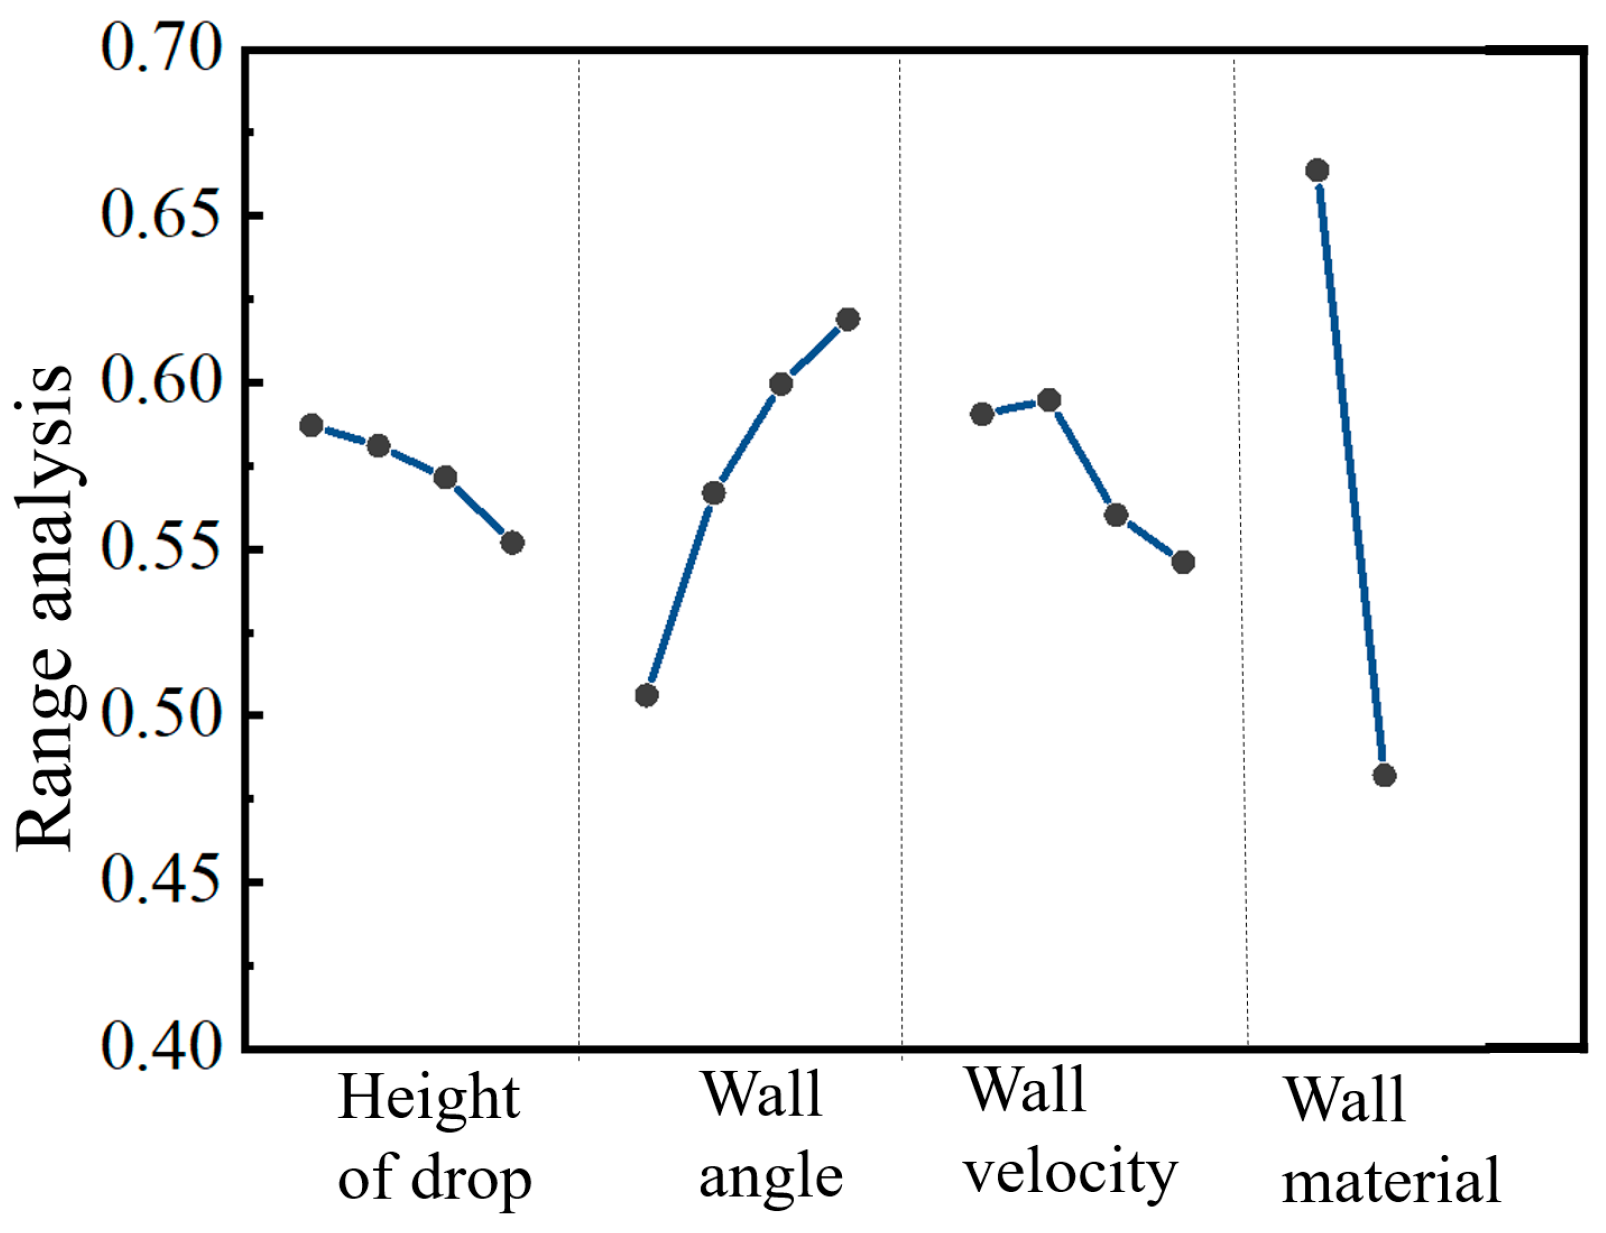
3.3. Orthogonal Experiment on COR

Based on single-factor experiments, an orthogonal experiment was designed referencing an orthogonal table L16 (43 × 213) to investigate the four factors influencing the COR value. Four levels were set for drop height, wall inclination angle, and wall speed, while wall material and the control group were set to two levels each, resulting in a total of 16 groups. Each group of experiments was repeated six times to obtain the average COR value.
Figure 21 shows the effect diagram of COR range analysis with changes in factor levels. Combined with Table 4, it can be seen that the COR ranges for the four factors are 0.0352, 0.113025, 0.04865, and 0.1817, respectively. This indicates that the order of influence on COR from most to least significant is: wall material > wall inclination angle > wall speed > drop height. Huang Xiaomao, in his study on the COR of rapeseeds, also found that among all influencing factors, the collision material has the greatest impact on the COR [47].
To further confirm the significance of the effects of each factor on COR, an analysis of variance was performed on the experimental results using the data analysis software SPSS(IBM SPSS Statistics 27.0.1, International Business Machines Corporation, Chicago, IL, USA). The ANOVA results are shown in Table 5, covering the effects of drop height, wall inclination angle, wall speed, and wall material on COR. The p-values reflect the significance of the relationship between the factors and COR. The p-value for wall material is less than 0.001, indicating that the effect of wall material on COR is highly significant. The p-value for wall inclination angle is less than 0.05, indicating that the effect of wall inclination angle on COR is also highly significant. The other factors have smaller effects on COR. Therefore, it can be concluded that the order of the factors influencing COR is: wall material > wall inclination angle > wall speed > drop height. This conclusion is consistent with the results of the range analysis, further validating the influence of each factor on COR.
From the above analysis, it can be concluded that partitioning the cleaning sieve by function and using different wall materials in the front and rear sections can optimize the cleaning effect of soybeans. Specifically, stainless steel should be used in the front section, while polyurethane should be used in the rear section. This combination takes advantage of the high strength and wear resistance of stainless steel to ensure efficient separation of soybeans in the front section, while the flexibility and shock-absorbing properties of polyurethane help reduce soybean bouncing losses at the rear of the cleaning sieve, thus lowering the loss rate. Additionally, by appropriately increasing the inclination angle of the cleaning sieve and the rotational speed to increase the horizontal movement speed [25], the bouncing characteristics of soybeans can be enhanced, making it easier for them to separate from the stalks. This adjustment also enhances the ejection effect on the stalks, thereby facilitating more effective separation of soybeans from the stalks. By optimizing the selection of materials and adjusting mechanical parameters, enhance the reliability of the screening device [48], significantly improve the efficiency and quality of soybean screening, and increase production efficiency.

4. Conclusions

This study utilized a self-developed soybean collision testing platform and EDEM simulation technology to experimentally investigate the collision characteristics of harvested soybeans (variety: Xinzhendou 1) under multiple-factor conditions. The following conclusions were drawn:
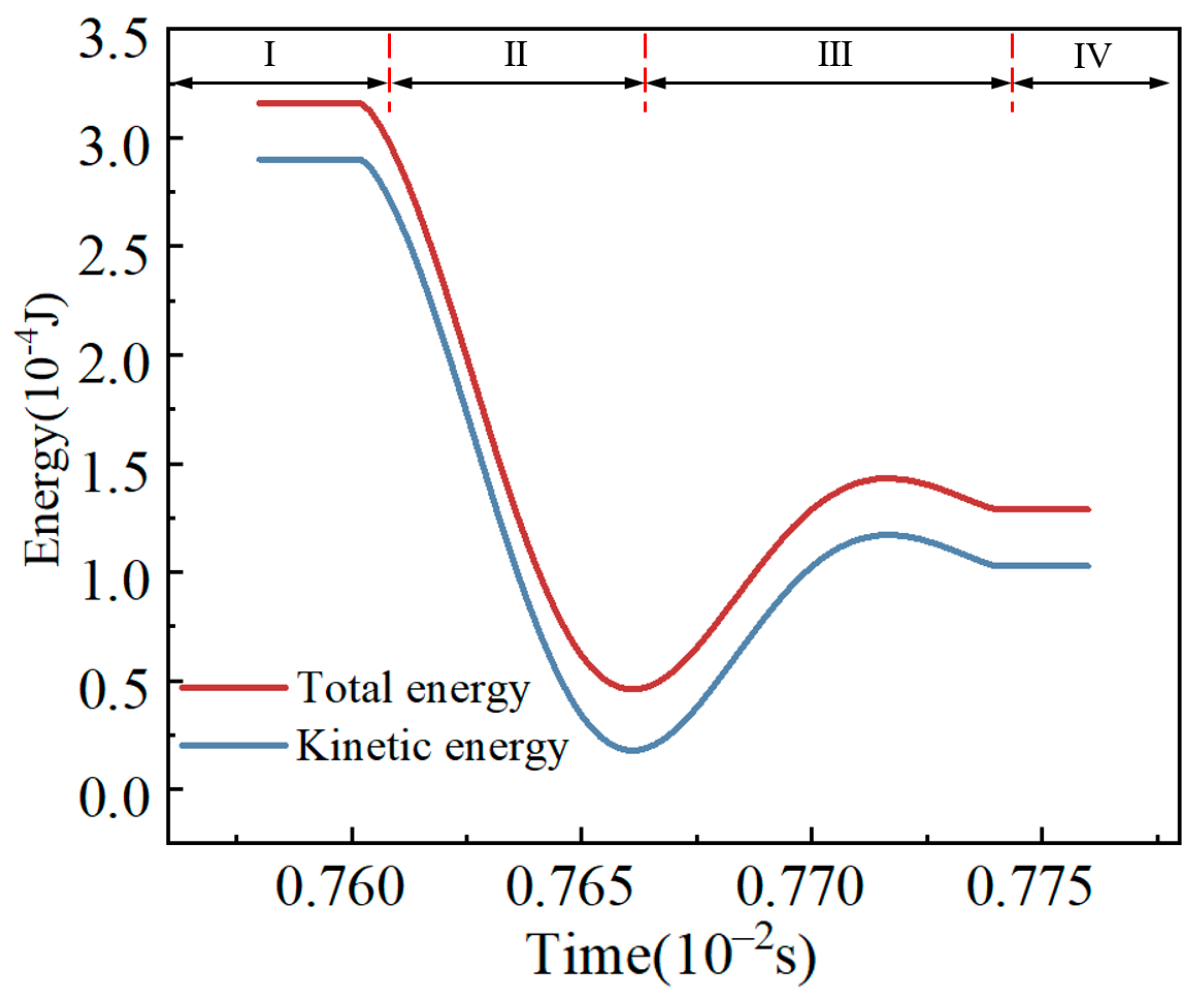
  • The collision between soybeans and the wall can be divided into four stages: Pre-collision stage: Soybeans are in a free-fall state, with the maximum potential energy determined by the initial height H 0 of the soybeans, and the total energy is essentially conserved. Compression stage: After colliding with the wall, soybeans undergo compression deformation, resulting in a rapid decrease in kinetic energy, which is converted into elastic potential energy and partial internal energy. Additionally, a torque T is generated. Recovery stage: After reaching maximum elastic deformation, soybeans begin to recover, gradually increasing their kinetic energy, while the collision force rapidly weakens and the torque correspondingly decreases. Post-collision stage: As the soybean separates from the wall and is subjected to gravity, its speed gradually decreases, resulting in reduced kinetic energy and increased gravitational potential energy. Due to friction, some of the energy is converted into heat and lost. The total energy shows a decreasing trend, with the rebound energy gradually diminishing until the motion stops.
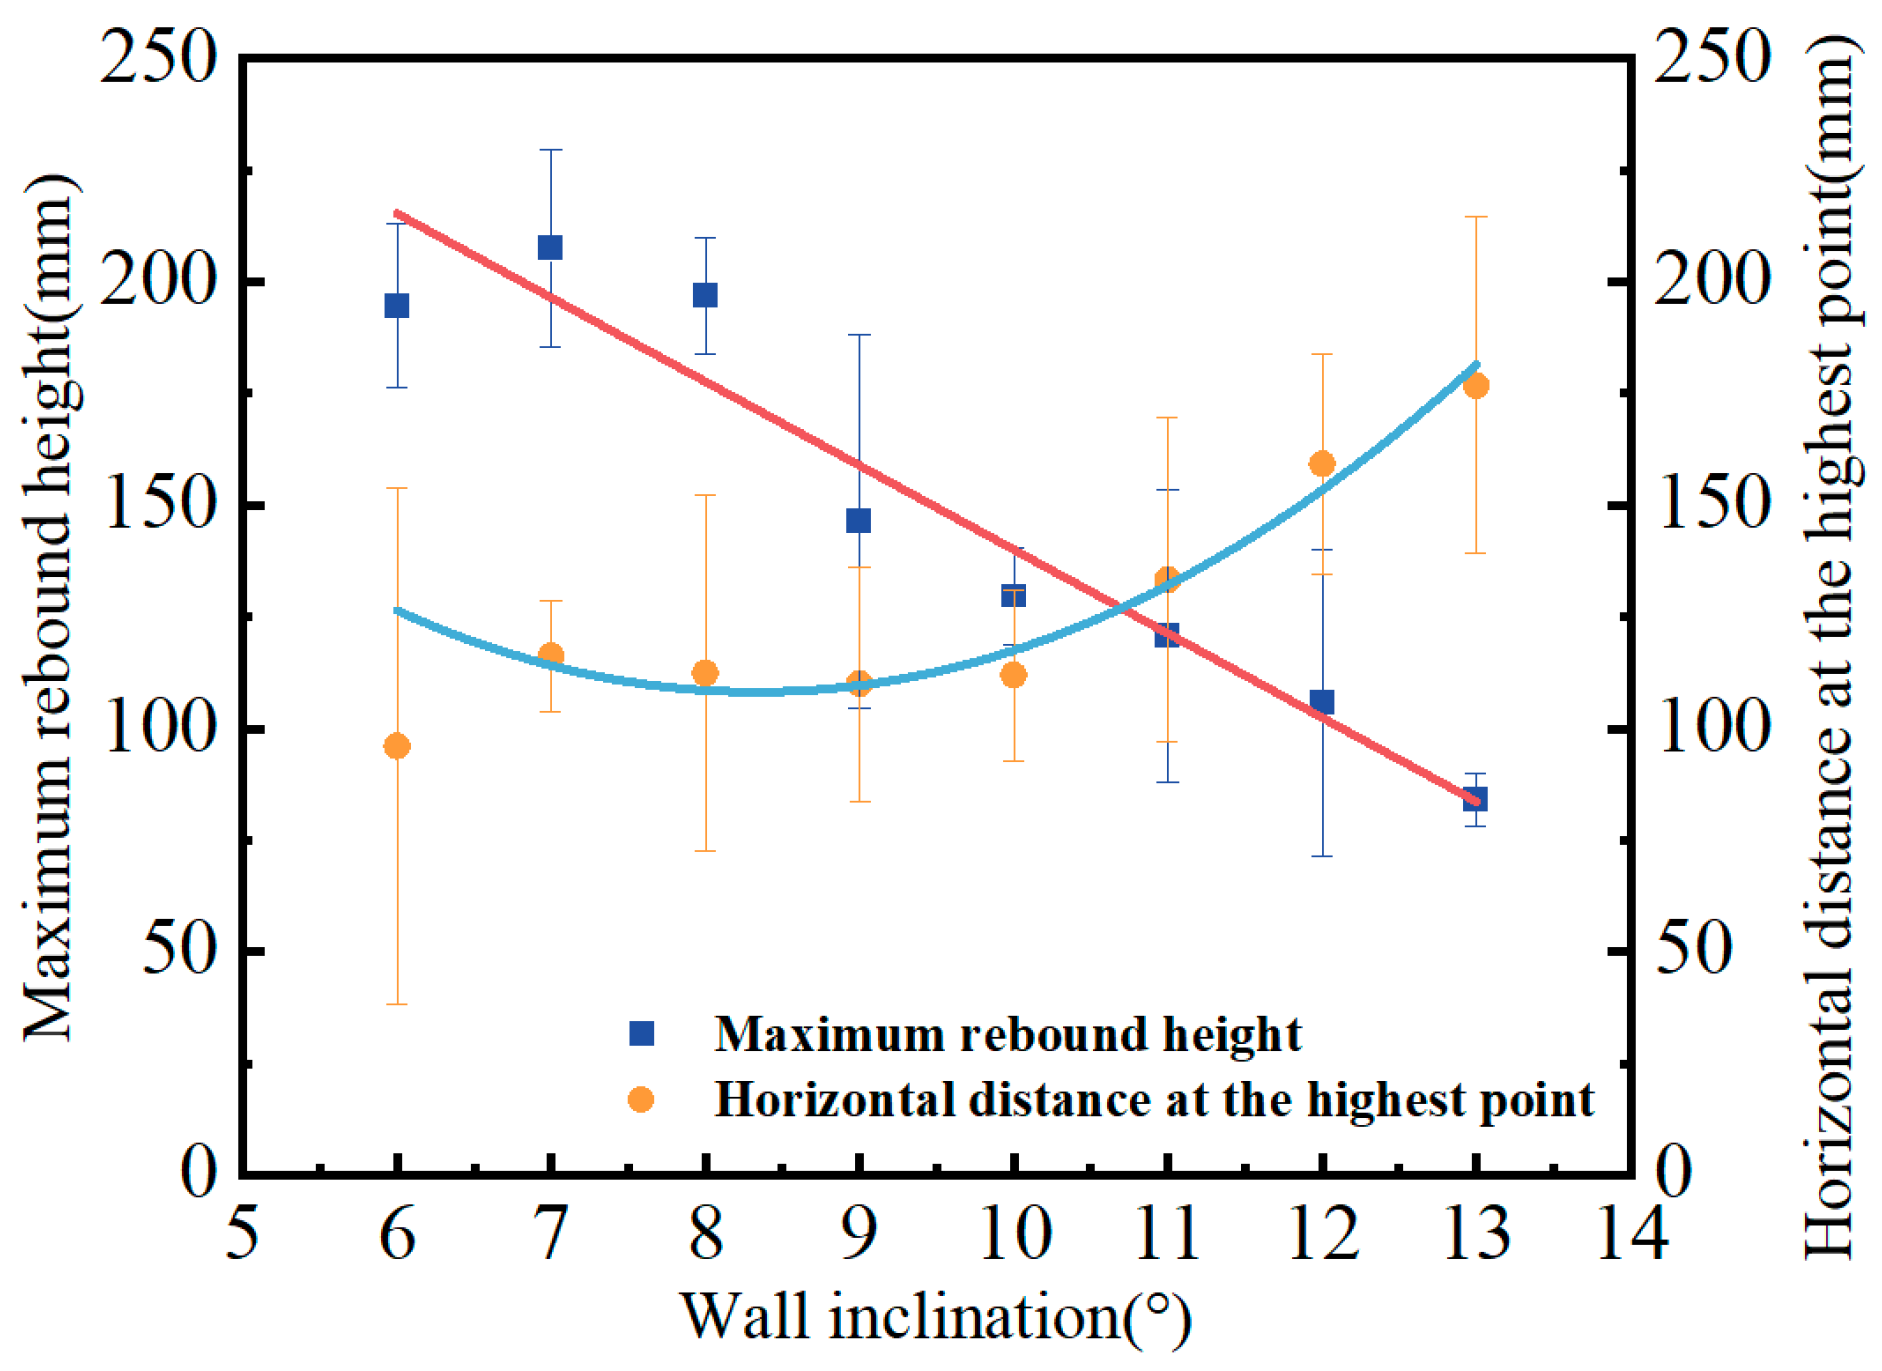
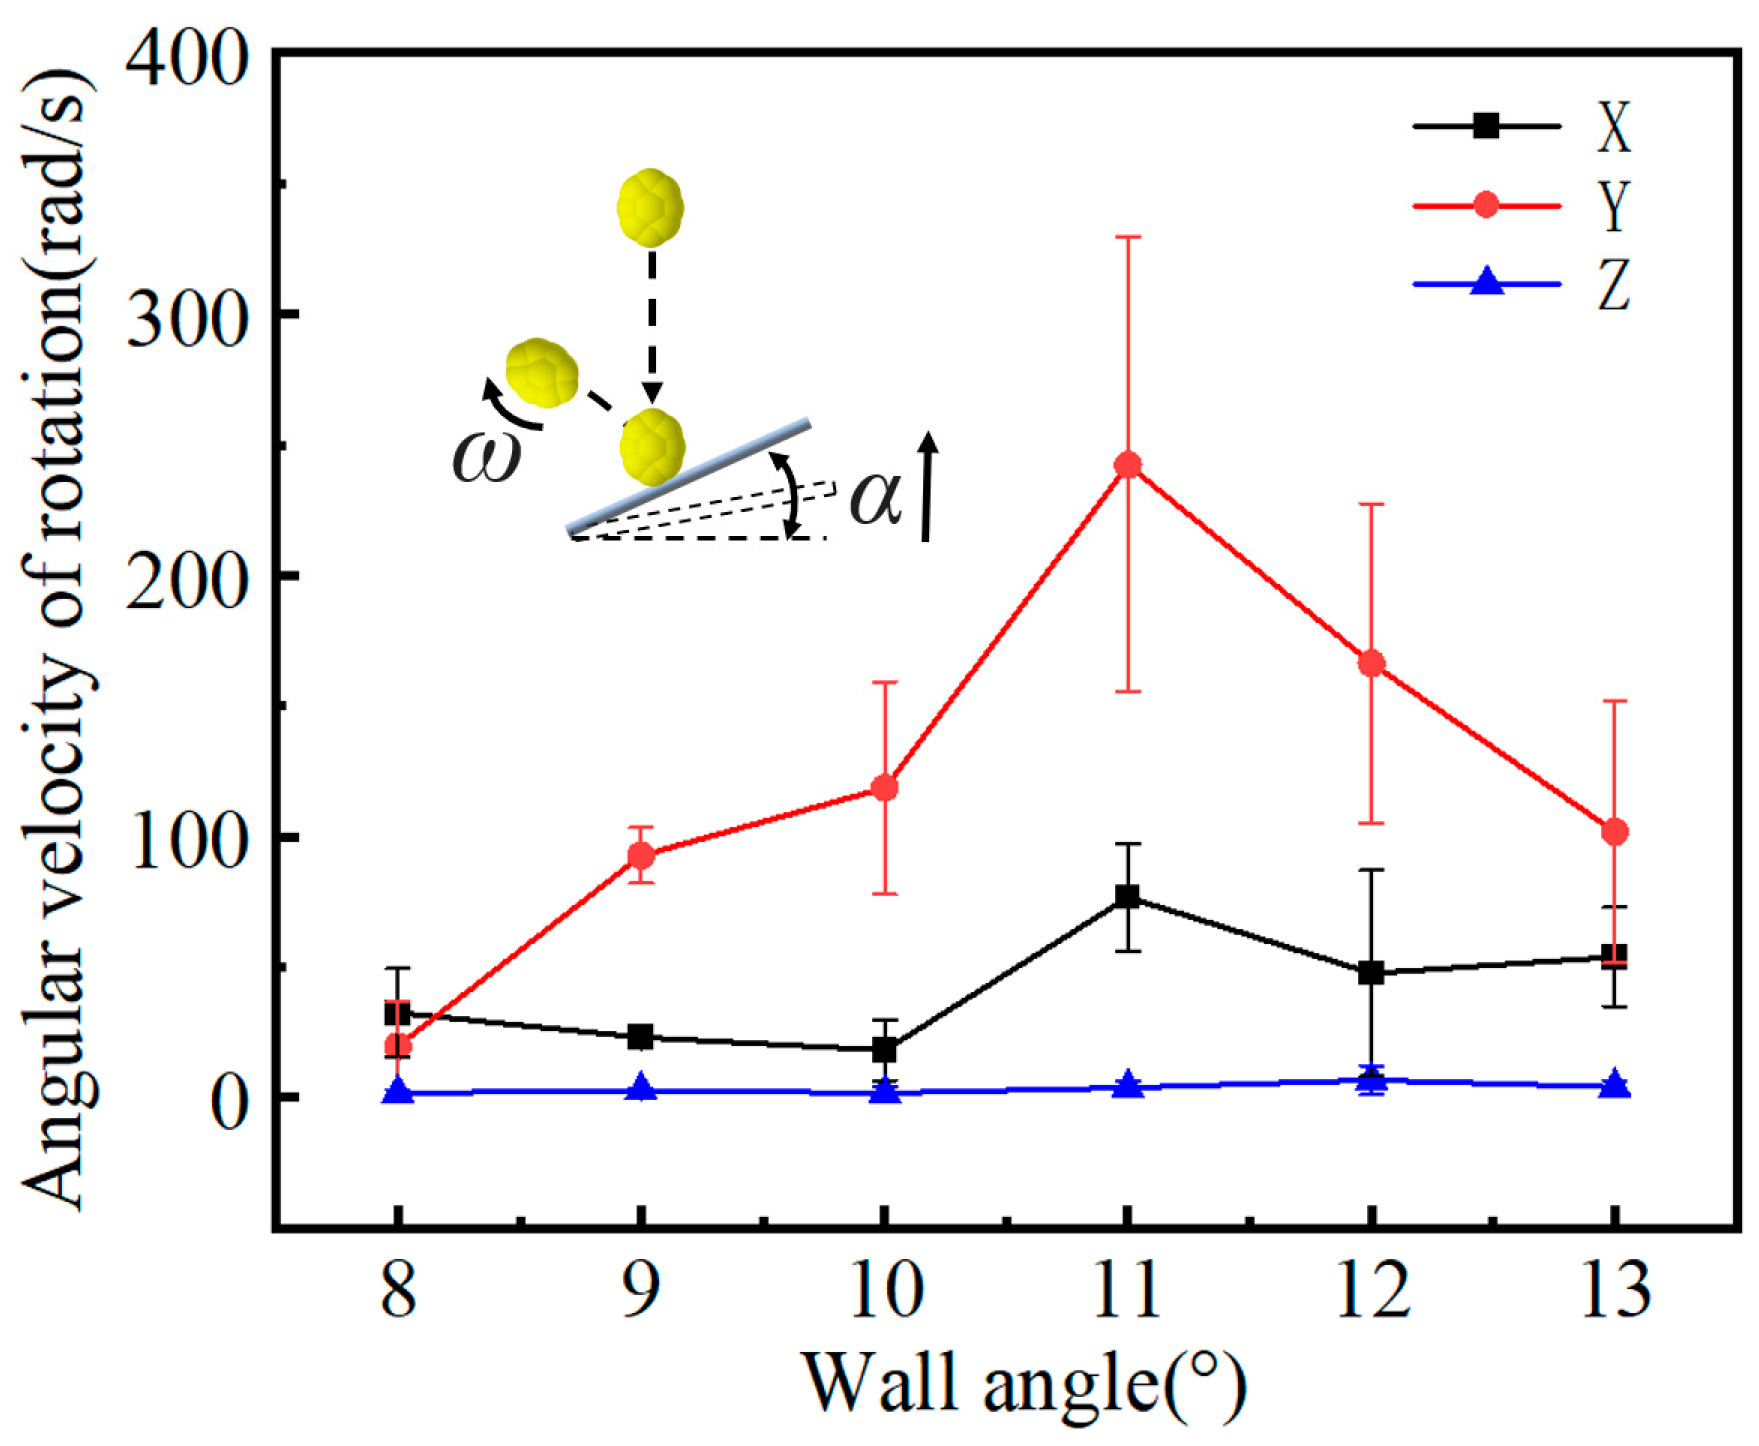
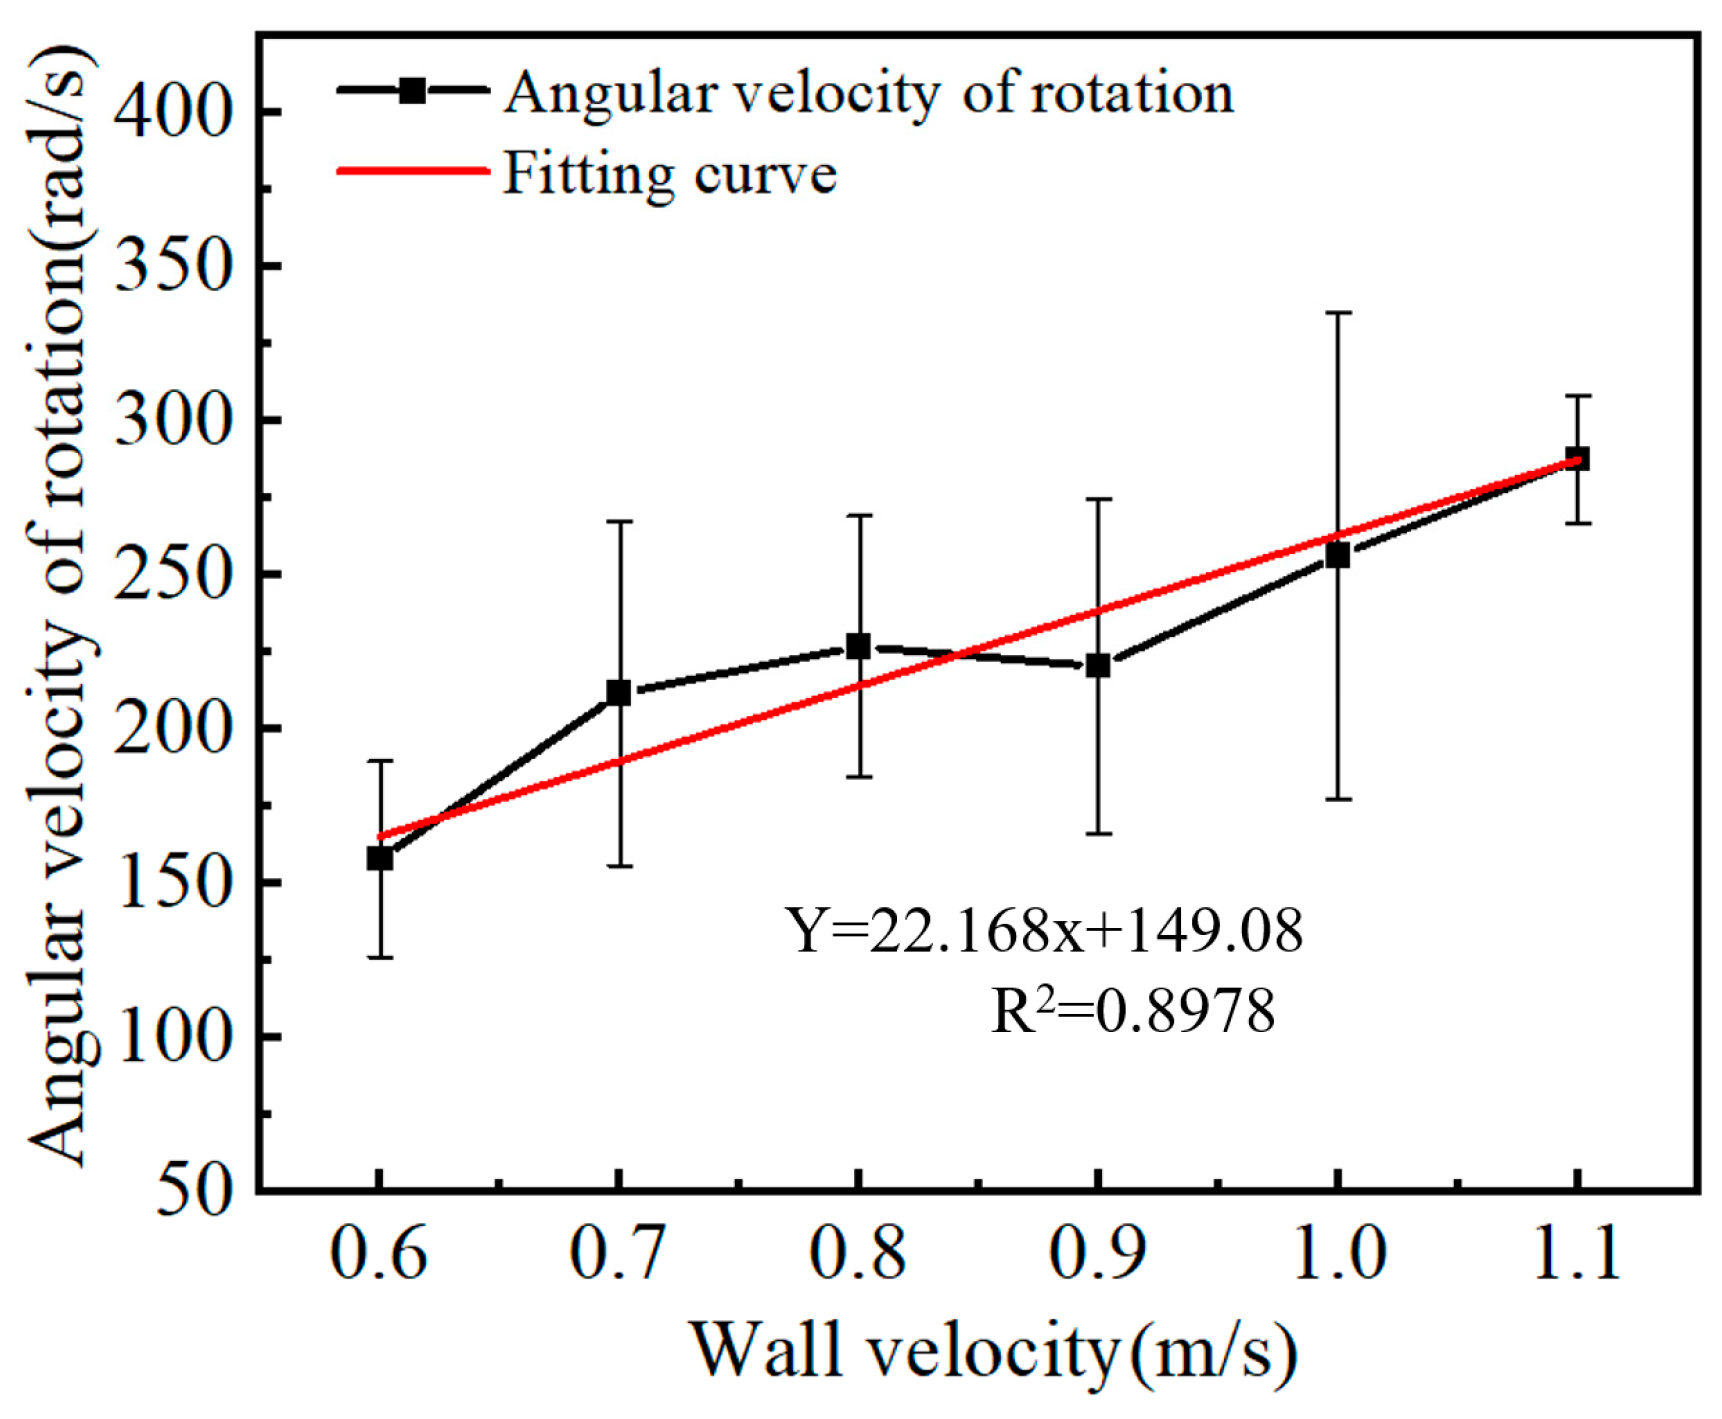
  • The rebound height from collisions can intuitively reflect the collision characteristics of soybeans, whereas the experimental finding indicated that the key factors influencing the coefficient of restitution (COR) of soybeans, in order of importance, are: wall material > wall angle > wall speed > drop height. Regardless of the conditions, the COR value of soybeans colliding with polyurethane boards is less than that with stainless steel boards. As the wall speed increases, the maximum rebound height of soybeans decreases, the corresponding horizontal distance gradually increases, and the rotational angular velocity also gradually increases. When the wall angle increases, the maximum rebound height of soybeans shows a linear downward trend, but the horizontal distance changes slowly before 10° and increases rapidly after exceeding 10°. In the range of 8°–11°, the y-direction angular velocity significantly increases, the x-direction angular velocity increases slowly, and the z-direction angular velocity remains almost unchanged; beyond 11°, the y-direction angular velocity rapidly decreases, the x-direction angular velocity slowly decreases, and the z-direction angular velocity slightly increases. As the drop height of soybeans increases, the COR gradually decreases; as the wall angle and wall speed increase, the COR also increases. By studying the bouncing behavior of soybeans and their coefficient of restitution (COR) on cleaning sieves, it is possible to more accurately predict the motion trajectory of soybeans on the sieve surface, which helps in designing more effective screening structures. This research also provides a basis for selecting the installation angle, aperture size, and material of the cleaning sieve, which aids in optimizing the screening process to ensure effective separation and screening efficiency of soybeans. Additionally, accurate COR values can provide essential parameters for the use of simulation software such as EDEM.

Author Contributions

Conceptualization, X.G.; methodology, X.G.; software, S.C.; validation, Z.T.; formal analysis, X.G.; investigation, S.W.; resources, B.L.; data curation, Y.H.; writing—original draft preparation, X.G.; writing—review and editing, S.W.; supervision, S.C.; project administration, Z.T.; funding acquisition, S.W. and B.L. All authors have read and agreed to the published version of the manuscript.

Funding

This research was funded by the Agricultural GG Project of the Xinjiang Production and Construction Corps and the Key Laboratory Equipment of Modern Agricultural Equipment and Technology (Jiangsu University), Ministry of Education (MAET202306).

Institutional Review Board Statement

Not applicable.

Data Availability Statement

The data used to support the findings of this study are available from the corresponding author upon request.

Conflicts of Interest

The authors declare no conflict of interest.

References

  1. Zhu, Q.; Wang, F.; Yi, Q.; Zhang, X.; Chen, S.; Zheng, J.; Peng, D. Modeling soybean cultivation suitability in China and its future trends in climate change scenarios. J. Environ. Manag. 2023, 345, 118934. [Google Scholar] [CrossRef]
  2. Pereira, R.P.T.; Galo, N.R.; Filimonau, V. Food loss and waste from farm to gate in Brazilian soybean production. J. Agric. Food Res. 2022, 10, 100431. [Google Scholar]
  3. Feng, L.; Wang, H.; Ma, X.; Peng, H.; Shan, J. Modeling the current land suitability and future dynamics of global soybean cultivation under climate change scenarios. Field Crops Res. 2021, 263, 108069. [Google Scholar] [CrossRef]
  4. Kou, H.; Liao, Z.; Zhang, H.; Lai, Z.; Liu, Y.; Kong, H.; Fan, J. Grain yield, water-land productivity and economic profit responses to row configuration in maize-soybean strip intercropping systems under drip fertigation in arid northwest China. Agric. Water Manag. 2024, 297, 108817. [Google Scholar] [CrossRef]
  5. Liang, Z.; Wada, M.E. Development of cleaning systems for combine harvesters: A review. Biosyst. Eng. 2023, 236, 79–102. [Google Scholar] [CrossRef]
  6. Li, Y.; Xu, L.; Lv, L.; Shi, Y.; Yu, X. Study on Modeling Method of a Multi-Parameter Control System for Threshing and Cleaning Devices in the Grain Combine Harvester. Agriculture 2022, 12, 14839. [Google Scholar] [CrossRef]
  7. Liang, Y.; Tang, Z.; Zhang, H.; Li, Y.; Ding, Z.; Su, Z. Cross-flow fan on multi-dimensional airflow field of air screen cleaning system for rice grain. Int. J. Agric. Biol. Eng. 2022, 15, 223–235. [Google Scholar] [CrossRef]
  8. Liu, J.; Jing, C.; Liang, S.; Ni, Y. Research status of soybean mechanical harvest loss. J. Agric. Mech. Res. 2017, 7, 1–9+15. [Google Scholar]
  9. Zhang, J.; Cheng, H.; Ji, W.; Hou, S. Experimental study on suspension velocity of soybean extrusions. J. Agric. Mech. Res. 2013, 127–131. [Google Scholar] [CrossRef]
  10. Fu, H.; Yang, J.; Du, W.; Wang, W.; Liu, G.; Yang, Z. Determination of coefficient of restitution of fresh market apples caused by fruit-to-fruit collisions with a sliding method. Biosyst. Eng. 2022, 224, 183–196. [Google Scholar] [CrossRef]
  11. Zhou, F.; Feng, L.; Zhang, Q.; Gao, K. Collision characteristics of coal particles in arc-shaped plug elbow for pneumatic conveying. Adv. Powder Technol. 2024, 35, 104480. [Google Scholar] [CrossRef]
  12. Cao, X.; Li, Z.; Li, H.; Wang, X.; Ma, X. Measurement and calibration of the parameters for discrete element method modeling of rapeseed. Processes 2021, 9, 605. [Google Scholar] [CrossRef]
  13. Du, C.; Han, D.; Song, Z.; Chen, Y.; Chen, X.; Wang, X. Calibration of contact parameters for complex shaped fruits based on discrete element method: The case of pod pepper (Capsicum annuum). Biosyst. Eng. 2023, 226, 43–54. [Google Scholar] [CrossRef]
  14. Wu, Z.; Li, G.; Yang, R.; Fu, L.; Li, R.; Wang, S. Coefficient of restitution of kiwifruit without external interference. J. Food Eng. 2022, 327, 111060. [Google Scholar] [CrossRef]
  15. Zhang, B.; Chen, X.; Liang, R.; Li, J.; Wang, X.; Meng, H.; Kan, Z. Cotton stalk restitution coefficient determination tests based on the binocular high-speed camera technology. Int. J. Agric. Biol. Eng. 2022, 15, 181–189. [Google Scholar] [CrossRef]
  16. Liu, Y.; Zong, W.; Ma, L.; Huang, X.; Li, M.; Tang, C. Determination of three-dimensional collision restitution coefficient of oil sunflower grain by high-speed photography. Nongye Gongcheng Xuebao/Transations Chin. Soc. Agric. Eng. 2020, 36, 44–53. [Google Scholar]
  17. Yan, D.; Yu, J.; Wang, Y.; Zhou, L.; Sun, K.; Tian, Y. A review of the application of discrete element method in agricultural engineering: A case study of soybean. Processes 2022, 10, 1305. [Google Scholar] [CrossRef]
  18. Benque, B.; Orefice, L.; Forgber, T.; Habeler, M.; Schmid, B.; Remmelgas, J.; Khinast, J. Improvement of a pharmaceutical powder mixing process in a tote blender via DEM simulations. Int. J. Pharm. 2024, 658, 124224. [Google Scholar] [CrossRef] [PubMed]
  19. Guo, J.; Wang, G.; Sun, G.; Wang, S.; Guan, W.; Chen, Z. DEM simulation and optimization of crushing chamber shape of gyratory crusher based on Ab-t10 model. Miner. Eng. 2024, 209, 108606. [Google Scholar] [CrossRef]
  20. Wang, L.; Zheng, Z.; Yu, Y.; Liu, T.; Zhang, Z. Determination of the energetic coefficient of restitution of maize grain based on laboratory experiments and DEM simulations. Powder Technol. 2020, 362, 645–658. [Google Scholar] [CrossRef]
  21. Wang, L.; Zhou, W.; Ding, Z.; Li, X.; Zhang, C. Experimental determination of parameter effects on the coefficient of restitution of differently shaped maize in three-dimensions. Powder Technol. 2015, 284, 187–194. [Google Scholar] [CrossRef]
  22. Li, D.; Wang, Z.; Liang, Z.; Zhu, F.; Xu, T.; Cui, X.; Zhao, P. Analyzing rice grain collision behavior and monitoring mathematical model development for grain loss sensors. Agriculture 2022, 12, 839. [Google Scholar] [CrossRef]
  23. Buck, B.; Tang, Y.; Heinrich, S.; Deen, N.G.; Kuipers, J.A.M. Collision dynamics of wet solids: Rebound and rotation. Powder Technol. 2017, 316, 218–224. [Google Scholar] [CrossRef]
  24. Fang, W.; Wang, X.; Han, D.; Chen, X. Review of material parameter calibration method. Agriculture 2022, 12, 706. [Google Scholar] [CrossRef]
  25. Fu, J.; Zhang, J.; Liu, F. Enhanced sieving mechanism of novel cleaning screen and investigation of particle movement characteristics on the screen. Powder Technol. 2024, 431, 119043. [Google Scholar] [CrossRef]
  26. Wang, L.; Liu, T.; Feng, X.; Gao, Y.; Wang, B.; Zhang, S. Research progress of the restitution coefficients of collision of particles in agricultural and food fields. Trans. Chin. Soc. Agric. Eng. 2021, 37, 313–322. [Google Scholar]
  27. Stronge, W.J. Rigid body collisions with friction. Proceedings of the Royal Society of London. Ser. A Math. Phys. Sci. 1990, 431, 169–181. [Google Scholar]
  28. Jiang, Z.; Du, J.; Rieck, C.; Bück, A.; Tsotsas, E. PTV experiments and DEM simulations of the coefficient of restitution for irregular particles impacting on horizontal substrates. Powder Technol. 2020, 360, 352–365. [Google Scholar] [CrossRef]
  29. Wang, L.; Wu, B.; Wu, Z.; Li, R.; Feng, X. Experimental determination of the coefficient of restitution of particle-particle collision for frozen maize grains. Powder Technol. 2018, 338, 263–273. [Google Scholar] [CrossRef]
  30. Horabik, J.; Molenda, M. Parameters and contact models for DEM simulations of agricultural granular materials: A review. Biosyst. Eng. 2016, 147, 206–225. [Google Scholar] [CrossRef]
  31. Yardeny, I.; Portnikov, D.; Kalman, H. Experimental investigation of the coefficient of restitution of particles colliding with surfaces in air and water. Adv. Powder Technol. 2020, 31, 3747–3759. [Google Scholar] [CrossRef]
  32. Shi, L.; Zhao, W.; Sun, B.; Sun, W.; Zhou, G. Determination and analysis of basic physical and contact mechanics parameters of quinoa seeds by DEM. Int. J. Agric. Biol. Eng. 2023, 16, 35–43. [Google Scholar] [CrossRef]
  33. Zhang, G.; Liu, H.R.; Chi, S.Z.; Tao, J.Y.; Lin, Z. Experimental study of particle collision and rebound with moving walls. Powder Technol. 2024, 433, 119157. [Google Scholar] [CrossRef]
  34. Tomar, V.; Bose, M. Anomalies in normal and oblique collision properties of spherical particles. Powder Technol. 2018, 325, 669–677. [Google Scholar] [CrossRef]
  35. Hlosta, J.; Žurovec, D.; Rozbroj, J.; Ramírez-Gómez, Á.; Nečas, J.; Zegzulka, J. Experimental determination of particle–particle restitution coefficient via double pendulum method. Chem. Eng. Res. Des. 2018, 135, 222–233. [Google Scholar] [CrossRef]
  36. Xu, T.; Yu, J.; Yu, Y.; Wang, Y. A modelling and verification approach for soybean seed particles using the discrete element method. Adv. Powder Technol. 2018, 29, 3274–3290. [Google Scholar] [CrossRef]
  37. Zhang, L.; Zhai, Y.; Chen, J.; Zhang, Z.; Huang, S. Optimization design and performance study of a subsoiler underlying the tea garden subsoiling mechanism based on bionics and EDEM. Soil Tillage Res. 2022, 220, 105375. [Google Scholar] [CrossRef]
  38. Xu, T.; Fu, H.; Liu, M.; Feng, W.; Zhang, R.; Wang, Y.; Wang, J. Ellipsoidal seed modeling and simulation parameter selection based on the discrete element method. Mater. Today Commun. 2023, 37, 106923. [Google Scholar] [CrossRef]
  39. Han, Y.; Jia, F.; Zeng, Y.; Jiang, L.; Zhang, Y.; Cao, B. Effects of rotation speed and outlet opening on particle flow in a vertical rice mill. Powder Technol. 2016, 297, 153–164. [Google Scholar] [CrossRef]
  40. Lu, Z.; Negi, S.C.; Jofriet, J.C. A numerical model for flow of granular materials in silos. Part 1: Model development. J. Agric. Eng. Res. 1997, 68, 223–229. [Google Scholar] [CrossRef]
  41. Vu-Quoc, L.; Zhang, X.; Walton, O.R. A 3-D discrete-element method for dry granular flows of ellipsoidal particles. Comput. Methods Appl. Mech. Eng. 2000, 187, 483–528. [Google Scholar] [CrossRef]
  42. Yan, D.; Yu, J.; Wang, Y.; Zhou, L.; Yu, Y. A general modelling method for soybean seeds based on the discrete element method. Powder Technol. 2020, 372, 212–226. [Google Scholar] [CrossRef]
  43. Yu, Z.; Hu, Z.; Peng, B.; Gu, F.; Yang, L.; Yang, M. Experimental determination of restitution coefficient of garlic bulb based on high-speed photography. Int. J. Agric. Biol. Eng. 2021, 14, 81–90. [Google Scholar] [CrossRef]
  44. Horabik, J.; Beczek, M.; Mazur, R.; Parafiniuk, P.; Ryżak, M.; Molenda, M. Determination of the restitution coefficient of seeds and coefficients of visco-elastic Hertz contact models for DEM simulations. Biosyst. Eng. 2017, 161, 106–119. [Google Scholar] [CrossRef]
  45. Yao, S.; An, S.; Bai, Z.; Chen, S.; Kan, Z.; Meng, H.; Yaping, L. Empirical investigation of parameter impacts on the three-dimensional coefficient of restitution of jujube at the time of harvest. Postharvest Biol. Technol. 2024, 212, 112859. [Google Scholar] [CrossRef]
  46. Yang, Y.; Hou, J.M.; Bai, J.B.; Yao, E.C.; He, T.; Li, J.P. Determination and analysis of typical castor seed collision restitution coefficient. J. China Agric. Univ. 2019, 24, 138–148. [Google Scholar]
  47. Huang, X.; Zha, X.; Pan, H.; Zong, W.; Chen, H. Measurement and analysis of rapeseeds’ restitution coefficient in point-to-plate collision model. Trans. Chin. Soc. Agric. Eng. 2014, 30, 22–29. [Google Scholar]
  48. Ma, Z.; Zhang, Z.; Zhang, Z.; Song, Z.; Liu, Y.; Li, Y.; Xu, L. Durable testing and analysis of a cleaning sieve based on vibration and strain signals. Agriculture 2023, 12, 2232. [Google Scholar] [CrossRef]
Figure 1. Basic Dimensions of Soybeans.
Agriculture 14 01201 g001
Figure 2. Soybean–wall collision platform.
Agriculture 14 01201 g002
Figure 3. Modeling process and physical model of soybeans.
Agriculture 14 01201 g003
Figure 4. Simplified collision platform in EDEM.
Agriculture 14 01201 g004
Figure 5. High-speed image processing flowchart.
Agriculture 14 01201 g005
Figure 6. Images of the soybean colliding with the wall at different times: before (a), during (b), and after (c).
Agriculture 14 01201 g006
Figure 7. Top view of the soybean collision platform.
Agriculture 14 01201 g007
Figure 8. Soybean center of mass position.
Agriculture 14 01201 g008
Figure 9. Schematic diagram of marking method for calculating angular velocity.
Agriculture 14 01201 g009
Figure 10. Force Curve of Soybeans.
Agriculture 14 01201 g010
Figure 11. Energy changes during soybean collision process.
Agriculture 14 01201 g011
Figure 12. Torque and rotational energy of soybeans.
Agriculture 14 01201 g012
Figure 13. Influence of wall movement speed on soybean trajectory.
Agriculture 14 01201 g013
Figure 14. Influence of wall inclination angle on soybean trajectory.
Agriculture 14 01201 g014
Figure 15. Influence of wall inclination angle on soybean angular velocity.
Agriculture 14 01201 g015
Figure 16. Influence of wall speed on soybean angular velocity.
Agriculture 14 01201 g016
Figure 17. Variation of COR with drop height.
Agriculture 14 01201 g017
Figure 18. Variation of COR with wall inclination angle.
Agriculture 14 01201 g018
Figure 19. Variation of COR with wall speed.
Agriculture 14 01201 g019
Figure 20. Rebound height of soybean colliding with stainless steel plate and polyurethane plate.
Agriculture 14 01201 g020
Figure 21. Multi-factor range analysis chart.
Agriculture 14 01201 g021
Table 1. Types and characteristics of coefficient of restitution (COR) measurement devices.
TypeFeaturesApplication Scenario
The flat plate methodThe experimental platform has a simple structure and is easy to operate. It can measure the height of the positions before and after the rebound to calculate the incident and reflection velocities and determine the coefficient of restitution (COR) between the material and the wall.Cao et al. [12] used this method to measure the coefficient of restitution (COR) between rapeseeds and aluminum alloy, acrylic, and high-density polyethylene, providing a basis for selecting DEM simulation parameters.
The string suspension methodTwo lightweight, thin strings, such as fishing lines, are used to connect the two test objects separately. The strings are pulled up to a certain angle and then released, causing the test objects to collide head-on. By recording the rebound angle and height after the collision, the coefficient of restitution (COR) can be determined.Du et al. [13] used this device to measure the coefficient of restitution (COR) between chili peppers and steel plates, rubber plates, and between chili peppers themselves.
The mirror-single camera methodThe mirror and background board are arranged at a certain angle. Using the principle of specular reflection, the three-dimensional motion trajectory of the colliding objects can be captured within the same camera view. This allows for the accurate determination of parameters such as velocity and the coefficient of restitution (COR).Wu et al. [14] used this device to study the effects of ripening time, collision velocity, and fruit collision posture on the coefficient of restitution (COR).
The dual-camera methodTwo high-speed cameras are used and arranged perpendicular to each other to accurately record the motion trajectory of the objects. This method provides the most accurate recording, but it requires higher standards for the experimental equipment and environment.Zhang et al. [15] used this device to study the effects of collision material, moisture content, length, diameter, release height, and collision angle on the coefficient of restitution (COR) of cotton stalks. They also established a regression model between the influencing factors and the COR.
Table 2. Triaxial dimensional ranges and averages of experimental soybeans.
GroupLength Range
(mm)
Width Range
(mm)
Thickness Range (mm)
17.16–9.417.37–8.426.31–7.24
27.03–9.767.26–8.656.23–7.35
36.84–9.627.17–8.386.17–7.50
Average8.577.736.61
Table 3. Physical and mechanical parameters for EDEM simulation of soybean–wall collisions.
Types of MaterialsPoisson’s RatioDensity (kg·m−3)Shear Modulus (Pa)Coefficient of RestitutionStatic FrictionRolling Friction
Soybean0.412617.6 × 1080.540.20.02
Stainless steel plate0.378507.9 × 10110.6470.2590.02
Polyurethane plate0.4913001.5 × 1090.390.50.1
Table 4. Orthogonal experimental table.
Serial NumberDrop Height
(mm)
Wall Inclination Angle (°)Wall Speed
(m/s)
Wall MaterialBlankCOR
145090.7120.6450
2450100.9210.4782
3450111120.6739
4450120.8210.5512
550090.8110.6356
6500101220.4815
7500110.9110.6649
8500120.7220.5421
955090.9210.4157
10550100.7120.6423
11550110.8220.5269
12550121110.7010
1360091210.3278
14600100.8110.6651
15600110.7220.5327
16600120.9120.6819
k10.5870750.5060250.5905250.66371250.554938
k20.5810250.5667750.5947000.48201250.590788
k30.5714750.5996000.560175
k40.5518750.6190500.546050
R0.03520.1130250.048650.18170.03585
Order of Importance of FactorsWall Material > Wall Inclination Angle > Wall Speed > Drop Height
Table 5. Analysis of variance (ANOVA) for the effect of experimental factors on soybean collision dynamics.
Source of VariationSum of SquaresDegrees of FreedomMean SquareF-Valuep-ValueSignificance
Drop Height0.00330.0010.8350.529
Wall Inclination Angle0.02930.0108.6400.020*
Wall Speed0.00730.0021.9610.238
Wall Material0.13210.132116.3840.000**
Error0.00650.001
Total5.42716
Corrected Total0.17715
R2 = 0.968 (Adjusted R2 = 0.904)
Note: p < 0.01 (Extremely significant, **), p < 0.05 (Significant, *).
Disclaimer/Publisher’s Note: The statements, opinions and data contained in all publications are solely those of the individual author(s) and contributor(s) and not of MDPI and/or the editor(s). MDPI and/or the editor(s) disclaim responsibility for any injury to people or property resulting from any ideas, methods, instructions or products referred to in the content.

