Abstract
Most of the current crop row detection algorithms focus on extracting crop canopy rows as location information. However, for some high-pole crops, due to the transverse deviation of the position of the canopy and roots, the agricultural machinery can easily cause the wheel to crush the crop when it is automatically driven. In fact, it is more accurate to use the crop root row as the feature for its location calibration, so a method of crop root row detection is proposed in this paper. Firstly, the ROI (region of interest) of the crop canopy is extracted by a semantic segmentation algorithm, then crop canopy row detection lines are extracted by the horizontal strip division and the midpoint clustering method within the ROI. Next, the Crop Root Representation Learning Model learns the Representation of the crop canopy row and crop root row to obtain the Alignment Equation. Finally, the crop canopy row detection lines are modified according to the Alignment Equation parameters to obtain crop root row detection lines. The average processing time of a single frame image (960 × 540 pix) is 30.49 ms, and the accuracy is 97.1%. The research has important guiding significance for the intelligent navigation, tilling, and fertilization operation of agricultural machinery.
1. Introduction
Among the three major cereals in the world, the total output and average yield of maize are ranked first in the world. In recent years, the smart agricultural technology of maize has attracted people’s attention. The core of smart agriculture is to precisely control actual agricultural production through a computer platform with the help of tools such as sensors and software. The development of smart agriculture is expected to significantly reduce the cost of human resources, improve agricultural production efficiency, so as to achieve the goal of agricultural intelligence [1,2,3]. According to the characteristics of field crop planting in rows, it is necessary to carry out row-based operations in field management and harvesting. How to realize intelligent row-based operations of agricultural machinery is a key step for agriculture to become intelligent. During unmanned field operations, a GNSS (Global Navigation Satellite System) is used to pre-plan the global field paths, and attitude sensors and the GNSS are used to obtain the position of agricultural machinery, so as to adjust its direction and speed in real time [4,5,6]. However, this method is difficult to apply to the field management and row operations during the harvest period. The main reasons can be summarized as follows: (1) GNSS navigation generally lacks a field environment perception module, which cannot accurately locate the position of crop rows in the field in real time. (2) The pre-planned global path is an ideal path that deviates from the actual path to a certain extent. In recent years, machine vision has attracted more and more attention due to its low computing cost and good applicability, which is widely used in field crop rows detection tasks in order to realize field intelligent row operation [7,8,9,10,11,12]. The core technology is to capture real-time farmland images by equipping a camera in front of the agricultural machinery vehicles, and using computer vision algorithms to detect crop rows, so as to plan the working position of agricultural machinery in crop rows and avoid mechanical damage to the crop roots caused by wheels. Crop rows detection algorithms based on machine vision are currently making significant progress, which can be summarized into the following main categories.
Detection methods based on the Hough transform: The Hough transform [13] is one of the most commonly used methods for detecting straight lines in digital image processing. However, its accuracy and real-time performance are usually poor when detecting crop rows in the field. Therefore, some scholars have made various improvements based on the Hough transform. Bakker [14] first segmented crops and soil into gray maps and divided them into three parts. Then a Hough transform is calculated for each part and the results of these three parts are recombined. Ji [15] proposed a crop rows detection algorithm based on a stochastic gradient-based Hough transform and the many-to-one combined mapping method, which can improve the detection speed compared with the traditional Hough transform method. Winterhalter [16] proposed a reliable plant segmentation pipeline algorithm and Hough transform for line detection to detect parallel isometric lines, suitable for the detection of micro-crops. Chen [17] proposed a method to detect a crop row based on an automatic Hough transform cumulative threshold. The linear fitting method is used to accumulate plane clustering under the optimal accumulation threshold and the centroid of the crop line is used as a fitting line. In general, the Hough transform is not superior in a field environment with high real-time requirements and complex field conditions. Factors such as crop growth state, planting density, and root structure will lead to a large amount of interference information in the image, which reduces the accuracy of the Hough transform. The mutual occlusion between crops and the divergent nature of canopy leaves also increases the difficulty of the Hough transform detection method.
A detection method based on the vanishing point: Pla [18] proposed an algorithm to extract the number of crop rows by finding the vanishing point. The method involves the segmentation of color images, the adoption of the dichroic reflection model, the extraction of the skeleton of crop rows, and then it detects the straight line from the skeleton curve and tracks the vanishing point. Jiang [19] proposed a simple and effective wheat crop rows detection algorithm that uses K-means clustering to find the cluster center representing the vanishing point to finally extract the real crop rows based on the vanishing point. Li [20], using the combination of line mask scanning and the crop row vanishing point, identified each individual area in the crop row, so that the crop row detection line is further extracted. The approach consisted of grayscale transformation, vanishing point detection, crop region identification, boundary position fine-tuning, and crop region segmentation. The core requirement based on the vanishing point is to extract crop row features as general as possible in the image. Therefore, it is difficult to generalize this method when dealing with complex farmland scene images, and the real-time performance of the disappearing point-based algorithm is always a problem that needs to be solved.
A detection method based on ROI extraction: The core of this method is to extract the ROI region and test crop rows within the ROI region. Montalvo [21] detected crop rows with high weed stress successfully by determining the ROI of images using the least squares method. Yang [22] proposed an algorithm in which the dynamic ROI is determined by the static ROI and a feature point clustering algorithm is used to fit the recognition line of maize crop rows within the ROI. Zhou [23] adopted a detection method based on multiple area of interest (ROIs) regions, in which the feature points are determined according to the vertical projection method within the ROI and the detection lines of crop rows are obtained by fitting the least squares method. Yang [24] also adopted an extraction method based on multiple regions of interest (ROIs), but it transformed the image to an HSV (Hue, Saturation, Value) channel and divided the maize male ear and soil background by the OSTU method, which could detect the middle and late crop rows. The detection method based on ROI extraction can not only improve the detection speed but also exclude the influence of a non-detected region. However, this method relies too much on the prior information of the previous frame image, and its performance is poor when dealing with some sudden situations.
Detection methods based on deep learning: In the past decade, deep neural networks have developed rapidly, and their strong performance has attracted a lot of scholars’ attention. At present, they also have good applications in the field of crop rows detection. Lin [25] trained the ENet semantic segmentation model, realized the pixel-level automatic classification of tea rows, land background and people, and developed the navigation system of tea pickers. Ponnambalam [26] used convolutional neural networks to segment crops and the soil region, further accurately extracting feature points and simulating the detection line of objects. Pang [27] designed the MaxArea Mask Scoring RCNN algorithm, which can divide crop rows in each patch image. Instead of detecting individual crops in a row, the whole row of crops can be processed at a time. Yang [28] extracted the region of interest through a YOLOV5 neural network prediction framework, and extracted simulated cooperative objects of feature points through FAST corner detection. Although the deep learning method needs to build a huge database for training and verification, as well as needing a large amount of computer resources, it improves the performance of crop rows detection and attracts a large number of scholars to carry out research.
To summarize the above work, it can be seen that progress has been made regarding the current research of crop rows inspection based on machine vision, but there are some important challenges and problems to be solved. It should be noted that the current crop rows detection is mainly based on the results of crop canopy detection, and the crop canopy rows detection lines are regarded as the crop rows detection lines, to guide the agricultural machinery to carry out intelligent row-based operation in the field. However, this method can easily cause the wheel to crush the roots in the experiment, so this method is not a rigorous method. In fact, there is a big difference between the crop canopy row and the crop root row. The crop root row is a better representation of the true position of the crop row. It can provide guidance for field intelligent row-based operation of agricultural machinery, such as tilling, fertilization, field navigation, etc. However, since the field is densely planted with crops, there are still problems such as canopy leaf cross and divergence in the middle and late periods, which cause the crop roots to be sheltered so they cannot be detected directly. Crop root rows extraction is still a difficult operation. Therefore, this paper hopes to explore the relative position relationship between crop canopy rows and crop root rows, and to accurately predict crop root rows’ detection lines based on crop canopy rows’ detection lines.
The study has several hypotheses:
- (1)
- It is assumed that for high-stalk crops such as corn, the canopy will tilt during the growth process, and there will be lateral errors between canopy and root.
- (2)
- It is assumed that manually calibrated crop root rows accurately represent the location of crop root rows.
- (3)
- It is assumed that the method in this paper can be applied to other types of tall stalk crops.
The main contributions of this paper are as follows:
- (1)
- The paper constructed a multi-period maize crop dataset, MaizeImageset, based on the RGB industrial cameras, and verified that the algorithm proposed in this paper could realize efficient crop root row detection within a complex field environment.
- (2)
- A Crop Root Representation Learning Model is proposed, which can learn the relative position relationship between the crop canopy rows and the crop root rows.
- (3)
- In the case of extremely serious crop obstacles, the paper has successfully achieved rapid and accurate detection of crop root rows, providing strong guidance for field navigation line extraction, tilling, fertilization, and other operations.
2. Materials and Methods
2.1. Overview of Method
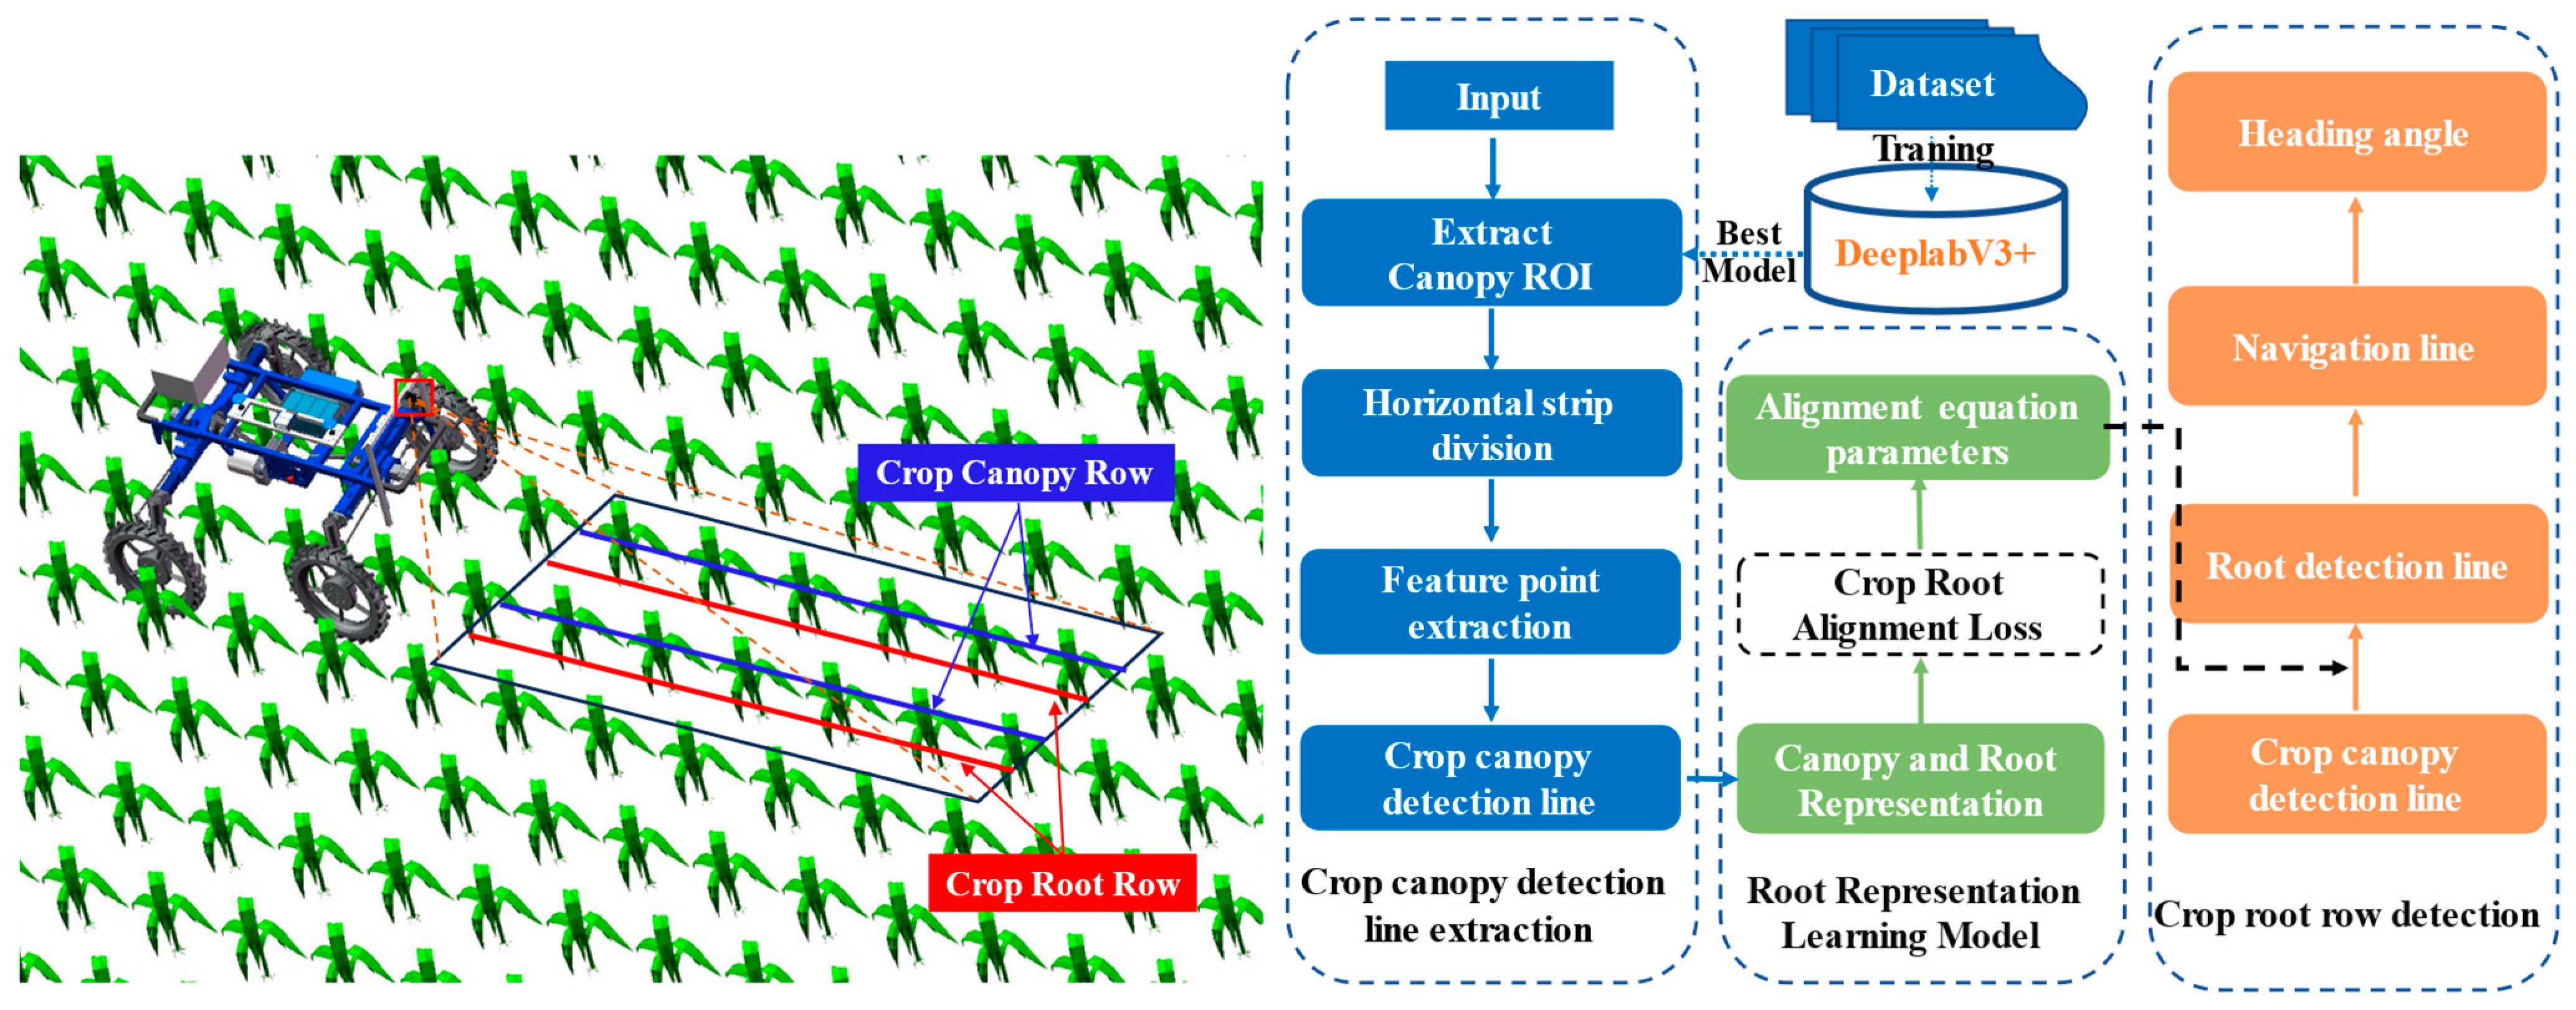
The specific flow of the algorithm in this paper is shown in Figure 1. The algorithm consists of the following steps:
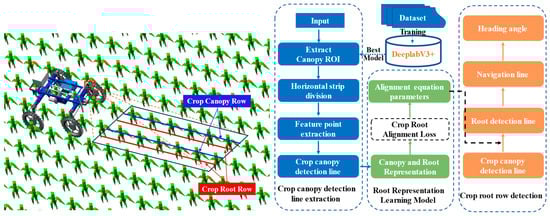
Figure 1.
Overall flowchart.
- (1)
- The improved DeeplabV3+ model trained the annotated dataset to obtain the optimal model, and used the optimal model to predict the crop canopy ROI of the input image. Horizontal strip division was carried out in the ROI region to further extract the canopy feature points, and the crop canopy row detection line was fitted according to the crop canopy feature points.
- (2)
- The Crop Root Representation Learning Model learned the Representations of the crop canopy row and crop root row, and obtained the parameters of the Alignment Equation.
- (3)
- The crop root row detection line was extracted based on the crop canopy row detection line and the Alignment Equation parameters, so that the navigation line and heading angle can be further determined.
2.2. Maize Fields Information Acquisition
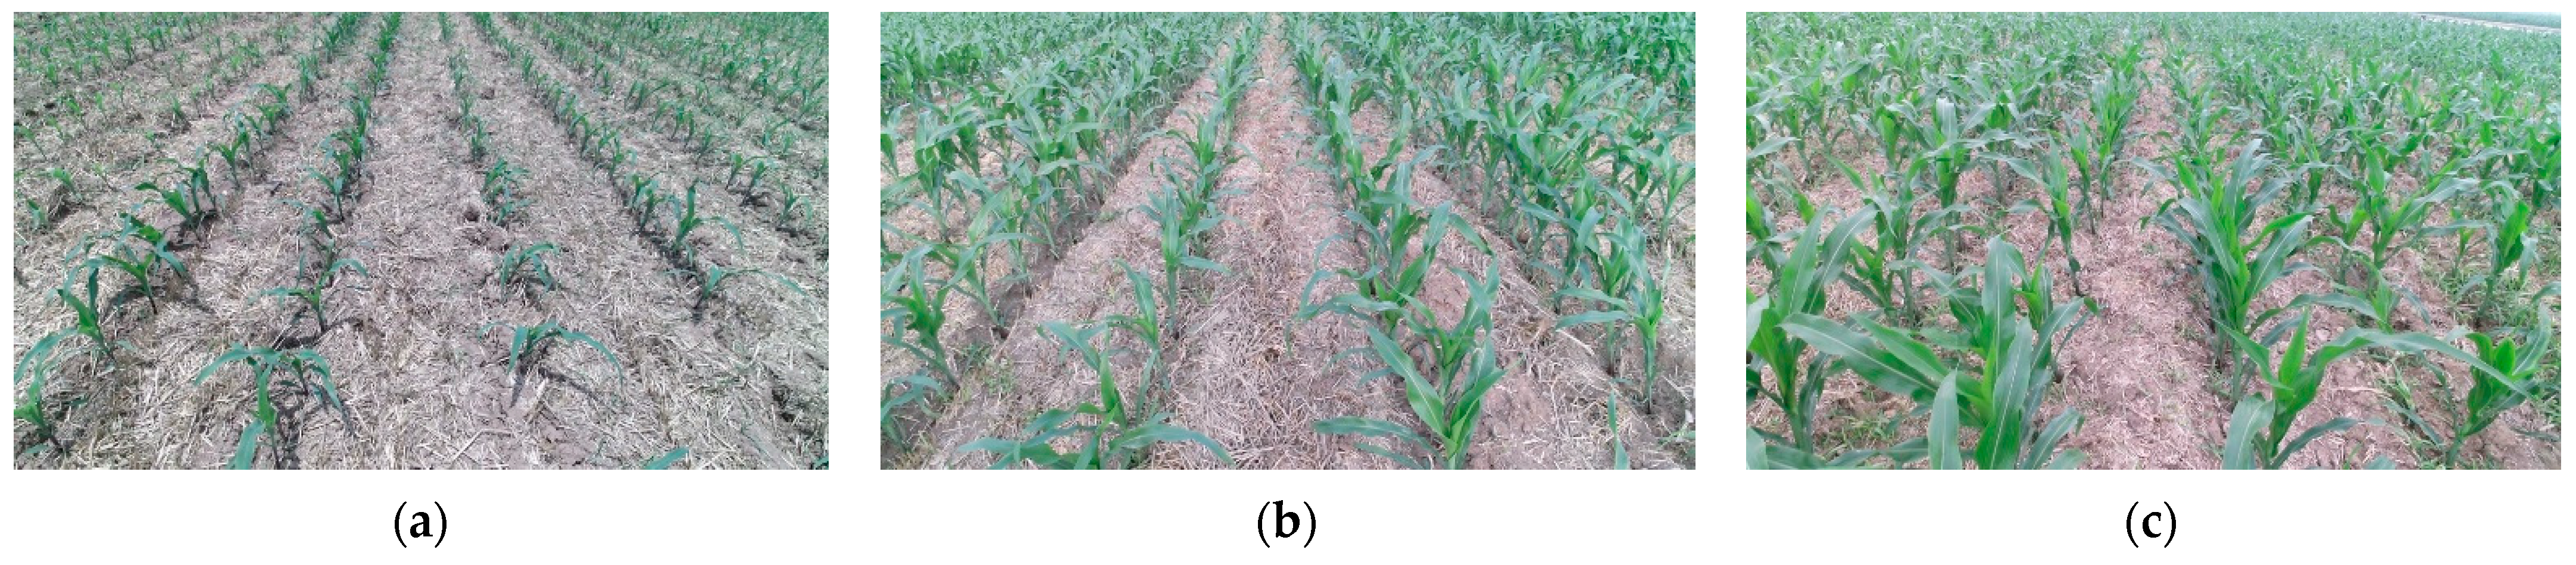
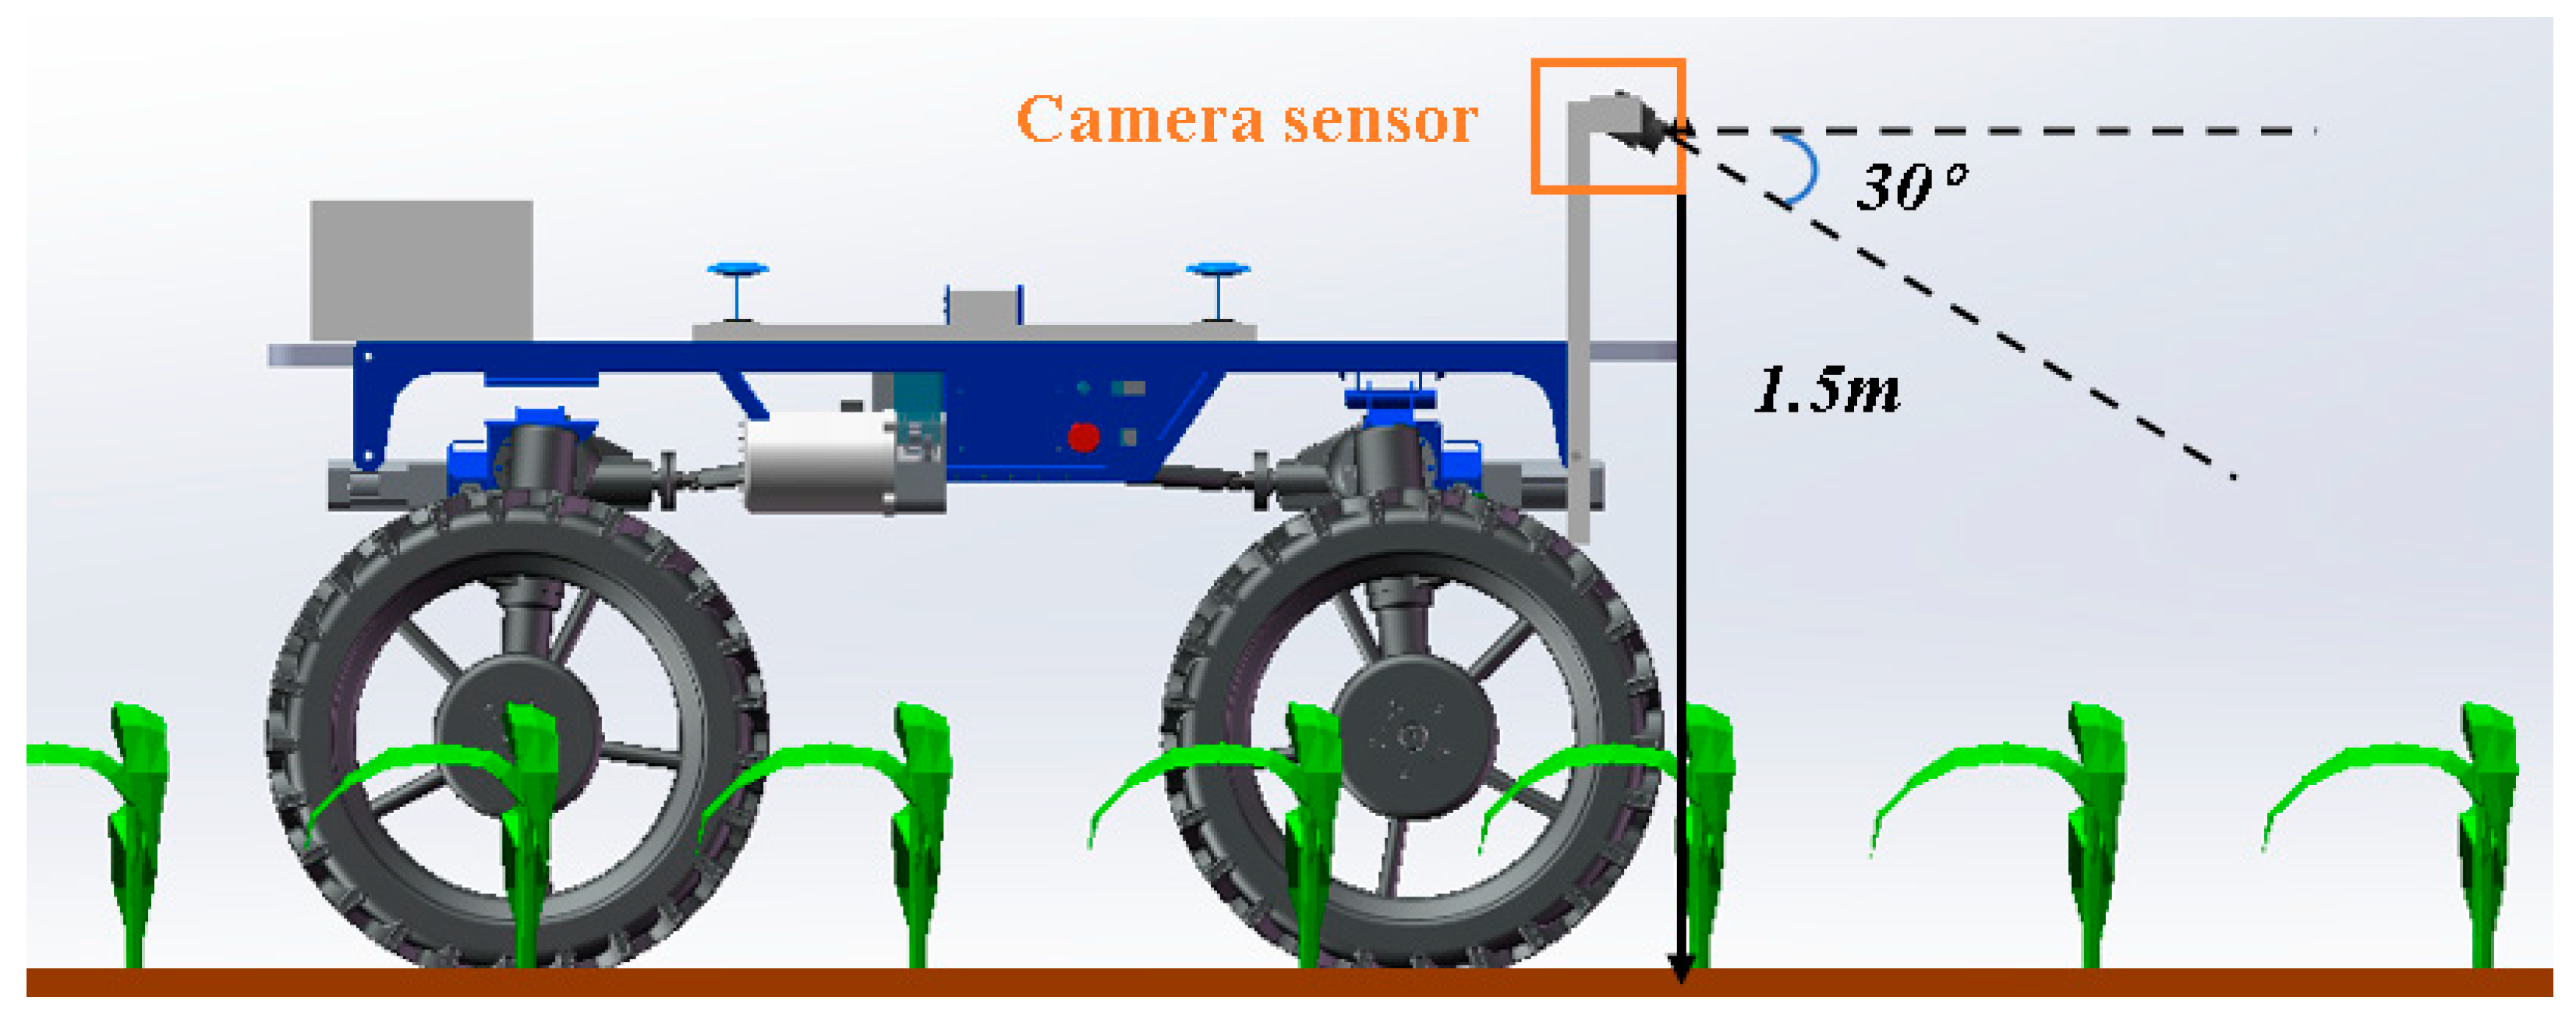
Based on the machine vision sensor, the paper builds the MaizeImageset image database, which contains 6000 images and covers the rows’ image information of maize crops in the early, middle, and late periods. This database includes complex situations like high weed pressure, strong wind, crop row break areas, and severe canopy occlusion, as shown in Figure 2. The addresses of the MaizeImageset database are in the Anhui North Comprehensive Experimental Station of Anhui Agricultural University, Huigu Town, Yongqiao District, Suzhou City, Anhui Province (117°28′ E, 31°52′ N). As shown in Figure 3, the image acquisition equipment adopted a CMOS machine vision camera with an image resolution of 1920 × 1080 pixels, a video frame rate of 12 frames/s, and a video format of AVI. The camera was installed at a vertical height of 1.5 m from the ground, and the tilt angle was 30°. The images were taken on 2 July 2019 (Period I, average height 30 cm, light intensity 37,600 LX), 8 July 2019 (Period II, average height 60 cm, light intensity 102,300 LX) and 14 July 2019 (Period III, average height 90 cm, light intensity 149,200 LX). The spacing between maize rows was 60 cm, and the planting density was 27,200 plants/acre. The variety was Wanhuaiyu No. 6. The soil in the planting area was brown loam and the climate was a temperate monsoon climate.
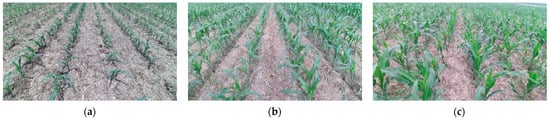
Figure 2.
Image acquisition in three periods: (a) Period-I image; (b) Period-II image; (c) Period-III image.
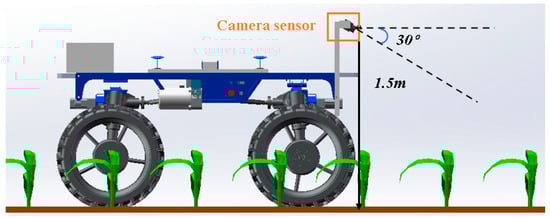
Figure 3.
Image acquisition device.
The algorithm proposed in this paper was implemented based on Python 3.9, and the Python compiler was Pycharm Community Edition 2022. The data processing machine was equipped with an Intel Core i7-12900k processor(Intel, Santa Clara, CA, USA), 2.70 GHz, 64 GB of memory, 64-bit operating system, and an NVIDIA GeForce RTX 3090 (24 G) graphics card (NVIDIA, Santa Clara, CA, USA).
2.3. Dataset
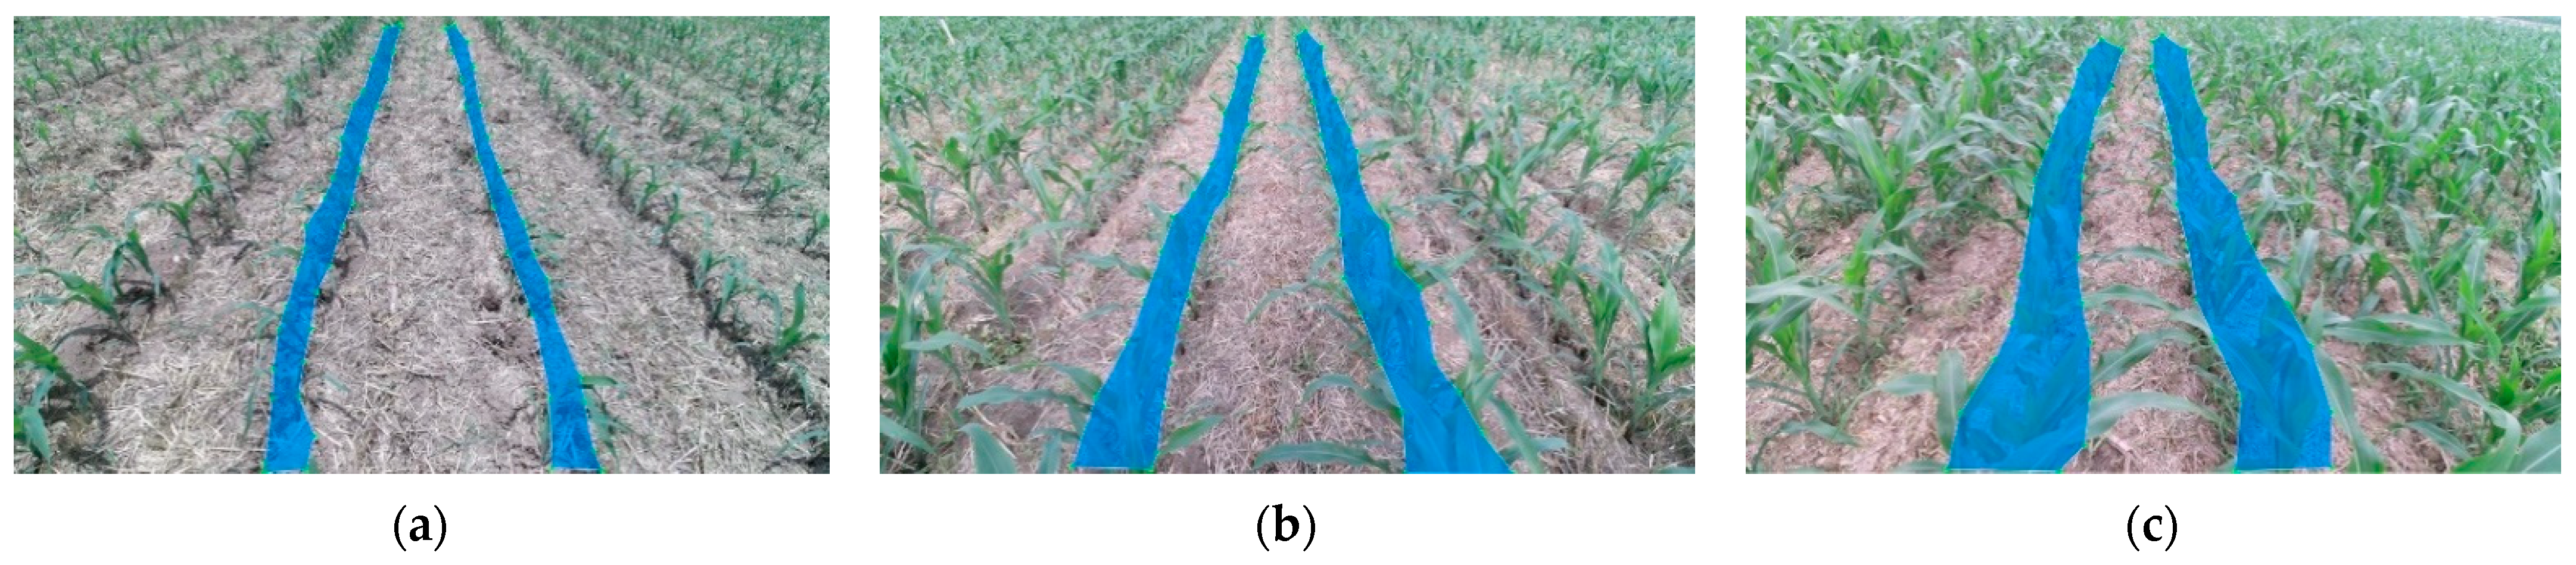
Through the field shooting of the vehicle sensor, it was found that the leaves of the crop canopy were divergent, crossed, and asymmetrical, which causes great interference to the extraction of the crop canopy row detection line. Therefore, in the process of making the semantic segmentation dataset, the paper focused on the pixel markers of the ROI (region of interest) within the corn canopy; that is, removing the divergent and intersecting leaf pixels and preserving the central connected region of the maize canopy. At the same time, for field row operations and navigation operations, the crop row detection in the center area of the agricultural machinery was mainly relied on, and the crop row detection at the image boundary was of little help, so this paper marked the central connectivity area of the two crop canopy rows in the middle area, as shown in Figure 4. The annotation results were output in JSON file format, which contains the annotation information of 6000 images. In this paper, the 6000 images were artificially culled for both the fallen crops and the ones that received the verdict of destruction.
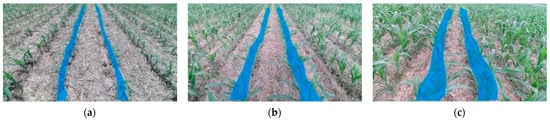
Figure 4.
Maize crop canopy ROI labeling: (a) Period-I labeling; (b) Period-II labeling; (c) Period-III labeling.
Having only a 6000-image dataset is typically insufficient for deep neural network training, which can easily result in overfitting and robustness problems. Therefore, the paper used the Augmentor data enhancement library for data enhancement, which includes random flipping, random image rotation (rotation angle: 0–25°), random scaling (zoom ratio: 0.3–2 times), random brightness change (variation range: 0.5–1.5 times), and random saturation change (variation range: 0.4–1.6 times). The paper expanded the dataset through data enhancement to 60,000 images, which significantly decreases the sensitivity of the neural network to the input and increases generalization capacity. Finally, the paper divided the dataset randomly into a training set and a test set in a ratio of 7:3 for the training of deep neural networks in order to ensure the reliability of training.
2.4. Autonomous Extract Canopy ROI Based on Semantic Segmentation
The core of this paper aimed to locate the crop root row detection line based on the crop canopy row detection and Crop Root Representation Learning Model. Firstly, the canopy region of interest was extracted by using a semantic segmentation algorithm. Then, the canopy feature points were extracted in the region of interest to fit the canopy row detection line.
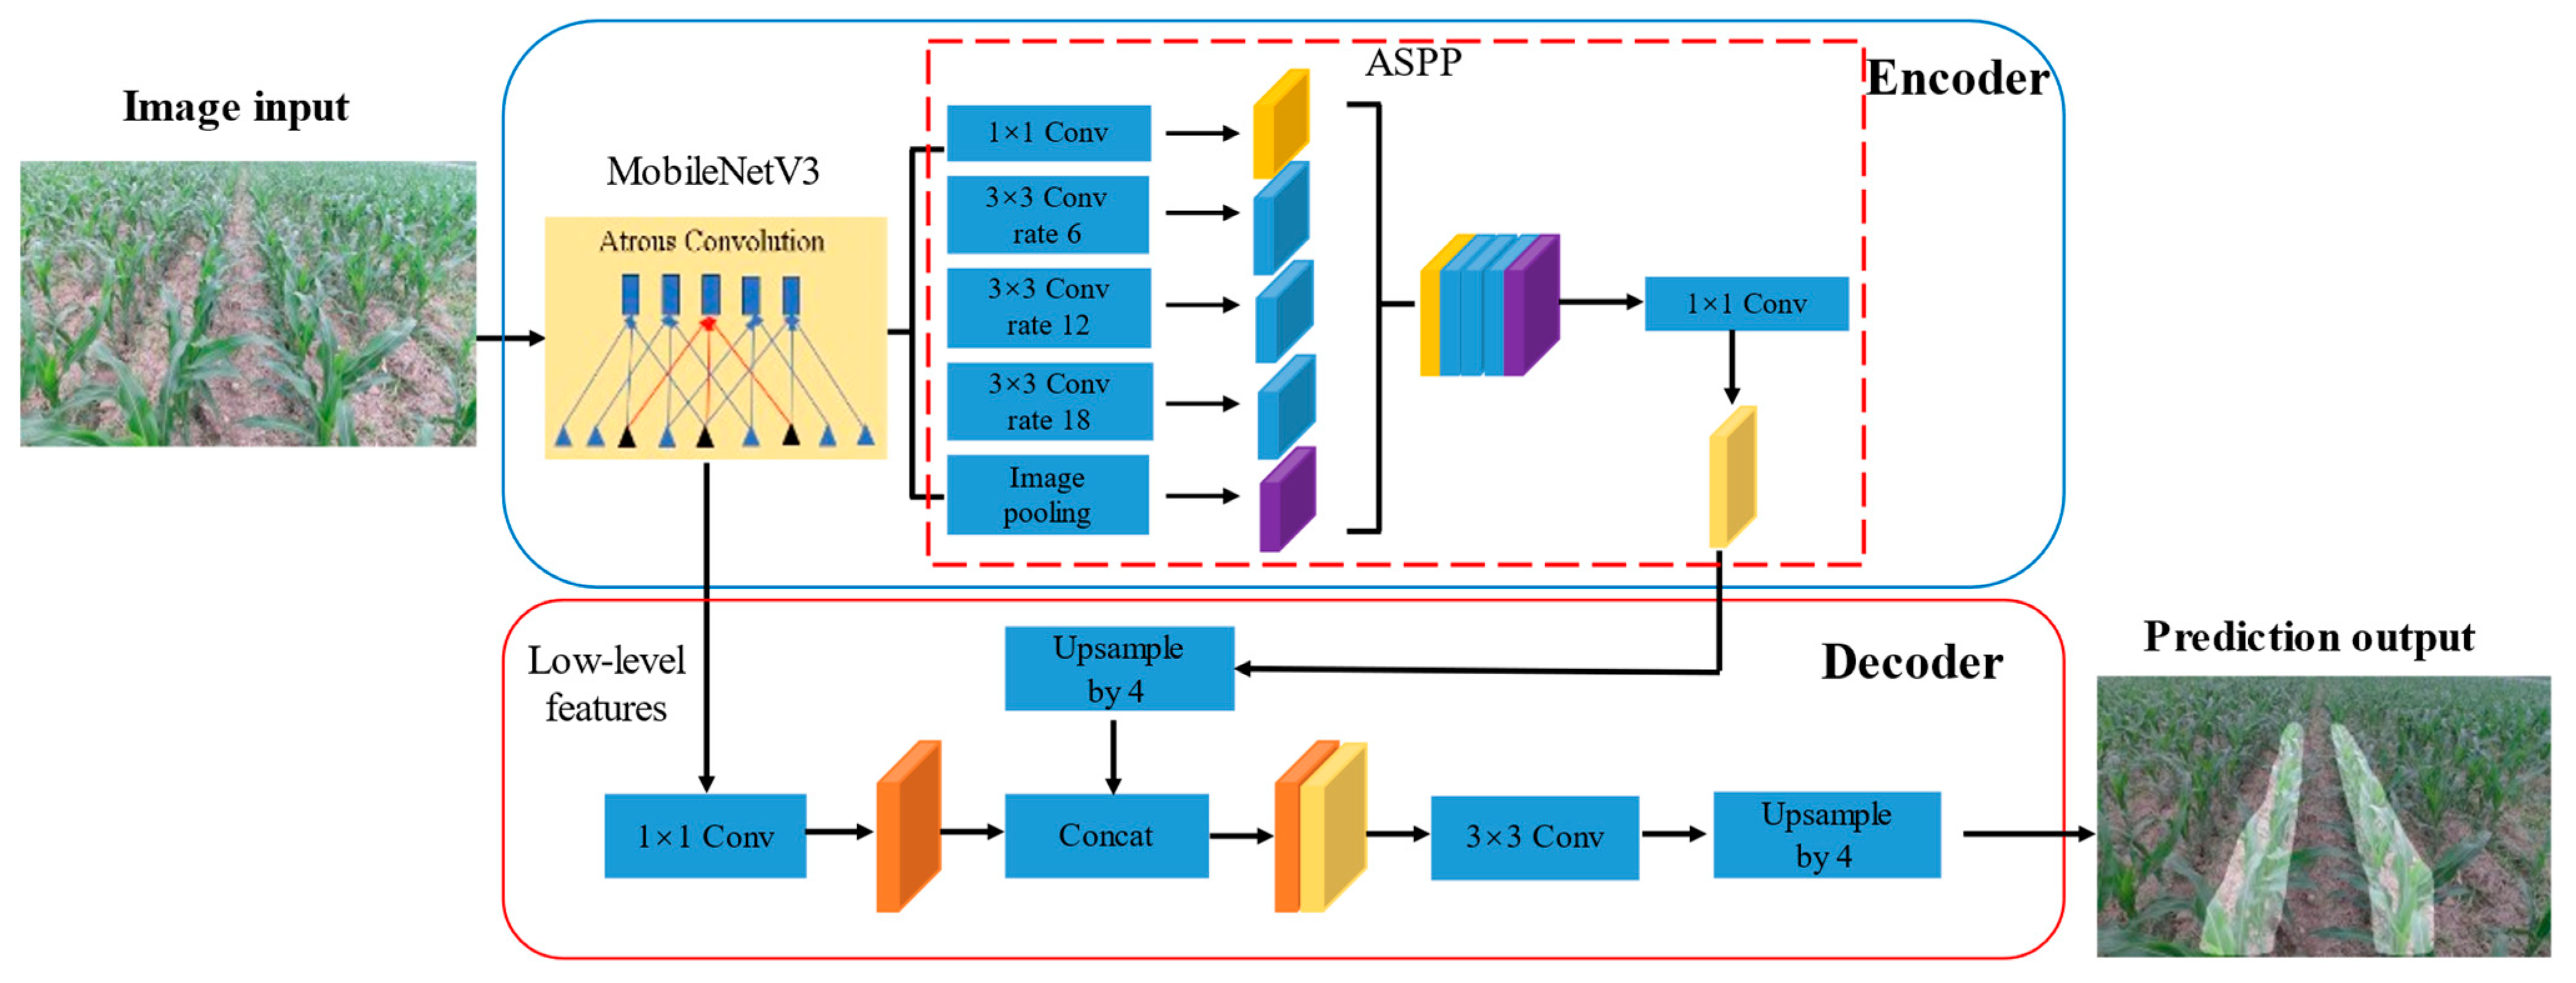
DeepplabV3+ [29] is a classic semantic segmentation deep neural network, widely used in agriculture, industry, medicine, and many other research fields [30,31,32,33,34]. DeepplabV3+ combines the advantages of Encoder–Decoder and ASPP [35] modules to effectively integrate shallow feature information and deep feature information, so as to obtain richer semantic and spatial information and segment target boundaries more clearly. However, it has some problems such as a complex structure, many parameters, and a long reasoning time. Therefore, this paper replaced Xception [36] of the original backbone feature extraction network of DeeplabV3+ with Mobilenetv3 [37] to obtain a lightweight semantic segmentation network, as shown in Figure 5. This network has an advantage in detection speed while meeting the requirements for canopy ROI extraction.
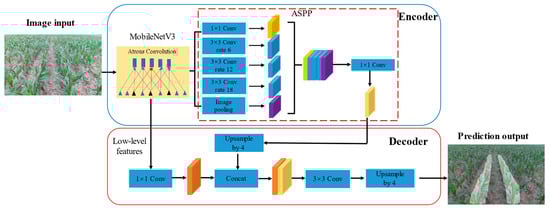
Figure 5.
Lightweight semantic segmentation network based on the DeeplabV3+ neural network.
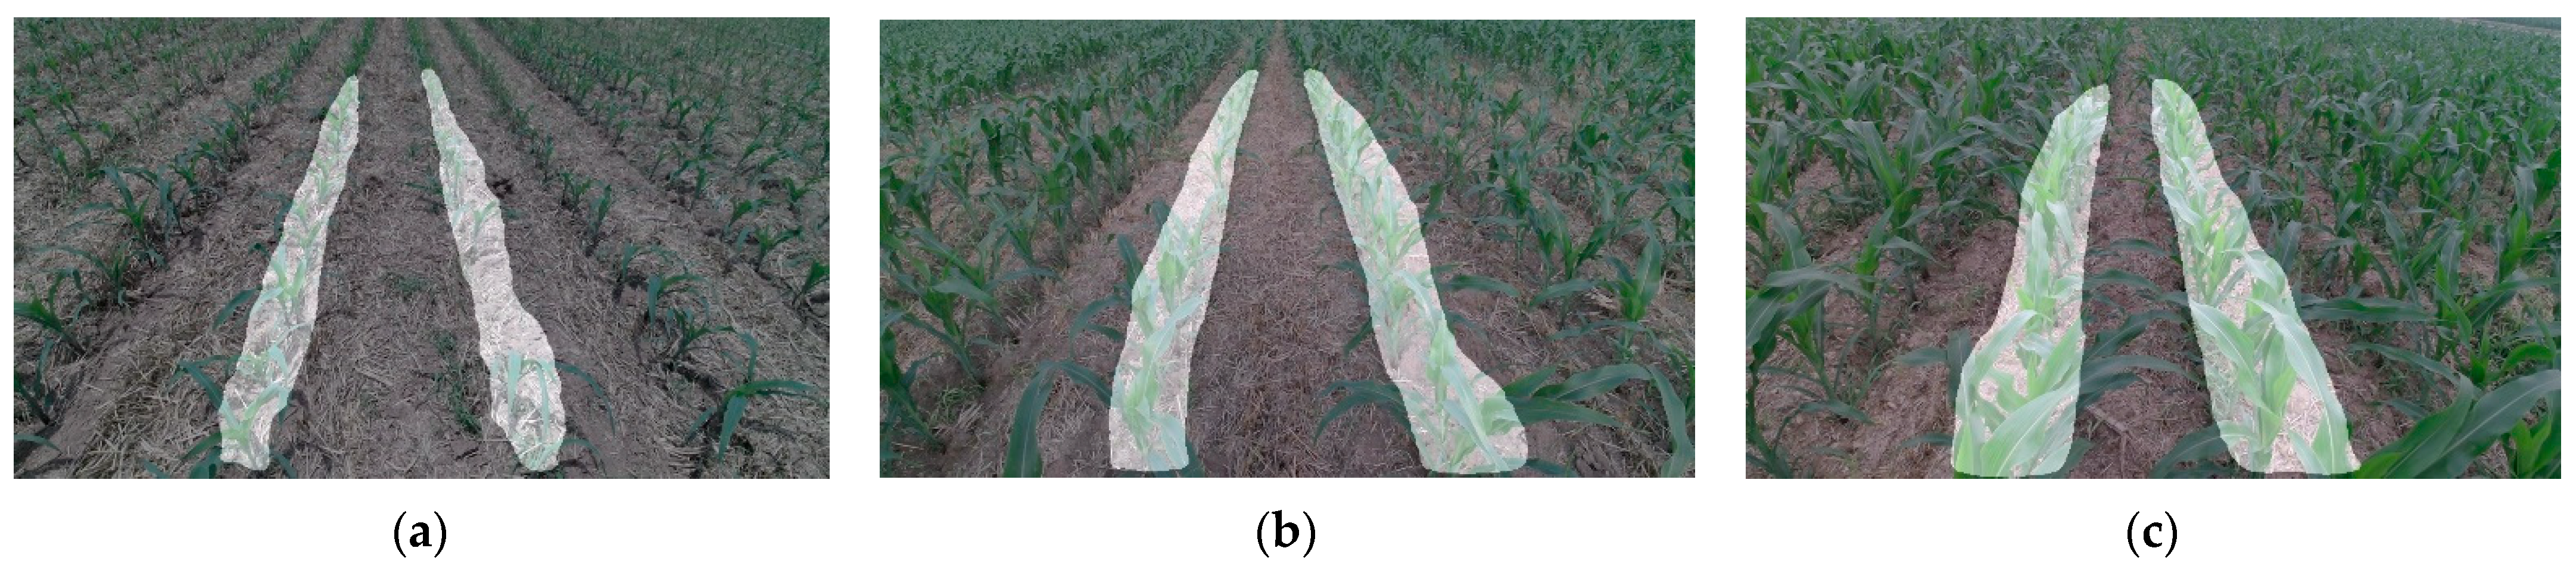
The canopy ROI extraction results of the lightweight semantic segmentation network based on Deeplabv3+ proposed in this paper are shown in Figure 6.
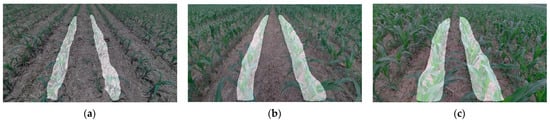
Figure 6.
Semantic segmentation neural network inference results of canopy ROI: (a) ROI extraction for Period-I; (b) ROI extraction for Period-II; (c) ROI extraction for Period-III.
2.5. Model Training and Parameters Setting
2.5.1. Parameters Setting
In this paper, the PASCAL VOC data pre-training model was adopted to initialize the network parameters. The model optimizer used was Adam and the Loss function used was Cross-Entropy loss. The decay rate was 0.1, the training batch size was set to 32, the number of training iterations was 400. The first 200 was the frozen stage, the learning rate of the model was 5 × 10⁻⁴. The last 200 times was the unfrozen stage; at this time, the learning rate was reduced to 5 × 10⁻⁵ to prevent unstable network convergence.
2.5.2. Evaluation Criteria
In order to accurately test the effect of the improved lightweight semantic segmentation neural network on the segmentation of the ROI of maize canopy and background, this paper used the pixel accuracy rate (PA), the intersection of the true value and predicted value of pixels divided by the union of the true value and predicted value of pixels (IOU), and the mean value of all classes of IOU (MIOU) for evaluation. The calculation is as seen in Equations (1)–(3).
In the equation above, represents the total number of pixels predicted correctly. The equation represents the total number of pixels. True positives (TPs) represent positive samples that the model predicts to be positive. False positives (FPs) represent negative samples that the model predicts to be positive. FNs (False negatives) represent positive samples that the model predicts to be negative. N + 1 is the number of sample categories (including background categories).
2.5.3. Optimal Model Selection
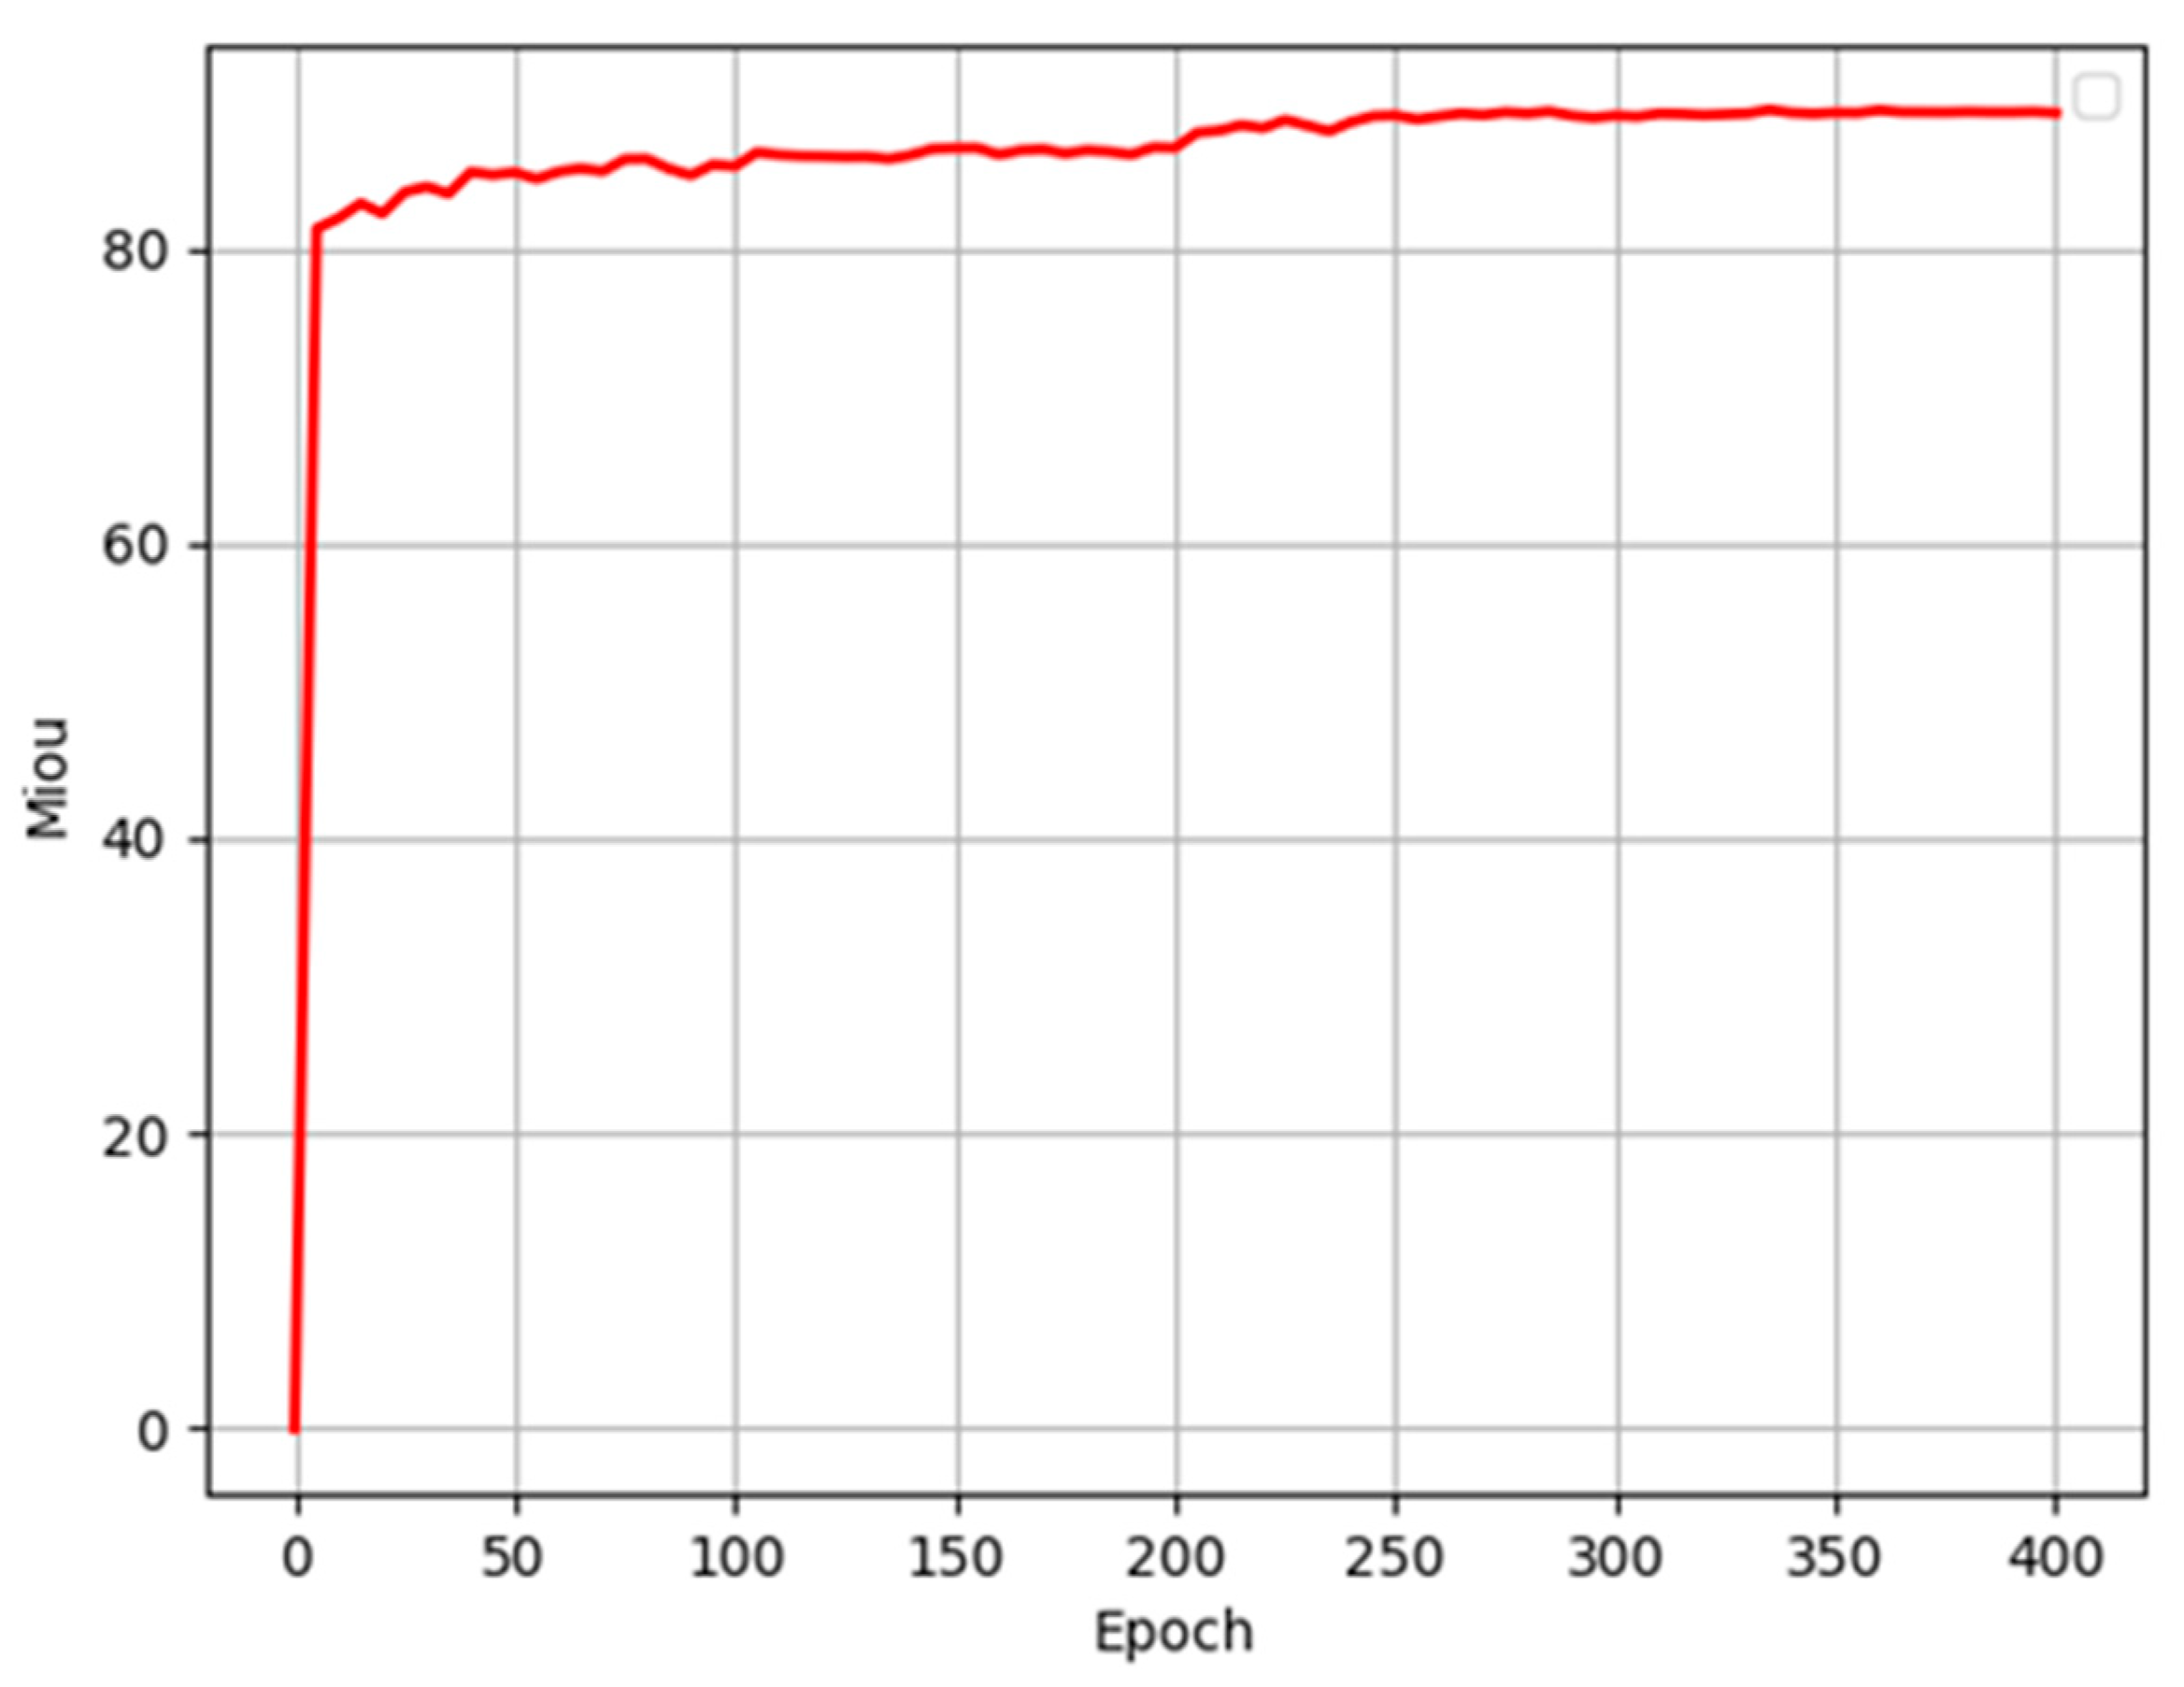
It is not true that the more iterations of training, the better the effect will be on the training process of deep learning neural networks. Even the iterations after the model reaches stability will lead to overfitting of the model. Therefore, the optimal model should be selected according to the evaluation criteria and tested on the test set after training. It can be observed from the MIOU training curve in Figure 7 that the model tends to stabilize after 250 rounds of training and reaches a maximum MIOU value of 91.12% at the 340th round. Therefore, the training model at this time was used as the optimal model for subsequent result output.
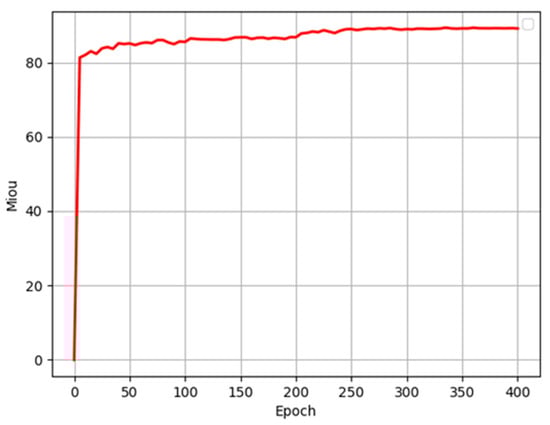
Figure 7.
Semantic segmentation neural network training.
2.6. Extract Canopy Row Detection Lines
The complexity of the field environment is often accompanied by a variety of interference factors, such as weeds, straw, and maize leaf spreading, which bring significant challenges to image processing. Usually, methods such as morphological dilation and corrosion are widely used in order to remove these noises. However, these processing methods may introduce information loss, which can lead to bias in the final result.
The study extracted crop canopy ROI through lightweight semantic segmentation neural network, effectively removing all kinds of noise interference. Therefore, without morphological processing, the feature points of crop canopy can be extracted by horizontal strip division and midpoint clustering method, and then fit to the canopy row detection lines.
2.6.1. Image Band Division
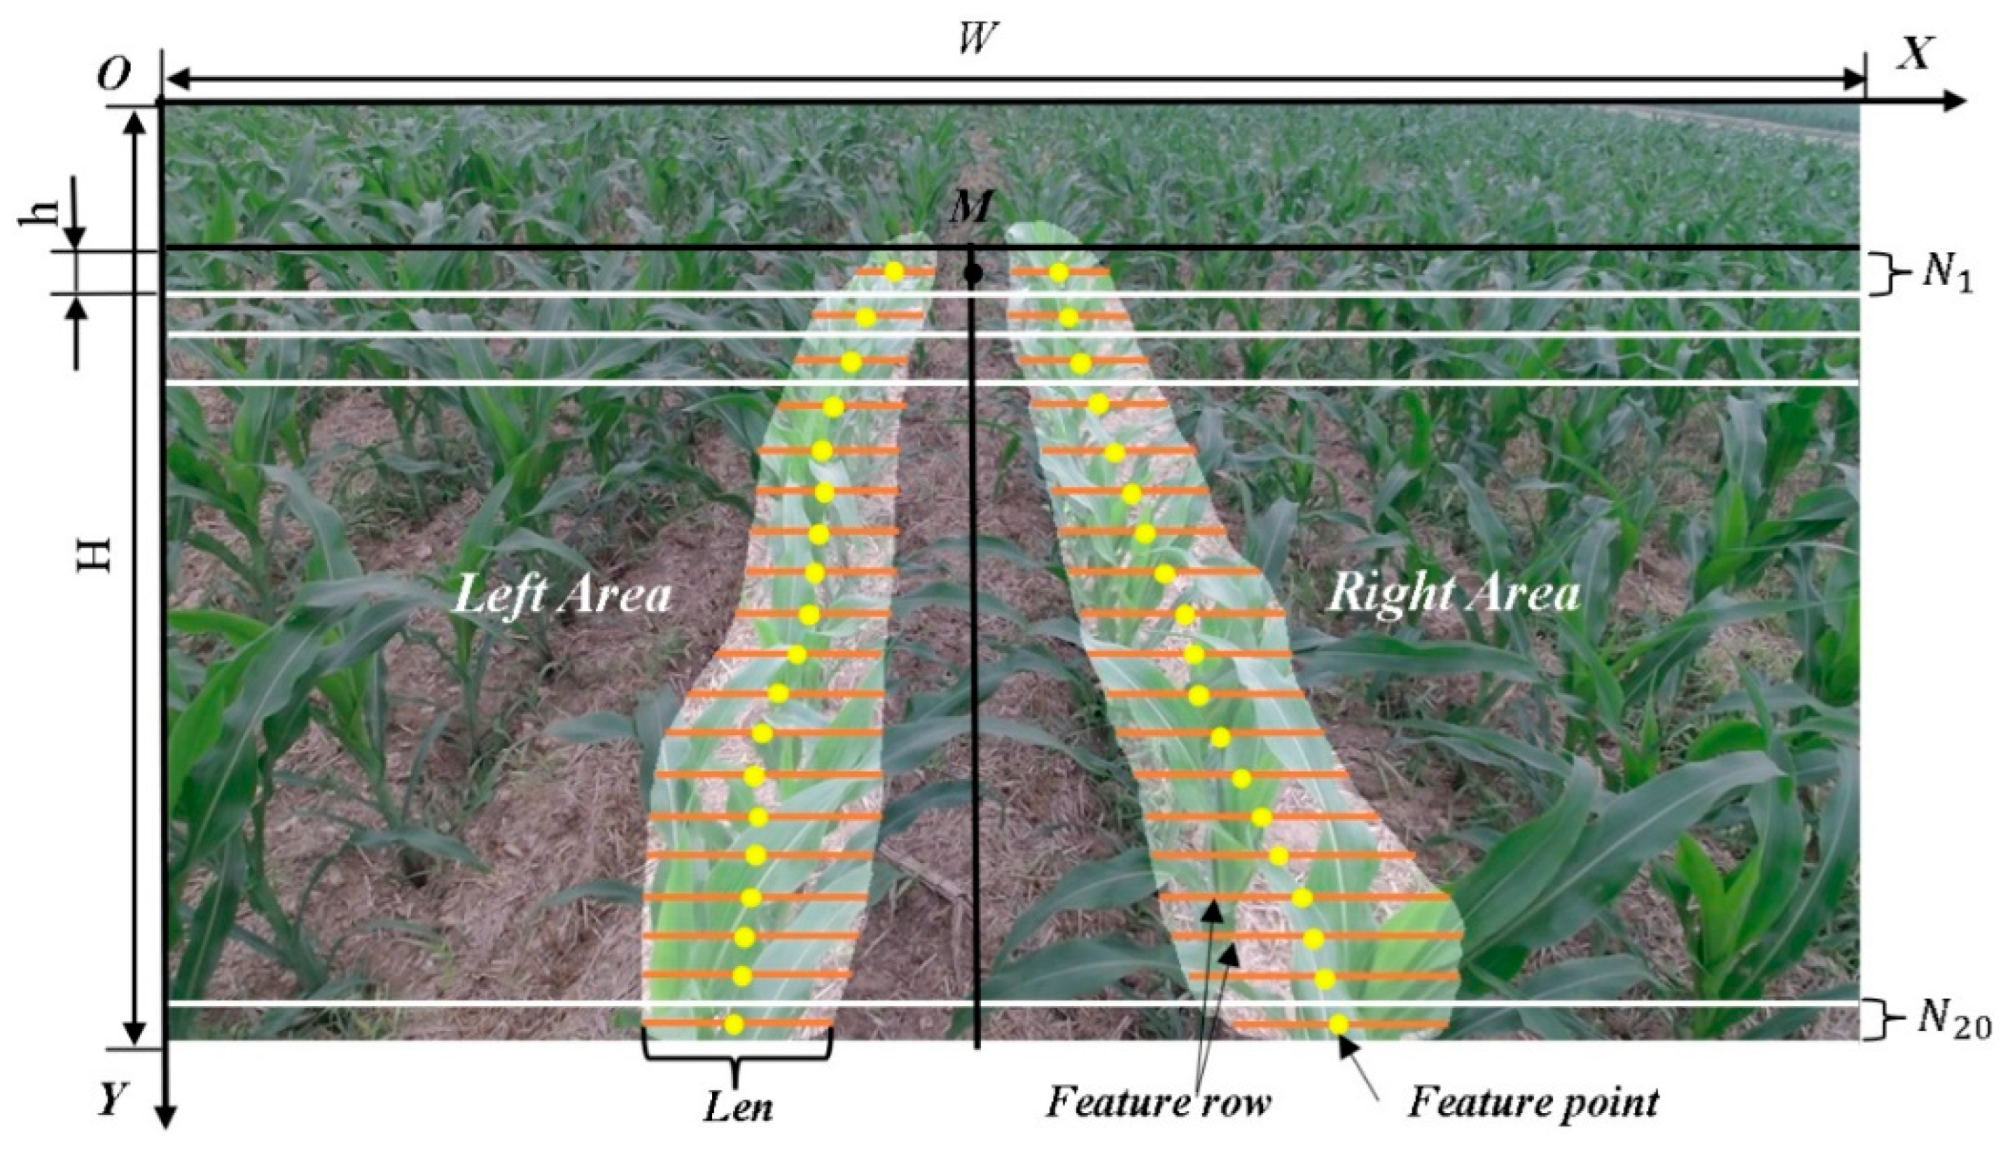
Due to the different camera angles, the maize seedling belts do not appear parallel to each other in the image, which may lead to overlapping of the seedling belts in the upper area of the image. Therefore, in the process of feature point extraction, the upper 1/7 region of the image was not processed. The image was divided into bands W × H according to the pixel range, to obtain a series of image bands with length h, and then numbered successively from the upper part of the image as 1, 2, 3 … N, where N represents the total number of image bands; considering the time of data processing and the reliability of subsequent extraction of feature points, N was set to 20 in this paper, as shown in Figure 8. This strategy aims to better cope with image deformation caused by camera shooting angle and to ensure the accuracy of feature point extraction.
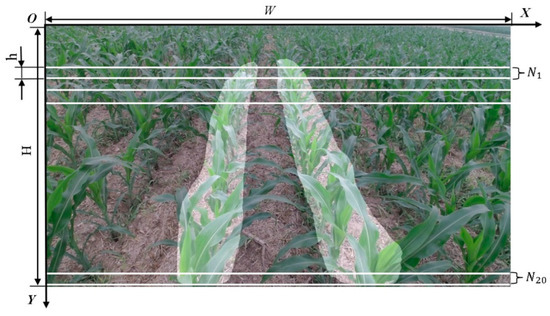
Figure 8.
Image band division.
2.6.2. Extraction of Crop Canopy Detection Lines by Midpoint Clustering Method
(1) The middle row of the image band was taken as feature row, successively from top to bottom. In each feature row, the canopy ROI was divided into two feature segments with roughly equal length as Len. The midpoint of the feature segment was taken as the feature point of the crop canopy, and the midpoint of the two feature points in the image band N1 was defined as the center point M. The image was divided into Left and Right areas by the center point. The extraction of canopy feature points in the area is shown in Figure 9. In the process of ROI prediction, there were a few cases of identifying non-middle two rows of crops, and then selection of the ROI closest to the center point M as the final output result.
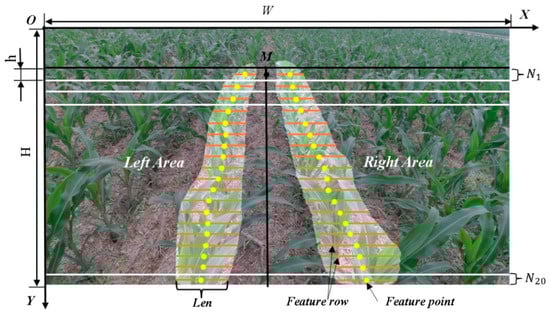
Figure 9.
Feature point extraction.
(2) The least squares method was used to fit the set of canopy feature points obtained in the Left and Right areas, respectively, and the crop canopy row detection lines were obtained. The fitting process is shown in Figure 10.
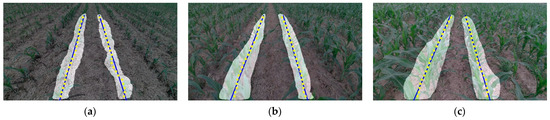
Figure 10.
Crop canopy row detection lines: (a) The result of Period-I; (b) The result of Period-II; (c) The result of Period-III.
2.7. Crop Root Representation Learning Model
The growth of the maize canopy was divergent, and the partially occluding phenomenon of the roots was very serious. The position of the roots could not be accurately detected according to the shooting condition of the RGB camera. This paper proposes a new method to accurately locate crop root rows based on crop canopy image information and representation learning methods. The study found that the height and growth of corn crops are about the same during the same period, usually planted in rows, so there is a certain relative position relationship between maize canopy rows and maize root rows. Based on the MaizeImageset dataset constructed above and combined with the Crop Root Representation Learning Model, the paper explores the relative position relationship between crop canopy and crop root rows so as to accurately predict crop root detection lines based on crop canopy detection lines.
2.7.1. Crop Root Representation Learning Model Data
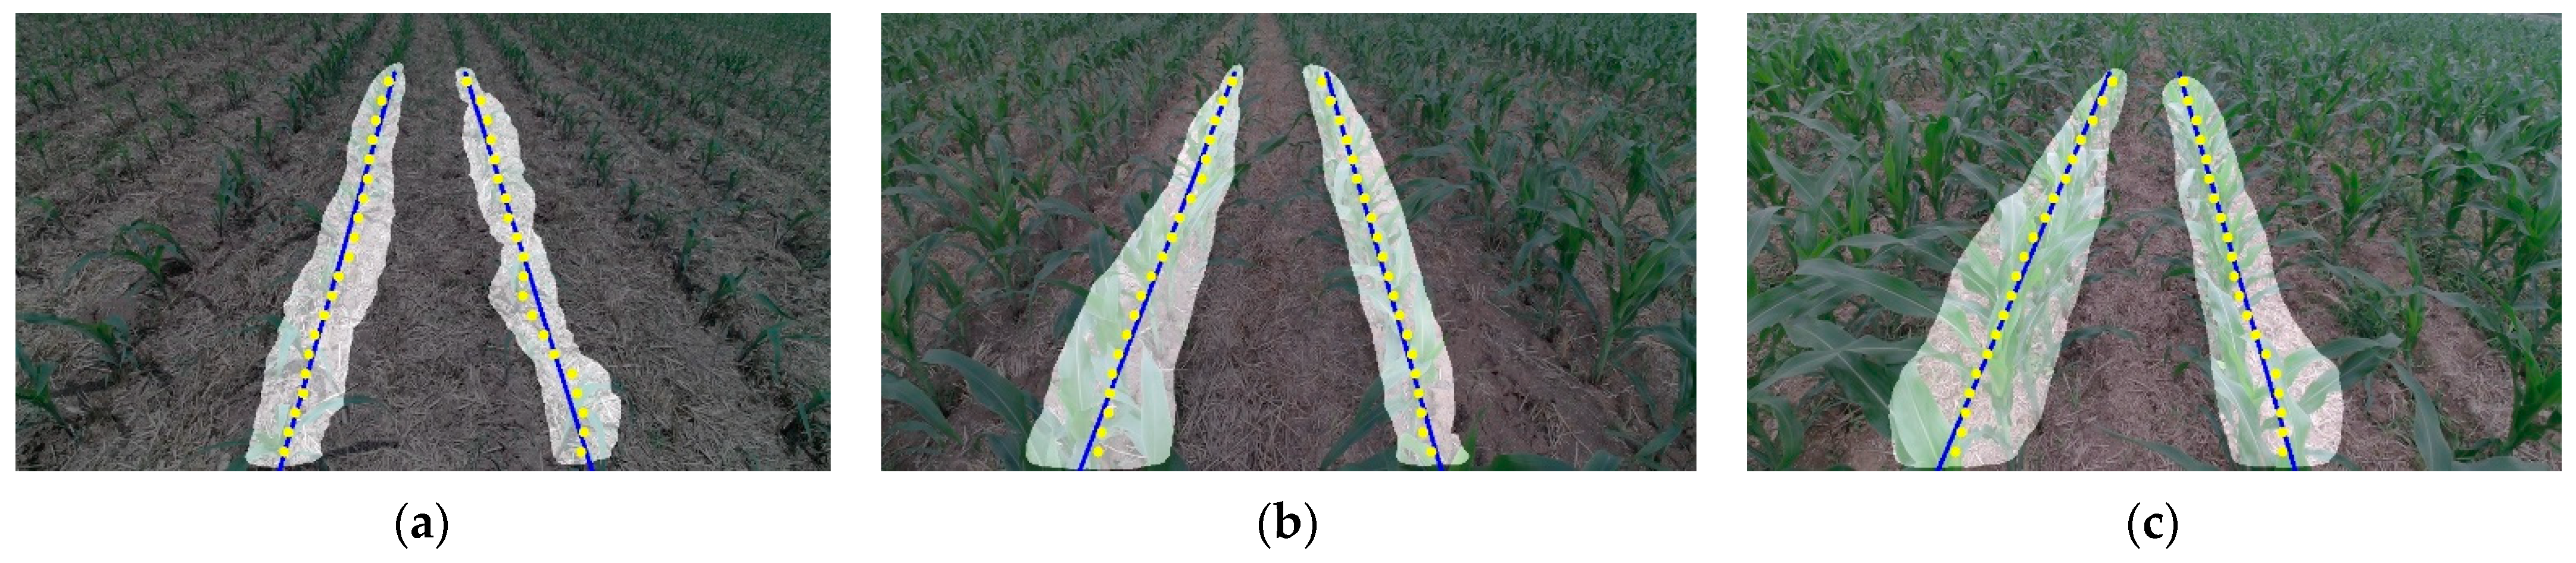
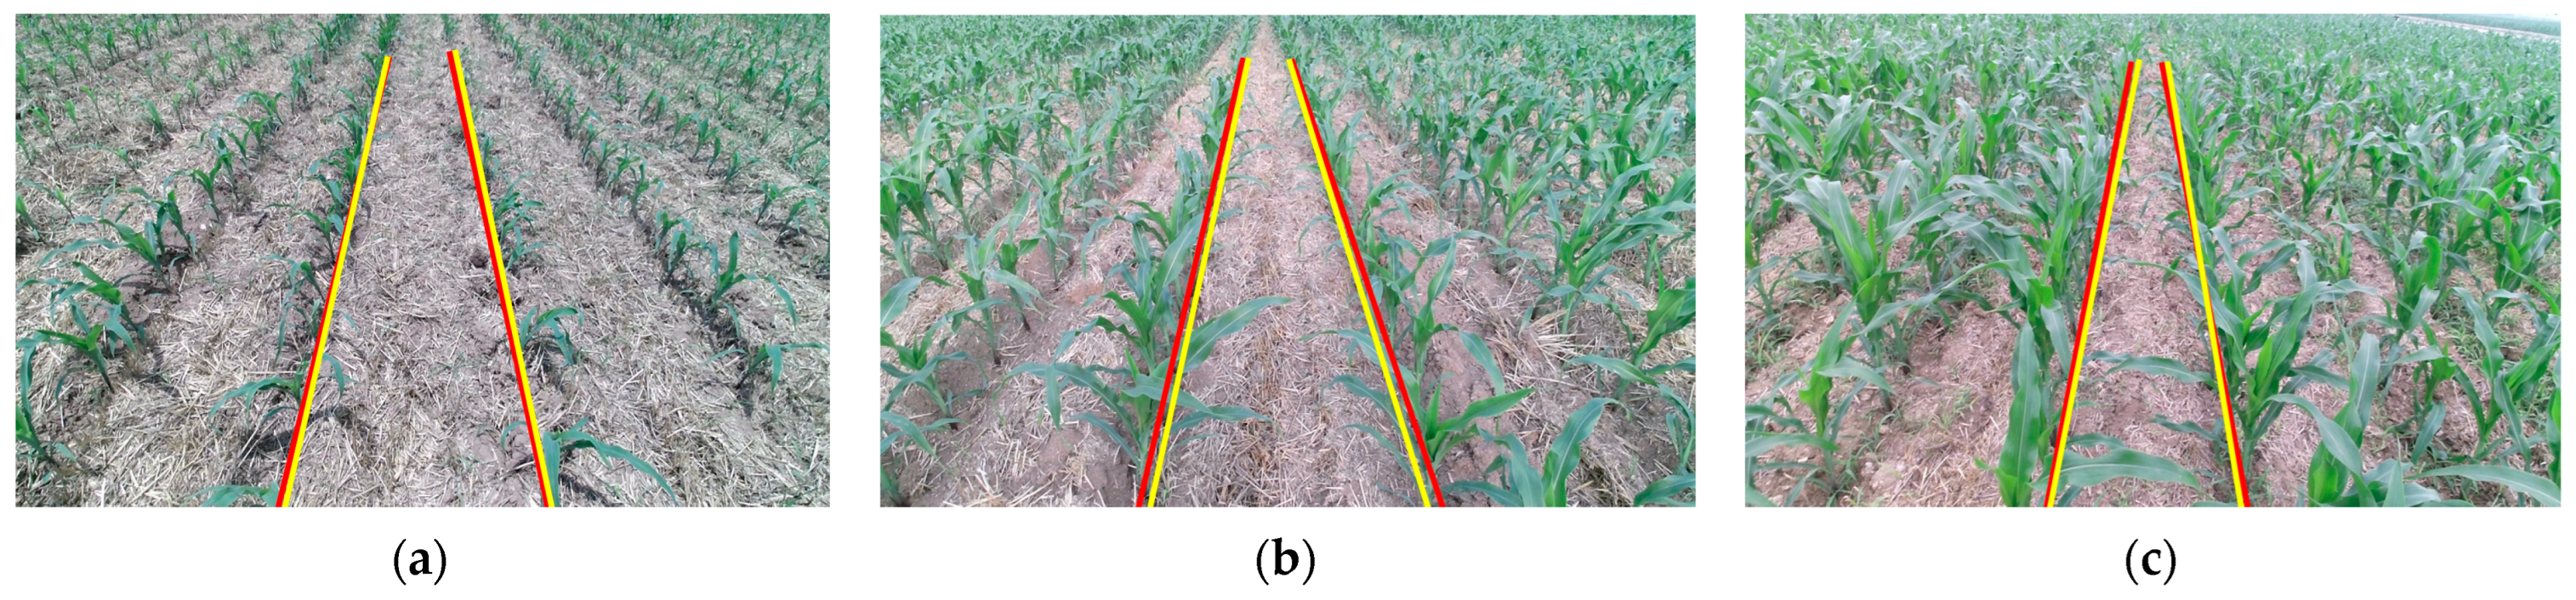
In order to simply and directly explore the relative position relationship between crop canopy row and crop root row, two feature representations of intercept and slope were selected for learning in this paper. In Section 2.6.2, the crop canopy row detection lines were successfully extracted, which can directly output the Intercept Representation as Tcanopy and the Slope Representation as Scanopy. The Intercept Representation as Troot and Slope Representation as Sroot of crop root rows need to be marked. The crop root rows of maize in the three periods were marked, as shown in Figure 11. The marked results were finally saved in CSV format, and the marked data was one-to-one, corresponding to the original image, forming a multi-period dataset. Each CSV file includes the endpoint coordinates of the crop root row detection line (X1, Y1) and (X2, Y2), and the slope representation (Sroot) and the intercept representation (Troot) can be calculated by the coordinates. The calculation equation for Sroot and Troot is defined in this paper as Equations (4) and (5). Each period is marked with 600 images, for a total of 1800 images.
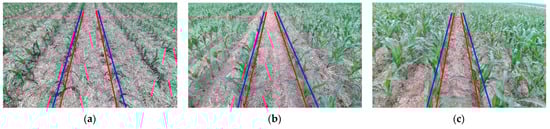
Figure 11.
Crop root rows marked (crop canopy row detection lines: blue, crop root row marked lines: red): (a) Treatment of Period-I; (b) Treatment of Period-II; (c) Treatment of Period-III.
In the equation above, Sroot is the Slope Representation of the marked crop root row detection line, Troot is the Intercept Representation of the marked crop root row detection line. Both (X1, Y1) and (X2, Y2) are the endpoint coordinates of the crop root row detection line.
2.7.2. Structure of Crop Root Representation Learning Model
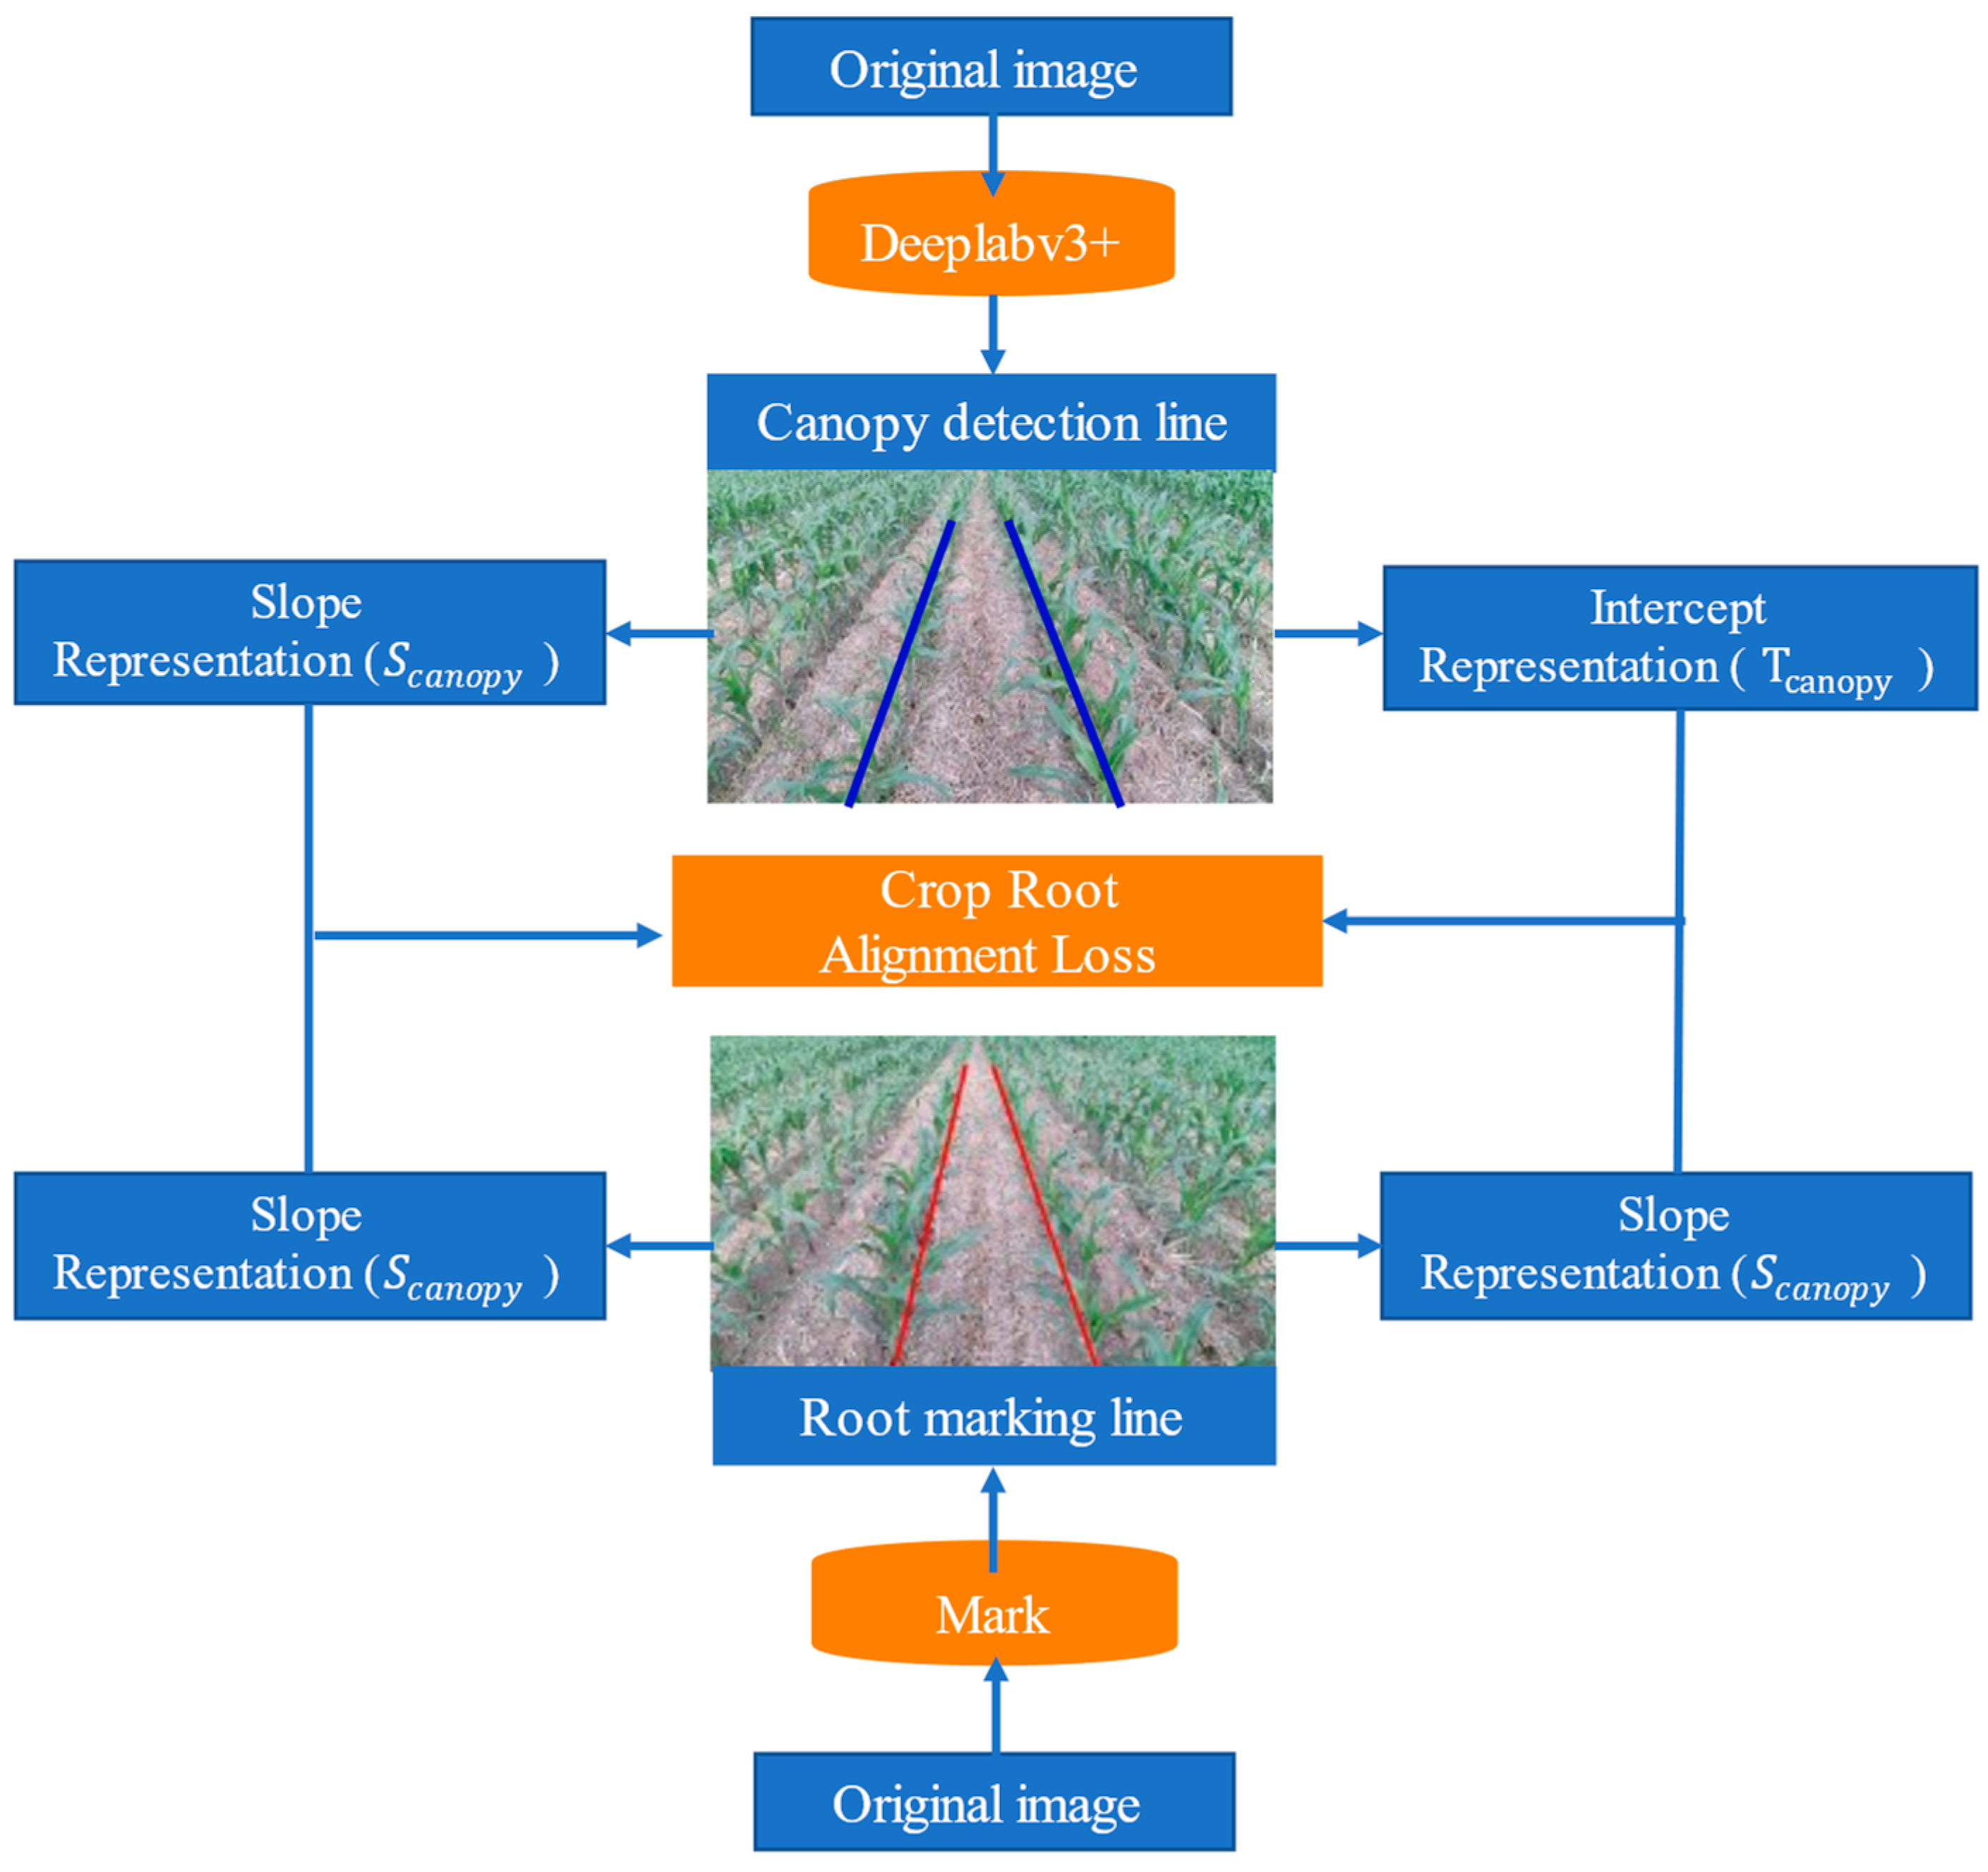
Crop Root Representation Learning Model constructed in this paper is shown in Figure 12. After input of the Crop Root Representation Learning Model dataset, an obvious linear relationship was observed between the Slope Representation of crop canopy row and the Slope Representation of crop root row, and there was also a linear relationship between the Intercept Representation of crop canopy row and the Intercept Representation of crop root row, as shown in Figure 13.
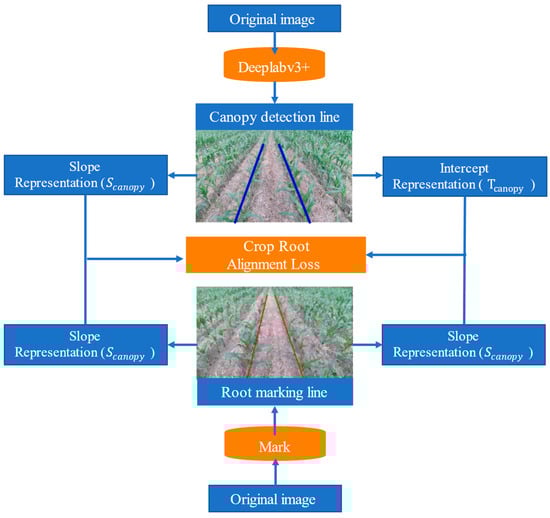
Figure 12.
Crop Root Representation Learning Model.
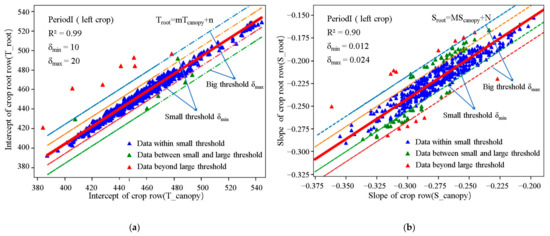
Figure 13.
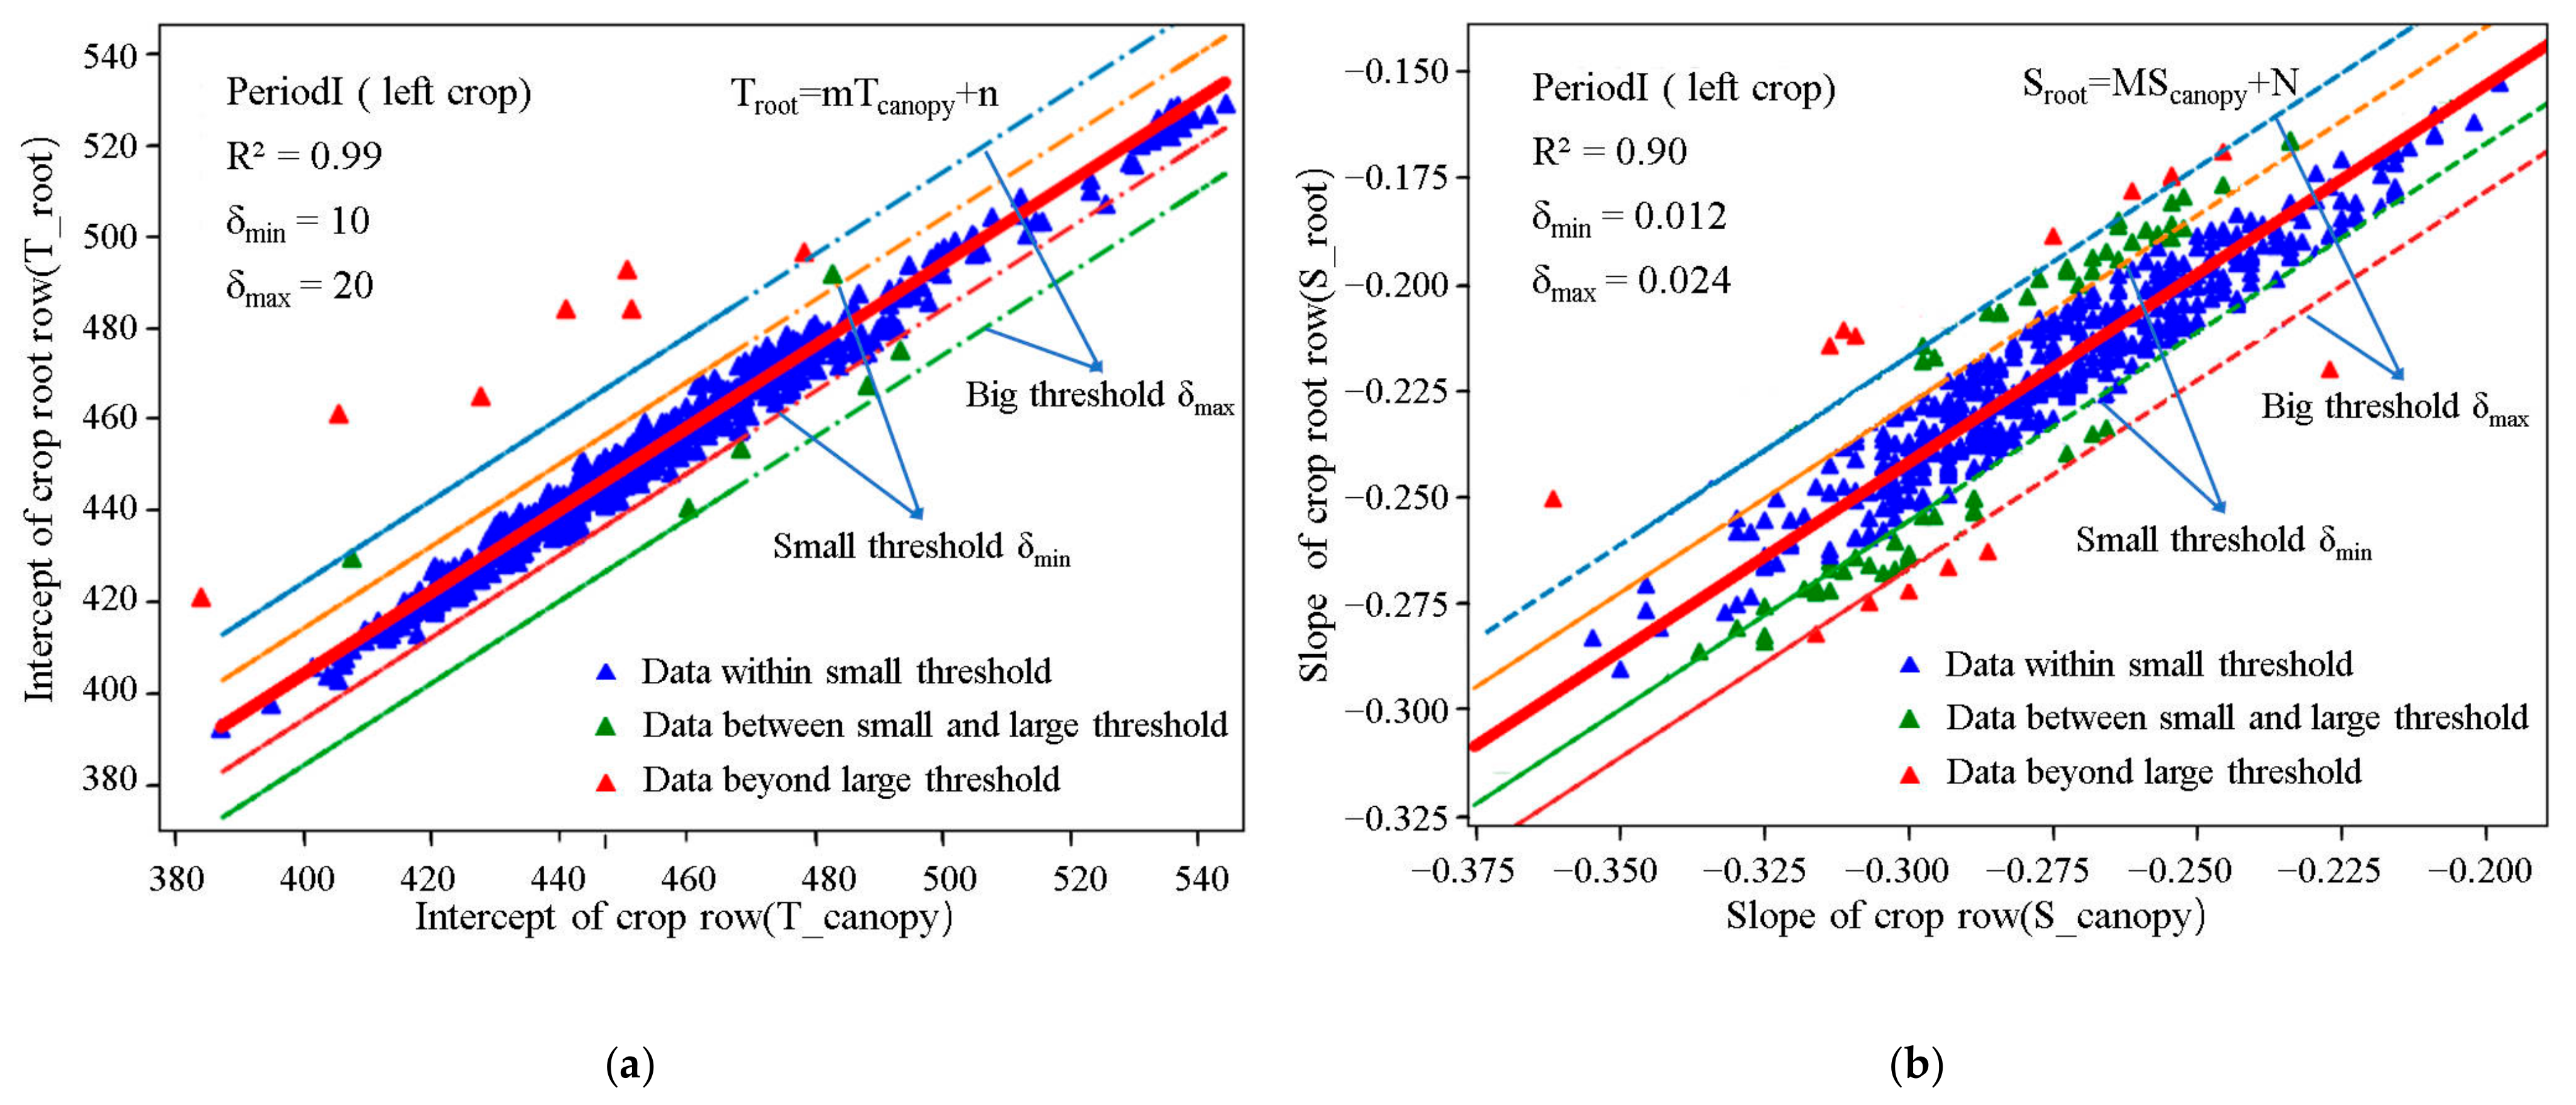
Representation fitting based on Crop Root Alignment Loss: (a) Intercept representation fitting based on Crop Root Alignment Loss; (b) Slope representation fitting based on Crop Root Alignment Loss.
Specifically, Figure 13a shows the scatter fitting diagram between the Intercept Representation of the crop canopy rows in Period I and the corresponding Intercept Representation of the crop root rows (where Tcanopy coordinate represents the intercept of the crop canopy row, and Troot coordinate represents the intercept of the crop root row). Additionally, Figure 13b shows the scatter fitting diagram between the Slope Representation of the crop canopy rows in Period I and the Slope Representation of the corresponding crop root rows (where Scanopy coordinate represents the slope of the crop canopy rows, and Sroot coordinate represents the slope of the crop root rows).
It is worth noting that in these scatter figures, some anomalies are also observed. In order to learn the relative position relationship between crop canopy rows and crop root rows more accurately, this paper proposes a Loss function: Crop Root Alignment Loss, which is calculated by Equation (6). The loss function introduces two thresholds, the large threshold δmax and the small threshold δmin, to eliminate data points that deviate significantly from the linear relationship. In different ranges of values, the class mean square error (MSE) and class mean absolute error (MAE) algorithms are used to calculate the loss values. Finally, the Alignment Equation learned by the Crop Root Representation Learning Model is shown in Equation (7).
In Equation (6), Loss is the loss value, δmax is the large threshold, δmin is the small threshold, (x,y) is the coordinate point in Figure 13, and f(x) is the predicted value.
In Equation (7), Sroot is the slope of crop root row detection line, Scanopy is the slope of crop canopy row detection line, Troot is the intercept of crop root row detection lines, Tcanopy is the intercept of crop canopy row detection lines, M is the slope of the linear relationship between the Slope Representations, N is the intercept of the linear relationship between the Slope Representations, m is the slope of the linear relationship between the Intercept Representations, and n is the intercept of the linear relationship between the Intercept Representations.
2.8. Crop Root Rows Detection Line Extraction
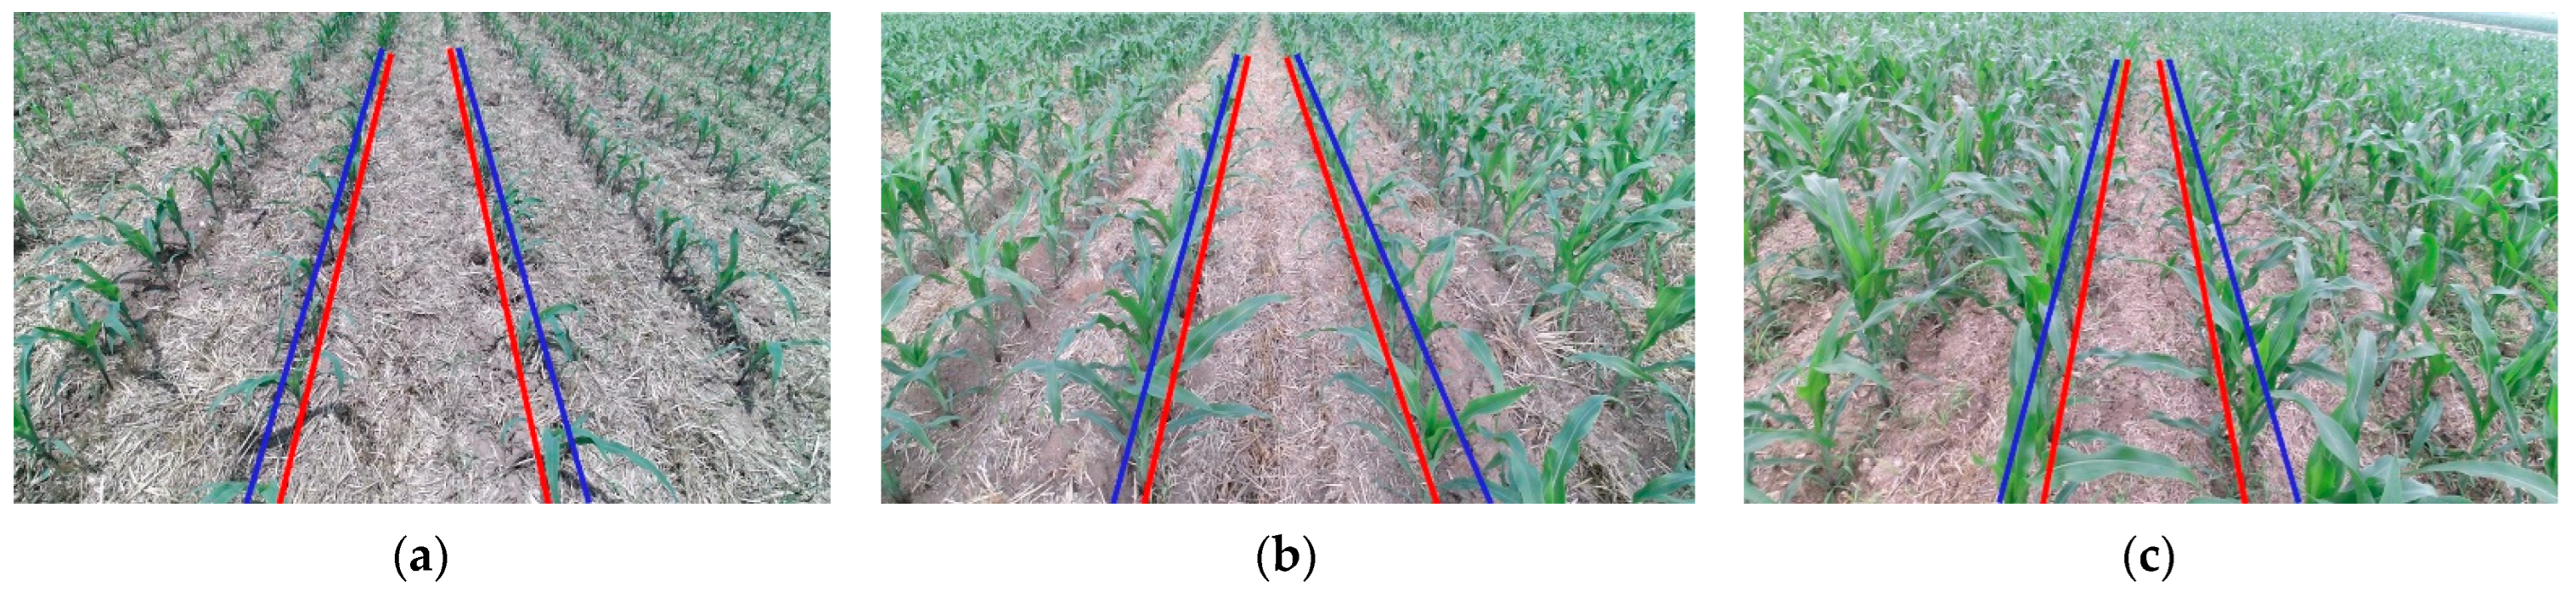
In Section 2.5, the representation relationship between crop canopy rows and crop root rows was learned by the Crop Root Representation Learning Model, and the parameters of the Alignment Equation were obtained. According to the parameters of Alignment Equation and the information of crop canopy row, the crop root row can be calculated. The calculation is shown in Equation (8), and the calculation results are shown in Figure 14.
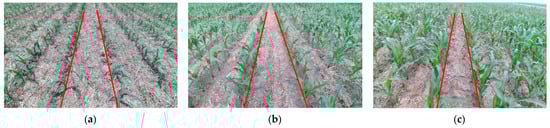
Figure 14.
Crop root rows detection: (a) The result of Period-I; (b) The result of Period-II; (c) The result of Period-III.
In Equation (8), (X,Y) is the coordinates on the detection lines of crop root rows, M is the slope of the linear relationship between the Slope Representations, N is the intercept of the linear relationship between the Slope Representations, m is the slope of the linear relationship between the Intercept Representations, n is the intercept of the linear relationship between the Intercept Representations, Scanopy is the slope of the crop canopy detection line, and Tcanopy is the intercept of the crop canopy detection line.
3. Results and Discussion
3.1. Performance Analysis of the Algorithm
The core of this paper aimed to locate the detection lines of crop root rows on the basis of crop canopy rows detection combined with using the Crop Root Representation Learning Model. The performance of the algorithm depended on the accuracy and real-time performance of the crop canopy detection line extraction and the accuracy of the Crop Root Representation Learning Model. Therefore, the performance of this algorithm is discussed experimentally from the following four perspectives. (1) Testing the accuracy and real-time performance of the crop canopy row detection line extraction. (2) Testing the accuracy of the Crop Root Representation Learning Model. (3) Testing the accuracy and real-time performance of crop root row extraction. (4) Testing the crop root rows extraction under the condition of missing seedlings. The paper defined accuracy (A) and error angle (EA) as evaluation criteria. If the error between the detection line and the manual calibration result was less than 5°, the test was considered to be correct, and the error angle EA is calculated as shown in Equation (9).
In Equation (9), N is the total number of test pictures, θ is the declination angle of the marked line, and δ is the declination angle of the navigation line.
3.1.1. Experiment of Accuracy and Real-Time Extraction of Crop Canopy Row Detection Lines
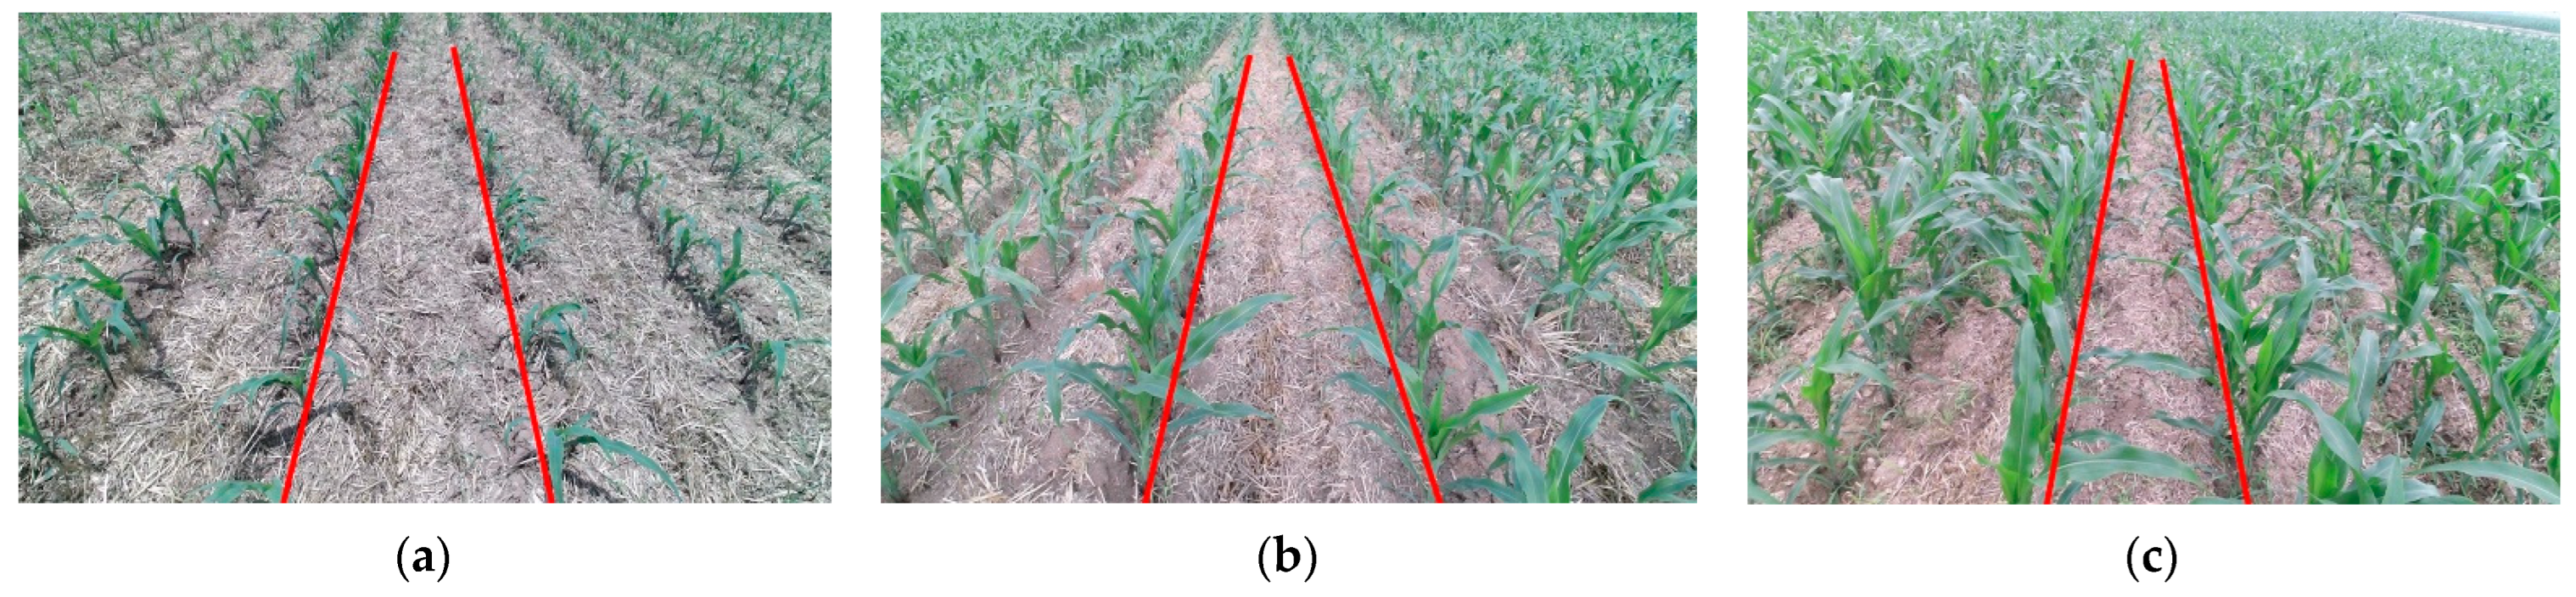
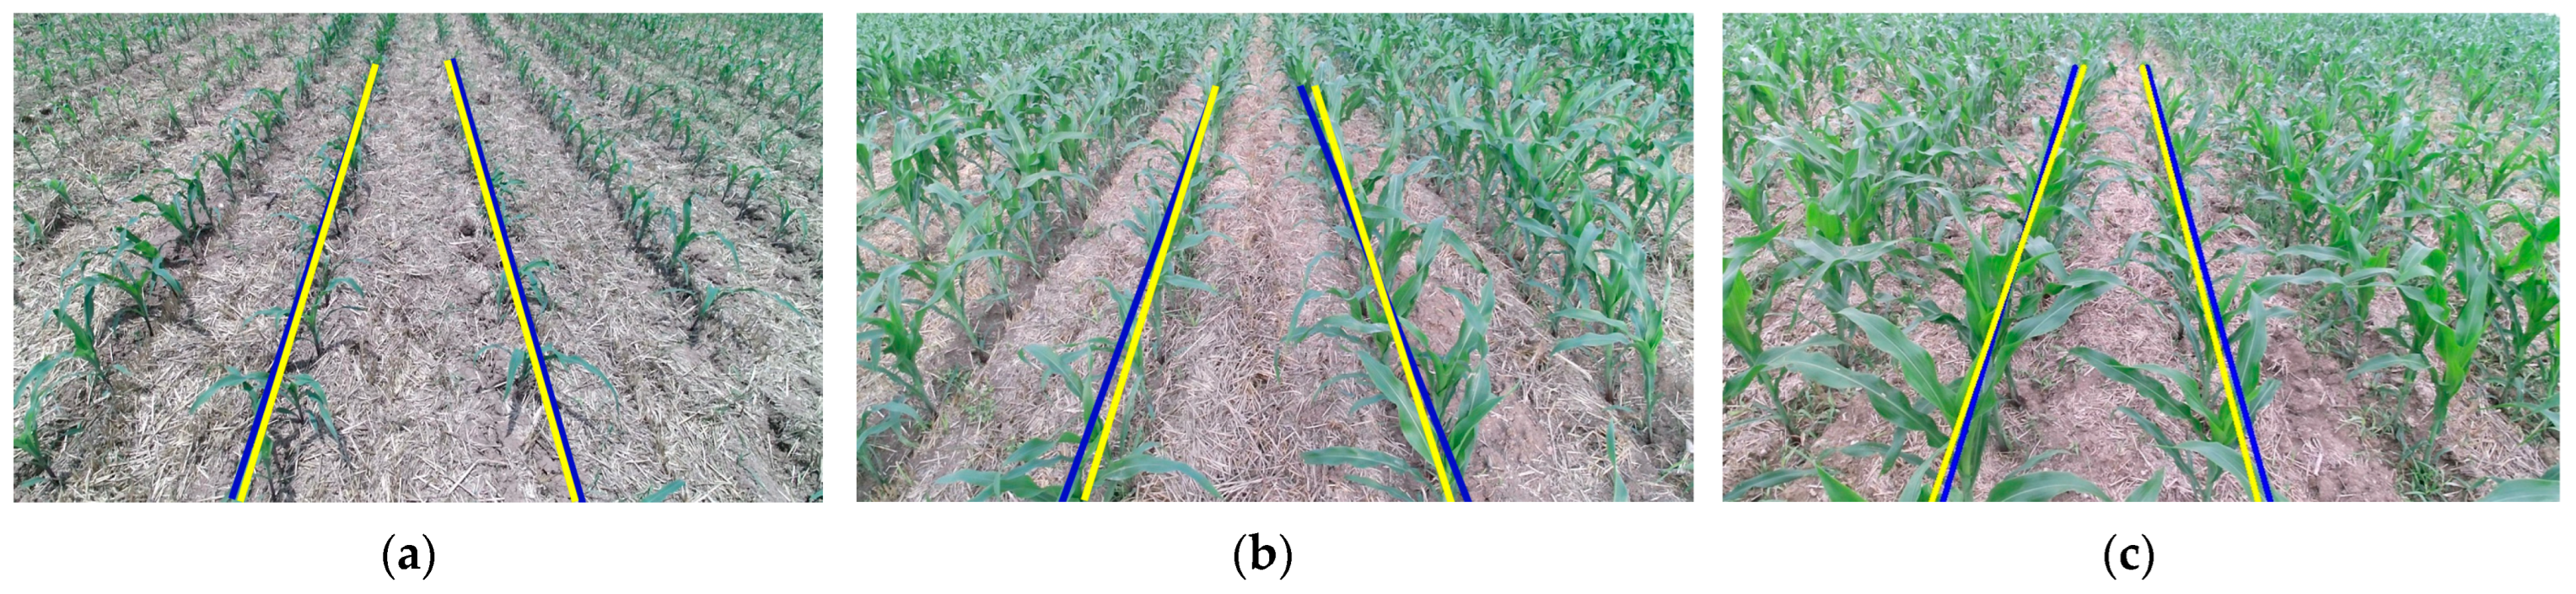
In order to ensure the accuracy of crop root rows detection, the first task was to extract the crop canopy detection line quickly and accurately. This paper compared the lightweight DeeplabV3+ network model with the UNet and PSPNet, and discusses the PA, MIOU, and FPS of different models integrated with different backbone networks. At the same time, in ROIs extracted by different models, the algorithm proposed in Section 2.6 was used to extract the crop canopy row detection lines, and the accuracy (A) of different models was discussed. In order to ensure the reliability of the experimental results, 300 images were randomly selected from each of the three periods for comparison experiments. If the error between the crop canopy detection line and the results of manual calibration was less than 5°, it was considered correct, as shown in Figure 15 of the experiment, and the results are shown in Table 1. Comprehensive comparative analysis of different networks can fully prove that the improved DeeplabV3+ neural network in this paper is reliable, able to quickly and accurately identify the central area of crop canopy, and extract the crop canopy detection line.
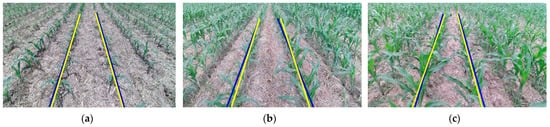
Figure 15.
Comparison of crop canopy row detection line (Blue) and crop canopy row marked line (Yellow): (a) Experimental results of Period-I; (b) Experimental results of Period-II; (c) Experimental results of Period-III.

Table 1.
Comparison data of accuracy and real-time performance of different neural networks.
3.1.2. Experiment on Accuracy Analysis of Crop Root Representation Learning Model
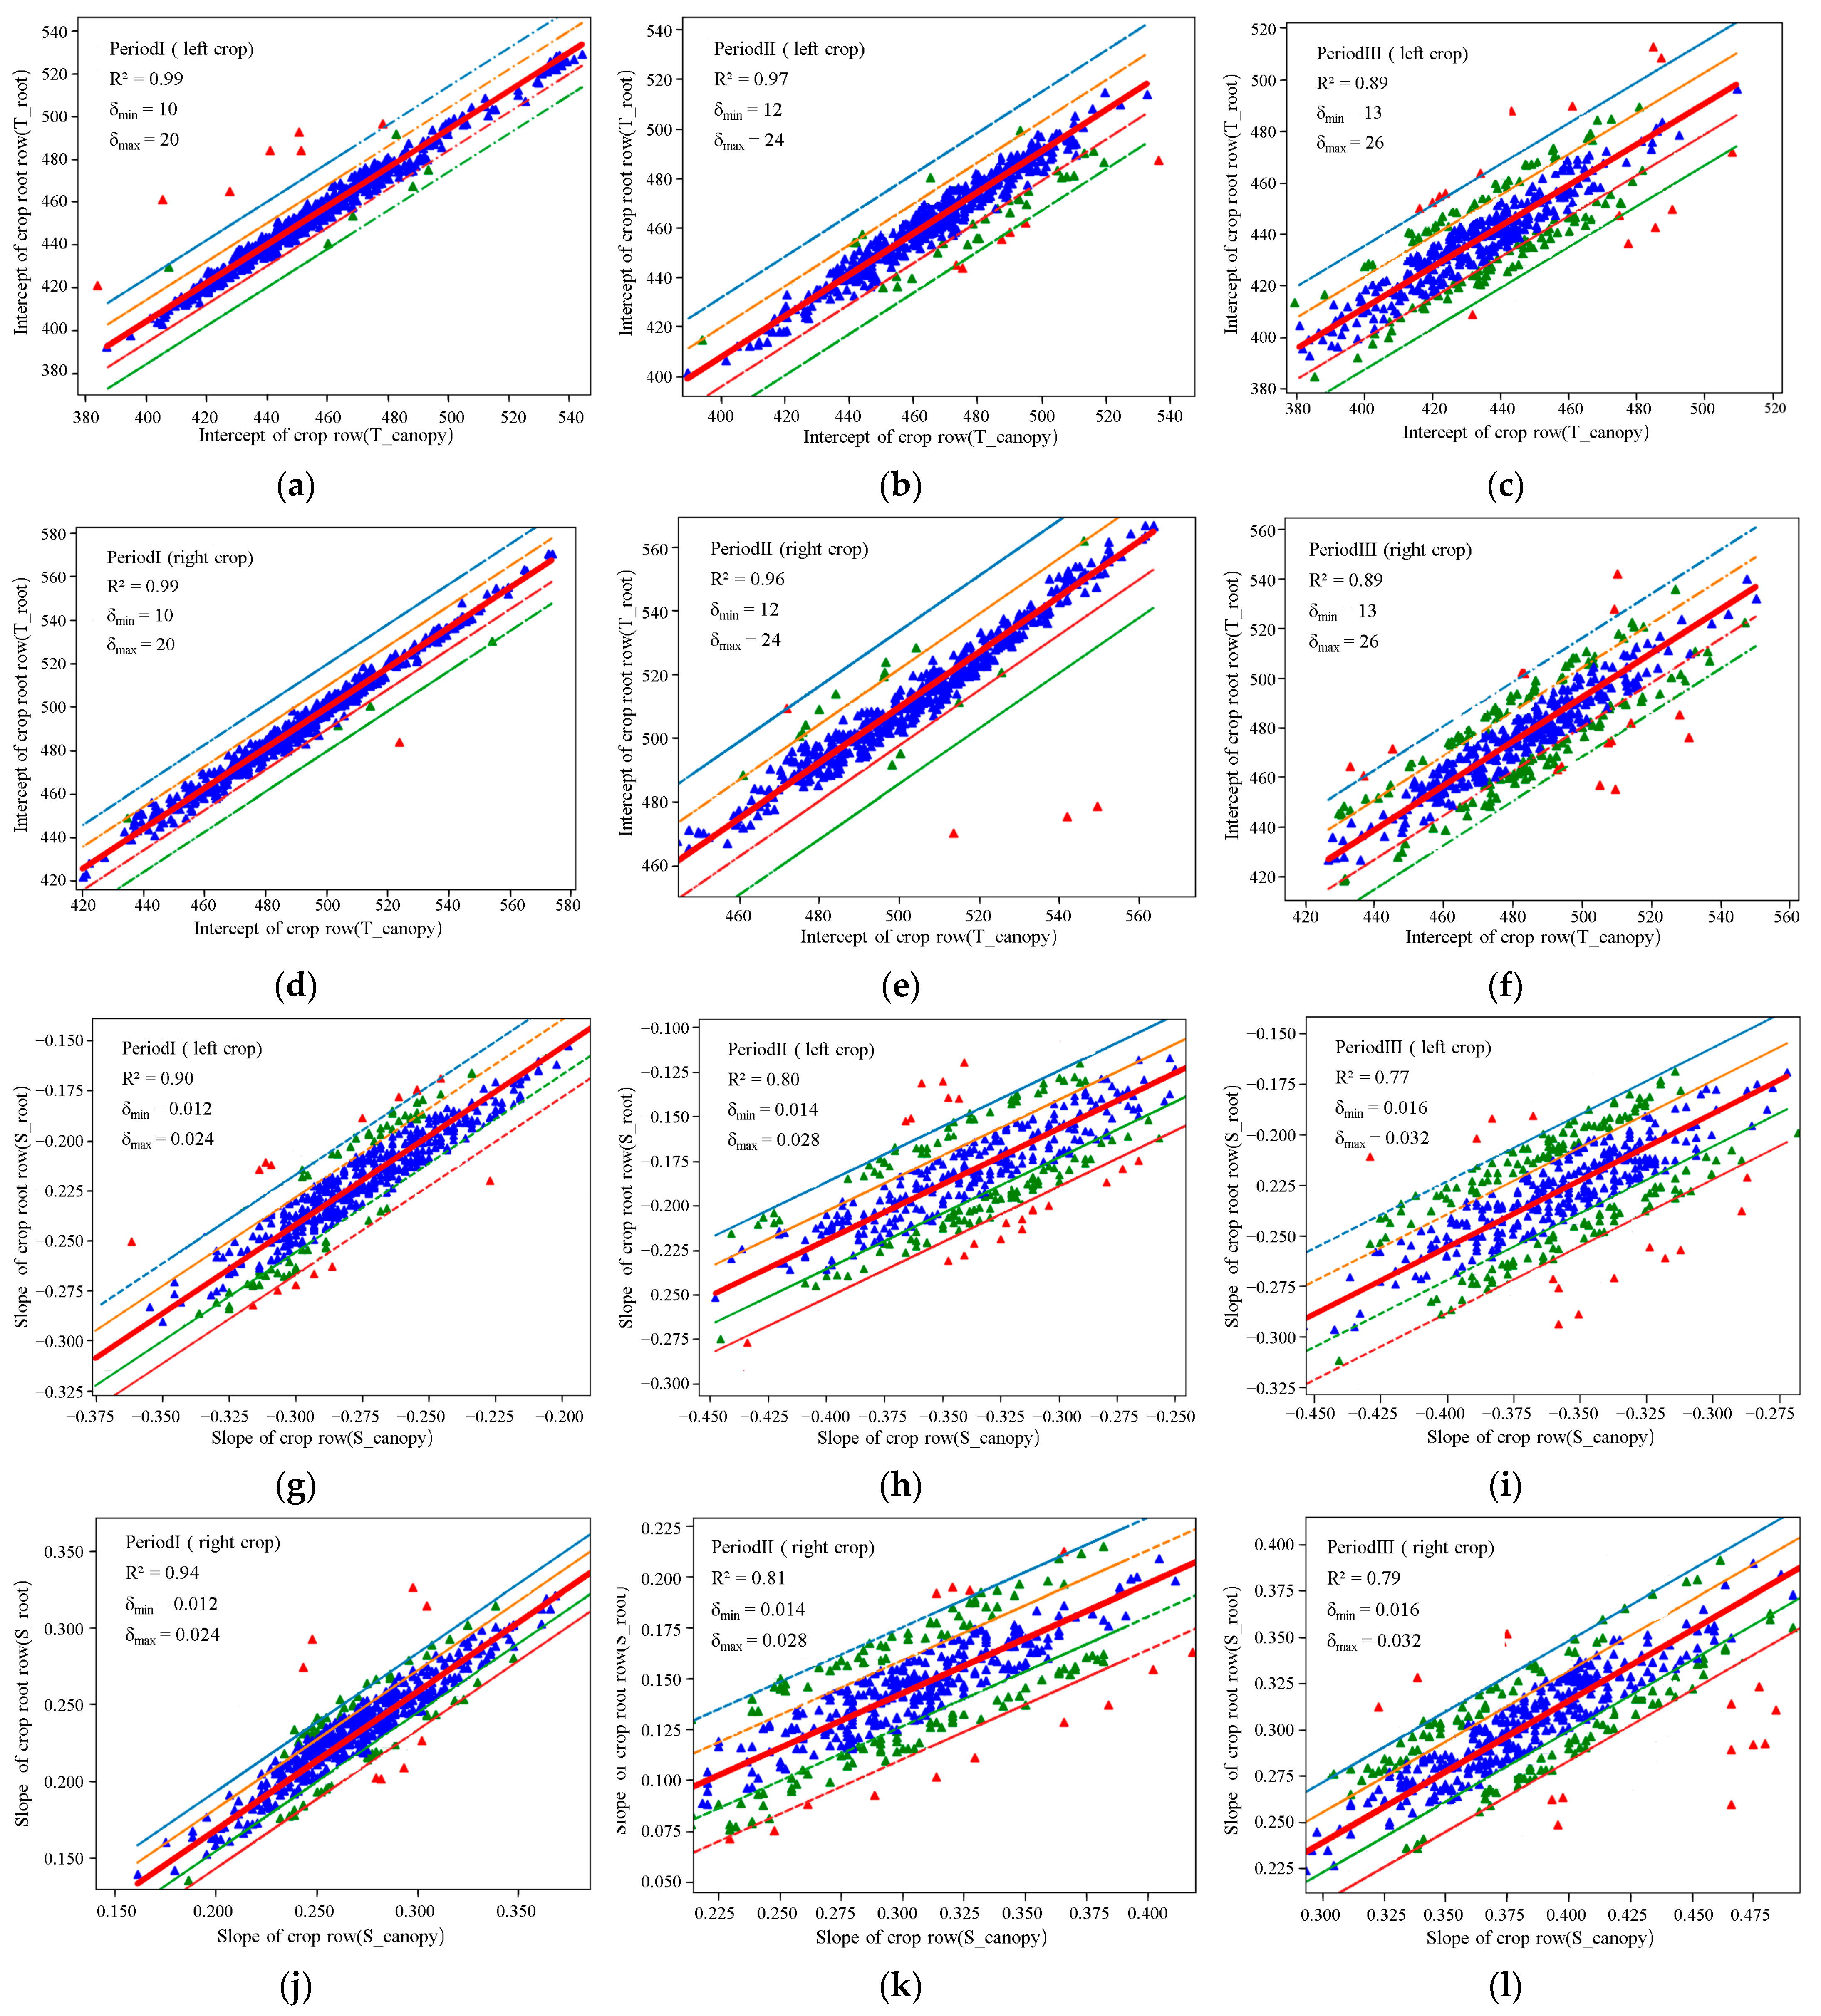
Based on the Crop Root Representation Learning Model proposed in this paper, we explored the representation relationship between the corn canopy row and the crop root row in the three periods, as shown in Figure 16. The Alignment Equation parameters learned by the model are shown in Table 2. As can be seen from Figure 16, with the growth of crops, the greater the degree of dispersion of presentation data, the more difficult it was to extract relative position relationships. However, in combination with the Crop Root Alignment Loss, accurate Alignment Equation parameters can still be obtained.
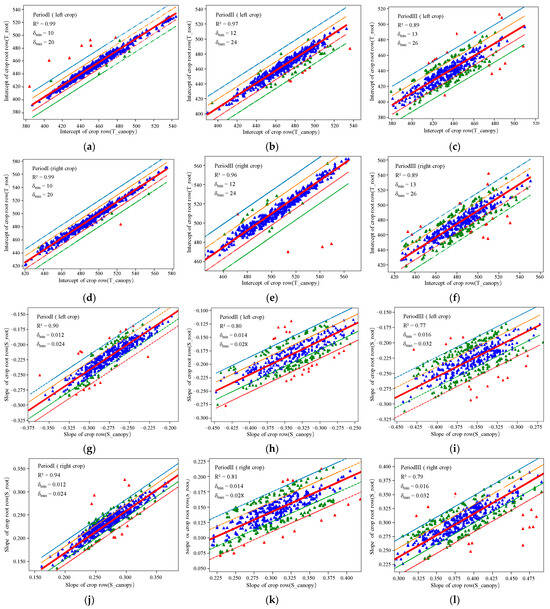
Figure 16.
Linear regression of representation information (the blue data is within the small threshold, the green data is the between the small threshold and the large threshold, the red data is outside the large threshold, the blue and red dotted lines are the large threshold, and the yellow and green dotted lines are the small threshold): (a) Linear regression relationship of intercept representation in Period-I (left); (b) Linear regression relationship of intercept representation in Period-II (left); (c) Linear regression relationship of intercept representation in Period-III (left); (d) Linear regression relationship of intercept representation in Period-I (right); (e) Linear regression relationship of intercept representation in Period-II (right); (f) Linear regression relationship of intercept representation in Period-III (right); (g) Linear regression relationship of slope representation in Period-I (left); (h) Linear regression relationship of slope representation in Period-II (left); (i) Linear regression relationship of slope representation in Period-III (left); (j) Linear regression relationship of slope representation in Period-I (right); (k) Linear regression relationship of slope representation in Period-II (right); (l) Linear regression relationship of slope representation in Period-III (right).
Table 2.
Alignment Equation parameters.
In this paper, the method of extracting crop root row detection lines was based on crop canopy row detection lines and the Crop Root Representation Learning Model to allow for prediction. The prediction accuracy of the presentation learning network model was crucial. The paper still conducted experiments by comparing with the manual calibration line, and the results are shown in Table 3. After correctly extracting the crop canopy detection line, according to the Crop Root Representation Learning Model constructed in this paper, the average accuracy rate of predicting crop root rows reached 97.6%, but based on the deviated crop canopy detection line, the accuracy rate of predicting crop root rows was only 75.8%. This also verified that the accurate extraction of crop canopy detection lines ensured the accurate detection of crop root rows, and also indicated that the Crop Root Representation Learning Model propose is reasonable and can accurately predict crop root rows.
Table 3.
Accuracy of Crop Root Representation Learning Model.
3.1.3. Experiment on Accuracy and Real-Time Extraction of Crop Root Rows
In this section, the paper discusses the performance of this algorithm for crop root row detection. The comparison experiment was conducted by randomly selecting 300 pictures from each of the three periods, as shown in Figure 17, and the experimental results are shown in Table 4. The detection accuracy of crop root rows in the three periods was more than 96%, and the data inference time of the algorithm was about 30ms, which can meet the requirements of precision and real-time operation of farm machinery in the field.
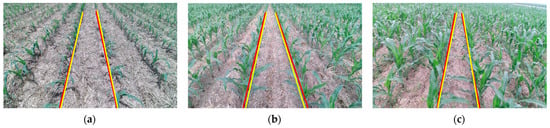
Figure 17.
Comparison of crop root row detection line (Red) and crop root row marked line (Yellow): (a) Experimental results of Period-I; (b) Experimental results of Period-II; (c) Experimental results of Period-III.
Table 4.
Accuracy and real-time performance of crop root row detection.
3.1.4. Experiment of Crop Root Rows Extraction in the Absence of Partial Seedlings
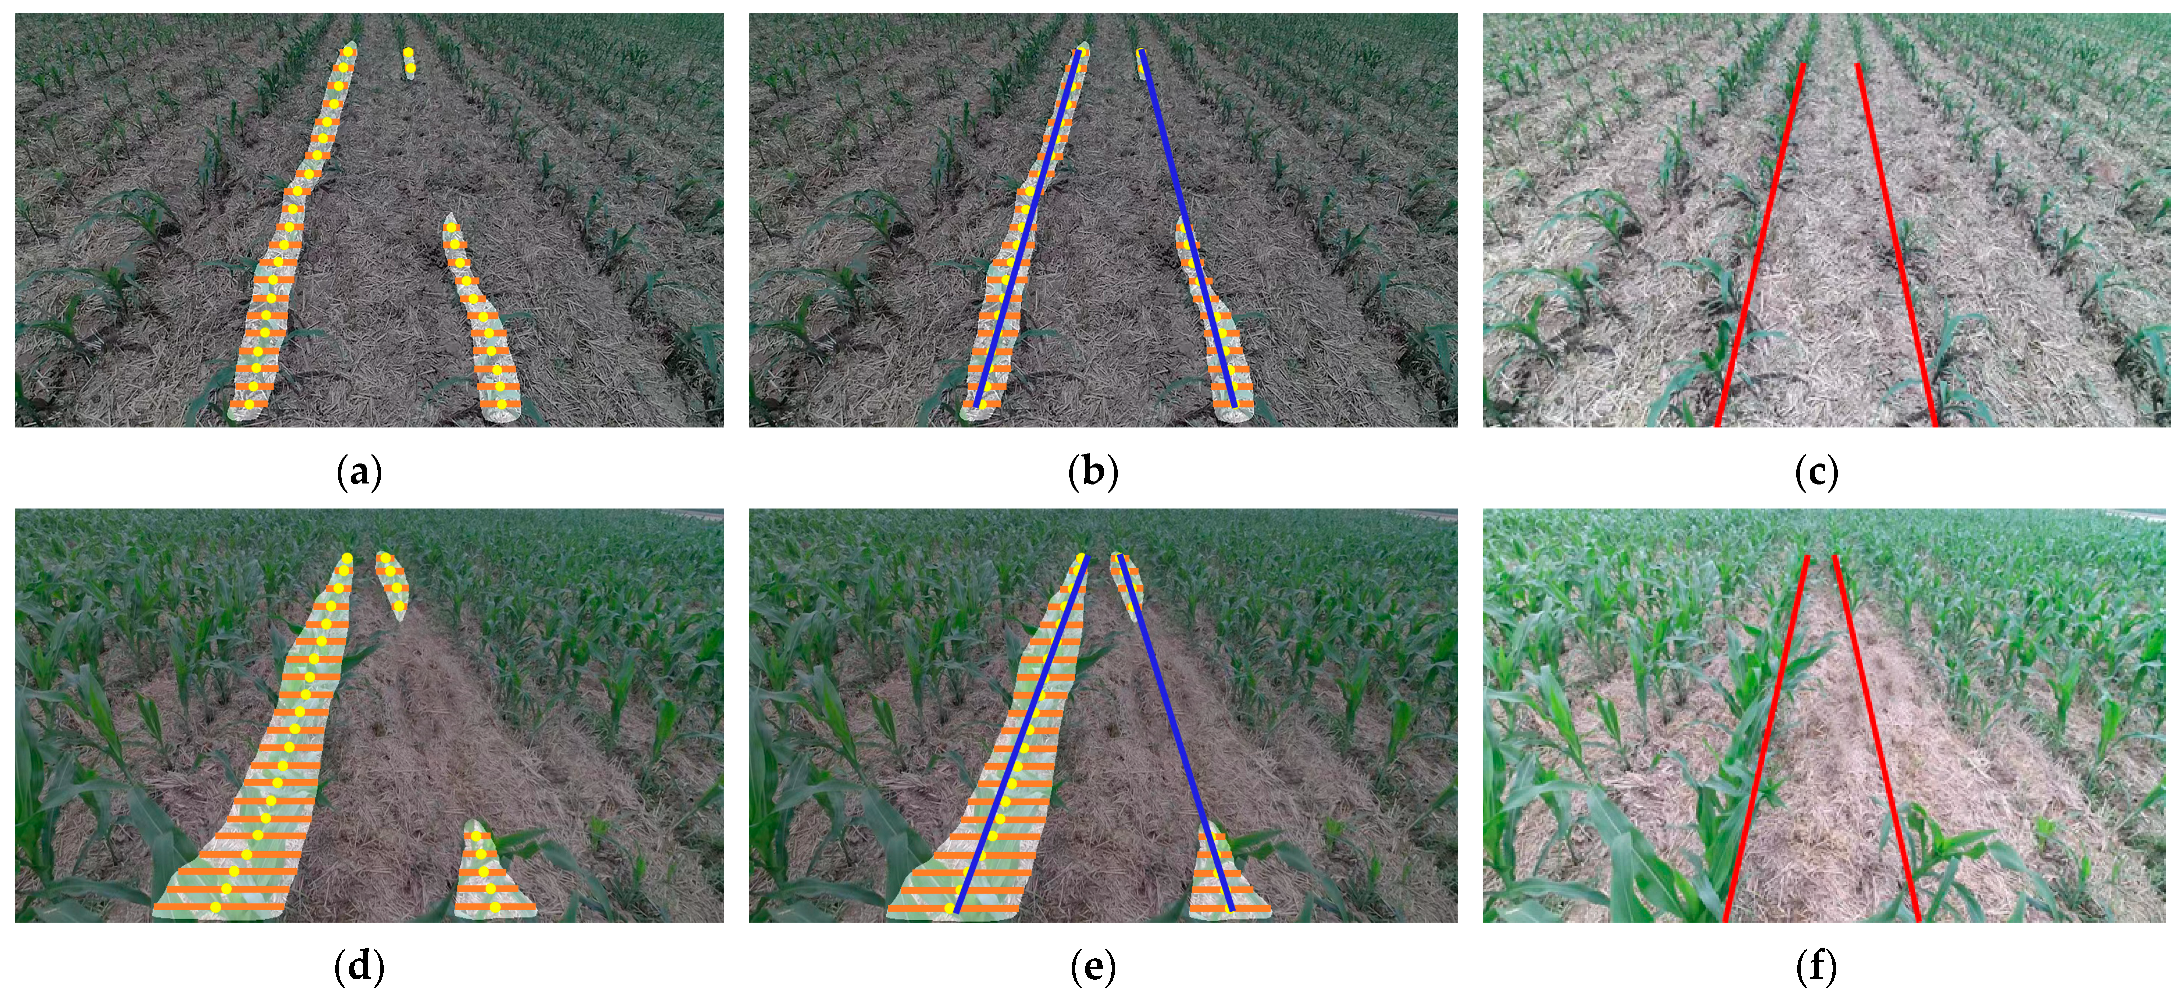
It is difficult to carry out crop row detection when crops are short of seedlings in the field, because sufficient and accurate feature points cannot be extracted, resulting in the deviation of the extracted navigation line. The algorithm proposed in this paper can effectively output the navigation line when the crop seedling deficiency rate is less than 50%. This is because when dealing with the absence of partial seedlings, the algorithm in this paper can still extract the canopy ROI, so as to extract enough feature points to simulate the crop canopy row detection line. Then, combined with the Crop Root Representation Learning Model proposed in Section 2.7, the crop root row detection line is predicted. The extraction of missing seedlings is shown in Figure 18.
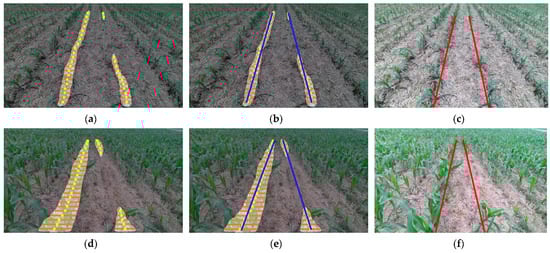
Figure 18.
Extraction in the absence of partial seedlings (crop canopy row detection line: blue, crop root row detection line: red): (a) Feature point extraction in Period-I; (b) Crop canopy row detection in Period-I; (c) Crop root row detection in Period-I; (d) Feature point extraction in Period-III; (e) Crop canopy row detection in Period-III; (f) Crop root row detection in Period-III.
3.2. Experiment Analysis of Field Navigation Line Extraction
In this paper, we extracted the crop canopy row detection line based on the semantic segmentation algorithm, and extracted the crop root row detection line based on the Crop Root Representation Learning Model. The middle line of the crop root row detection line was the field navigation line, the accuracy was 97%, the average processing time of a single frame image (960 × 540 pix) was 30.49ms. The extraction can guide the agricultural machine to realize intelligent row driving. The algorithm proposed in this paper can accurately extract the navigation lines of these three periods because semantic segmentation can accurately extract the crop canopy ROI, which is not affected by the spread of corn leaves, so as to accurately extract effective feature points. In addition, the Crop Root Representation Learning Model proposed in this paper can learn the relative position relationship between the crop canopy row and crop root row, so as to predict crop root row detection lines based on crop canopy row detection lines. It is more accurate to use the center line of the crop root line as the navigation line.
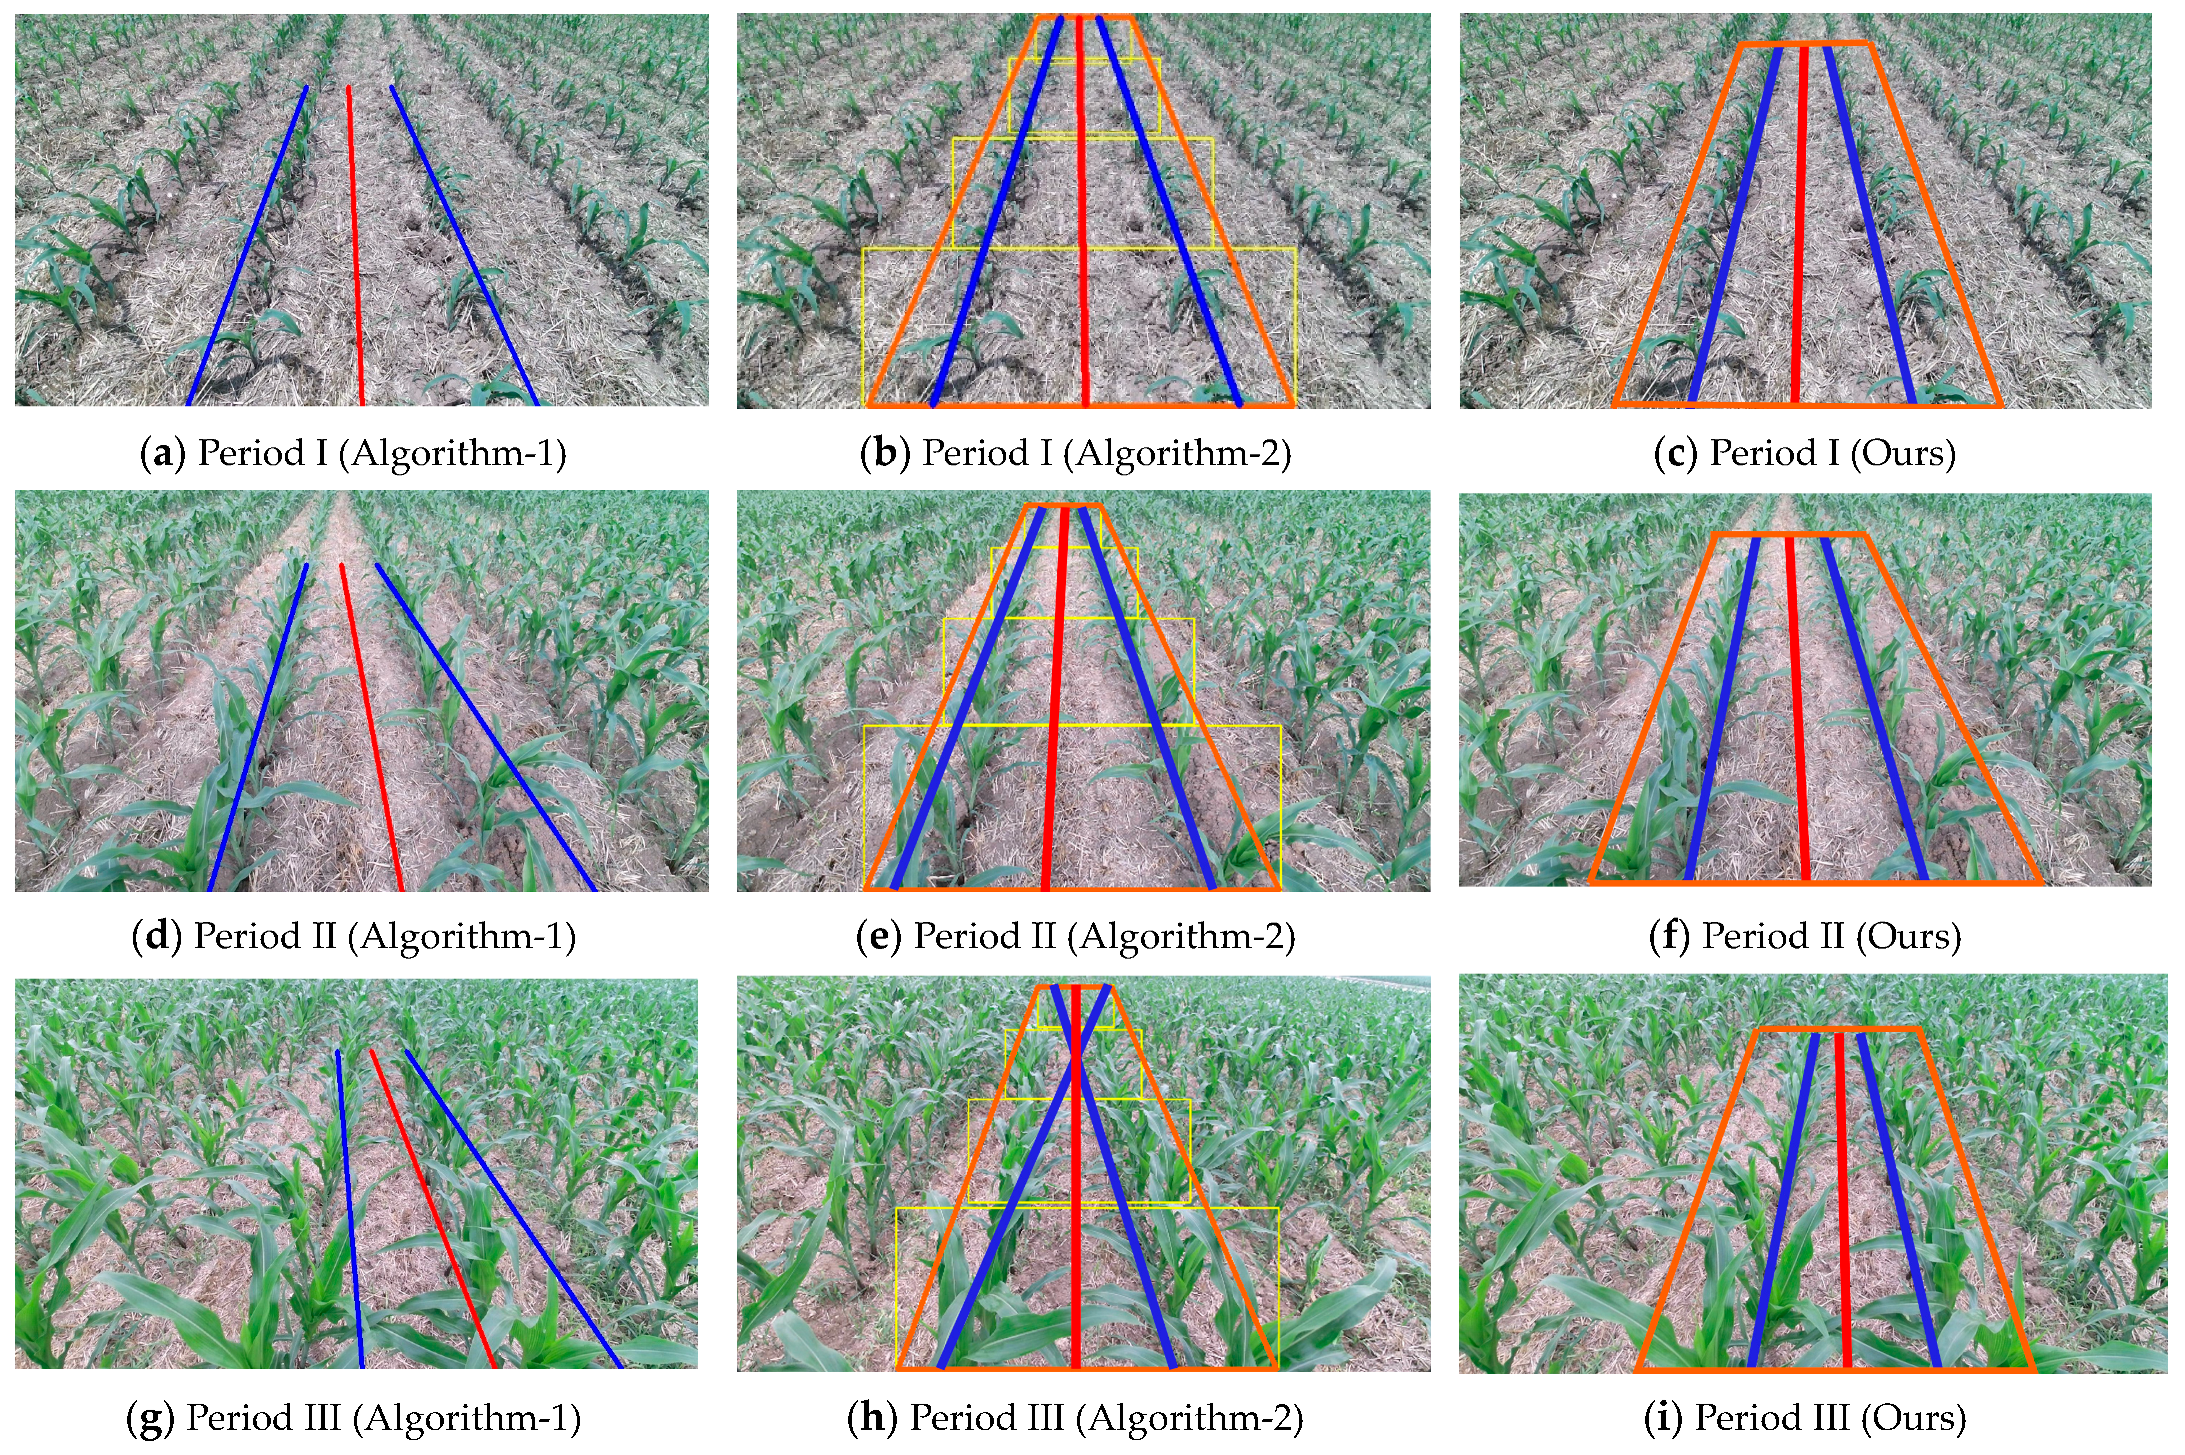
In order to verify the superiority of the proposed algorithm, 300 images were randomly selected in three time periods for a comparison test, and the detection line was compared with the manual calibration line. Then, the proposed algorithm was compared with the algorithms proposed by Zhou Y (2021, Algorithm-1) [23] and Yang Y (2023, Algorithm-2) [28]. The evaluation criteria included accuracy and real-time performance. The detection results of the three algorithms are shown in Figure 19. In Period-I and Period-II, all algorithms can basically complete the task of extracting navigation lines because of the simple field environment. However, as the crop continues to grow and reaches cycle III, both Algorithm-1 and Algorithm-2 become ineffective. This is because Algorithm-1 relied too much on vertical projection to extract feature points, and once the crop entered the middle and late stages, the canopy spreading leaves had a great influence on the extraction of feature points. Algorithm-2 relied too much on corner detection. In the later stage of the wide distribution of corn leaves, the extracted corner distribution became chaotic, and it was difficult to segment feature points and extract correct navigation lines. The accuracy and real-time performance of the three algorithms are compared in Table 5.
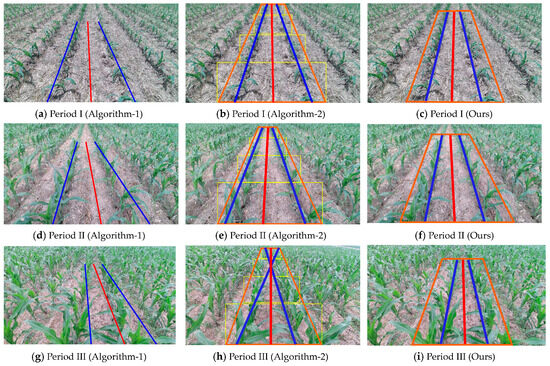
Figure 19.
Navigation line extraction results of different algorithms (the blue line is the crop row detection line, the red line is the navigation line, and the orange area is the ROI area): (a) Algorithm-1 extracts navigation lines in Period-I; (b) Algorithm-2 extracts navigation lines in Period-I; (c) Algorithm-ours extracts navigation lines in Period-I; (d) Algorithm-1 extracts navigation lines in Period-II; (e) Algorithm-2 extracts navigation lines in Period-II; (f) Algorithm-ours extracts navigation lines in Period-II; (g) Algorithm-1 extracts navigation lines in Period-III; (h) Algorithm-2 extracts navigation lines in Period-III; (i) Algorithm-ours extracts navigation lines in Period-III.
Table 5.
Comparison of accuracy and real-time performance of different algorithms.
3.3. Calculation of Heading Angle of Maize Field
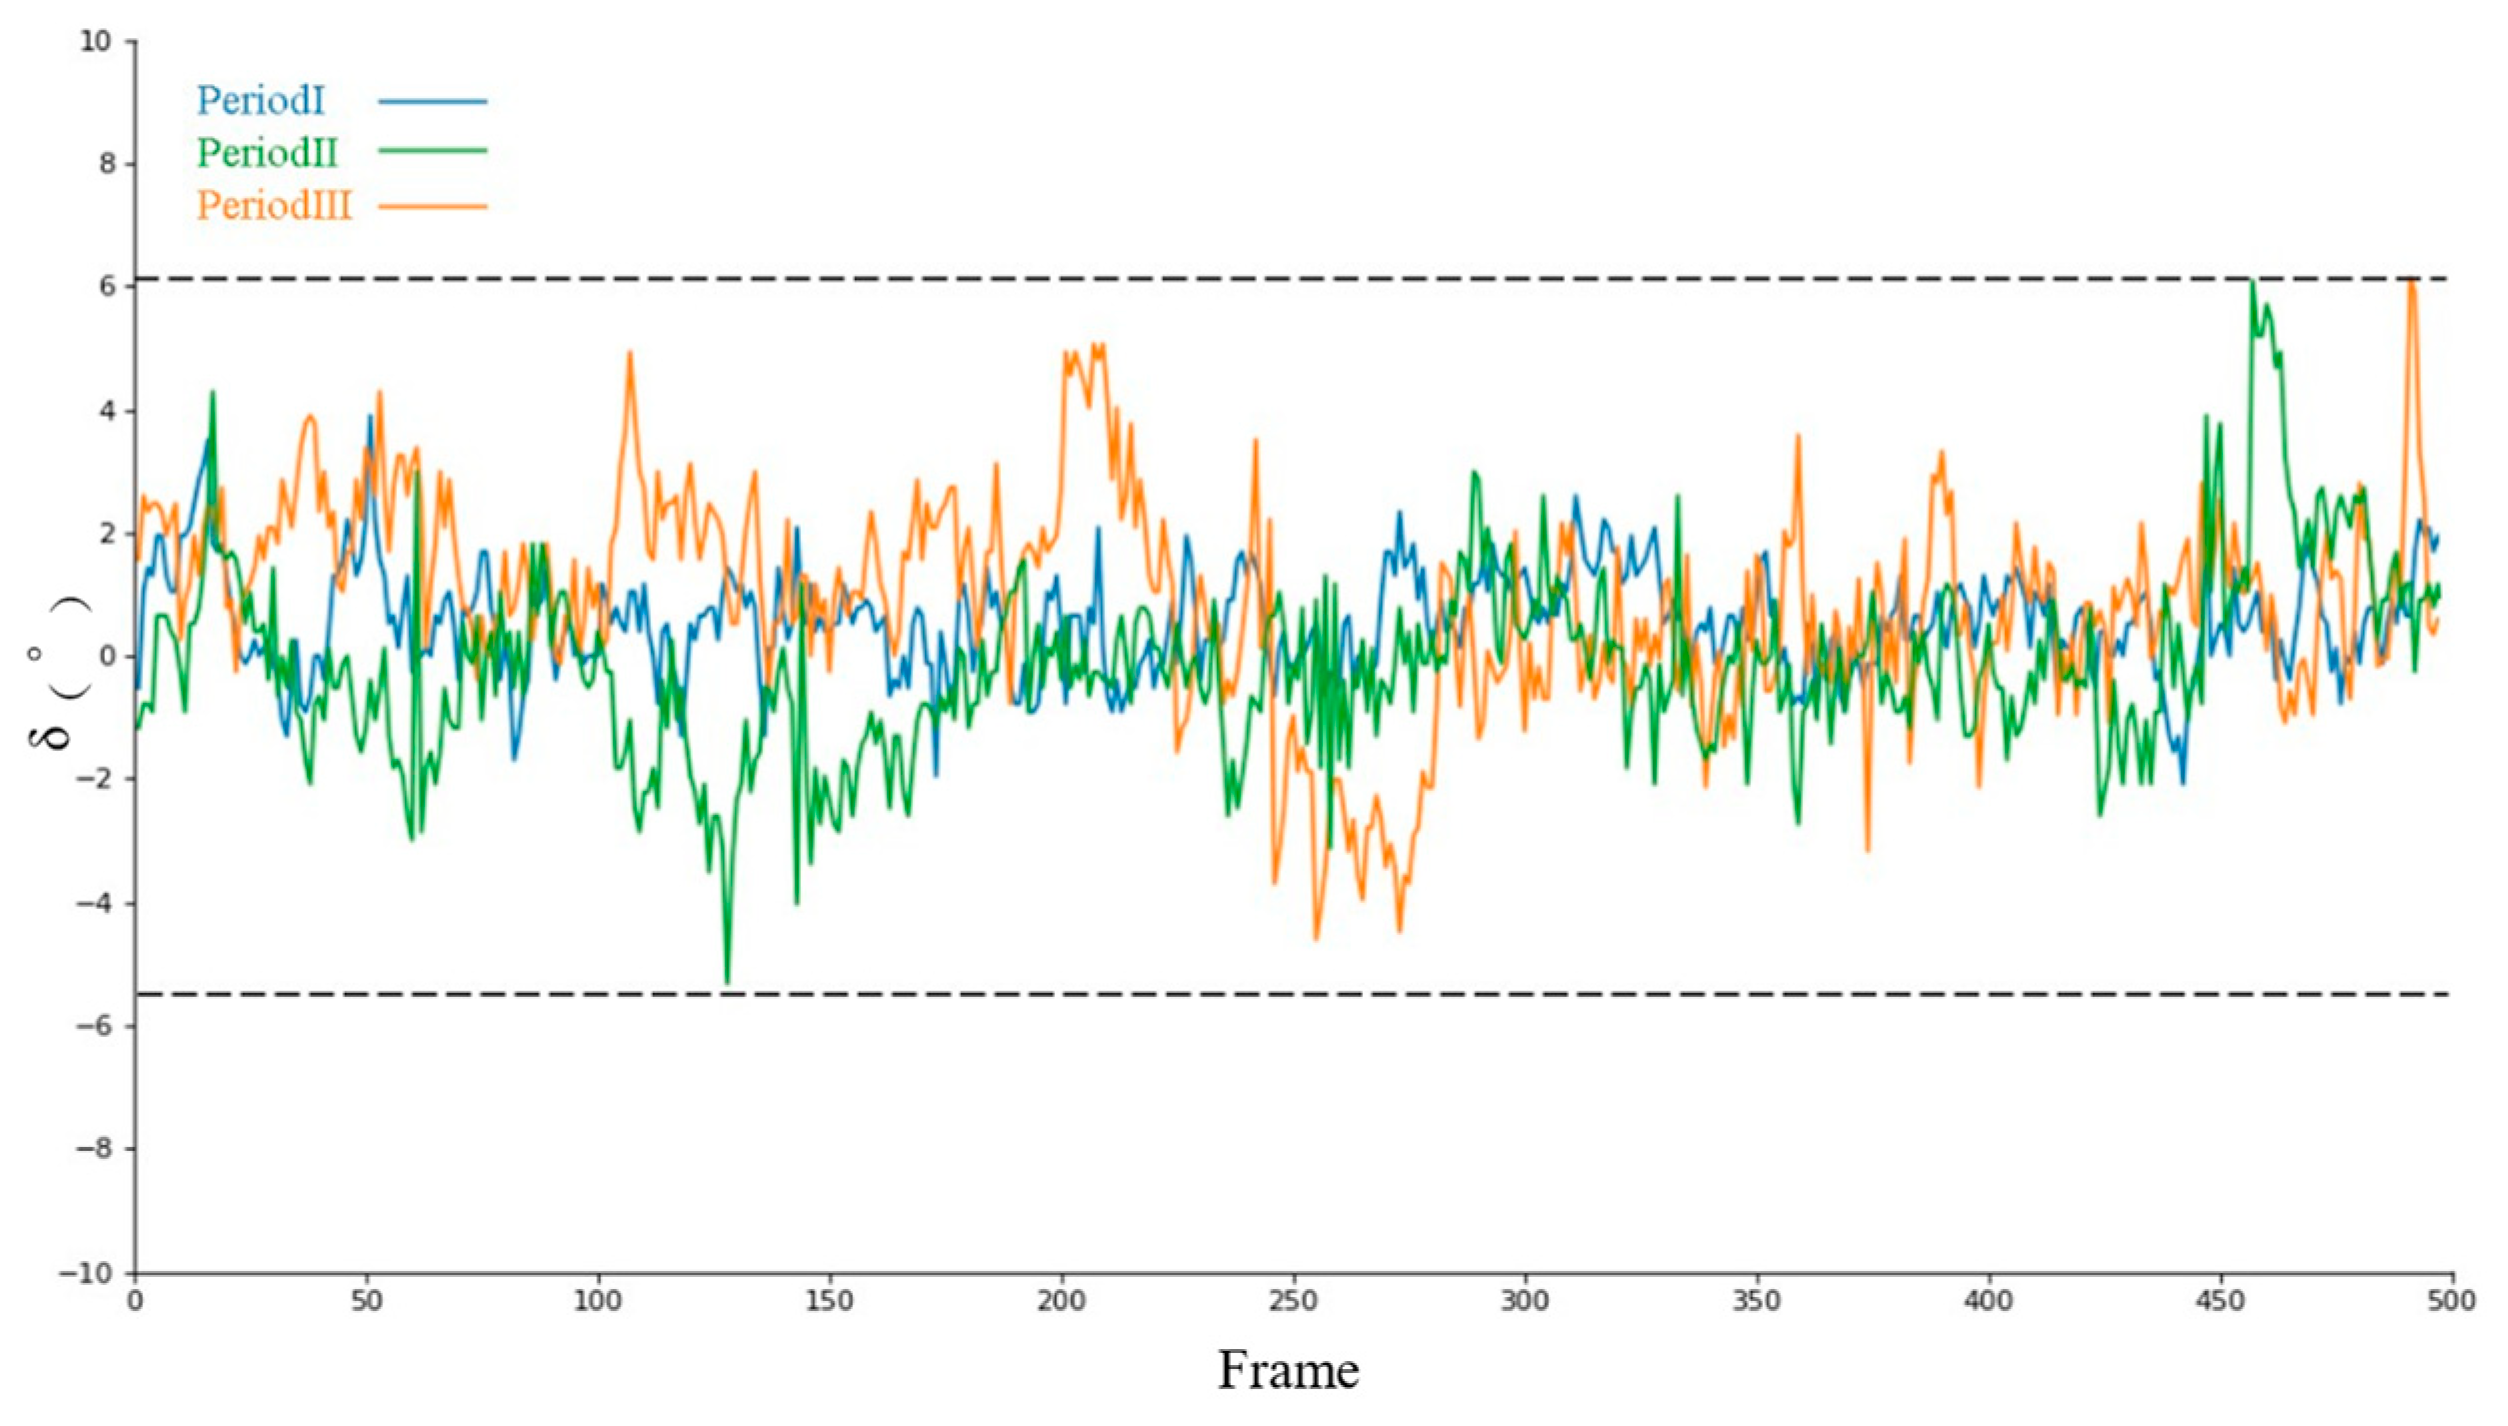
The heading angle is the angle between the central axis of the machine chassis and the navigation line, which was used to guide the machine to walk in the field. After the navigation line was extracted, the maize field heading angle δ can be calculated based on the machine chassis central axis, Y axis, and the slope K of the navigation line. The calculation formula is shown in Equation (10).
In Equation (10), δ is the heading angle, K is the slope of the navigation line, (X1, Y1) and (X2, Y2) are the coordinates of the upper and lower end points of the navigation line, respectively.
In order to test the robustness of the output heading angle of this algorithm, 500 frames of each video in three different periods were selected from the MaizeImageset for experiment, and we carried out visual analysis of the output heading angle curves in the three periods, as shown in Figure 20. Based on the algorithm proposed in this paper, the output heading angle can be stable in all three periods, and all float within ±6° without large fluctuations, which is consistent with the growth characteristics of maize crops. It can be seen that this algorithm can provide robust and reliable navigation planning for intelligent driving of field vehicles.
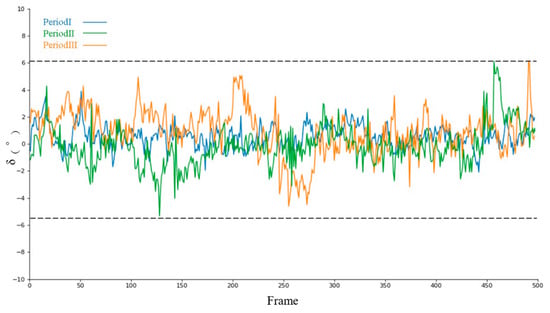
Figure 20.
Course angle output.
3.4. Comparison Experiment between Crop Canopy Row and Crop Root Row
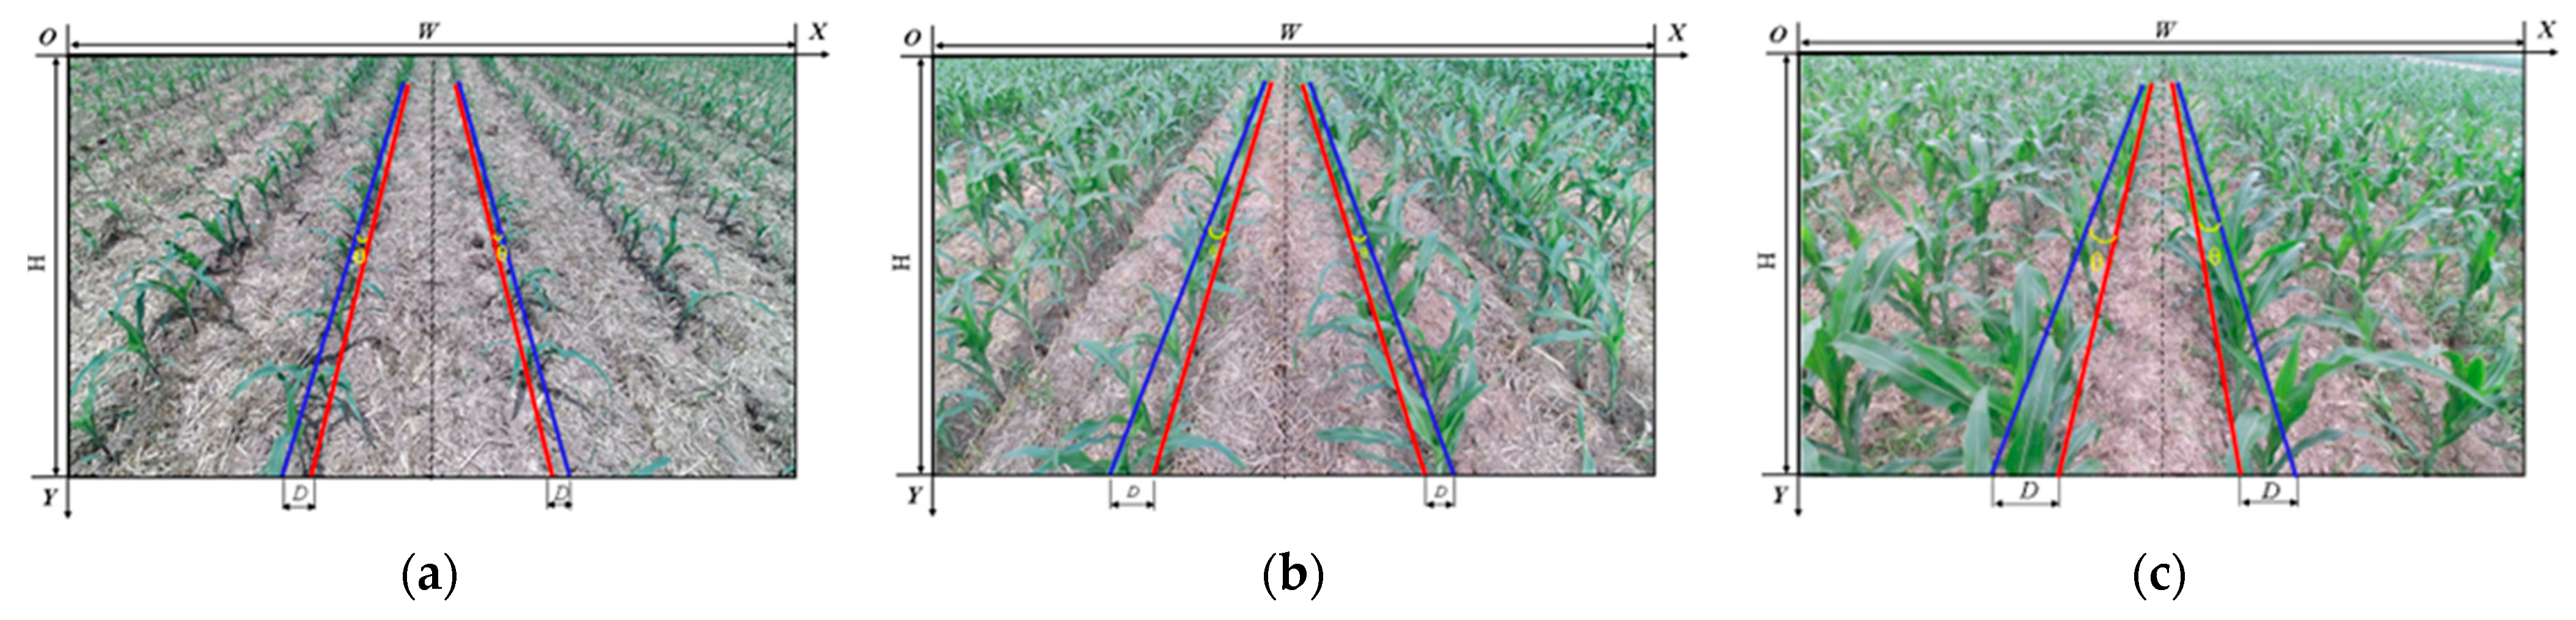
The crop root row can represent the real position of the crop row, and there is a big difference between the crop canopy row and the crop root row. Therefore, evaluation indexes, including distance error D and angle error θ, were constructed to analyze the difference between them, as shown in Figure 21. Again, 200 images were extracted from the three periods, respectively, for comparative statistics, and the results are shown in Table 6.
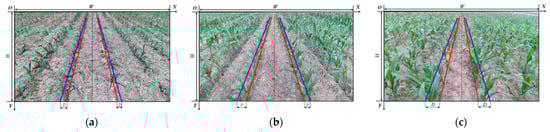
Figure 21.
Comparison of crop canopy detection line (Blue) and crop root line detection line (Red): (a) Comparison result of Period-I; (b) Comparison result of Period-II; (c) Comparison result of Period-III.
Table 6.
Comparative evaluation of crop canopy rows and crop root rows.
Based on the crop canopy image information and the Crop Root Representation Learning Model, the difficult problem of crop root row detection was solved. The crop root row detection line extracted by the algorithm can not only further extract the navigation line to guide agricultural machinery in the field using intelligent automatic row driving, but it can also guide agricultural machinery to carry out field row operations, including cultivation and fertilization, which is expected to have a very important significance in the field of intelligent agriculture.
4. Conclusions and Future Work
Aiming at the difficulty of crop root detection in the field of maize under a shaded environment, a crop root row detection algorithm based on crop canopy image information and a Representation Learning Method is proposed in this paper. Firstly, a maize field database was established for several periods, including high wind, high weed pressure, and lack of seedlings. The training dataset was obtained by labeling the canopy ROI. Secondly, the backbone network of DeeplabV3+ was replaced with a Moblienetv3 network to obtain a lightweight semantic segmentation network, and the dataset was trained to obtain the optimal model to predict the ROI of the maize canopy. Thirdly, the feature points were extracted by horizontal strip division and a midpoint clustering method, and the feature points were fitted by a least square method to obtain the crop canopy detection line. Fourthly, the Representation of the crop canopy row and the Representation of the root row were learned through the Crop Root Representation Learning Model to obtain the Alignment Equation. Finally, the detection line of the crop canopy was corrected according to the Alignment Equation parameters, and the detection line of the crop root row was obtained. The field navigation line and heading angle of the agricultural machinery were extracted according to the results of the crop root row detection line.
The algorithm proposed in this paper was compared with two popular algorithms based on machine vision in recent years, and video broadcast experiments were carried out in various environments. The experimental results show that the detection accuracy of the crop root row was 97.1%, the average error angle was 0.9°, the average processing time of a single frame image (960 × 540 pix) was 30.49 ms, and the navigation line extraction accuracy was 97%, all of which are superior to the comparison algorithm. In field applications, it can not only accurately guide agricultural machinery to achieve field intelligent driving, but also guide agricultural machinery to tillage, fertilization, and other field operations. This study also shows that when crop roots are seriously occluded by the crop canopy, crop root rows can still be detected indirectly by reasoning the relative positions of crop canopy rows and crop root rows, which can provide new ideas for subsequent crop root row detection. However, the research in this paper still has some limitations. Changes in the installation height and angle of the camera may affect the detection results, and the applicability of the algorithm is sometimes not good when applied to other high-stalk crops. In the future, the new neural network will continue to be built, in order to more accurately and quickly detect crop canopy ROIs; at the same time, it will explore being applied to different growing crops and without being limited by the sensor height or the angle of the crop root line detection algorithm. In addition, it is also necessary to construct a more complete evaluation system for the spatial relative position of the crop canopy and root.
Author Contributions
Y.L.: Conceptualization, Methodology, Software, Investigation, Writing; Y.G.: Resources, Supervision; X.W.: Visualization, Supervision, Writing—Review; Y.Y.: Conceptualization, Funding Acquisition, Resources, Writing—Review; J.Z.: Software, Data Curation; D.A.: Data Curation; H.H.: Data Curation; S.Z.: Software, Investigation; T.B.: Investigation. All authors have read and agreed to the published version of the manuscript.
Funding
The research in this article was funded by the National Natural Science Foundation of China project (32372003); National key research and development of China plan sub-topic (2022YFD2002001); Anhui Province University outstanding youth project (2022AH030090), National key laboratory open of China project (SKLIAPE2023012); Anhui Province key research and development plan project(2022i01020011).
Institutional Review Board Statement
Not applicable.
Data Availability Statement
Data are contained within the article.
Conflicts of Interest
The authors declare that they have no known competing financial interest or personal relationship that could have appeared to influence the work reported in this paper.
References
- Gonzalez-de-Santos, P.; Fernández, R.; Sepúlveda, D.; Navas, E.; Emmi, L.; Armada, M. Field robots for intelligent farms—Inhering features from industry. Agronomy 2020, 10, 1638. [Google Scholar] [CrossRef]
- Li, D.; Li, B.; Long, S.; Feng, H.; Xi, T.; Kang, S.; Wang, J. Rice seedling row detection based on morphological anchor points of rice stems. Biosyst. Eng. 2023, 226, 71–85. [Google Scholar] [CrossRef]
- Tang, Y.; Chen, M.; Wang, C.; Luo, L.; Li, J.; Lian, G.; Zou, X. Recognition and localization methods for vision-based fruit picking robots: A review. Front. Plant Sci. 2020, 11, 510. [Google Scholar] [CrossRef] [PubMed]
- Xu, G.F.; Chen, M.Z.; He, X.K.; Pang, H.; Miao, H.; Cui, P.; Wang, W.; Diao, P. Path following control of tractor with an electro-hydraulic coupling steering system: Layered multi-loop robust control architecture. Biosyst. Eng. 2021, 209, 282–299. [Google Scholar] [CrossRef]
- Sui, M.; Chen, K.; Shen, F. Monitoring of wheat height based on multi-GNSS reflected signals. Remote Sens. 2022, 14, 4955. [Google Scholar] [CrossRef]
- Jing, Y.; Liu, G.; Luo, C. Path tracking control with slip compensation of a global navigation satellite system based tractor-scraper land levelling system. Biosyst. Eng. 2021, 212, 360–377. [Google Scholar] [CrossRef]
- Ruan, Z.; Chang, P.; Cui, S.; Luo, J.; Gao, R.; Su, Z. A precise crop row detection algorithm in complex farmland for unmanned agricultural machines. Biosyst. Eng. 2023, 232, 1–12. [Google Scholar] [CrossRef]
- Wei, J.; Zhang, M.; Wu, C.; Ma, Q.; Wang, W.; Wan, C. Accurate crop row recognition of maize at the seedling stage using lightweight network. Int. J. Agric. Biol. Eng. 2024, 17, 189–198. [Google Scholar] [CrossRef]
- Rabab, S.; Badenhorst, P.; Chen, Y.; Daetwyler, H.D. A template-free machine vision-based crop row detection algorithm. Precis. Agric. 2021, 22, 124–153. [Google Scholar] [CrossRef]
- Cao, M.; Tang, F.; Ji, P.; Ma, F. Improved real-time semantic segmentation network model for crop vision navigation line detection. Front. Plant Sci. 2022, 13, 898131. [Google Scholar] [CrossRef]
- Li, D.; Li, B.; Kang, S.; Feng, H.; Long, S.; Wang, J. E2CropDet: An efficient end-to-end solution to crop row detection. Expert Syst. Appl. 2023, 227, 120345. [Google Scholar] [CrossRef]
- Ma, Z.; Tao, Z.; Du, X.; Yu, Y.; Wu, C. Automatic detection of crop root rows in paddy fields based on straight-line clustering algorithm and supervised learning method. Biosyst. Eng. 2021, 211, 63–76. [Google Scholar] [CrossRef]
- Hough, P.V.C. Method and Means for Recognizing Complex Patterns. U.S. Patent 3,069,654, 18 December 1962. [Google Scholar]
- Bakker, T.; Bontsema, J.; Müller, J. Systematic design of an autonomous platform for robotic weeding. J. Terramechanics 2010, 47, 63–73. [Google Scholar] [CrossRef]
- Ji, R.; Qi, L. Crop-row detection algorithm based on Random Hough Transformation. Math. Comput. Model. 2011, 54, 1016–1020. [Google Scholar] [CrossRef]
- Winterhalter, W.; Fleckenstein, F.V.; Dornhege, C.; Burgard, W. Crop row detection on tiny plants with the pattern hough transform. IEEE Robot. Autom. Lett. 2018, 3, 3394–3401. [Google Scholar] [CrossRef]
- Chen, Z.; Li, W.; Zhang, W.; Li, Y.; Li, M.; Li, H. Vegetable crop row extraction method based on accumulation threshold of Hough Transformation. Trans. CSAE 2019, 35, 314–322. [Google Scholar]
- Pla, F.; Sanchiz, J.M.; Marchant, J.A.; Brivot, R. Building perspective models to guide a row crop navigation vehicle. Image Vis. Comput. 1997, 15, 465–473. [Google Scholar] [CrossRef]
- Jiang, G.; Wang, X.; Wang, Z.; Liu, H. Wheat rows detection at the early growth stage based on Hough transform and vanishing point. Comput. Electron. Agric. 2016, 123, 211–223. [Google Scholar] [CrossRef]
- Li, D.; Dong, C.; Li, B.; Wang, Y.; Wang, J. Hybrid rice row detection at the pollination stage based on vanishing point and line-scanning method. Precis. Agric. 2023, 24, 921–947. [Google Scholar] [CrossRef]
- Montalvo, M.; Pajares, G.; Guerrero, J.M.; Romeo, J.; Guijarro, M.; Ribeiro, A.; Ruz, J.; Cruz, J. Automatic detection of crop rows in maize fields with high weeds pressure. Expert Syst. Appl. 2012, 39, 11889–11897. [Google Scholar] [CrossRef]
- Yang, Y.; Zhang, B.; Zha, J.; Wen, X.; Chen, L.; Zhang, T.; Dong, X.; Yang, X. Real-time extraction of navigation line between corn rows. Trans. Chin. Soc. Agric. Eng. 2020, 36, 162–171. [Google Scholar]
- Zhou, Y.; Yang, Y.; Zhang, B.; Wen, X.; Yue, X.; Chen, L. Autonomous detection of crop rows based on adaptive multi-ROI in maize fields. Int. J. Agric. Biol. Eng. 2021, 14, 217–225. [Google Scholar] [CrossRef]
- Yang, Z.; Yang, Y.; Li, C.; Zhou, Y.; Zhang, X.; Yu, Y.; Liu, D. Tasseled Crop Rows Detection Based on Micro-Region of Interest and Logarithmic Transformation. Front. Plant Sci. 2022, 13, 916474. [Google Scholar] [CrossRef] [PubMed]
- Lin, Y.K.; Chen, S.F. Development of navigation system for tea field machine using semantic segmentation. IFAC-Pap. OnLine 2019, 52, 108–113. [Google Scholar] [CrossRef]
- Ponnambalam, V.R.; Bakken, M.; Moore, R.J.D.; Gjevestad, J.G.O.; From, P.J. Autonomous crop row guidance using adaptive multi-roi in strawberry fields. Sensors 2020, 20, 5249. [Google Scholar] [CrossRef] [PubMed]
- Pang, Y.; Shi, Y.; Gao, S.; Jiang, F.; Veeranampalayam-Sivakumar, A.-N.; Thompson, L.; Luck, J.; Liu, C. Improved crop row detection with deep neural network for early-season maize stand count in UAV imagery. Comput. Electron. Agric. 2020, 178, 105766. [Google Scholar] [CrossRef]
- Yang, Y.; Zhou, Y.; Yue, X.; Zhang, G.; Wen, X.; Ma, B.; Xu, L.; Chen, L. Real-time detection of crop rows in maize fields based on autonomous extraction of ROI. Expert Syst. Appl. 2023, 213, 118826. [Google Scholar] [CrossRef]
- Chen, L.C.; Zhu, Y.; Papandreou, G.; Schroff, F.; Adam, H. Encoder-decoder with atrous separable convolution for semantic image segmentation. In Proceedings of the European Conference on Computer Vision, Munich, Germany, 8–14 September 2018; pp. 801–818. [Google Scholar]
- Wang, C.; Du, P.; Wu, H.; Li, J.; Zhao, C.; Zhu, H. A cucumber leaf disease severity classification method based on the fusion of DeepLabV3+ and U-Net. Comput. Electron. Agric. 2021, 189, 106373. [Google Scholar] [CrossRef]
- Ji, A.; Xue, X.; Wang, Y.; Luo, X.; Xue, W. An integrated approach to automatic pixel-level crack detection and quantification of asphalt pavement. Autom. Constr. 2020, 114, 103176. [Google Scholar] [CrossRef]
- Wu, Z.; Tang, Y.; Hong, B.; Liang, B.; Liu, Y. Enhanced precision in dam crack width measurement: Leveraging advanced lightweight network identification for pixel-level accuracy. Int. J. Intell. Syst. 2023, 2023, 9940881. [Google Scholar] [CrossRef]
- Chen, M.; Wu, J.; Liu, L.; Zhao, W.; Tian, F.; Shen, Q.; Zhao, B.; Du, R. DR-Net: An improved network for building extraction from high resolution remote sensing image. Remote Sens. 2021, 13, 294. [Google Scholar] [CrossRef]
- Zhou, Z.; Zhang, J.; Gong, C. Hybrid semantic segmentation for tunnel lining cracks based on Swin Transformer and convolutional neural network. Comput.-Aided Civ. Infrastruct. Eng. 2023, 38, 2491–2510. [Google Scholar] [CrossRef]
- Chen, L.C.; Papandreou, G.; Kokkinos, I.; Murphy, K.; Yuille, A.L. Deeplab: Semantic image segmentation with deep convolutional nets, atrous convolution, and fully connected crfs. IEEE Trans. Pattern Anal. Mach. Intell. 2017, 40, 834–848. [Google Scholar] [CrossRef] [PubMed]
- Chollet, F. Xception: Deep learning with depthwise separable convolutions. In Proceedings of the IEEE Conference on Computer Vision and Pattern Recognition, Honolulu, HI, USA, 21–26 July 2017; pp. 1251–1258. [Google Scholar]
- Howard, A.; Sandler, M.; Chu, G.; Chen, L.C.; Chen, B.; Tan, M.; Wang, W.; Zhu, Y.; Pang, R.; Vasudevan, V.; et al. Searching for mobilenetv3. In Proceedings of the IEEE/CVF International Conference on Computer Vision, Seoul, Republic of Korea, 27 October–2 November 2019; pp. 1314–1324. [Google Scholar]
- Ronneberger, O.; Fischer, P.; Brox, T. U-net: Convolutional networks for biomedical image segmentation. In Medical Image Computing and Computer-Assisted Intervention–MICCAI 2015; Springer International Publishing: Cham, Switzerland, 2015; pp. 234–241. [Google Scholar]
- Zhao, H.; Shi, J.; Qi, X.; Wang, X.; Jia, J. Pyramid scene parsing network. In Proceedings of the IEEE Conference on Computer Vision and Pattern Recognition, Honolulu, HI, USA, 21–26 July 2017; pp. 2881–2890. [Google Scholar]
- He, K.; Zhang, X.; Ren, S.; Sun, J. Deep residual learning for image recognition. In Proceedings of the IEEE Conference on Computer Vision and Pattern Recognition, Las Vegas, NV, USA, 27–30 June 2016; pp. 770–778. [Google Scholar]

Disclaimer/Publisher’s Note: The statements, opinions and data contained in all publications are solely those of the individual author(s) and contributor(s) and not of MDPI and/or the editor(s). MDPI and/or the editor(s) disclaim responsibility for any injury to people or property resulting from any ideas, methods, instructions or products referred to in the content. |
© 2024 by the authors. Licensee MDPI, Basel, Switzerland. This article is an open access article distributed under the terms and conditions of the Creative Commons Attribution (CC BY) license (https://creativecommons.org/licenses/by/4.0/).