Abstract
Potassium (K) deficiency in corn is an emerging concern, especially when the crop is exposed to stress conditions. The insufficient replenishment of K in soil heightens the severity. A good K management requires adequate knowledge of its effect on plant growth and physiology. A sunlit growth chamber study was conducted under five levels of potassium concentrations, 100% (control; 193 ppm), 40%, 20%, 5%, and 0%, using modified Hoagland’s nutrient solution applied at first leaf stage and continued until tasseling. The plant growth and development were monitored at different growth stages. Physiological parameters were measured at the tasseling stage. Significant differences (p < 0.05 to 0.001) in plant growth and physiological parameters were recorded in response to potassium rates. The 0% K treatment reduced the leaf K content and addition of leaf area day−1 by 85% and 8%, respectively, compared to the control. The rate of total biomass accumulation reduced to 5.4 g day−1 under 0% K compared to 7.7 g day−1 under the control. The root-to-shoot ratio increased to 0.33 at 5% K compared to 0.16 at the control treatment. The photosynthetic rate was reduced by 30% and 35% under 5% and 0% potassium concentrations, respectively, compared to the control. The 0% K deficiency decreased the stomatal conductance by 60% over control, lowering the internal CO2 level and transpiration. Linear and quadratic relationships were observed between leaf K content and electron transport rate (R2 = 0.98) and transpiration rate (R2 = 0.96), respectively. The functional relationships generated from this study will help improve corn models for field applications.
1. Introduction
With the world population doubling since the 1960s, reaching seven billion, the imperative for increased crop production is starkly evident. This surge necessitates meeting future food and energy needs while preserving ecological resources. Compounded by escalating climate challenges like heat and drought, ensuring food security demands the efficient optimization of crop yields [1]. Enhanced production per unit area requires a greater need for commercial fertilizers [2]. Among vital nutrients, potassium (K) emerges as pivotal, highlighting the urgency for balanced agricultural practices. K is the seventh most abundant element, comprising 2.1 to 2.3% portion of the Earth’s crust [3]. However, soil K is not entirely suitable for plant absorption. Approximately 0.1 to 0.2% of total soil K is available in soil solution, which is readily available to plants, and the soil test results only measure this fraction. The remaining fractions constitute exchangeable (1–2%), non-exchangeable (1–2%), and unavailable forms (96–99%) [4]. K constitutes 1 to 4% of the plant’s dry weight, and the absorption varies with species [3]. The major K fertilizers are potassium chloride, potassium sulfate, and potassium nitrate.
The third agricultural green revolution has led to fertilizer-intensive cropping systems developing hybrids and varieties that utilize high doses of inorganic fertilizers [5]. Currently, the USA and China use 40% of the global K fertilizers [3]. The approximate K consumption in the USA is 4.5 million metric tons, with use per area of cropland of 25.2 kg ha−1 and per capita use of 13.3 kg [6]. Corn is a major global agricultural crop, producing 1.2 billion metric tons worldwide [7], with the USA leading production at approximately 390 million metric tons [8]. However, its high K demand, removing 4.5 g K kg−1 of grain [9], poses challenges due to inefficient replenishment. It has been estimated that only 35% of the soil K is replenished through K fertilization [10]. Since the world’s K use efficiency is only 19% [11], optimizing K management becomes essential for sustainable corn production, as well as for increasing the nitrogen and phosphorus use efficiency [12].
K is highly mobile in plants and is the most abundant cation. It has been recognized for its role in enhancing plant resilience against pests and diseases [13], facilitating photosynthesis, enzyme activation, and osmoregulation [14], and maintaining ion homeostasis and protein synthesis [15]. Additionally, it contributes to the stability of interactions between monovalent and divalent cations within plants [16,17]. Thus, K limitations in plants result in impaired plant physiological functions [18,19]. Photosynthetic activity is observed to decline in instances of K deficiency [19]. The initial signs of chlorophyll breakdown become apparent through distinct symptoms such as browning, scorching, and curling of leaf tips and margins, alongside the development of chlorosis [20].
Despite extensive research on its impact on plant systems, there remains a gap in studies concerning the development of a functional relationship between plant K content and key physiological and growth processes. Such insights are crucial for integrating a subroutine for plant K in corn models. Given the heightened global climate change, crop yield predictions are focal in addressing food security [21]. To date, no existing corn models have incorporated K as a factor in simulating either seed yield [22,23] or energy, growth, developmental, and gas exchange parameters [24]. Given the irreplaceable contribution of K to plant physiology and growth, the current study is directed to fill the gap by deriving the key physiological, growth, and biomass traits as a function of leaf K content in corn. The study aimed to achieve the following objectives: (i) comprehend the impact of K deficiency on corn performance across vegetative growth stages, (ii) establish functional relationships between leaf K content and critical plant traits, and (iii) determine the plant trait most susceptible to leaf K deficiency.
2. Materials and Methods
2.1. Experimental Facility
The experiment was carried out in the Soil-Plant-Atmosphere-Research (SPAR) facility at the Environmental Plant Physiology Laboratory, Mississippi State University, MS, USA. This facility contains a metal bin at the bottom and a Plexiglass chamber on the top to hold roots and plant canopy, respectively. The plexiglass permits 97% of the solar radiation to the chambers, allowing the plants to grow under natural sunlit conditions, unlike indoor growth chambers. The facility precisely controls the specified temperature and CO2 through an automated control system. The water and nutrients are supplied through Hoagland’s solution [25] by a semi-automated drip irrigation system. Reddy and Zhao described the details and specifications of the SPAR facility [26].
2.2. Experimental Setup and Treatment
Seeds of corn hybrid, PGY9114VT2P, standardized for rainfed cultivation in Mississippi were sown in 5.5 L polyvinyl chloride pots (0.15 m diameter × 0.3 m height) filled with fine sand and topsoil mix (3:1 ratio) (87% sand, 2% clay, and 11% silt). The pots contained a hole of 1 cm diameter at the bottom and were filled with 250 g of pea gravel to facilitate drainage. Thirty pots were arranged in 10 rows, with 3 pots per row in each of the five SPAR facilities, amounting to a total of 150 pots for the study across five different K treatments. Four seeds were sown in each pot and were thinned to one plant per pot after the first leaf stage. All the SPAR chambers were maintained at a day/night temperature of 30/22 °C, 70% relative humidity, and 425 µmol mol−1 CO2, creating optimum growing conditions for corn. The plants were irrigated with full-strength Hoagland’s nutrient solution until the first leaf stage through an automated and computer-controlled drip system. The irrigation volume was continuously adjusted based on the evapotranspiration [27].
After the first leaf stage, five K treatments were applied in each SPAR unit by modifying the K concentration in Hoagland’s solution up to the tasseling stage. Among the five treatments, the control (100%; 193 ppm) received the full-strength Hoagland’s nutrient solution (Table S1). The remaining treatments received 40%, 20%, 5%, and 0% levels of K in the Hoagland solution compared to the control [26]. The remaining nutrients in the solution were kept constant. The plants were exposed to K treatments up to the tasseling stage. The experiment followed a split-plot design with K treatment as the main plot and harvest stages as a subplot.
2.3. Trait Measurements
The growth and biomass accumulation of six corn plants at different K levels were destructively measured at four growth stages: fourth (V4), sixth (V6), tenth (V10) leaf stages, and tasseling stage (VT). The plants were cut at the soil surface, and the plant height (cm) was measured from the base of the culm to the collar region. The leaf area was recorded using the LI-3100 leaf area meter (LI-COR, Inc., Lincoln, NE, USA). The plants were separated into leaves, stems, and roots, and the dry weight was recorded after oven drying at 75 °C for five days. The sum of leaf dry weight and stem dry weight was expressed as shoot dry weight. The total dry weight was obtained by adding shoot dry weight and root dry weight. All the dry weights were expressed in g plant−1. The root-to-shoot ratio was computed by dividing root dry weight by shoot dry weight. The leaf macronutrients (nitrogen (N), phosphorus (P), potassium (K), calcium (Ca), magnesium (Mg), and sulfur (S)) and micronutrients (boron (B), iron (Fe), manganese (Mn), copper (Cu), and zinc (Zn)) contents were analyzed during four growth stages. Five grams of dried leaves from each harvest were ground using a laboratory mill, and the mineral content was analyzed through standard protocols at the soil testing laboratory of Mississippi State University, Mississippi State, MS, USA. The leaf N concentration was analyzed using one gram of dried leaf tissue with an organic elemental analyzer (Vario MAX cube, Ronkonkoma, NY, USA) through dry combustion [28]. All the other macro- and micronutrients were analyzed using ICP Spectrophotometer (Spectro Analytical Instruments, Wilmington, MA, USA) by ashing 0.5 g of dried and ground leaf tissues in a furnace at 500 °C, then diluting the ash in HCl acid to take the nutrient concentration [29].
The physiology of the plants was measured on the uppermost fully expanded leaves at the tasseling stage using a portable photosynthesis system (LI-6400, LI-COR Environmental, Lincoln, NE, USA) between 11.00 and 13.00 h. All the gas exchange measurements were recorded on three plants from each treatment. The leaf net photosynthetic rate (PN), stomatal conductance (gsw), transpiration, leaf internal CO2 to ambient CO2 ratio (Ci/Ca), photosystem II efficiency (PhiPS2), and electron transport rate (ETR) of light-adapted leaves were measured simultaneously. The conditions for leaf stabilization were 30 °C leaf temperature, 40–50% relative humidity, 425 µmol mol−1 CO2 concentration, 1500 µmol m−2 s−1 photosynthetic active radiation, and 500 µmol s−1 flow rate.
2.4. Data Analysis
The analysis of variance was ascertained using the split-plot design to determine the effect of K treatments (the main plot), growth stages (the subplot), and their interactions with corn growth, biomass, and physiology in R studio (version 4.3.1) using the ‘doebioresearch’ package [30]. A completely randomized design analysis was performed to determine the impact of K treatments on growth, biomass, and physiology parameters under each growth stage. Graphical representations of the outcomes and the functional relationships were generated using Sigma Plot 13.0 (Systat Software Inc., San Jose, CA, USA).
2.5. Environmental Productivity Indices
The normalized representation of the effect of K deficiency on plant growth and development-related traits was employed through the environmental productivity index (EPI) [31,32]. The functional relationship between plant growth and physiology trait with leaf K content was obtained through regression analysis using either a linear or quadratic model in Sigma Plot 13.0. The trait values obtained for each leaf K content were divided by the value obtained through the functional relationship of the trait at the highest leaf K content attained in the study. These resulted in obtaining an index ranging from 0 (where leaf K deficiency entirely limits the trait) to 1 (where leaf K deficiency does not limit the trait).
3. Results
3.1. Growth Rate Influenced by K Deficiency
The plant growth stages and K treatments affected the leaf K content (p < 0.001) of corn (Figure 1). A 49% reduction in leaf K content (dry weight basis) was observed at VT compared to V4 under control (Figure 1). The high K deficiency (0% K) reduced the leaf K content to 2.5% and 0.35% at the V4 and VT stages, respectively, compared to 4.7% and 2.4% under control. An average of 2%, 3%, 3%, 4%, and 5% reduction in leaf K content was observed per day in control, 40%, 20%, 5%, and 0% K treatments, respectively.
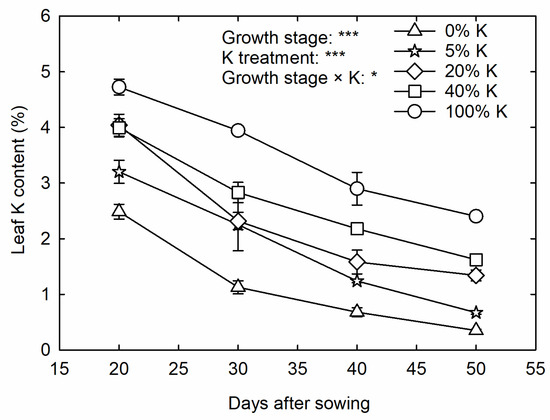
Figure 1.
The temporal leaf potassium (K) content in corn under five K treatments. The split-plot analysis of variance was performed to derive the treatment effects on leaf K content. * and *** indicates significance at p < 0.5 and p < 0.001, respectively. (The measurement dates of leaf K content at 20, 30, 40, and 50 days after sowing coincides with V4, V6, V10, and VT corn growth stages, respectively).
The plant height and leaf area differed (p < 0.001) between the harvests in corn. The K treatments did not influence the plant height and significantly affected the leaf area (p < 0.001; Figure 2). A notable increase in plant height was observed between the growth stages, with the addition of 6.5 cm of culm every day in control and 6.3 cm addition under 5% and 0% K (Figure 2A). Among the evaluated growth stages, V10 to VT stages had a rapid rate of plant growth. Under control, the leaf area was added at a rate of 228 cm2 plant−1 day−1, while the 5% and 0% K reduced the leaf growth to 214 and 209 cm2 plant−1 day−1, respectively (Figure 2B). On the other hand, 20% and 40% K added the leaf area at a rate of 235 and 236 cm2 plant−1 day−1, respectively. The K deficiency reduced the leaf area during the V4, V6, and VT growth stages. Under control, the plants added 84 cm2 plant−1 day−1 leaf area from V10 to VT stage, while the addition from V6 to V10 was 374 cm2 plant−1 day−1. When the plants grew under 0% K, these growth rates were 56 and 370 cm2 plant−1 day−1 from V10 to VT and V6 to V10 growth stages, respectively. While at 5% K and 20% K, it was 59 and 56 cm2 plant−1 day−1 from V10 to VT stage and 407 and 429 cm2 plant−1 day−1 from V6 to V10 stages. The K treatments resulted in a notable difference in total biomass accumulation and root-to-shoot ratio (p < 0.05 and p < 0.01, respectively) (Figure 3). The rapid increase in total dry matter accumulation was observed from the V10 to VT stage with an accumulation of 10 g dry weight plant−1 day−1 under control (Figure 3A). At the same time, 0% K treatment reduced the dry matter production to 5.4 g dry weight plant−1 day−1. On the contrary, the root-to-shoot ratio of plants decreased upon growth (Figure 3B). Across the treatments, the root-to-shoot ratio of V4 (0.69) and V6 (0.74) stages was nonsignificant, and further growth retarded the root growth with a root-to-shoot ratio of 0.32 at V10 and 0.23 at VT.
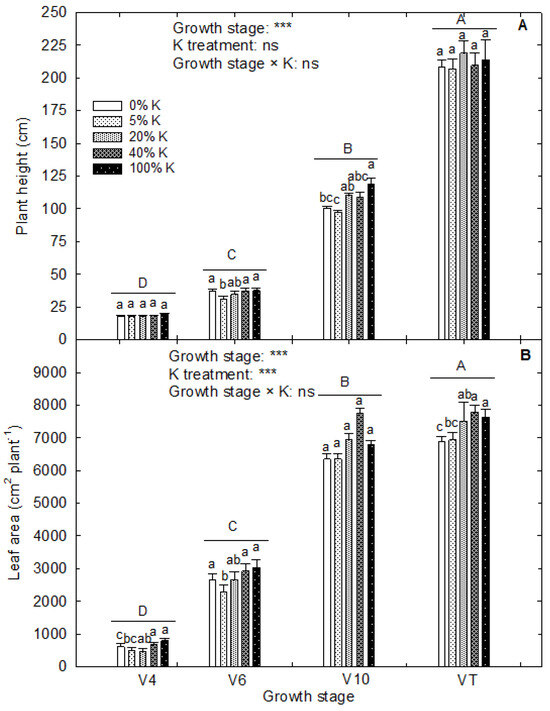
Figure 2.
Effect of potassium treatments on (A) plant height and (B) leaf area of corn at different vegetative growth stages (V4: 4th leaf; V6: 6th leaf; V10: 10th leaf; VT: tasseling stage) in corn. The vertical bars are the mean ± standard error of six replications. The analysis of variance is derived from the split-plot design. A completely randomized design analysis was performed to derive the least differences (LSDs) within four growth stages across K treatments and K treatments under each growth stage. The capital and small letters above each bar indicate the statistical significance between different growth stages and between five K treatments under each growth stage, respectively. Treatments with the same letters are nonsignificant. *** indicates significance at p < 0.001. ‘ns’ indicates nonsignificance.
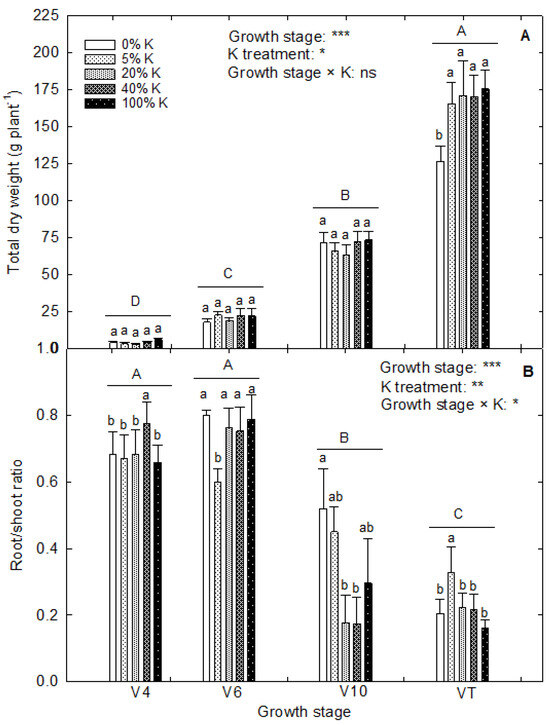
Figure 3.
Effect of potassium treatments on (A) total dry weight and (B) root-to-shoot ratio of corn at different vegetative growth stages (V4: 4th leaf; V6: 6th leaf; V10: 10th leaf; VT: tasseling stage) in corn. The vertical bars are the mean ± standard error of six replications. The analysis of variance is derived from the split-plot design. A completely randomized design analysis was performed to derive the least significant differences (LSDs) among four growth stages across K treatments and K treatments under each growth stage. The capital and small letters above each bar indicate the statistical significance between different growth stages and between five K treatments under each growth stage, respectively. Treatments with the same letters are nonsignificant. *, **, and *** indicate significance at p < 0.05, p < 0.01, and p < 0.001, respectively. ‘ns’ indicates nonsignificance.
3.2. Effect of K Deficiency on Other Mineral Compositions
The growth stages and K treatments affected the mineral nutrient compositions of leaves (p < 0.05 to p < 0.001) (Table 1). The K treatments did not influence the accumulation of Fe and Zn contents in the leaf. The N and P increased with an increase in leaf K content (Figure 4A,B). Like K, the advancement of plant growth reduced the percent composition of these nutrients in the leaf (Table S2). A reduction of 44%, 38%, 42%, 45%, and 34% was observed in leaf N content under 0%, 5%, 20%, 40%, and control treatments, respectively, from the V4 to VT stage. Similarly, the leaf P content decreased by 53%, 42%, 57%, 64%, and 31% under 0%, 5%, 20%, 40%, and control treatments, respectively, from the V4 to VT stage. At the VT stage, the leaf N and P contents in the control were 2.94% and 0.31%, respectively, while they reduced to 2.74% and 0.18% under the 5% K treatment and 2.71 and 0.2% under the 0% K treatment, respectively. The secondary macronutrients, such as Ca and Mg, decreased with an increase in leaf K content (Figure 4C,D). The leaf Mg content notably increased with the advancement of growth. Under 20%, 5%, and 0% K, the Mg content doubled from the V4 stage to the VT stage (Table S2), while under control, the increase was 54% during VT compared to the V4 stage. A similar trend was observed in Cu, where the K deficiency increased the leaf Cu content. Micronutrients such as B and Mn had a negative relationship with leaf K content, following quadratic and linear relationships (Figure 4E,F). The leaf B and Mn contents increased with the advancement of plant growth.

Table 1.
Analysis of variance of leaf mineral nutrient content influenced by growth stages and potassium (K) treatments.
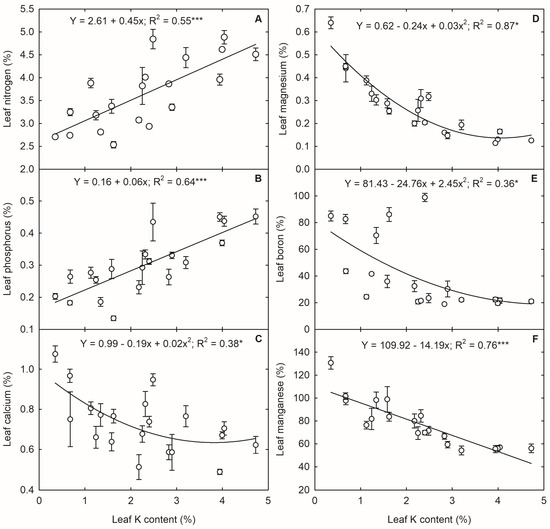
Figure 4.
Relationship between leaf potassium (K) content and and leaf (A) nitrogen, (B) phosphorous, (C) calcium, (D) magnesium, (E) boron, and (F) manganese in corn. Each data point represents mean ± standard error. * and *** indicate significance at p < 0.05 and p < 0.001, respectively.
3.3. K Deficiency and Plant Physiology during the Tasseling Stage
The K deficiency impacted the gas exchange (p < 0.001) and PSII efficiency (p < 0.05) of corn during the tasseling stage (Figure 5). The PN decreased with K limitation and followed a quadratic relationship with leaf K content (Figure 5A). The 5% and 0% K treatments reduced the PN by 31 and 35%, respectively, compared to the control. The increase in leaf K content above 1.3% (dry weight basis) did not significantly increase the PN in corn. The gsw increased with an increase in leaf K content up to 1.6%. In comparison, a further increase in K did not result in any notable increase in gsw following a quadratic relationship with leaf K content (Figure 5B). Under 5% and 0% K treatments, a 56% and 60% decrease in gsw was observed, respectively. Meanwhile, the 20% and 40% K treatments resulted in 27% and 5% reductions in gsw, respectively, compared to the control. A similar pattern of reduction was observed in transpiration rate, resulting in a quadratic relationship (R2 = 0.96; p < 0.01) (Figure 5C). A two-fold increase in leaf K content from 0.7% to 1.3% resulted in a 47% rise in stomatal transpiration rate. The Ci/Ca ratio was highly influenced by the K content, obtaining a linear relationship (R2 = 0.89; p < 0.01) (Figure 5D). The leaf Ci was observed to be lower than the atmospheric CO2 level under 0.3% and 0.7% leaf K content, reaching a negative value. The increase in leaf K from 0.7 to 1.3% increased the Ci/Ca ratio by 140 fold, and further increase resulted in 105% and 5% rise in Ci/Ca ratio. The ETR and PhiPS2 were negatively impacted by K deficiency (Figure 5E,F), resulting in a reduction of 29% and 46%, with a change in leaf K content from 2.4% to 0.3%.
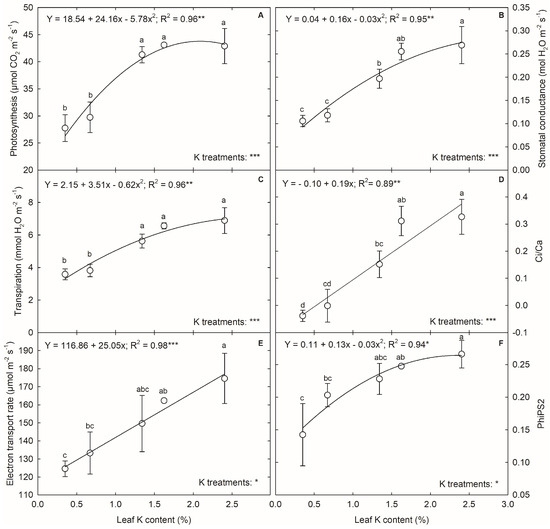
Figure 5.
The relationship between leaf potassium (K) content and (A) photosynthesis, (B) stomatal conductance, (C) transpiration, (D) Ci/Ca, (E) electron transport rate, and (F) PhiPS2 of corn. Each data point represents mean ± standard error. The letters above each point indicate the least significant difference between the five K treatments obtained from a completely randomized design experiment. Treatments with the same letters are nonsignificant. The legend shows the regression equation with regression coefficient (R2) and p-value (*, **, and *** indicate significance at p < 0.05, p < 0.01, and p < 0.001, respectively).
3.4. K Deficiency and Plant Growth and Biomass Accumulation
The plant height was unaffected by the leaf K levels. At the same time, severe K deficiency reduced the leaf area (p < 0.001) (Figure 6). The increase in leaf K content from 0.7 to 1.3% resulted in an 8% increase in leaf area, while further increase did not translate into leaf area. The plant accumulated more biomass into the stem, followed by leaves and roots at the VT stage (Figure 7). The K deficiency affected the biomass accumulation in a shoot system (p < 0.01 to p < 0.001) and unaffected the root dry weight (Figure 7). The change in leaf K content from 0.3 and 0.7% to 2.4% contributed to 20% and 14% more dry matter in the leaf. In comparison, the increase from 1.3% to 2.4% only resulted in a 4% increase in leaf dry matter accumulation (Figure 8A). A 59% rise in stem dry weight was observed with a change in leaf K content from 0.3 to 2.4% (Figure 8B). The reduction in leaf and stem dry weight under lower leaf K content declined the overall shoot system growth (Figure 8C). On the other hand, the root dry weight and root-to-shoot ratio did not have a relationship with leaf K content (p > 0.5) (Figure 8D,F). Overall, the plants accumulated 38% more biomass under 2.4% leaf K content compared to 0.3% leaf K (Figure 8E).
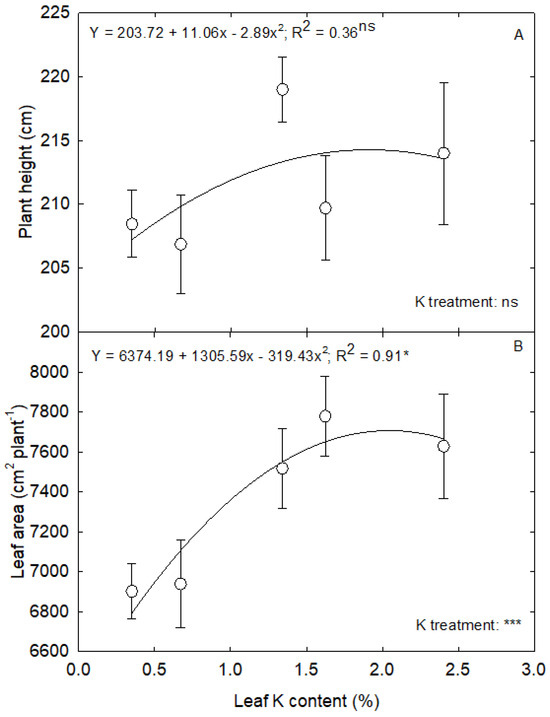
Figure 6.
The regression relationship between leaf K content and (A) plant height and (B) leaf area in corn. The analysis was performed using the mean ± standard error of each parameter in corn. The significant levels of the K treatment were obtained from a completely randomized design analysis. The legends show the regression equation with regression coefficient (R2) and p-value (*, *** and ‘ns’ indicate the significance at p < 0.05, p < 0.001 and nonsignificance, respectively).
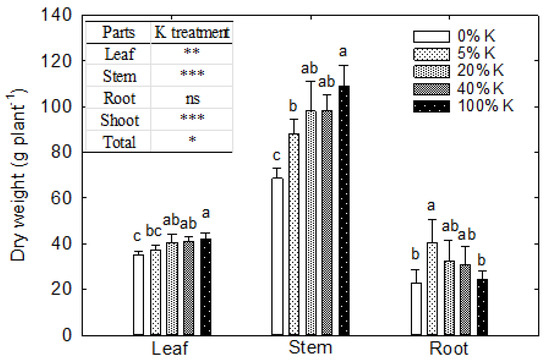
Figure 7.
The effect of potassium (K) treatments on leaf, stem, and root biomass of corn, measured 50 days after sowing or 45 days after treatment. The vertical bars are the mean ± standard errors of 12 replications. The letters above each bar indicate the least significant differences (LSDs) between five K treatments, individually for the leaf, stem, and root. Treatments with the same letters are nonsignificant. *, **, and *** indicate significance at p < 0.05, p < 0.01, and p < 0.001, respectively. ‘ns’ indicates nonsignificance.
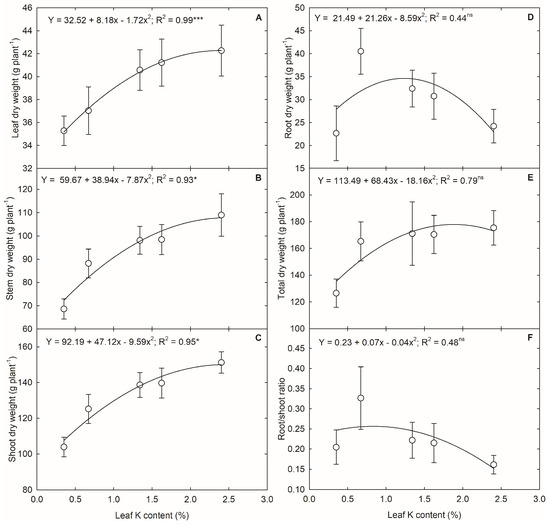
Figure 8.
The regression relationship between corn leaf K content and (A) leaf dry weight, (B) stem dry weight, (C) shoot dry weight, (D) root dry weight, (E) total dry weight, and (F) root to shoot ratio in corn. The analysis was performed using the mean ± standard error of each parameter. The legends show the regression equation with regression coefficient (R2) and p-value (* and *** indicate significance at p < 0.05 and p < 0.001, respectively. ‘ns’ indicate nonsignificant).
3.5. Environmental Productivity Index
Among the physiological traits, the reduction in PN is mainly contributed by the Ci/Ca ratio followed gsw (Figure 9A). The ETR and PhiPS2 ranged from 0.5 to 1. The leaf K content did not result in any notable difference in the plant height, maintaining the EPI between 0.95 and 1 (Figure 9B). Among the growth parameters, shoot dry weight was primarily affected by K deficiency, followed by total dry weight and leaf area.
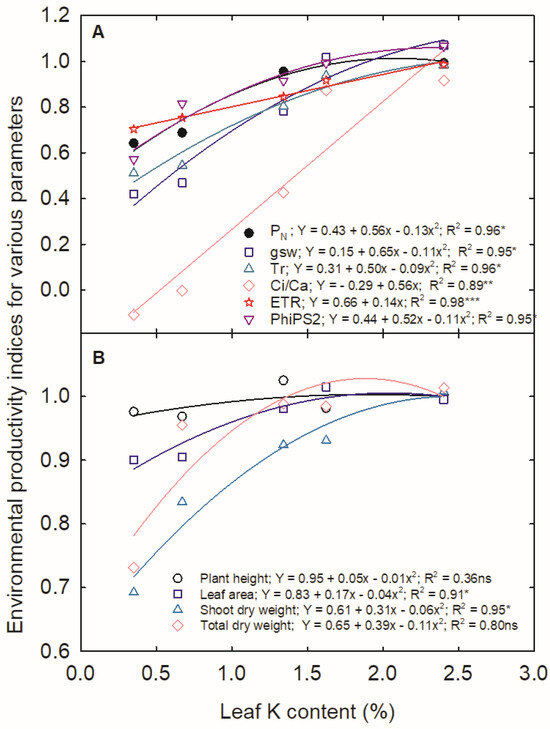
Figure 9.
Environmental productivity index of (A) physiology and (B) growth of corn in relation to leaf K content. Various shapes represent the different traits. (*, **, and *** indicate significance at p < 0.05, p < 0.01, and p < 0.001, respectively. ‘ns’ indicates nonsignificance).
4. Discussion
The limited soil K supply affected the root-to-leaf transportation of K, resulting in a leaf K content far below the recommended concentration of 2 to 4% [33]. We observed a linear reduction in leaf K content with plant growth, attributed to the dilution of leaf composition with the increased accumulation of leaf area and biomass, as evidenced in the study. Also, as the plant grows, it accumulates K in the structural and storage materials to tassel during the VT stage, lowering the leaf K content [34]. The higher root-to-shoot ratio at the V4 and V6 stages and further reduction with the advancement of growth stages clearly depict the allocation of more biomass into the root system during early seedling establishment. The high rate of shoot growth observed in terms of plant height, leaf area, and biomass accumulation at the V10 and VT stages and a concomitant decline in root-to-shoot ratio clearly explains the typical rapid above-ground growth after the V6 leaf stage in corn [35]. The high K deficiency only affected the total biomass at the VT stage, while it did not alter the dry matter accumulation under the V4, V6, and V10 stages. The lower proportion of root growth as compared to other growth stages has limited the K uptake and translocation of photosynthates to leaves and stems. K is an essential component of phloem transport, ensuring the redistribution of assimilates towards the growing tissues like leaves and fruits [3,36]. Moreover, the reduced leaf area under K deficiency decreases the active area for light interception to synthesize ATP and NADPH required for carbon fixation through photosynthesis [37].
The soil K fertilization enhances the absorption of N and P from the soil, facilitates their metabolism, and supports their transportation to the plant’s sink tissues, consequently resulting in elevated levels of leaf N and P accumulation, as observed in the study during all the growth stages under control [38,39,40]. K+ acts as a counter-cation and stimulates the uptake and transport of NO3− [41]. On the other hand, the plants try to increase the Ca and Mg content to alleviate the effect of K deficiency, increasing leaf Ca and Mg contents by 0%. The antagonism between K and Ca and Mg maintains the cation balance in plant organs [16,17]. K and Mg play similar roles in osmoregulation, maintenance of cellular pH, and enzyme activation [42]. The reduced accumulation of Cu, B, and Mn is due to the imbalance in nutrient absorption by the roots and plant adaptation to maintain cation status in the organs. However, the actual mechanism has yet to be studied. Thus, the functional relationship obtained between leaf K content and other leaf mineral nutrient compositions will be helpful in understanding the probable change in these nutrients under K deficiency.
Photosynthesis in corn is an intricate process involving many structural and functional components [19]. In the current study, the 31% and 35% reduction observed in PN with K deficiency, 5%, and 0% K, respectively, is attributed to the observed reduction in gsw (5% K: 56%; 0% K: 60%) and decreased concentration of leaf intercellular CO2. It is well established that K+ mediates the osmoregulation in guard cells with NO3−, Cl−, and malate as counter ions [43] and is rapidly exchanged between guard-cell apoplast, cytosol, and vacuole [14]. K accumulates in the cytosol, and the influx of K+ through K+ channels in the hyperpolarized membrane of guard cells decreases the water potential inside the guard cells, allowing the absorption of water into the guard cells [44], thereby opening the stomata. However, the reduced supply of leaf K decreased the gsw, in turn limiting the CO2 flux into the mesophyll cells, thereby facilitating CO2 assimilation [45]. The rate of photosynthesis depends on the bio- and photochemical processes and the quantity of CO2 available for the Rubisco enzyme in the chloroplast stroma [46]. The 140-fold reduction in the Ci/Ca ratio could not be only due to the stomatal limitations, as evident from the lowest EPI indices for the Ci/Ca ratio at different leaf K levels (Figure 9A).
Though not discussed in the study, there are reports on the influence of K deficiency on mesophyll conductance restricting CO2 diffusion through leaf anatomical changes (decreased leaf thickness, leaf internal airspace, and cell size) [47,48], increased specific leaf mass [49], and increased accumulation of soluble sugars [16,46]. The K deficiency also inhibits the Rubisco activation, resulting in a reduced rate of RuBp carboxylation [50]. Apart from the direct effect of K deficiency on CO2 uptake through stomata, the loss of cell turgor pressure under K deficiency [51] alters the leaf angle, thereby influencing the boundary layer diffusion [52]. The leaf boundary layer acts as the first obstacle to CO2 movement from the atmosphere to the leaf surface, relying on diffusion rather than turbulent exchange [53], and it depends on the leaf energy balance [54]. This effect is unique to K deficiency since it affects osmoregulation and is not likely caused by other nutrients [46]. In addition, the biochemical limitation also contributed to the decreased PN by limiting the conversion of radiant energy into chemical energy in terms of ATP during light reactions [55]. The reduced PhiPS2 and ETR under K deficiency observed in the study delineate the influence of K on the inactivation of enzymes like ATP synthase [56] and affects the stability of and activity of PSII components such as D1 protein [57]. Overall, photochemical and photosynthetic activities are impaired due to K deficiency.
In this study, the leaf K content above 1.6% did not significantly increase the physiological and growth parameters, revealing that the increased accumulation is an insurance strategy of plants to enable better survival under sudden environmental stress [58]. Thus, an increase in leaf K content beyond the requirement does not translate into the plant function, as evident from the quadratic relationship observed in the study, except for Ci/Ca and ETR.
The sustained growth and metabolism demand the continuous translocation of carbohydrates from photosynthetically active regions to sink organs. The pressure flow hypothesis states that the solutes within the phloem flow along a hydrostatic pressure gradient, which arises from variances in solute concentrations [59]. K+ stands out as the predominant cation in the phloem. Alongside sucrose and amino-N compounds, it serves as one of the primary osmotic compounds within phloem sap [46]. In addition, the K+ channel ZMK2 helps prevent the depolarization of the membrane caused by sucrose transporter ZmSUT1 in maize [60,61]. The K deficiency reduced the translocation of sucrose into the stem, lowering the shoot dry weight, as observed in the study.
Additionally, the decreased stomatal transpiration lowered the transpiration pull required for photosynthate translocation [62]. Although nonsignificant, K deficiency slightly increased the root biomass accumulation and root-to-shoot ratio as reported in other crops [17,63]. The reduced leaf area is either attributable to delayed leaf appearance or smaller leaf size [37]. As evident from the EPI, the leaf K deficiency majorly contributed to the reduction in shoot and total biomass followed by leaf area, revealing the importance of K in biomass production and partition.
5. Conclusions
The findings of this study underscore the critical role of leaf K levels, particularly when below 1.6%, in significantly impairing photochemical and carbon assimilation processes during corn vegetative growth and development. Notably, reductions in leaf K content led to substantial declines in critical physiological and growth parameters, specifically, the Ci/Ca ratio and shoot dry weight. The decrease in intercellular CO2 level is due to both stomatal and non-stomatal limitations. The variations in K supply did not yield significant changes in plant height, root dry weight, or the root-to-shoot ratio. The regression relationship derived from this investigation offers valuable insights that can be integrated into corn models, where leaf K content serves as a pivotal subroutine, enhancing our understanding of corn growth dynamics and contributing to more accurate predictive modeling of corn models such as CERES-Corn and MaizeSim [64,65,66].
Supplementary Materials
The following supporting information can be downloaded at https://www.mdpi.com/article/10.3390/agriculture14070968/s1, Table S1: The composition of Hoagland´s nutrient solution used for five potassium (K) treatments. The quantity of the chemicals required to prepare 1000 L Hoagland´s solution is in grams. Table S2: Leaf mineral nutrient constitution influenced by the K treatments at different growth stages in corn. The treatments were performed after the first leaf stage, and five K treatments were applied in each sunlit plant growth chamber by modifying the K concentration in Hoagland’s solution up to the tasseling stage.
Author Contributions
N.T.: formal analysis, data curation, visualization, writing—original draft preparation, review, and editing; K.N.R.; writing—review and editing; K.R.R.; conceptualization, methodology, resources, writing—review and editing, and funding acquisition. All authors have read and agreed to the published version of the manuscript.
Funding
This work is supported by the United States Department of Agriculture, Agricultural Research Service under Agreement No. 58-8042-9-072, USDA NIFA (2019-34263-30552 and MIS043050), USDA-ARS NACA 58-6066-2-030, and the Mississippi Corn Promotion Board (no. 001).
Institutional Review Board Statement
Not applicable.
Data Availability Statement
The original contributions presented in the study are included in the article/Supplementary Material; further inquiries can be directed to the corresponding author.
Acknowledgments
The authors thank David Brand for providing technical assistance.
Conflicts of Interest
The authors declare no conflicts of interest.
References
- Reynolds, M.; David, B.; Scott, C.C.; Robert, T.F.; Yann, M.; Diane, E.M.; Martin, A.J.P. Raising yield potential of wheat. i. overview of a consortium approach and breeding strategies. J. Exp. Bot. 2011, 62, 439–452. [Google Scholar] [CrossRef]
- Stewart, W.M.; Dibb, D.W.; Johnston, A.E.; Smyth, T.J. The contribution of commercial fertilizer nutrients to food production. Agron. J. 2005, 97, 1–6. [Google Scholar] [CrossRef]
- Zörb, C.; Senbayram, M.; Peiter, E. Potassium in agriculture-status and perspectives. J. Plant Physiol. 2014, 171, 656–669. [Google Scholar] [CrossRef] [PubMed]
- Sparks, D.L. Potassium dynamics in soils. In Advances in Soil Science; Springer: New York, NY, USA, 1987; pp. 1–63. Available online: https://link.springer.com/book/10.1007/978-1-4612-4682-4 (accessed on 22 April 2024).
- Pingali, P.L. Green revolution: Impacts, limits, and the path ahead. Proc. Natl. Acad. Sci. USA 2012, 109, 12302–12308. [Google Scholar] [CrossRef] [PubMed]
- FAOSTAT. Crops and Livestock Products. 2022. Available online: https://www.fao.org/faostat/en/#data/QCL (accessed on 23 April 2024).
- USDA-FAS. Corn Poduction in the U.S. 2014/15–2023/24. 2023, Statista. Available online: https://www.statista.com/statistics/686193/production-of-corn-us/ (accessed on 25 April 2024).
- USDA-NASS, Corn: Production by Year; Charts and Maps. 2023. Available online: https://www.nass.usda.gov/Charts_and_Maps/Field_Crops/cornprod.php (accessed on 26 April 2024).
- Oldham, L.; Jones, K.D. Nutrient Management Guidelines for Agronomic Crops Grown in Mississippi. 2023. Available online: http://extension.msstate.edu/publications/publications/nutrient-management-guidelines-for-agronomic-crops-grown-mississippi (accessed on 19 April 2024).
- Smil, V. Crop residues: Agriculture’s largest harvest. Bioscience 1999, 49, 299–308. [Google Scholar] [CrossRef]
- Dhillon, J.S.; Eickhoff, E.M.; Mullen, R.W.; Raun, W.R. World potassium use efficiency in cereal crops. Agron. J. 2019, 111, 889–896. [Google Scholar] [CrossRef]
- Hammond, H.D.; Epstein, E. Mineral nutrition in plants: Principles and perspectives. Bull. Torrey Bot. Club 1972, 99, 102. [Google Scholar] [CrossRef][Green Version]
- Amtmann, A.; Stephanie, T.; Patrick, A. The effect of potassium nutrition on pest and disease resistance in plants. Physiol. Plant. 2008, 133, 682–691. [Google Scholar] [CrossRef]
- Andrés, Z.; Pérez-Hormaeche, J.; Leidi, E.O.; Schlücking, K.; Steinhorst, L.; McLachlan, D.H.; Schumacher, K.; Hetherington, A.M.; Kudla, J.; Cubero, B.; et al. Control of vacuolar dynamics and regulation of stomatal aperture by tonoplast potassium uptake. Proc. Natl. Acad. Sci. USA 2014, 111, E1806–E1814. [Google Scholar] [CrossRef]
- Faust, F.; Schubert, S. Protein synthesis is the most sensitive process when potassium is substituted by sodium in the nutrition of sugar beet (Beta vulgaris). Plant Physiol. Biochem. 2016, 107, 237–247. [Google Scholar] [CrossRef]
- Gerardeaux, E.; Jordan-Meille, L.; Constantin, J.; Pellerin, S.; Dingkuhn, M. Changes in plant morphology and dry matter partitioning caused by potassium deficiency in Gossypium hirsutum (L.). Environ. Exp. Bot. 2010, 67, 451–459. [Google Scholar] [CrossRef]
- Hafsi, C.; Atia, A.; Lakhdar, A.; Debez, A.; Abdelly, C. Differential responses in potassium absorption and use efficiencies in the halophytes Catapodium rigidum and Hordeum maritimum to various potassium concentrations in the medium. Plant Prod. Sci. 2011, 14, 135–140. [Google Scholar] [CrossRef]
- Attia, H.; Rebah, F.; Ouhibi, C.; Saleh, M.A.; Althobaiti, A.T.; Alamer, K.H.; Nasri, M.B.; Lachaâl, M. Effect of potassium deficiency on physiological responses and anatomical structure of basil, Ocimum basilicum L. Biology 2022, 11, 1557. [Google Scholar] [CrossRef] [PubMed]
- Du, Q.; Zhao, X.H.; Xia, L.; Jiang, C.J.; Wang, X.G.; Han, Y.; Wang, J.; Yu, H.Q. Effects of potassium deficiency on photosynthesis, chloroplast ultrastructure, ROS, and antioxidant activities in maize (Zea mays L.). J. Integr. Agric. 2019, 18, 395–406. [Google Scholar] [CrossRef]
- Römheld, V.; Kirkby, E.A. Research on potassium in agriculture: Needs and prospects. Plant Soil 2010, 335, 155–180. [Google Scholar] [CrossRef]
- Marko, O.; Brdar, S.; Panic, M.; Lugonja, P.; Crnojevic, V. Soybean varieties portfolio optimisation based on yield prediction. Comp. Electron. Agric. 2016, 127, 467–474. [Google Scholar] [CrossRef]
- Shahhosseini, M.; Hu, G.; Huber, I.; Archontoulis, S.V. Coupling machine learning and crop modeling improves crop yield prediction in the US Corn Belt. Sci. Rep. 2021, 11, 1606. [Google Scholar] [CrossRef] [PubMed]
- Chang, Y.; Latham, J.; Licht, M.; Wang, L. A data-driven crop model for maize yield prediction. Commun. Biol. 2023, 6, 439. [Google Scholar] [CrossRef] [PubMed]
- Baker, C.H.; Horrocks, R.D. CORNMOD, a dynamic simulator of corn production. Agric. Sys. 1976, 1, 57–77. [Google Scholar] [CrossRef]
- Hewit, E.J. Sand and water culture methods used in the study of plant nutrition. Soil Sci. Soc. Am. J. 1953, 17, 301. [Google Scholar]
- Reddy, K.R.; Zhao, D. Interactive effects of elevated CO2 and potassium deficiency on photosynthesis, growth, and biomass partitioning of cotton. Field Crops Res. 2005, 94, 201–213. [Google Scholar] [CrossRef]
- Reddy, K.R.; Hodges, H.F.; Read, J.J.; Mckinion, J.M.; Baker, J.T.; Tarpley, L.; Reddy, V.R. Soil-plant-atmosphere-research (SPAR) facility: A tool for plant research and modeling. Biotronics 2001, 30, 27–50. [Google Scholar]
- McGeehan, S.L.; Naylor, D.V. Automated instrumental analysis of carbon and nitrogen in plant and soil samples. Commun. Soil Sci. Plant Anal. 1988, 19, 493–505. [Google Scholar] [CrossRef]
- Donohue, S.J.; Aho, D.W. Determination of P, K, Ca, Mg, Mn, Fe, Al, B, Cu, and Zn in plant tissue by inductively coupled plasma (ICP) emotion spectroscopy. In Plant Analysis Reference Procedures for the Southern Region of the United States; Plank, C.O., Ed.; Southern Cooperative Series Bulletin 368; Georgia Agricultural Experimental Station: Athens, GA, USA, 1992; pp. 37–40. [Google Scholar]
- Popat, R.; Banakara, K. Package Doebioresearch. 2022. Available online: https://CRAN.R-project.org/package=doebioresearch (accessed on 15 March 2024).
- Nobel, P.S. Productivity of Agave Deserti: Measurement by dry weight and monthly prediction using physiological responses to environmental parameters. Oecologia 1984, 64, 1–7. [Google Scholar] [CrossRef] [PubMed]
- Reddy, K.R.; Kakani, V.G.; Hodges, H.F. Exploring the use of the environmental productivity index concept for crop production and modeling. In Response of Crops to Limited Water; American Society of Agronomy and Soil Science Society of America: Madison, WI, USA, 2015; pp. 387–410. [Google Scholar] [CrossRef]
- Byrant, C.J.; Jones, K.D. Potassium in Mississippi Soils. 2022. Available online: https://extension.msstate.edu/publications/potassium-mississippi-soils-0 (accessed on 26 April 2024).
- Broadley, M.R.; Escobar-gutiérrez, A.J.; Burns, A.; Burns, I.G. What are the effects of nitrogen deficiency on growth components of lettuce? New Phytol. 2000, 147, 519–526. [Google Scholar] [CrossRef] [PubMed]
- Nleya, T.; Chungu, C.; Kleinjan, J. Corn growth and development. In iGrow Corn: Best Management Practices; Iowa State University: Ames, IA, USA, 2016; Available online: https://store.extension.iastate.edu/Product/Corn-Growth-and-Development (accessed on 20 April 2024).
- Ling, L.; Jiang, Y.; Meng, J.J.; Cai, L.M.; Cao, G.C. Phloem transport capacity of transgenic rice T1c-19 (Cry1C*) under several potassium fertilizer levels. PLoS ONE 2018, 13, e0195058. [Google Scholar] [CrossRef]
- Jordan-Meille, L.; Pellerin, S. Leaf area establishment of a maize (Zea mays L.) field crop under potassium deficiency. Plant Soil 2004, 265, 75–92. [Google Scholar] [CrossRef]
- Hu, W.; Zhao, W.; Yang, J.; Oosterhuis, D.M.; Loka, D.A.; Zhou, Z. Relationship between potassium fertilization and nitrogen metabolism in the leaf subtending the cotton (Gossypium hirsutum L.) boll during the boll development stage. Plant Physiol. Biochem. 2016, 101, 113–123. [Google Scholar] [CrossRef] [PubMed]
- Yin, M.; YLi, Y.; Hu, Q.; Yu, X.; Huang, M.; Zhao, J.; Dong, S.; Yuan, X.; Wen, Y. Potassium increases nitrogen and potassium utilization efficiency and yield in foxtail millet. Agronomy 2023, 13, 2200. [Google Scholar] [CrossRef]
- Niu, J.; Zhang, W.; Ru, S.; Chen, X.; Xiao, K.; Zhang, X.; Assaraf, M.; Imas, P.; Magen, H.; Zhang, F. Effects of potassium fertilization on winter wheat under different production practices in the North China plain. Field Crops Res. 2013, 140, 69–76. [Google Scholar] [CrossRef]
- Blevins, D.G.; Barnett, N.M.; Frost, W.B. Role of potassium and malate in nitrate uptake and translocation by wheat seedlings. Plant Physiol. 1978, 62, 784–788. [Google Scholar] [CrossRef] [PubMed]
- Marschner, H.; Kirkby, E.A.; Cakmak, I. Effect of mineral nutritional status on shoot root partitioning of photoassimilates and cycling of mineral nutrients. J. Exp. Bot. 1996, 47, 1255–1263. [Google Scholar] [CrossRef]
- Talbott, L.D.; Zeiger, E. Central roles for potassium and sucrose in guard-cell osmoregulation. Plant Physiol. 1996, 111, 1051–1057. [Google Scholar] [CrossRef]
- Shabala, S. Regulation of potassium transport in leaves: From molecular to tissue level. Ann. Bot. 2003, 92, 627–634. [Google Scholar] [CrossRef]
- Lu, Z.; Lu, J.; Pan, Y.; Lu, P.; Li, X.; Cong, R.; Ren, T. Anatomical variation of mesophyll conductance under potassium deficiency has a vital role in determining leaf photosynthesis: Structural controls on Gm under K deficiency. Plant Cell Environ. 2016, 39, 2428–2439. [Google Scholar] [CrossRef]
- Tränkner, M.; Tavakol, E.; Jákli, B. Functioning of potassium and magnesium in photosynthesis, photosynthate translocation and photoprotection. Physiol. Plant. 2018, 163, 414–431. [Google Scholar] [CrossRef] [PubMed]
- Battie-Laclau, P.; Laclau, J.P.; Beri, C.; Mietton, L.; Muniz, M.R.A.; Arenque, B.C.; Piccolo, M.D.C.; Jordan-Meille, L.; Bouillet, J.P.; Nouvellon, Y. Photosynthetic and anatomical responses of eucalyptus grandis leaves to potassium and sodium supply in a field experiment. Plant Cell Environ. 2014, 37, 70–81. [Google Scholar] [CrossRef] [PubMed]
- Giuliani, R.; Koteyeva, N.; Voznesenskaya, E.; Evans, M.A.; Cousins, A.B.; Edwards, G.E. Coordination of leaf photosynthesis, transpiration, and structural traits in rice and wild relatives (Genus Oryza). Plant Physiol. 2013, 162, 1632–1651. [Google Scholar] [CrossRef]
- Lu, Z.; Ren, T.; Pan, Y.; Li, X.; Cong, R.; Lu, J. Differences on photosynthetic limitations between leaf margins and leaf centers under potassium deficiency for Brassica napus L. Sci. Rep. 2016, 6, 21725. [Google Scholar] [CrossRef]
- Oosterhuis, D.M.; Loka, D.A.; Raper, T.B. Potassium and stress alleviation: Physiological functions and management of cotton. J. Plant Nutr. Soil Sci. 2013, 176, 331–343. [Google Scholar] [CrossRef]
- Carroll, M.J.; Slaughter, L.H.; Krouse, J.M. Turgor potential and osmotic constituents of Kentucky bluegrass leaves supplied with four levels of potassium. Agron. J. 1994, 86, 1079–1083. [Google Scholar] [CrossRef]
- Martin, T.A.; Hinckley, T.M.; Meinzer, F.C.; Sprugel, D.G. Boundary layer conductance, leaf temperature and transpiration of Abies amabilis branches. Tree Physiol. 1999, 19, 435–443. [Google Scholar] [CrossRef] [PubMed]
- Schuepp, P.H. Tansley Review No. 59. Leaf boundary layers. New Phytol. 1993, 125, 477–507. [Google Scholar] [CrossRef] [PubMed]
- Woodrow, I.E.; Ball, J.T.; Berry, J.A. Control of photosynthetic carbon-dioxide fixation by the boundary-layer, stomata and ribulose 1,5-biphosphate carboxylase oxygenase. Plant Cell Environ. 1990, 13, 339–347. [Google Scholar] [CrossRef]
- Havlin, J.L.; Beaton, J.D.; Tisdale, S.L.; Nelson, W.L. Soil Fertility and Fertilizers: An Introduction to Nutrient Management, 7th ed.; Prentice Hall: Upper Saddle River, NJ, USA, 2005. [Google Scholar]
- Oneill, S.D.; Spanswick, R.M. Characterization of native and reconstituted plasma membrane H+-ATPase from the plasma membrane of Beta vulgaris. J. Membr. Biol. 1984, 79, 245–256. [Google Scholar] [CrossRef]
- Takahashi, S.; Badger, M.R. Photoprotection in plants: A new light on photosystem II damage. Trends Plant Sci. 2011, 16, 53–60. [Google Scholar] [CrossRef] [PubMed]
- Kafkafi, U. The functions of plant K in overcoming environmental stress situations. In Proceedings of the 22nd Colloquium of the International Potash Institute, Soligorsk, USSR, 18–23 June 1990; International Potash Institute: Bern, Switzerland, 1990; pp. 81–93. [Google Scholar]
- Münch, E. Die stoffbewegungen in der pflanze (Gustav Fischer, jena). Curr. Opin. Plant Biol. 1930, 43, 36–42. [Google Scholar]
- Baker, R.F.; Leach, K.A.; Boyer, N.R.; Swyers, M.J.; Alfonso, Y.B.; Skopelitis, T.; Luo, A.; Sylvester, A.; Jackson, D.; Braun, D.M. Sucrose transporter ZmSut1 expression and localization uncover new insights into sucrose phloem loading. Plant Physiol. 2016, 172, 1876–1898. [Google Scholar] [CrossRef] [PubMed]
- Philippar, K.; Büchsenschütz, K.; Abshagen, M.; Fuchs, I.; Geiger, D.; Lacombe, B.; Hedrich, R. The K+ channel KZM1 mediates potassium uptake into the phloem and guard cells of the C4 grass Zea mays. J. Biol. Chem. 2003, 278, 16973–16981. [Google Scholar] [CrossRef]
- Atkins, C.A.; Smith, P.M.C. Translocation in legumes: Assimilates, nutrients, and signaling molecules1. Plant Physiol. 2007, 144, 550–561. [Google Scholar] [CrossRef]
- Chen, J.; Gabelman, W.H. Morphological and physiological characteristics of tomato roots associated with potassium-acquisition efficiency. Sci. Hortic. 2000, 83, 213–225. [Google Scholar] [CrossRef]
- Jones, C.A.; Kiniry, J.R. CERES-Corn: A Simulation of Corn Growth and Development; Texas A&M Univ. Press: College Station, TX, USA, 1986. [Google Scholar]
- Lizaso, J.I.; Batchelor, W.D.; Westgate, M.E. A leaf area model to simulate cultivar-specific expansion and senescence of corn leaves. Field Crops Res. 2003, 80, 1–17. [Google Scholar] [CrossRef]
- Yang, Y.; Timlin, D.J.; Fleisher, D.H.; Kim, S.H.; Quebedeaux, B.; Reddy, V.R. Simulating leaf area of corn plants at contrasting water status. Agric. For. Meteorol. 2009, 149, 1161–1167. [Google Scholar] [CrossRef]
Disclaimer/Publisher’s Note: The statements, opinions and data contained in all publications are solely those of the individual author(s) and contributor(s) and not of MDPI and/or the editor(s). MDPI and/or the editor(s) disclaim responsibility for any injury to people or property resulting from any ideas, methods, instructions or products referred to in the content. |
© 2024 by the authors. Licensee MDPI, Basel, Switzerland. This article is an open access article distributed under the terms and conditions of the Creative Commons Attribution (CC BY) license (https://creativecommons.org/licenses/by/4.0/).