Abstract
The income effect of rice–crayfish co-culture technology (RCT) is directly related to rate of adoption of farmers and the process of China’s green development of agriculture. The aim of this study is to explore the income effect and income growth mechanism of rice–crayfish co-culture technology from the perspective of continuous adoption. With the treatment effect model (TEM), this paper empirically analyzes the income effect and income-generating mechanisms of RCT using field survey data from 736 farmers in the Jianghan Plain. As a result of this study, it was discovered that RCT will increase farmers’ net agricultural income by RMB 83,430 if they continue to adopt it. Further examinations indicate that the optimal adoption period for RCT is four and a half years. Additionally, it has also been shown that non-farm employment positively moderates the relationship between continuous adoption of RCT and net agricultural income. Farmers who participate in non-farm employment and continue to adopt the RCT will experience an increase in net agricultural income by RMB 104,510. Therefore, our results suggest that it is necessary to encourage farmers to continuously adopt RCT and actively participate in non-farm employment to enhance the income effect of RCT.
1. Introduction
Since the 1970s, farmers have increased the amount of pesticides and chemical fertilizers they use under the traditional extensive agricultural production mode to boost production and income. This has caused severe negative externalities to the environment [1,2]. For the Chinese government, there is an urgent need to promote the green development of agriculture. Over the past three years (2015–2017), the No. 1 Central Document has made critical arrangements, emphasizing the vigorous promotion of paddy field co-culture as part of ecological circular agriculture. In 2021, the General Office of Agriculture and Rural Affairs and the General Office of Finance issued a circular on the pilot work of green farming and recycling agriculture. This initiative advocates green farming and recycled agriculture to address China’s challenges in achieving green development of agriculture. It was within this context that rice–crayfish co-culture technology (RCT) was developed.
As a typical ecological co-culture technology, RCT represents an innovative solution for the green development of Chinese agriculture. RCT fully leverages the principle of ecological coupling symbiosis. Microorganisms in the rice paddies bait crayfish, whose excrement then fertilizes the rice plants. This process not only reduces the need for pesticides and fertilizer application but also achieves “double harvest in one field and dual use of one water”, thereby effectively improving farmland utilization efficiency [3]. The Ministry of Agriculture and Rural Affairs has praised RCT as a “successful model and revolution in modern agriculture”, making it a significant starting point for promoting China’s green transformation of agriculture.
Farmers form the backbone of the RCT. The adoption of RCT by farmers is directly linked to the sustainable green development capability of Chinese agriculture. However, farmers are rational economic beings, and their decision to adopt RCT is closely tied to the relationship between adoption and income. Therefore, assessing whether RCT can effectively address China’s green development challenges in agriculture is urgently needed from an income effect perspective.
Scholars have paid limited attention to the income effect of continuous technology adoption among farmers. However, much attention has always been paid to the income effect of farmers’ technology adoption. To date, the income effect of technology adoption remains a traditional yet contentious issue in agricultural economics. The existing studies are divided on whether adopting agricultural technology ensures increased income for farmers. One perspective asserts that the adoption of agricultural technology significantly boosts farmers’ income. For instance, Yang and Lin found that the adoption of agricultural technology had a notably positive impact on income, simultaneously enhancing crop and wage earnings [4]. Similarly, Sang et al. observed that agricultural technology adoption directly increases agricultural income and indirectly promotes non-agricultural income through labor transfer [5]. Furthermore, several scholars have shown that certain agricultural technologies—such as fertilizer reduction, green pest management, and conservation tillage—provide both environmental benefits and income enhancement for farmers. For example, the use of organic fertilizer and green pest management effectively increases the income of tea farmers [6,7]. No-tillage techniques also contribute to higher income by increasing crop yield, with noticeable generational and scale-specific effects [8,9]. Likewise, water-efficient irrigation techniques reduce time and labor, improve crop quality, and ultimately raise farmers’ income [10]. Conversely, another viewpoint argues that the adoption of agricultural technology has not sufficiently increased farmers’ income. German agricultural economist Koester analyzed the potential impacts of technological advancements in agriculture and posited that such advancements, within closed economic conditions, could negatively affect agricultural producers [11]. Advances in agricultural technology can increase agricultural output and result in lower prices. Some Chinese scholars have reached a similar conclusion, arguing that although the adoption of agricultural technology significantly improves production, marginal output has increased faster than demand, and the price elasticity of demand for agricultural products is smaller than the supply elasticity [12,13]. Consequently, an increase in quantity leads to a decrease in income due to a drop in price, resulting in the phenomenon of “increasing production but not increasing income”. According to Dong and Mitchell, some agricultural technologies may require higher input than output, making it difficult for farmers to increase their income after adoption [14].
The main reason for these different opinions may be twofold. First, the classification of technology adoption behavior is unclear, ignoring the dynamic nature of farmers’ technology adoption behavior. Most studies treat farmers’ technology adoption as static and one-time [15,16]. However, the uncertainty in agricultural production, the diversity of technology adoption, and the intertemporal attributes of agricultural technology suggest that farmers’ technology adoption behavior is multi-staged [17,18]. Therefore, examining the income effect of agricultural technology from a phased or short-term perspective is of limited significance. RCT has an intertemporal property, characterized by the temporal inconsistency between technology adoption and income growth [19]. The initial or short-term adoption of RCT may hinder the realization of technological benefits. The income effect of this technique can only be thoroughly and accurately evaluated as farmers consistently embrace RCT over time.
Second, it overlooks the multiple attributes of agricultural technology, failing to explore its income effect in conjunction with non-farm employment. Aside from its technology- and capital-intensive properties, RCT also exhibits labor-intensive characteristics. Currently, however, China’s trend toward non-farm employment is evident. To examine the income effect of RCT, it is essential to consider non-farm employment. Non-farm employment can diversify farmers’ income streams and enhance their capacity to adopt new technology, thereby improving their technology adoption income [20,21]. Farmers engaged in non-farm employment have a broader perspective and greater access to information, ensuring the efficiency of agricultural technology output and increasing the income from technology adoption [22]. RCT is classified as a labor-intensive technology. A significant number of farmers involved in non-farm employment could lead to a labor shortage and a decline in labor quality [23]. Consequently, RCT may lose its efficiency, negatively impacting farmers’ income.
Hence, from the perspective of continuous adoption, this study includes non-farm employment as a moderator variable to provide theoretical and empirical insights into the income effect of RCT.
2. Theoretical Framework
2.1. RCT and Income for Farmers
According to the theory of endogenous economic growth, technological progress is a source of income growth for farmers and economic development in agriculture. Indeed, technological advances in agriculture involve the widespread application of advanced technologies, aiming to improve input and output efficiency. Advanced technology requires higher yields with fewer inputs. Specifically, RCT is characterized by increased production, reduced costs, and improved efficiency. On the one hand, RCT can enhance rice yield. By maintaining a stable rice spike number and 1000-grain weight, RCT can increase rice yield by approximately 15% compared to rice monoculture [24]. On the other hand, RCT can reduce the use of fertilizers and pesticides through reusing rice and crayfish resources [25]. Moreover, RCT is considered naturally green. It utilizes organic fertilizer instead of chemical ones, and crayfish increase the nitrogen content of paddy fields, thus improving rice quality [26].
As such, the application of RCT is essentially an advance in agricultural technology with the potential to increase income
2.2. Continuous Adoption of RCT and Income of Farmers
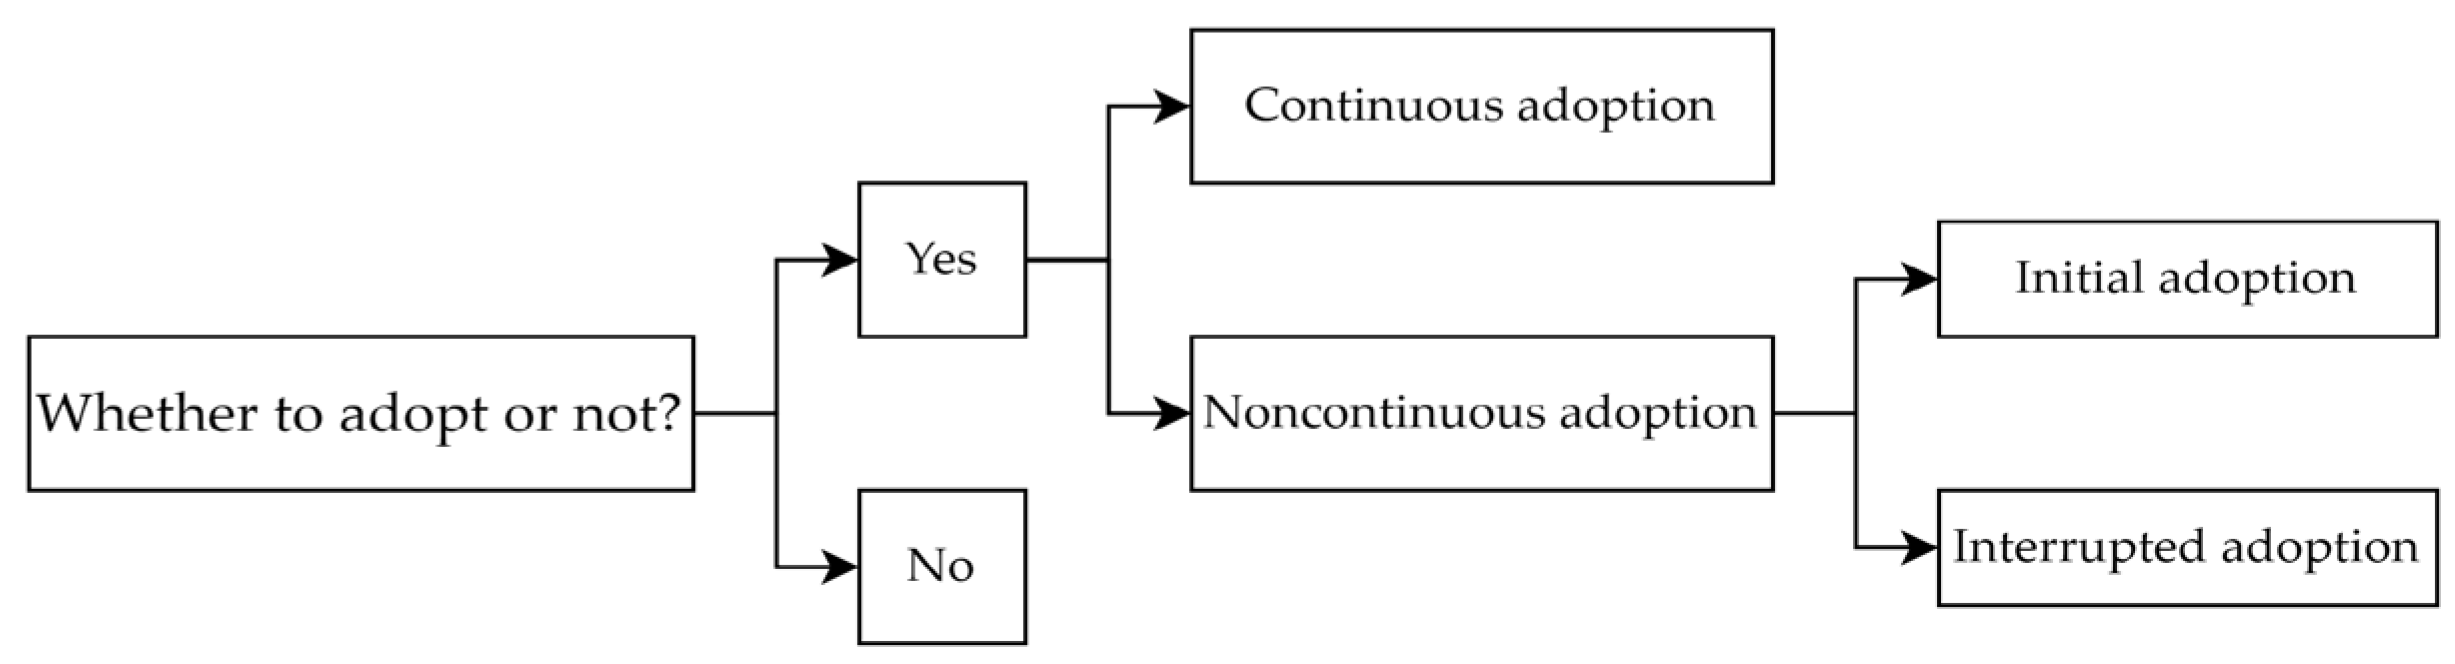
The continuous adoption of RCT is based on all adopted farmers, as opposed to noncontinuous adoption. Continuous adoption highlights that farmers have been adopting RCT continuously for several years. Noncontinuous adoption encompasses both initial and interrupted adoption [27]. Figure 1 illustrates the relationship between the different adoption behaviors.
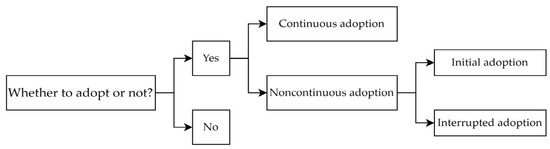
Figure 1.
The relationship between several adoption behaviors.
In general, farmers who continuously adopt RCT are more likely to increase their income compared to those who do not. Firstly, these farmers experience a longer adoption period and cycle. RCT has an intertemporal property, meaning its benefits are not immediate [19]. The adoption of RCT requires a substantial initial investment in the first year, but benefits can only be realized over time. This initial investment comprises three main components [28]. The first component involves pre-production costs, including rice field conversion, infrastructure construction, crayfish seedling purchase, and technical training. The second component covers production costs, such as labor, machinery, pesticides, and fertilizers. The third component pertains to post-production transaction costs. If farmers adopt RCT for a short period, the economic benefits may not be sufficient to cover these investments. In this regard, farmers without continuous adoption of RCT find it hard to increase their income. In contrast, those who continuously adopt RCT can gradually realize technological benefits, potentially deducting and distributing the initial investment over time.
Secondly, due to the “learning by doing” effect, farmers with continuous adoption may accumulate more technical experience [29]. Additionally, the continuous adoption improves their management skills. Consequently, RCT becomes more effective, enabling these farmers to earn higher incomes. During pre-production, farmers who continue to adopt RCT can accurately predict input production factors for rational RCT layout based on their extensive technical experience. In mid-production, these farmers can leverage their technical expertise to manage key elements such as water, pesticide, and fertilizer applications, effectively addressing sudden diseases or disasters affecting crayfish or rice. In post-production, enhanced management capabilities make continuous adopters more sensitive to market prices. This sensitivity increases their likelihood of establishing stable sales channels and securing fixed buyers, which helps realize the economic value of rice and crayfish.
2.3. Continuous Adoption of RCT, Non-Farm Employment and Income of Farmers
Non-farm employment is extremely common among Chinese farmers. However, RCT is labor-intensive, and farmers’ continuous adoption of RCT increases the demand for labor. Non-farm employment moderates the income effect of RCT by influencing labor information acquisition, quantity, quality, and income. Specifically, non-farm employment moderates the income effect of RCT through “information acquisition effect”, “labor loss effect”, and “income effect”. The relationship between continuous adoption of RCT, non-farm employment, and the income of farmers is shown in Figure 2.
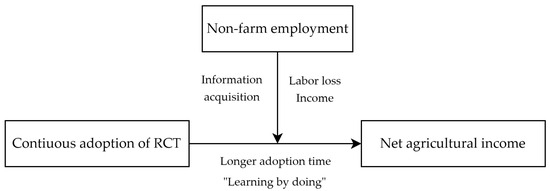
Figure 2.
Diagram of the theoretical analysis framework.
Through the “information acquisition effect”, farmers improve the ability to acquire information, with enhanced access channels developed during the migration from rural areas to cities [21]. Better information access enables farmers to assimilate experiences related to RCT [30]. In addition, broad access to information helps farmers better understand market structure and demand for agricultural products, facilitating continuous technological benefits.
The “labor loss effect” occurs as agricultural labor shifts from farms to non-farm sectors, resulting in reduced availability and quality of agricultural production labor. On the one hand, crayfish culture and fishing are less mechanized, requiring frequent and scattered labor. As more labor shifts to non-farm sectors, the labor constraint on farmers’ continuous adoption of RCT increases. On the other hand, non-farm employment forces the left-behind women and the elderly to become the main labor for RCT. However, their limited labor capacity and low efficiency can adversely affect the income effect of RCT.
The “income effect” primarily manifests as farmers engaged in non-farm employment receive economic rewards. This additional income is beneficial for increasing agricultural investment, improving technical efficiency, and enhancing the income effect of RCT.
3. Materials and Methods
3.1. Materials
3.1.1. Study Area and Data Collection
The data were obtained from a survey of farmers in 2021. These data mainly reflect the general agricultural production situation of farmers in 2020. The study area covers nine counties in the Jianghan Plain, including Shashi County, Jiangling County, Gongan County, Jianli County, Shishou City, Honghu County, Xiantao County, Qianjiang County, and Tianmen County. We selected these regions based on the following three factors. One is the geographical environment. The Jianghan Plain has a subtropical monsoon climate, flat terrain, fertile soil, and a dense network of rivers. Known as “land of fish and rice”, this area is suitable for the promotion and development of RCT. The level of agricultural development is the second factor. Agricultural production in the Jianghan Plain is highly intensive. It is one of China’s commercial grain bases. The total grain production in the Jianghan Plain accounts for 5% to 12% of the country’s total. The third key factor is this study’s purpose. In line with the study objectives, the survey focused on the continuous adoption behavior, production factors, agricultural income, individual characteristics, family characteristics, etc.
For data collection, stratified random sampling was used with a fixed sample size. The data collection process was carried out in several stages. In the first stage, 4 towns were selected from each of the 9 counties. Each county recommended a typical town to the survey team. As a reference, the survey team selected three other towns based on their geographical location (east, south, west, and west). Next, 2 villages were randomly selected in each town. This was followed by the random selection of 7 rice monoculture households and 7 rice–crayfish co-culture households in each village. In total, 36 towns, 72 villages, and 1008 households were surveyed. Among the 1008 samples, 743 belonged to rice–crayfish co-culture households, which is the main research focus of this study. After filtering out inadequate information and conflicting responses, 736 valid questionnaires were collected, resulting in an effective questionnaire rate of 99.06%.
3.1.2. Variable Measurement
Outcome variable: net agricultural income. The adoption of agricultural technology has the most visible and immediate impact on farmers’ agricultural income. Net agricultural income reflects both the input and output of technology adoption, making it an essential metric for characterizing the income effect. This study focuses on the income effect of the continuous adoption of RCT. The net agricultural income in this study specifically refers to the net income of “rice + crayfish”. It is mainly calculated from the sales income minus the production cost of rice and crayfish.
Treatment variable: continuous adoption of RCT. Farmers’ decision to adopt RCT involves two stages. The first stage is to decide whether to adopt RCT or not. The second stage is for the adopted farmers to further decide whether to continue with the technology. So, continuous adoption is aimed at farmers who have already adopted the RCT. This behavior underlines the uninterrupted adoption of RCT by farmers over many years. With this in mind, farmers were asked “By 2020, have you continuously adopted RCT for more than three years?” The responses were binary, with 1 being for continuous adopters and 0 for noncontinuous adopters.
Moderator variable: non-farm employment. Non-farm employment is the movement of rural labor into non-farm sector employment. Whether or not to engage in non-farm employment is a household decision. In reality, farmers allocate labor resources not only limited by their own endowment, but also those of their family members. In general, the agricultural labor capacity of women and the elderly is limited. So the participation of young and middle-aged labor in non-farm employment significantly impacts the agricultural production [31]. In this study, farmers were asked “Is there at least one adult male labor involved in non-farm employment in your family?” Therefore, the non-farm employment situation of peasant households can be measured.
Control variables: This paper controls for other variables that may affect net agricultural income, including individual characteristics, management characteristics, technological cognition, government policies, etc. Among these, individual characteristics include age, education; management characteristics relating to land scale, land block, cooperative involvement; technological cognition covers both difficulty and market cognition; and government policies involve government propaganda and government regulation.
Instrumental variable: perceived usefulness. To ensure the identifiability of the model, at least one valid instrumental variable is required for the selection equation. This instrumental variable will affect farmers’ continuous adoption of RCT, but does not directly influence net agricultural income. After analyzing several variables, this paper takes “perceived usefulness” as an instrumental variable. Thong et al. showed that the level of perceived usefulness can directly affect the continuous adoption behavior of a product, service, or technology by farmers, but it does not directly influence the actual income of farmers after technology adoption [32]. The descriptive statistical results of all variables are shown in Table 1.

Table 1.
Descriptive statistics.
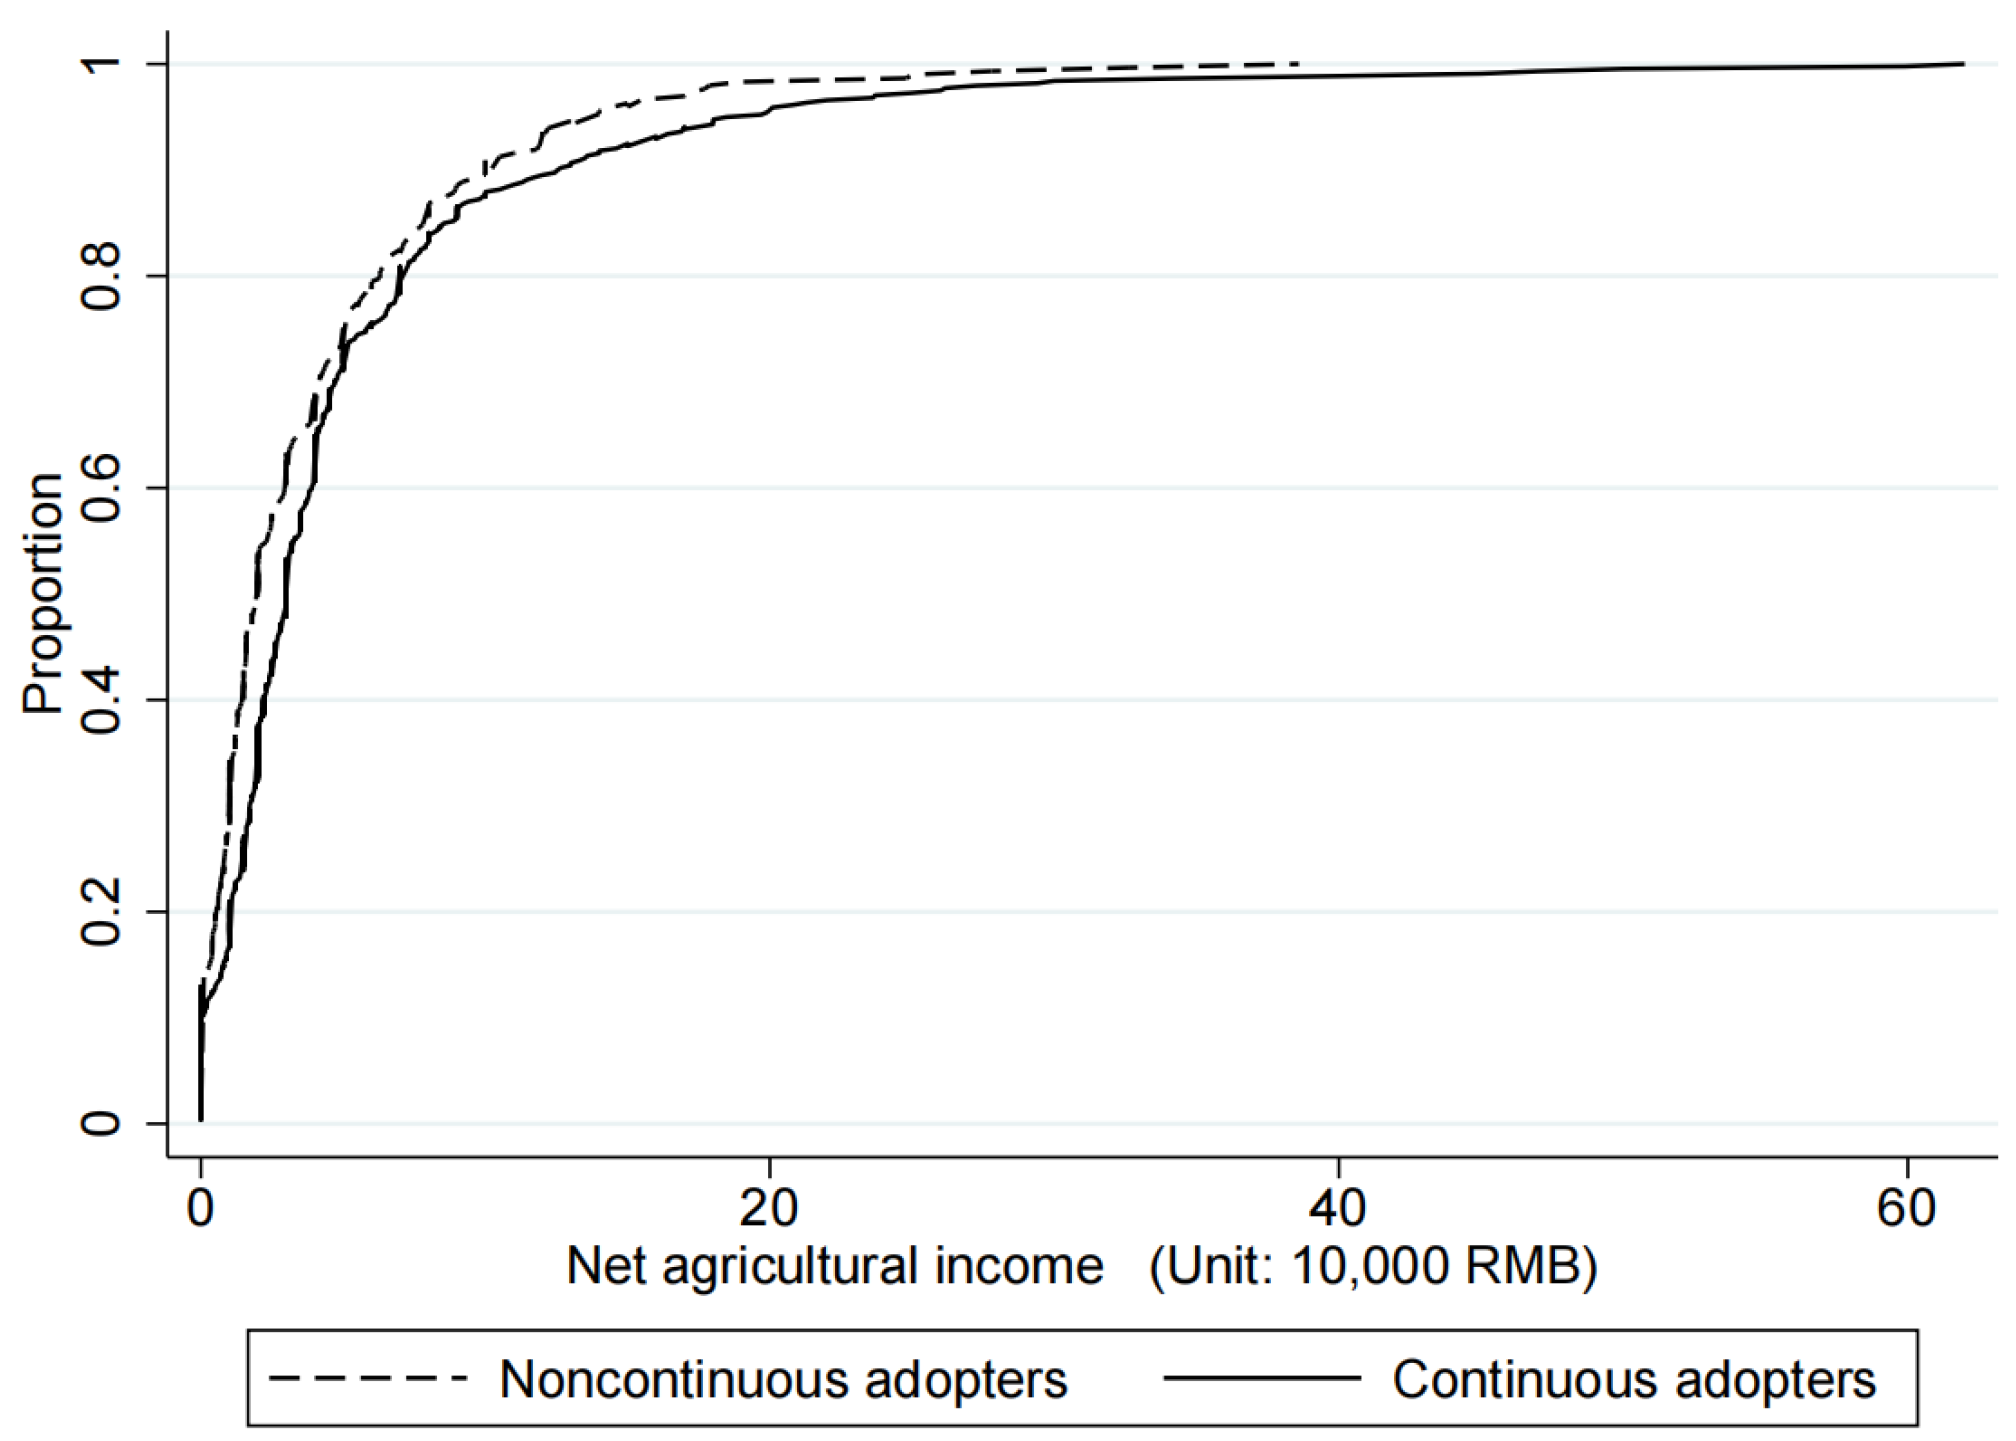
In addition, based on the references to previous studies [33], in this paper, the distribution of net agricultural income of continuous adopters and noncontinuous adopters is compared. Figure 3 reflects the cumulative distribution function of net agricultural income for farmers who are continuous adopters and noncontinuous adopters. It shows that farmers who continuously adopt RCT have higher net agricultural income than those who do not. In the following section, we empirically analyze and test the income effect and the income growth mechanism resulting from the continuous adoption of RCT.
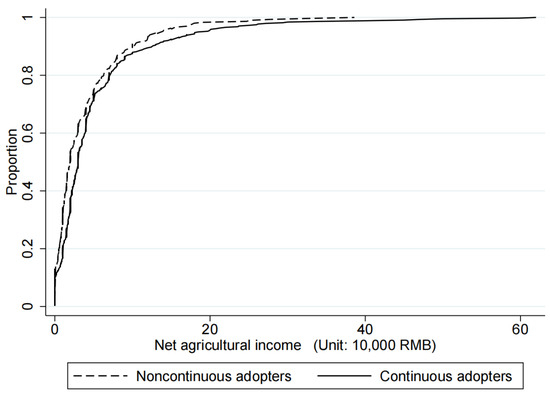
Figure 3.
The cumulative distribution function of net agricultural income.
3.2. Econometric Methods
3.2.1. Decision on Farmers’ Continuous Adoption of RCT
It is a truly complex process for farmers to decide whether or not to continue with RCT. Several factors affect the decision. Generally, farmers’ continuous adoption decision could be divided into two categories: (i) Ai = 1—continuous adoption; (ii) Ai = 0—noncontinuous adoption. In this paper, the utility is assumed to be U1i for farmers who continuously adopt RCT, and U0i for those who do not. According to the random decision effect model, farmers only make continuous adoption decisions when the utility of continuous adoption outweighs that of noncontinuous adoption [34]. In other words, farmers will continue to adopt RCT if and only if . In reality, the potential utility for farmers without continuous adoption is unobservable. Therefore, the following latent variable model is used in this paper to examine the decision of farmers on continuous adoption:
In Equation (1), is a latent variable. If farmers continue to adopt RCT, . Otherwise, . denotes the vector of individual characteristics, management characteristics, technological cognition, government policies, and others that influence farmers’ continuous adoption behavior; is the parameter to be estimated; and is the error term, which represents the unobservable factors, such as innate ability endowment.
3.2.2. Selection Bias
This study aims to explore the income effect of the continuous adoption of RCT. Assuming that the net agricultural income is a linear function of the continuous adoption decision of RCT and other variables , the regression Equation is as follows:
As in Equation (2), the vector denotes the outcome variable (net agricultural income); is a vector of observable regressors that influence the treatment and outcome variables, including individual characteristics, managerial characteristics, technological cognition, government policies, and other exogenous explanatory variables; and are vectors of parameters to be estimated; and is the error term.
The ordinary least squares (OLS) model can directly estimate the income effect when farmers’ continuous adoption of RCT is exogenous. Nonetheless, the continuous adoption behavior of RCT by farmers is based on comprehensive consideration. In other words, the continuous adoption of RCT by farmers is self-selected. In this case, the OLS estimation must be biased. As an improved method, propensity score matching (PSM) can effectively eliminate self-selection errors caused by observable variables such as age, education level, land scale, etc. However, the model is powerless to self-selection errors caused by unobservable variables such as farmers’ interest, innate ability endowment, etc. The treatment effect model (TEM) is well suited to make-up for the shortcomings of the PSM model, since it can simultaneously eliminate self-selection errors caused by observable and unobservable variables.
3.2.3. Effect Estimation
As a consequence, this paper utilizes the TEM to investigate the income effect of continuous adoption of RCT. In dealing with selection bias and endogeneity, TEM can take into account both observable and unobservable factors that influence continuous adoption behavior and net agricultural income. In addition, TEM can directly estimate the average treatment effect (ATE) of the continuous adoption of RCT on net agricultural income.
In TEM, there are two stages. The first stage is the selection equation, namely Equation (1). The second stage is the outcome equation, namely Equation (2). The selection equation is to investigate farmers’ continuous adoption of RCT. The outcome equation estimates the impact of other factors on the net agricultural income of both continuous and noncontinuous adopters.
The TEM estimation directly reflects the marginal effect of continuous adoption of RCT on net agricultural income. That is, the net agricultural income changes when the probability of continuous adoption by the farmer increases from 0 to 1. To investigate the ATE of continuous adoption of RCT on net agricultural income, the equation could be defined as follows:
As in Equation (3), indicates the net agricultural income when farmers continue to adopt RCT; meanwhile, indicates the net agricultural income when farmers do not continue to adopt RCT. The ATE estimated by Equation (3) controls the bias that may be caused by observable and unobservable factors. Therefore, it is more accurate to examine the income effect of continuous adoption behavior of RCT.
4. Results
4.1. Analysis of the Factors Influencing the Continuous Adoption of RCT
The selection equation in Table 2 shows the factors that influence the continuous adoption behavior of RCT among farmers. Land scale and the number of land blocks positively affect the continuous adoption behavior of RCT. The probability of continuing to adopt RCT will increase by 0.014 for every 1 hectare increase in farmers’ land scale. For each additional block of land, there is a 0.037 increase in the probability that a farmer will continue to adopt RCT. Typically, large-scale farmers have abundant land endowments and are better positioned to adopt RCT continuously. Moreover, the technology adoption behavior of farmers is a gradual process. Farmers will not immediately use all their land to adopt RCT. Instead, farmers with a large number of land blocks will first try to adopt the RCT on some blocks. If the trial is successful, they will gradually extend the RCT to other blocks. As a result, the larger the number of land blocks a farmer possesses, the greater the probability of continuous adoption of RCT. Concurrently, perceived usefulness was also found to exert a positive and significant impact on the continuous adoption of RCT. For every unit increase in perceived usefulness, the probability of farmers’ continuous adoption of RCT will increase by 0.152. Perceived usefulness is a critical factor in the continuous adoption of technology. In the absence of external interference, farmers’ decisions must be consistent with their standards of value judgment. Therefore, only agricultural technologies that conform to the farmers’ perceived usefulness will be adopted spontaneously and continuously. In contrast, difficulty cognition significantly negatively affected farmers’ continuous adoption of RCT. The probability of continuous adoption of RCT decreased by 0.084 for each unit increase in a farmer’s difficulty perception. This is because the more difficult it is, the more difficulties farmers will face in the continuous adoption of RCT.
Table 2.
Results of joint estimation of decision on farmers’ continuous adoption of RCT and influencing factors of net agricultural income.
4.2. Analysis of Factors Influencing Net Agricultural Income Based on Continuous
Adoption Behavior
The outcome equation in Table 2 shows the estimated results for the factors affecting farmers’ net agricultural income. Land scale has a significant positive impact on net agricultural income for both continuous and noncontinuous adopters. Expanding the land scale creates the scale economy effect, which can share the total cost of agricultural production and then increase the income of farmers [35]. For every 1 hectare increase in the land scale of continuous adopters, their net agricultural income increases by RMB 1130. Conversely, for noncontinuous adopters, every 1 hectare increase in the land scale only increases their net agricultural income by RMB 630. This income increase is only half that of continuous adopters. It indicates that farmers who continue to adopt RCT are better equipped to manage and achieve a greater income effect. In addition, the net agricultural income of continuous adopters is significantly boosted by the involvement of cooperatives. For every unit increase in the probability of participation in cooperative for continuous adopters, there is an increase in net agricultural income of RMB 17,020. Cooperatives can continuously provide sales, procurement, and technical guidance to help farmers cope with issues during the adoption process [36]. This, in turn, improves the ongoing profitability of the cooperative members. On the contrary, market cognition has a significant negative impact on the net agricultural income for continuous adopters. Each unit increase in the market cognition of continuous adopters reduces their net agricultural income by RMB 8110. Farmers who are highly aware of market risk perception are extremely sensitive to market changes. They adjust their production behavior in time in response to these changes, such as delaying fishing or selling crayfish at low prices. While this approach reduces farmers’ income in the short term, it does not affect their ability to adopt RCT continuously in the long term.
4.3. Average Treatment Effect (TEM) of Continuous Adoption of RCT on Net Agricultural Income
With the TEM estimation, the ATE of continuous adoption of RCT on net agricultural income for farmers can be computed. Table 3 shows that continuous adoption of RCT by farmers has a significant positive impact on net agricultural income at the statistical level of 1%. If the farmers who continue to adopt RCT do not continue to adopt it, their net agricultural income would decrease by RMB 83,430. It appears that farmers’ net agricultural income can grow significantly with the continuous adoption of RCT.
Table 3.
Estimated results of average treatment effect.
This result may seem counterintuitive. The competitive market model suggests that when farmers adopt new agricultural technologies, the marginal output of agricultural products increases faster than demand. As the demand price elasticity is lower than the supply price elasticity, the income gain from increased supply is less than the income loss from falling prices. However, combined with China’s current national conditions, the continuous adoption of RCT can indeed increase farmers’ net agricultural income. From an agricultural policy perspective, the Chinese government formulated a policy to set a minimum purchase price for grain in 2004. Therefore, after farmers adopt RCT, if the price of rice on the market drops due to the increase in supply, the government will entrust grain enterprises to buy rice from farmers at a minimum purchase price to avoid damage to farmers’ income. From a geographical location perspective, the main area for RCT is in the middle and lower reaches of the Yangtze River in China. This region produces 30.5 % of China’s rice. Compared with rice monoculture, RCT can significantly increase rice yield by around 15%. That is to say, farmers continue to adopt RCT, which has a limited impact on the national rice supply. Judging from the transaction price, the price of crayfish has not declined significantly in recent years, according to the crayfish industry development report released by the National Fisheries Technology Extension Center in 2022. In addition, the trend of crayfish prices has remained basically stable from 2019 to 2021. The crayfish industry report also noted that the price of crayfish tended to be stable and farmers generally made a profit in 2022. In addition, the market for crayfish in China is vast and nationwide. However, the area where crayfish can be raised is limited, mostly in the middle and lower reaches of China’s Yangtze River. Therefore, it is profitable for farmers to continue to adopt RCT.
4.4. Further Discussion
The empirical results in Table 3 confirm that the income effect of continuous adoption of RCT is extremely significant. However, there is a trend law in the income effect of agricultural technology. In other words, farmers who continue to adopt RCT may reap increased benefits, but it does not mean that “the more continuous, the higher income”. The “agricultural bicycle” theory posits that whether farmers can increase their income by adopting new technology depends on the balance of positive and negative forces. Overall, the income effect of technology adoption behavior exhibits an inverted U-shaped shift. It has been shown in several studies that the positive or negative income effect of farmers’ technology adoption behavior is time-span dependent [37]. In the short term, farmers who adopt RCT at an early stage gain excess profits by differentiating agricultural products on the market. However, in the long run, due to “technology spillover” and “learning by doing” effects, RCT becomes popular among farmers. Thus, the agricultural products produced by RCT lose their heterogeneity, and the excess profit disappears. For this reason, it is necessary to test the inverted U-shaped relationship between adoption years and the income effect of RCT based on the “agricultural bicycle” theory. Following that, the income effect of continuous adoption of RCT could be justified, and the optimal adoption years would be identified.
Table 4 shows the results of the U-shaped test. As shown in Table 4, the interval where slope is located has a negative value, indicating an inverted U-shaped relationship between the adoption years and the adoption behavior of RCT. This suggests that farmers’ income initially increases and then decreases after adopting RCT. The extreme value shown in Table 4 is 4.562. That said, the RCT yields the most significant increase in income at four and a half years. Beyond this point, there will be a decline in income growth and even a loss.
Table 4.
Inverted U-shaped test results of adoption years and income effect.
4.5. Moderating Effect Test
To assess the moderating effect of non-farm employment, in this paper, the income effect of continuous adoption of RCT between farmers with and without non-farm employment is compared [38]. As shown in Table 5, in the absence of non-farm employment, the ATE of continuous adoption of RCT on net agricultural income is negative and significant at the 1% statistical level. On the contrary, in the case of non-farm employment, the ATE is positive and significant at the 1% statistical level. Specifically, farmers who reject non-farm employment but continue to adopt RCT will have their net agricultural income reduced by RMB 93,430 compared to noncontinuous adopters. Correspondingly, farmers who participate in non-farm employment and continue to adopt RCT will experience an increase in net agricultural income of RMB 104,510. As the likelihood of non-farm employment increases, the income effect of continuous adoption of RCT shifts from negative to positive. That is, for farmers engaged in non-farm employment, the continuous adoption of RCT shows a positive income effect; otherwise, the income effect is negative. Therefore, it can be judged that non-farm employment positively moderates the relationship between continuous adoption of RCT and net agricultural income.
Table 5.
Test results for the moderating effect of non-farm employment.
The results of Table 5 also show that in the process of farmers’ continuous adoption of RCT, non-farm employment is more characterized by the “information acquisition effect” and “income effect” rather than the “labor loss effect”. The likely reason is that farmers differ in the location and degree of non-farm employment [39]. Farmers employed in local non-farm jobs return to farming during the busy season. During the holidays, farmers with a relatively low level of non-farm employment return home to plow their fields. In this way, it can not only alleviate the “labor loss effect”, but also encourage the timely transfer of what they have seen, heard, and gained during the period of non-farm employment to other laborers at home, which enhances the “information acquisition effect” and “income effect”. Therefore, non-farm employment ultimately plays a positive moderator role.
4.6. Robustness Test
To ensure the stability of the empirical results, robustness tests were performed on the results in Table 4 and Table 5. In some cases, farmers may conceal their income and output, resulting in outliers. In view of this, the left tail reduction in the explained variable (net agricultural income) was carried out, replacing the value below the 1% quantile with the value at the 1% quantile. We then used the TEM to re-estimate the income effect of the continuous adoption of RCT, as well as the moderating effect of non-farm employment. Table 6 shows the robustness test results. These robustness test results are in good agreement with the empirical results in Table 4 and Table 5, which indicates that the empirical results in this paper are reasonably robust.
Table 6.
Robustness test results.
5. Conclusions and Policy Implications
5.1. Conclusions
Given the objectives and challenges of China’s green development in agriculture, in this study, the income effect and income growth mechanism of RCT are examined in terms of continuous adoption. Additionally, the moderating effect of non-farm employment on the income effect of continuous adoption of RCT is also explored. Based on the above analysis, this paper draws three main conclusions. First, the income effect of continuous adoption of RCT is significant. That is, the net agricultural income will increase after farmers’ continuous adoption of RCT. Compared with noncontinuous adopters, the RCT will increase the net agricultural income of continuous adopters by RMB 83,430. Second, the optimal adoption period for RCT is four and a half years. At this point, the agricultural net income of farmers adopting RCT reaches its peak. Since this time point, there will be a decline in income growth and even a loss year by year. Third, non-farm employment positively moderates the relationship between continuous adoption of RCT and net agricultural income. In other words, the greater the farmers’ propensity to participate in non-farm employment, the more pronounced the income effect of their continuous adoption of RCT. Farmers who participate in non-farm employment and continue to adopt RCT will experience an increase in net agricultural income of RMB 104,510. However, for farmers who do not participate in non-farm employment, even if they continue to adopt RCT, their net agricultural income will still decrease by RMB 93,430. Fourth, land scale, land blocks, difficulty cognition, and perceived usefulness are important factors affecting farmers’ continuous adoption of RCT. Among them, land scale, land blocks, and perceived usefulness play an important role in driving the continuous adoption of RCT by farmers. Difficulty cognition greatly inhibits farmers’ continuous adoption of RCT. Five, land scale, cooperative involvement, and market cognition have a significant impact on the income effect of farmers’ continuous adoption of RCT. Land scale and cooperative involvement can enhance the income effect of the continuous adoption of RCT. On the contrary, market cognition has a significant weakening effect on this income effect.
5.2. Policy Implications
Based on the above conclusions, this paper puts forward the following three policy recommendations. The first is to encourage farmers to make continuous adoption decisions as far as possible when adopting RCT. In particular, agricultural technology extension departments should emphasize not only the technical operations but also popularize the income-increasing attributes and laws behind RCT with farmers. In this way, we can promote farmers’ continuous adoption behavior and ensure their access to RCT benefits. Second, actively cultivate the leading enterprises of “rice + crayfish”. The development of rice and crayfish industry chain should focus on leading enterprises as the core, with RCT as the foundation. As a result, RCT will be able to evolve from product production to industrial development. Third, support farmers who continuously adopt RCT to participate in non-farm employment. Government departments should provide institutional support for farmers’ non-farm employment through reforms in household registration and social security. Meanwhile, the government will continue to promote the integration of primary, secondary, and tertiary industries to expand the non-farm employment market. As a result, it can expand income streams for farmers and unleash the feed-back and risk-resilience functions of non-farm employment to agriculture.
Author Contributions
Conceptualization, Z.T., X.W., Z.L. (Zekui Lei) and Z.Q.; formal analysis, Z.T. and Z.L. (Zekui Lei); funding acquisition, Z.L. (Zekui Lei); investigation, Z.T., X.W., and Z.L. (Zhe Liu); methodology, Z.T., X.W. and Z.L. (Zhe Liu); project administration, Z.L. (Zekui Lei); resources, Z.L. (Zekui Lei); software, Z.T. and Z.L. (Zekui Lei); supervision, Z.Q.; writing—original draft, Z.T.; writing—review and editing, X.W. All authors have read and agreed to the published version of the manuscript.
Funding
This research was financed by National Natural Science Foundation of China (72273049), and the Talent Introduction Project of Hubei Normal University in 2023 (HS2023RC032).
Institutional Review Board Statement
Not applicable.
Data Availability Statement
The associated dataset of this study is available upon request to the corresponding author.
Conflicts of Interest
The authors declare no conflicts of interest.
References
- Han, J. Follow Xi Jinping’s thought of “agriculture, rural and rural areas”, carryout rural revitalization strategy. J. Manag. World. 2018, 34, 1–10. [Google Scholar]
- Li, Y.; MA, J. Analysis of income effect differences of scientific fertilization technology: An empirical estimation based on farmers’ initial endowment. J. Agrotech. Econ. 2021, 7, 18–32. [Google Scholar]
- Cao, C.; Jiang, Y.; Wang, J.; Yuan, P.; Chen, S. “Dual character” of rice-crayfish culture and strategies for its sustainable development. Chin. J. Eco-Agric. 2017, 25, 1245–1253. [Google Scholar]
- Yang, Y.; Lin, W. The income-increasing effect of agricultural technological progress: A test based on provincial panel data in china. Econ. Sci. 2016, 5, 45–57. [Google Scholar]
- Sang, X.; Luo, X.; Razzaq, A.; Huang, Y.; Erfanian, F. Can agricultural mechanization services narrow the income gap in rural China? Heliyon. 2023, 9, 13367. [Google Scholar] [CrossRef] [PubMed]
- Wang, X.; Li, Y.; Xu, C. Adoption of organic fertilizer technology can promote tea farmers to increase income. J. Arid. Land Resour. Environ. 2022, 36, 56–61. [Google Scholar]
- Pretty, J.; Bharucha, Z. Integrated pest management for sustainable intensification of agriculture in Asia and Africa. Insects 2015, 6, 152–182. [Google Scholar] [CrossRef]
- Yang, X.; Deng, X.; Zhang, A. Does conservation tillage adoption improve farmers’ agricultural income? A case study of the rice and fish co-cultivation system in Jianghan Plain, China. J. Rural. Stud. 2023, 103, 103108. [Google Scholar]
- Keil, A.; Mitra, A.; Srivastava, A.; Mcdonald, A. Social inclusion increases with time for zero-tillage wheat in the Eastern Indo-Gangetic Plains. World Dev. 2019, 123, 104582. [Google Scholar] [CrossRef]
- Arslan, F. Production-water user association performance nexus in mediterranean irrigated agriculture: The case of banana in Türkiye. Agric. Water Manag. 2024, 292, 108650. [Google Scholar] [CrossRef]
- Koester, U. Broad Outline of the Agricultural Market Theory; Vahlen: Münich, Germany, 1992. [Google Scholar]
- Huang, Z.; Qian, F. The influence of technological progress on farmers’ income in china and its countermeasures. Chin. Rural. Econ. 2003, 12, 11–17. [Google Scholar]
- Wu, D.; Liu, F. Difficulties and countermeasures of agricultural technology innovation promoting the steady growth of farmers’ income. Econ. Rev. J. 2017, 2, 115–119. [Google Scholar]
- Dong, F.; Mitchell, P. Economic and risk analysis of sustainable practice adoption among U.S. corn growers. Agric. Syst. 2023, 211, 103730. [Google Scholar] [CrossRef]
- Shively, G. Poverty, consumption risk, and soil conservation. J. Dev. Econ. 2001, 65, 267–290. [Google Scholar] [CrossRef]
- Mbaga-Semgalawe, Z.; Folmer, H. Household adoption behavior of improved soil conservation: The case of the North Pare and West Usambara Mountains of Tanzania. Land Use Policy 2000, 17, 321–336. [Google Scholar] [CrossRef]
- Yu, W.; Luo, X.; Huang, Y.; Li, R. Internal perception, external environment and the replacement of organic fertilizer by peasant households continued use. J. Agrotech. Econ. 2019, 5, 66–74. [Google Scholar]
- Bhattacherjee, A. Understanding information systems continuance: An expectation-confirmation model. Manag. Inf. Syst. Q. 2011, 25, 351–370. [Google Scholar] [CrossRef]
- Xv, Z.; Zhang, J.; Lv, K. The scale of operation, term of land ownership and the adoption of intertemporal agricultural technology: An example of “straw return to soil directly”. Chin. Rural Econ. 2018, 3, 61–74. [Google Scholar]
- Parimalam, P.; Padmanaban, P.; Nallakurumban, B.; Swaminathan, C.; Surya, R. Drudgery reduction through the use of handheld fertilizer applicator. In International Conference of the Indian Society of Ergonomics, Proceeding of the HWWE 2021, Guwahati, India, 1–3 December 2021; Rana, N.K., Shah, A.A., Iqbal, R., Khanzode, V., Eds.; Design Science and Innovation; Springer: Singapore, 2022; pp. 163–169. [Google Scholar]
- Li, Y.; Huan, M.; Jiao, X.; Chi, L.; Ma, J. The impact of labor migration on chemical fertilizer use of wheat smallholders in China- mediation analysis of socialized service. J. Clean Prod. 2023, 394, 136366. [Google Scholar] [CrossRef]
- Zhou, W.; Xue, P.; Xu, D. Exploring disparities in employment location and structure: The influence of off-farm employment on reducing chemical fertilizer usage. J. Clean. Prod. 2024, 440, 140720. [Google Scholar] [CrossRef]
- Huang, X.; Lu, Q.; Wang, L.; Cui, M.; Yang, F. Does aging and off-farm employment hinder farmers’ adoption behavior of soil and water conservation technology in the Loess Plateau? Int. J. Clim. Change Strat. Manag. 2020, 12, 92–107. [Google Scholar] [CrossRef]
- Wu, Y.; Li, Y.; Niu, L.; Zhang, W.; Wang, L.; Zhang, H. Nutrient status of integrated rice-crayfish system impacts the microbial nitrogen-transformation processes in paddy fields and rice yields. Sci. Total Environ. 2022, 836, 155706. [Google Scholar] [CrossRef]
- Hou, J.; Styles, D.; Cao, Y.; Ye, X. The sustainability of rice-crayfish coculture systems: A mini review of evidence from Jianghan plain in China. J. Sci. Food Agric. 2021, 101, 3843–3853. [Google Scholar] [CrossRef]
- Yu, H.; Zhang, X.; Shen, W.; Yao, H.; Meng, X.; Zeng, J.; Zhang, G.; Zamanien, K. A meta-analysis of ecological functions and economic benefits of co-culture models in paddy fields. Agric. Ecosyst. Environ. 2023, 341, 108195. [Google Scholar] [CrossRef]
- Yu, W. Study on the first and continuous adoption behavior of green production technology by rice farmers. Ph.D. Thesis, Huazhong Agricultural University, Wuhan, China, 2020. [Google Scholar]
- Zhang, Q. Theory and Practice of “Shuangshui Shuanglv” (Two-Aquatics and Double-Green) Industry Development; Science Press: Beijing, China, 2021. [Google Scholar]
- Bointner, R.; Schubert, K. The influence of experience and knowledge on reactor safety in Germany. J. Nucl. Sci. Technol. 2016, 53, 1009–1020. [Google Scholar] [CrossRef]
- Chen, Z.; Li, X.; Xia, X.; Zhang, J. The impact of social interaction and information acquisition on the adoption of soil and water conservation technology by farmers: Evidence from the Loess Plateau, China. J. Clean. Prod. 2024, 434, 139880. [Google Scholar] [CrossRef]
- Kung, J. Off-farm labor markets and the emergence of land rental markets in rural China. J. Comp. Econ. 2022, 30, 395–414. [Google Scholar] [CrossRef]
- Thong, J.; Hong, S.; Tam, K. The effects of post-adoption beliefs on the expectation-confirmation model for information technology continuance. Int. J. Hum. Comput. Stud. 2006, 64, 799–810. [Google Scholar] [CrossRef]
- Qin, F.; Wang, J.; Xv, Q. How does the digital economy affect farmers’ income? Evidence from the development of rural e-commerce in China. China Econ. Q. 2022, 22, 591–612. [Google Scholar]
- Becerril, J.; Abdulai, A. The impact of improved maize varieties on poverty in Mexico: A propensity score-matching approach. World Dev. 2010, 38, 1024–1035. [Google Scholar] [CrossRef]
- Gong, M.; Zhong, Y.; Zhang, Y.; Elahi, E.; Yang, Y. Have the new round of agricultural land system reform improved farmers’ agricultural inputs in China? Land Use Pol. 2023, 132, 106825. [Google Scholar] [CrossRef]
- Yang, D.; Zhang, H.; Liu, Z.; Zeng, Q. Do cooperatives participation and technology adoption improve farmers’ welfare in China? A joint analysis accounting for selection bias. J. Integr. Agric. 2021, 20, 1716–1726. [Google Scholar] [CrossRef]
- Manda, J.; Feleke, S.; Mutungi, C.; Tufa, A.; Mateete, B.; Abdoulaye, T.; Alene, A. Assessing the speed of improved postharvest technology adoption in Tanzania: The role of social learning and agricultural extension services. Technol. Forecast. Soc. Change 2024, 202, 123306. [Google Scholar] [CrossRef]
- Kassie, M.; Fisher, M.; Muricho, G.; Diiro, G. Women’s empowerment boosts the gains in dietary diversity from agricultural technology adoption in rural Kenya. Food Pol. 2020, 95, 101957. [Google Scholar] [CrossRef]
- Yang, J.; Wan, Q.; Bi, W. Off-farm employment and grain production change: New evidence from China. China Econ Rev. 2020, 63, 101519. [Google Scholar] [CrossRef]

Disclaimer/Publisher’s Note: The statements, opinions and data contained in all publications are solely those of the individual author(s) and contributor(s) and not of MDPI and/or the editor(s). MDPI and/or the editor(s) disclaim responsibility for any injury to people or property resulting from any ideas, methods, instructions or products referred to in the content. |
© 2024 by the authors. Licensee MDPI, Basel, Switzerland. This article is an open access article distributed under the terms and conditions of the Creative Commons Attribution (CC BY) license (https://creativecommons.org/licenses/by/4.0/).