Article

Field Performance Evaluation of Low-Cost Soil Moisture Sensors in Irrigated Orchard

1
Faculty of Agrobiotechnical Sciences Osijek, Josip Juraj Strossmayer University of Osijek, 31000 Osijek, Croatia
2
Agricultural Institute Osijek, 31000 Osijek, Croatia
3
Department of Biosystems Engineering, Faculty of Engineering, Alanya Alaaddin Keykubat University, 07450 Antalya, Turkey
*
Author to whom correspondence should be addressed.
Agriculture 2024, 14(8), 1239; https://doi.org/10.3390/agriculture14081239 (registering DOI)
Submission received: 27 June 2024 / Revised: 24 July 2024 / Accepted: 25 July 2024 / Published: 27 July 2024
(This article belongs to the Section Agricultural Soils)

Abstract

:
Measuring the soil water content (SWC) is a fundamental component of the sustainable management of water resources, soil preservation, and high irrigation efficiency. Non-destructive SWC measurements using soil moisture sensors (SMSs) enables timely irrigation and reduces overirrigation and water stress. Within this context, the performance of four commercial single-point soil moisture sensors (Watermark and tensiometer (Irrometer Company, Inc., Riverside, CA, USA), SM150 (Delta-T Devices, Cambridge, UK)), FieldScout TDR300 (Spectrum Technologies, Aurora, IL, USA) and one soil profile PR2 probe (Delta-T Devices, Cambridge, UK) were tested under anthropogenic eutric cambisol with a silty clay loamy texture (20, 30, and 40 cm) to evaluate accuracy and sensitivity to changes in the SWC in an irrigated apple orchard. The Watermark and tensiometer were additionally tested in the laboratory to convert soil water tension (kPa) to the volumetric soil water content (%vol.). In general, all tested SMSs responded to changes in the SWC, with sensor-to-sensor differences. The Watermark and tensiometer underestimated the SWC, while the TDR overestimated the SWC. The SM150 and PR2 showed high accuracy, i.e., SM150—RMSE-2.24 (20 cm), 2.18 (30 cm) and 2.34 (40 cm), MSE—5.02 (20 cm), 2.93 (30 cm) and 1.89 (40 cm), and PR2—RMSE-1.8 (20 cm), 1.3 (30 cm) and 1.55 (40 cm), MSE-3.23 (20 cm), 1.7 (30 cm) and 2.39 (40 cm) at all observed soil depths.

1. Introduction

One of the most important factors in irrigation scheduling is to determine the irrigation time as accurately as possible, which will condition the water productivity (WP) or irrigation efficiency (IE) [1,2,3,4,5], sustainable management of nutrients [6,7,8], preservation of soil moisture [9], soil physical properties [10], and ultimately efficient crop production [11]. Excessive irrigation frequently occurs at the field scale, leading to the wastage of valuable water and energy resources, agricultural run-off, pollution of the surface and groundwater, and depletion of water sources and soil nutrients, and it can also cause soil salinization [12]. On the other hand, insufficient irrigation can induce water stress, leading to lower yields and impaired crop quality [13,14]. Generally, irrigation scheduling can be classified into three categories: visual and feel methods (crop and soil), water-balance-based methods, and monitoring of the soil water content (SWC). Effective irrigation scheduling based on monitoring the SWC provides real-time data for the upper (field water capacity, FWC) or lower SWC limit (management allowable depletion, MAD), which reduces the previously mentioned negative consequences of improper irrigation scheduling. Different versions of SMSs that measure the soil water potential (tensiometers and gypsum blocks), neutron scattering methods, soil water dielectrics (Time domain reflectometry, TDR and Frequency domain reflectometry, FDR), gamma ray method, neutron probes are available on the market. In the last few decades, significant advances have been made in the development and improvement of technologies in the field of soil moisture sensors (SMSs) that facilitate decision-making in irrigated crop production. The aspiration is to create SMSs that are accurate, respond quickly to changes in the dry and wet soil phases, are long-lasting, easy to use, and ultimately low-cost. As stated by Yu et al. [10], in the future, SMSs should be developed to achieve high-precision, low-cost, non-destructive, automated, and highly integrated systems. Although great efforts are being made to ensure that SMSs meet all the criteria, it seems that ultimately the choice of SMSs by agricultural producers will depend on the price. On-farm irrigation scheduling based on weather, crops, personal calendar schedule, and the soil feel method are commonly used methods of irrigation scheduling in the Republic of Croatia, where very low interest in accepting new technologies in irrigation scheduling is shown. During the last twenty years in Croatia, great efforts have been made to increase irrigated surfaces, on which cereals are mostly grown, while income crops are less represented. In the 2005 to 2020 period, through the National Project of Irrigation and Land and Water Management in the Republic of Croatia, 16 public irrigation schemes with a total area of 11,579 ha were built, and a total of 8 public irrigation schemes were rehabilitated with a total area of 4623 ha. The total area of public irrigation schemes that have been implemented, are being implemented, or have been rehabilitated is 16,382 ha [15]. Although the occurrence of intense and long-lasting droughts in this area is becoming more frequent [16], agricultural producers still find it difficult to decide on irrigation. The exception is in fruit growing, where modern and intensive production in climate change conditions is nearly impossible without irrigation, which the producers have recognized. However, even in this area of agricultural production, the application of scientifically based methods in determining the irrigation time is lacking, which raises concerns in the context of the use and sustainability of water resources. The main reason for this is the lack of basic knowledge about irrigation scheduling, i.e., the infiltration rate, SWC, soil water movement, and impossibility of interpreting the obtained measurements and using them as practical guidelines. Nowadays, many low-cost and easy-to-use SMSs are available on the market, which can be useful in planning the orchard irrigation scheduling. Numerous previous studies have focused on testing SMSs in different soil types, at different soil depths, installation positions, and with different irrigation systems [17,18,19,20,21,22,23,24,25,26,27,28,29]. To the greatest extent, the study results, that is, the SWCs obtained by SMS measurements were compared with the actual SWCs obtained by the gravimetric method (GM). Although the GM is the most accurate method for the analysis of the soil water content (SWC) and is cost-effective and reliable, in irrigation scheduling, it is impractical, time-consuming, and destructive. Due to the high accuracy of the GM, it has been used as a scientific reference method to calibrate SMSs in different soil types and installation depths, including in our study. The bibliometric analysis presented by Singh et al. [30] shows various methods not only for direct (gravimetric and volumetric methods) and indirect (SMS) measurements of the SWC but also remote sensing and machine learning approaches. Their analysis showed that TDR is the most widely used indirect method for measuring the SWC. Additionally, the authors conclude that the use of soil moisture information coupled with machine learning algorithms has created a new era in the fields of hydrology, climate change studies, and agriculture. The study goal is to test, evaluate, and propose an SMS that is easy to use, low cost, responds quickly to changes in the SWC, is effective, and gives accurate real-time SWC data in an irrigated orchard with respect to performance accuracy at different soil depths and installation orientations. These evaluations were conducted using four commercial single-point SMSs and one commercially available soil profile probe, Watermark and tensiometer (Irrometer Company, Inc., Riverside, CA, USA), PR2 probe (Delta-T Devices, Cambridge, UK), SM150 (Delta-T Devices, Cambridge, UK), and FieldScout TDR300 (Spectrum Technologies, Aurora, IL, USA), under anthropogenic eutric cambisol (WRB) with a silty clay loamy texture. A decision-making guide is being provided to facilitate the selection of the SMS, both effectiveness-wise and cost-wise, not only in the irrigated orchard but for a wider range of drip-irrigated crops.

2. Materials and Methods

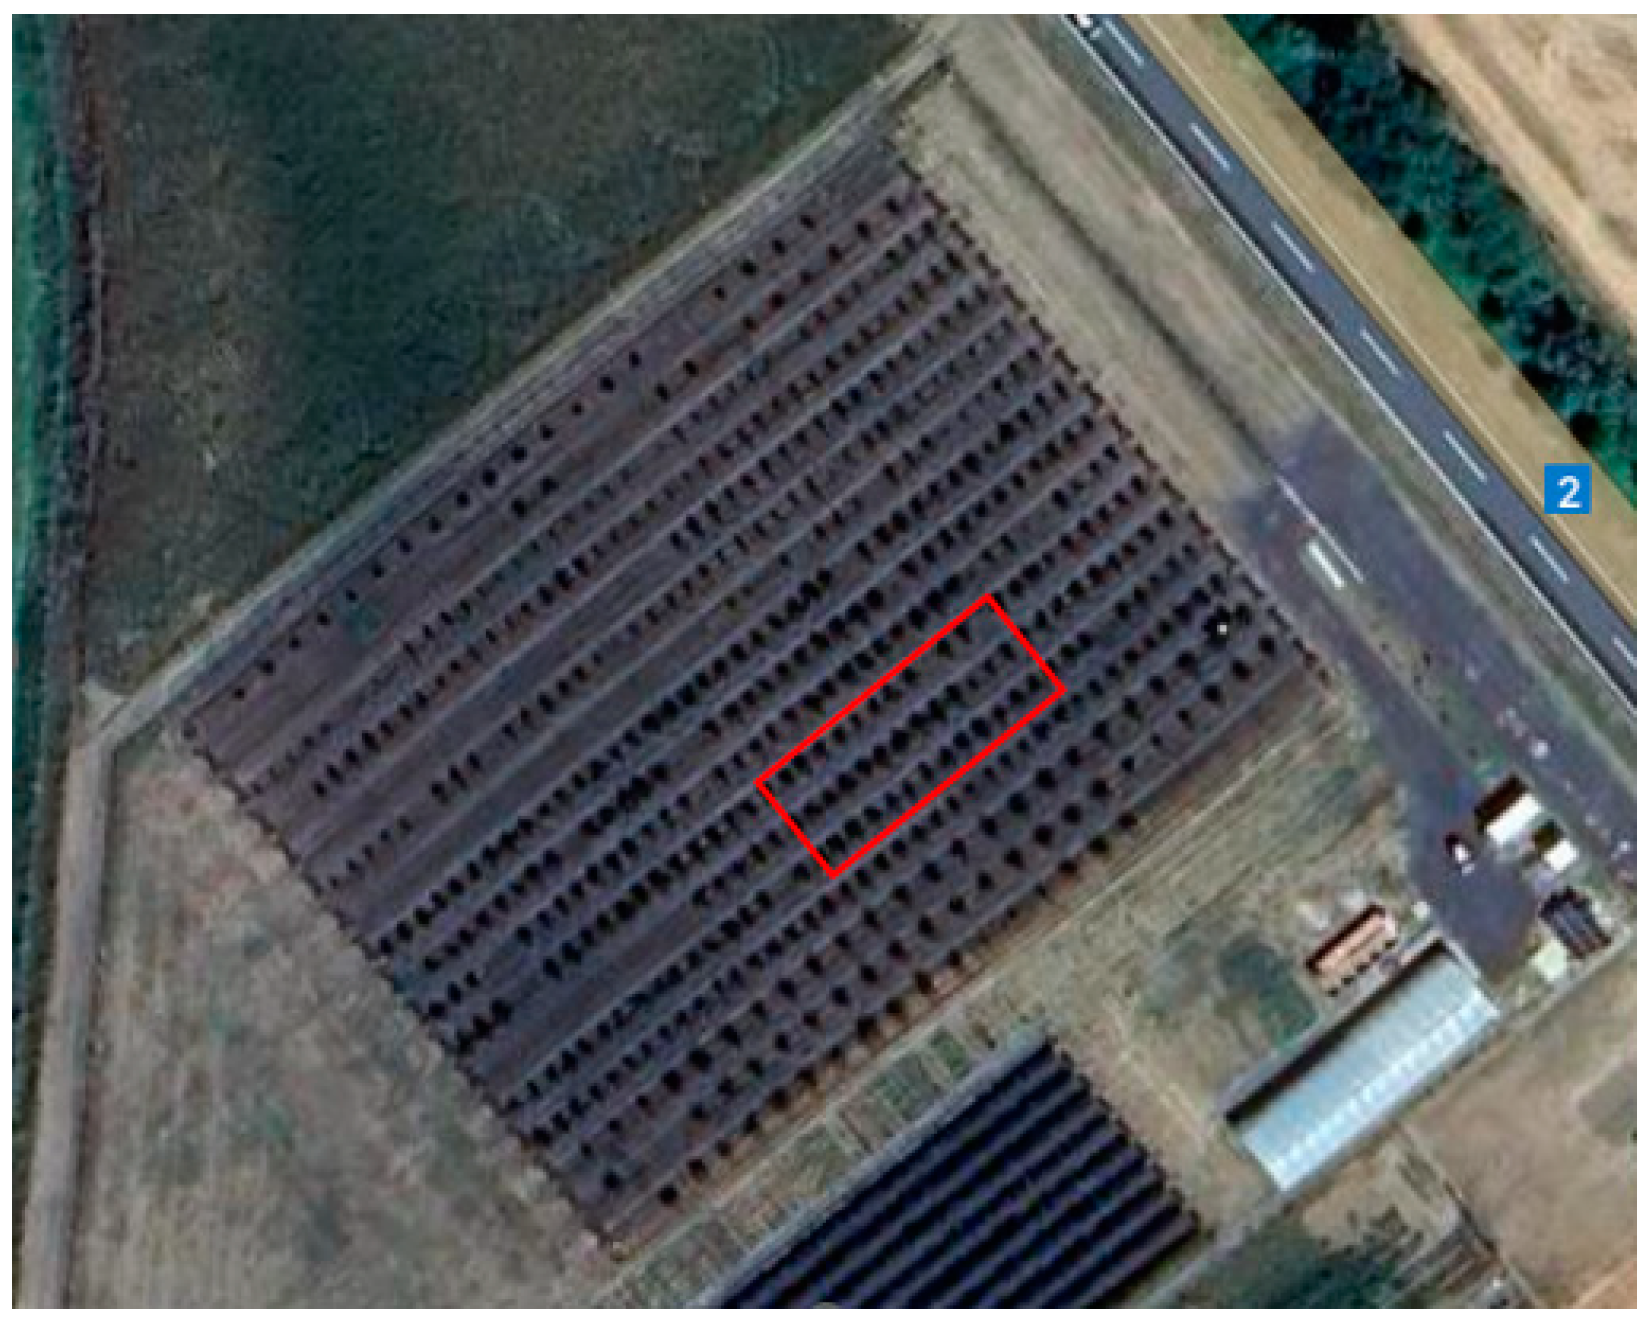
The field study was carried out in the 2022 growing season at the experimental station of the Faculty of Agrobiotechnical Sciences Osijek in Tenja, continental Republic of Croatia (45°51′ N and 18°78′ E, 91 m altitude). The performance of SMSs was tested in an irrigated apple (Malus domestica) orchard of the ‘Lijepocvjetka’ traditional Croatian variety, planted in 2019. The total area of experimental field is 5000 m2. The distance between the trees is 2.5 m, and the distance between rows is 4.5 m (Figure 1 and Figure 2).
During the vegetation period, the field was fertilized as appropriate and treated against diseases and pests according to common agricultural practices. The study site has anthropogenic eutric cambisol (WRB), and a silty clay loamy texture. The main properties given in Table 1 were previously presented by Marković et al. [31].
The long-term (LTA, 1961–1990) average annual rainfall in this area is 650 mm, while the average growing season rainfall is 368 mm. In the last decade, the area has been affected by frequent changes in weather extremes in a very short period, which negatively affected agricultural production [32,33,34]. The weather data (rainfall (mm), air temperatures (°C), air humidity (%), wind speed (km day−1), and insolation (h)) during the study period were collected using the weather station located at the experimental site. The weather and soil data collected from the experimental site were used to analyse crop water requirements (CWR) with a CROPWAT 8.0 computer model. The effective rainfall was determined according to the USDA method integrated into the CROPWAT model. As for the soil, the following input parameters were used: 180 mm day−1 for the maximum rain infiltration rate, 300 cm for the maximum rooting depth, 40% for the initial soil moisture depletion, and 130 mm for the total available soil moisture. The soil data used for the model were collected from a previous pedological analysis. In the CROPWAT model, the Penman–Monteith method for calculating reference evapotranspiration (ETo) was integrated, and the following crop coefficients (kc) were used for apple to determine crop evapotranspiration (ETc): 0.5 (kcini), 1.2 (kcdev, mid) and 0.95 (kclate). The 3-year-old apple orchard is irrigated using a drip irrigation system installed above ground (60 cm) with 90 cm emitter space along the drip line. The emitter’s irrigation uniformity was determined for each tree row in the study by measuring the water level in cans located below the emitter. The cans were located to define irrigation uniformity and its effect on the SMS readings with high accuracy. The emitter flow rate was 4 L h−1. The irrigation rate was determined according to the SWC at field capacity (FC, 38.7% vol. as an average of two tested soil depths), soil wetting depth (50 cm), and management allowable depletion (MAD) of 50%. The MAD for apple orchard was set according to Özmen [35]. During the study period, the water table was approximately 3 m deep, and it did not influence the soil water content in the root zone during the growing season.
Irrigation water was pumped from a nearby well, 39 m deep. The quality of irrigation water was analysed in terms of chemical properties. Results are given in Table 2 and were previously presented by Kojić et al. [36]. The obtained values were interpreted according to FAO [37] guidelines and no significant deviations were found, that is, water could be used without restrictions.

2.1. Soil Moisture Sensors

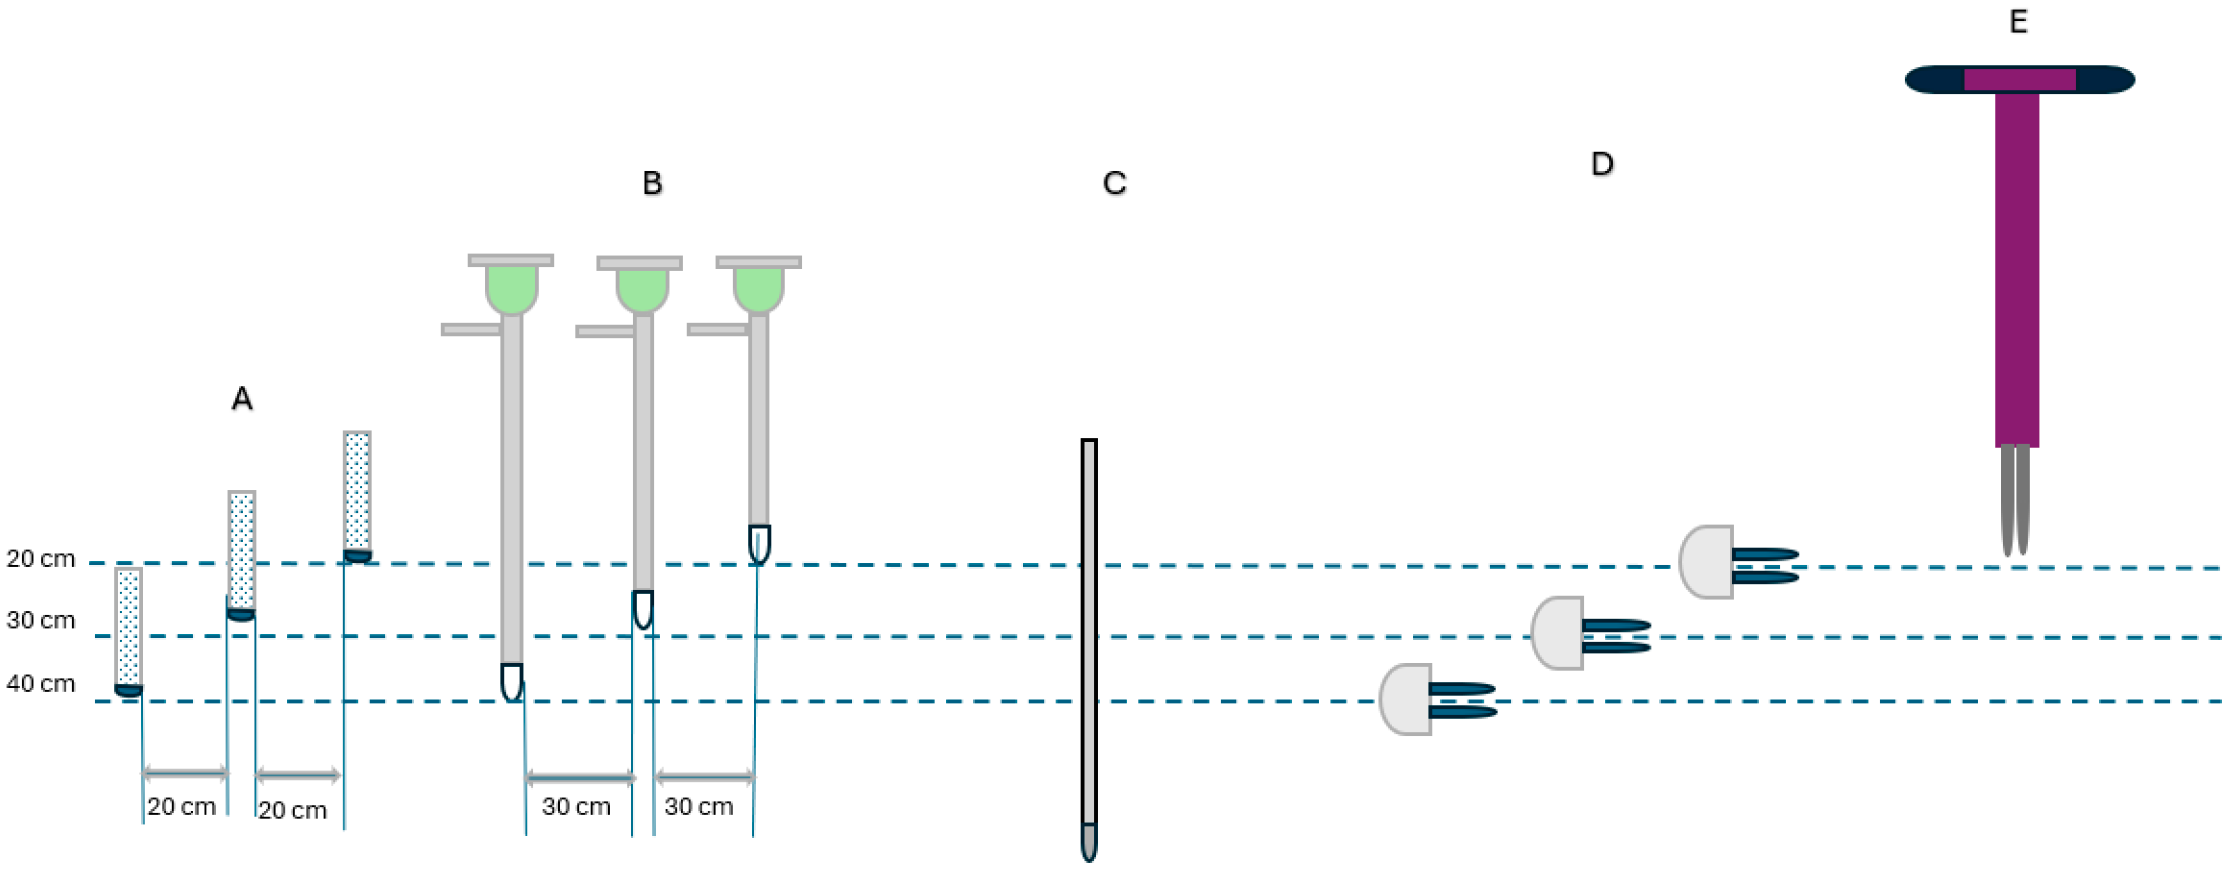
The performance of four commercial single-point SMSs and one soil profile probe were studied. SMSs were installed at 20, 30, and 40 cm depths and two orientations (horizontally or vertically), depending on the technical characteristics of the sensors. Therefore, Watermark (Figure 3A) and tensiometer (Figure 3B, Irrometer Company, Inc., Riverside, CA, USA) were installed vertically at 20, 30 and 40 cm depths, the PR2 probe (Delta-T Devices, Cambridge, UK) was installed vertically at a 40 cm soil depth (Figure 3C), and the SM150 (Delta-T Devices, Cambridge, UK) SMS was installed horizontally at 20, 30 and 40 cm soil depths (Figure 3D), while FieldScout TDR300 (Spectrum Technologies, Aurora, IL, USA) was inserted vertically at 20 cm (Figure 3E).
Sensors were installed at the mid-point between two drippers and 15 cm from the dripper. The installation procedure for all tested SMSs followed the manufacturer’s instructions. The sensors were installed on 10th May, in three sets, that is, three replicates, between trees so that they did not interfere with the tree roots. In addition, a set of SMSs was installed next to the experimental field, i.e., on a non-irrigated area, to monitor the SWC and SMS reaction in dry farming. In total, twelve Watermark, tensiometers, and SM150 sensors, four PR2 access tubes, and one portable TDR300 were used in the study. The Watermark and the tensiometer were prepared according to the manufacturer’s installation procedure. The sensors were wet and dried in several cycles and then installed wet at a certain depth (20, 30, or 40 cm). Additionally, before installation, the tensiometer was filled with water with algaecides, and a vacuum was established. The perpendicular soil opening was made using a soil auger with a diameter nearly the same as the SMS to enable the best possible contact of the SMS with the soil, that is, in undisturbed soil. Given that these two sensors measure soil water tension (SWT), the sensors were calibrated in the laboratory for the soil type at the study site to convert the SWT to SWC (%vol.). For the SMS laboratory calibration, the undisturbed soil samples were collected with sample rings (Eijkelkamp, Soil&Water, 300 cm3). The sample rings were hammered into two soil depths (≤30 cm and 30 to 60 cm), and afterward the top and the bottom of the soil sample were trimmed with a knife to remove the excess soil. In the laboratory, the samples were placed on a tray filled with distilled water. The Watermark sensors were placed in four sample rings and left for two days so that they could equilibrate with the matric potential of the soil water. After the surface of the sample was watered, that is, when the maximum water capacity (MWC) was reached, the soil samples were weighed daily on a precise digital scale, and at the same time, the measurements were taken with a Watermark handheld reader. Additionally, four soil samples were collected and used to determine the SWC using the gravimetric method. After a constant soil sample weight was reached, the soil samples were dried in an oven at 105 °C for 24 h. After the sample had dried to constant mass, the samples were weighted on a digital scale to determine the mass of the dry soil sample (Mds, g). Ultimately, the SWC was calculated according to the FAO [37] procedure as follows (Equation (1)):
S W C = ( M m s M d s ) M d s × 100
where SWC is the soil water content (%), Mms is the mass of moist soil (g), and Mds is the mass of the oven-dried sample (g). The volumetric water content (VWC, %vol.) was computed as described in Equation (2) [38]:
θv = θρb
where θv is the VWC, θ is gravimetric moisture (GM), while ρb is the soil bulk density (g cm−3). Given that the research was set up in three replicates, we performed a precision test as recommended by FAO [37] to ensure quality control. The relative percent difference (RPD) was calculated as follows (Equation (3)):
R P D   % = M 1 M 2 M 1 + M 2 2
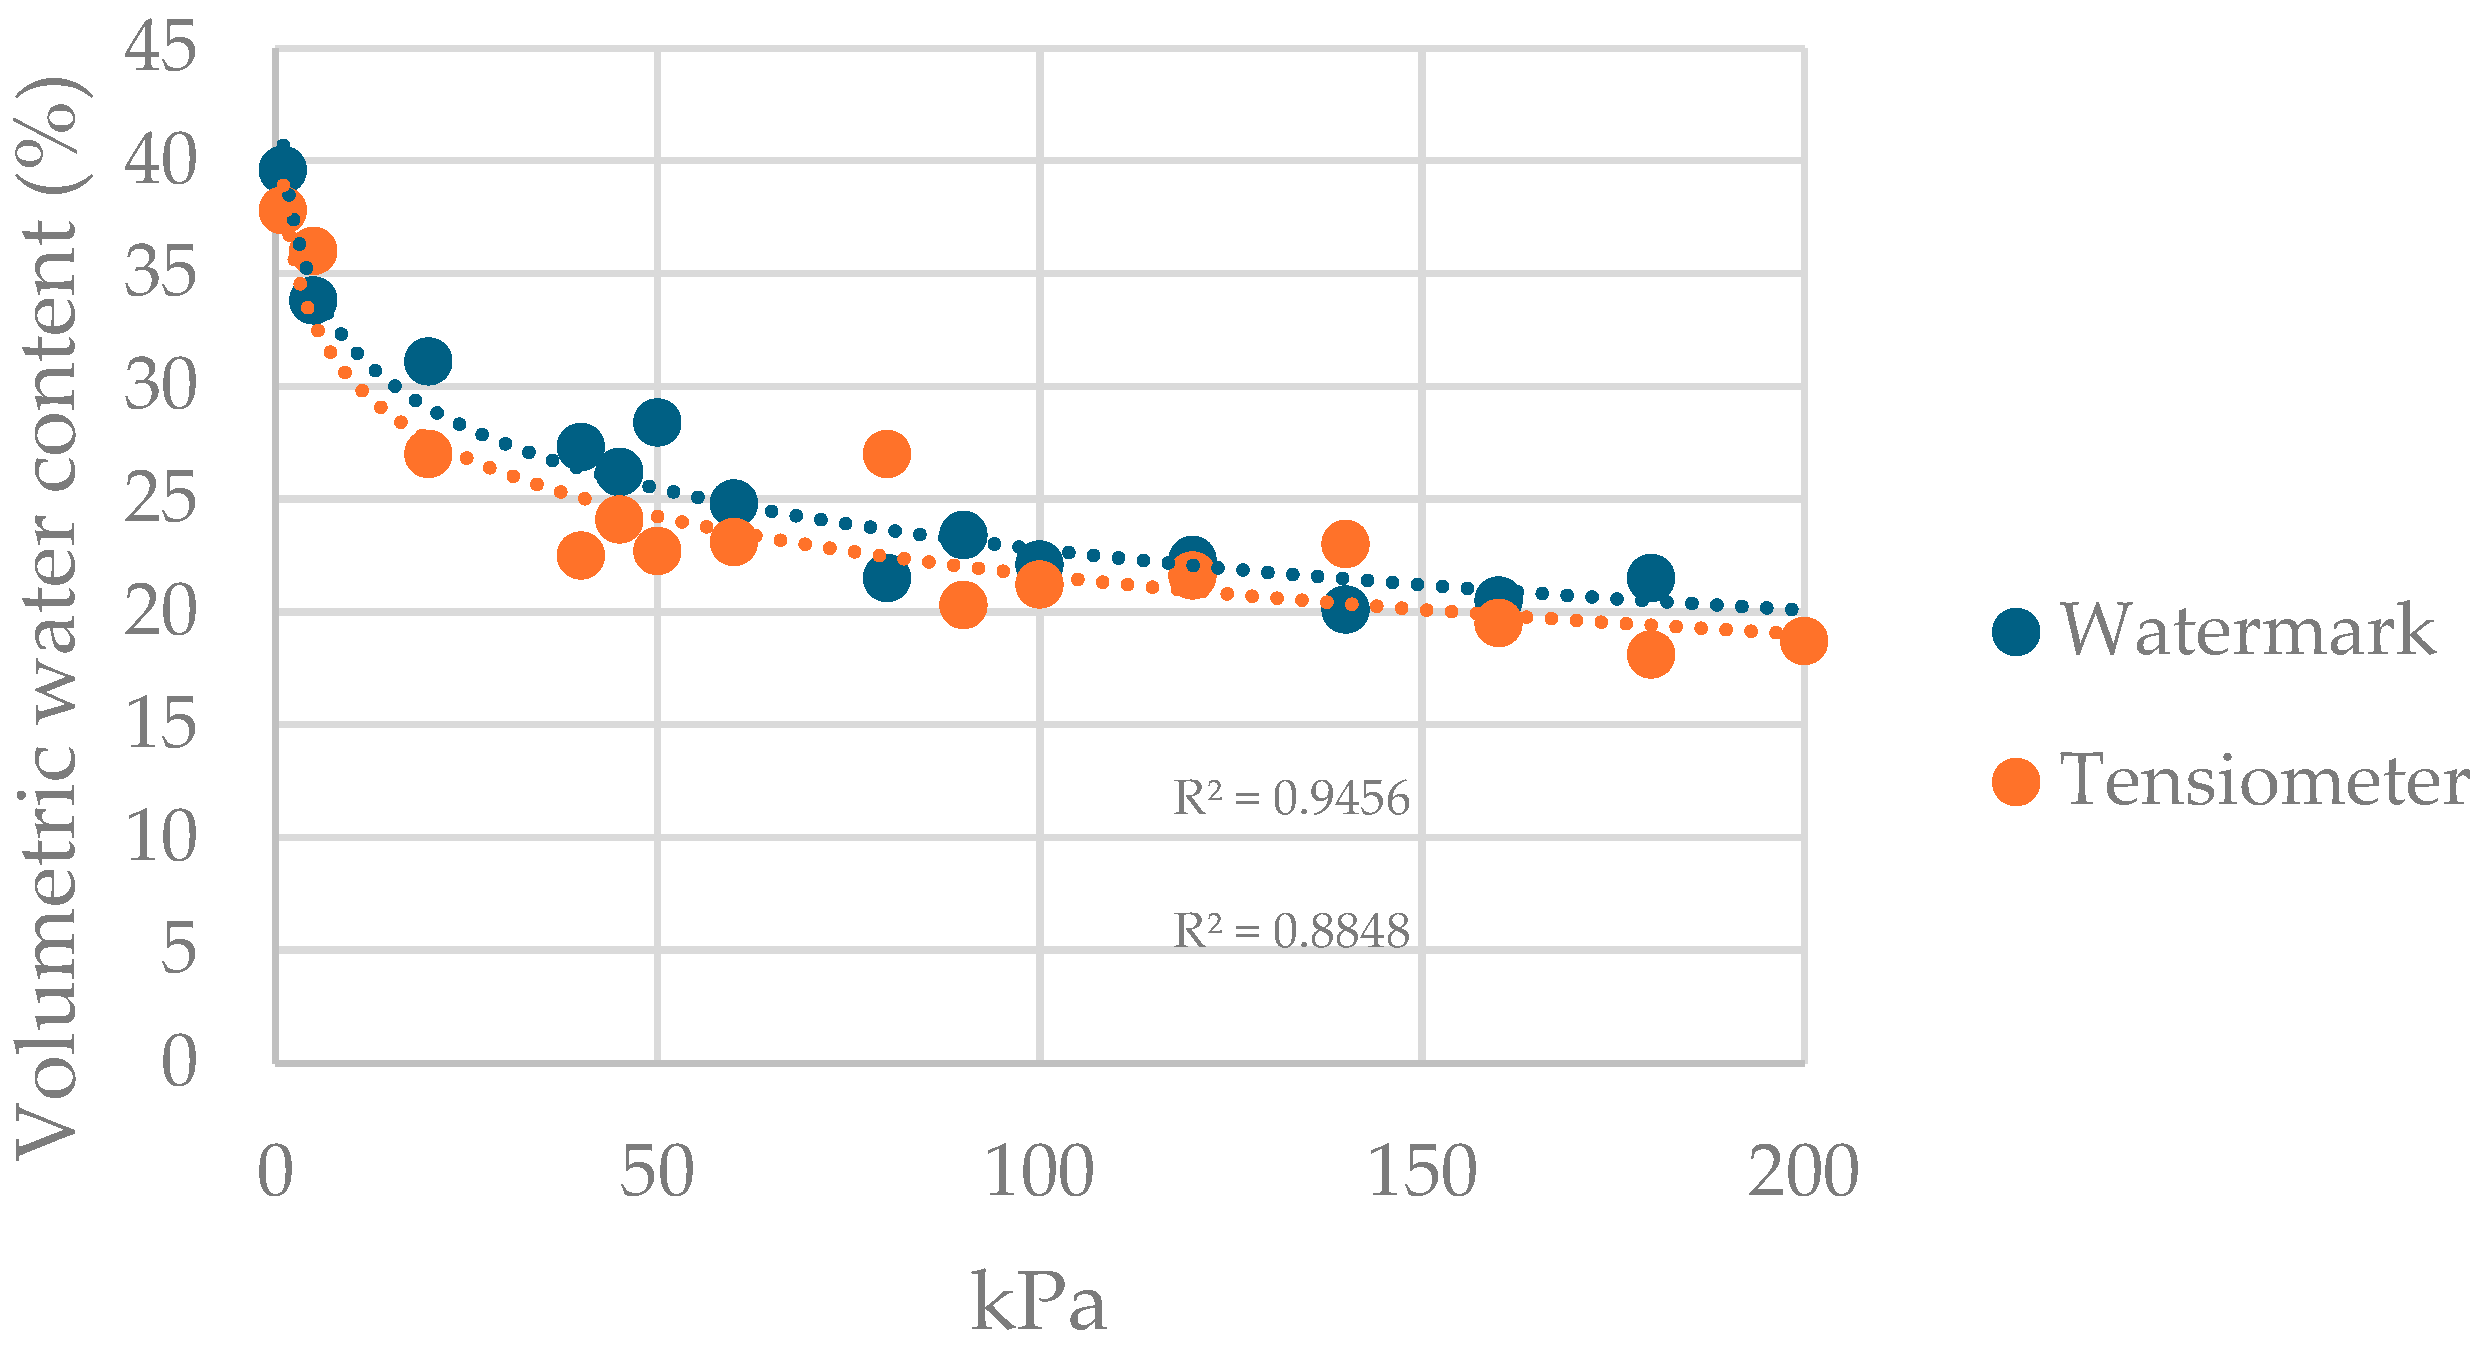
where RPD is the relative percent difference (%), M1 is result of a sample, and M2 is result of the sample’s duplicate. Calibration of the tensiometer was performed in the same manner as for the Watermark except for the size of the soil sampling container. The result of the calibration process is presented in the calibration curve in Figure 4.
PR2 access tubes were inserted in the prepared openings with a spiral soil auger (30 mm Ø) to ensure the best possible contact of the tube wall with the soil. A rubber ring provided in the set was placed around each access tube, and during the study period when the tubes were not in use, they were closed with rubber plugs to prevent the ingress of water or dust. A 40 × 30 cm hole was made for the horizontal orientation of the SM150 SMS. The sensors were placed parallel to the soil surface at a depth of 20, 30, or 40 cm, so that the two sensing rods measured the SMS in undisturbed soil. After the hole in the ground was buried, the cables were connected to the data logger. The TDR300 is a portable SMS that requires no prior preparation. In this study, predrilled holes were not necessary, because the SWC was generally maintained at a high level, and so there were no problems with inserting the sensor into the soil. However, we must emphasize that the 10 and 30 cm rods that are available on the market were excluded from this study. The shorter rod (10 cm) was excluded because the 10 cm soil layer has no meaning for the orchard due to water uptake in the deeper soil layer, while the longer rod (30 cm) was excluded because there was a distortion due to insertion into the soil due to the increased clay content, which would cause inaccurate measurements. The TDR300 takes readings in two different modes based on the soil clay content (%), i.e., standard mode (<27%) and high clay mode (>27%). Considering that the clay content in the soil present at the experimental field is on average 31%, the high clay mode was chosen for this research.
As for the SMS operational principle, in this study, the Watermark and tensiometer measure the physical force holding water in the soil or soil water tension (cbar or kPa), while the remaining SMSs in this study measure the percentage of water by volume (%vol.). A Watermark sensor (200SS) operates as an electrical resistance sensor that measures the soil water tension with two electrodes embedded inside. The water content of the sensor changes depending on the SWC of the surrounding soil, which causes a change in the electrical conductivity between the electrodes whereby the resistance increases as the SWC decreases. The newer version of the Watermark sensor compared to the earlier versions of gypsum blocks is not prone to deterioration due to the synthetic membrane and is not sensitive to soil salinity due to the inner cylindrical tablet. The tensiometer works on the same principle as the Watermark SMS. It is very easy to use and affordable, but with poor efficiency in dry conditions [39], and the need for maintenance is often highlighted as a limitation. We came to the same realizations ourselves in our previous research [31]; however, we still decided to use the tensiometer in this research because it was applied in irrigated conditions where the high SWC was maintained. The working principle of the PR2 profile probe is frequency domain reflectometry (FDR) designed to monitor the SWC in %vol. [40]. The PR2 probe measures the SWC at various depths, depending on the probe length. The SM150 SMS consists of a sealed plastic body with two sensing rods with an output signal (differential analogue DC voltage) converted to SWC (vol.%) by a data logger (Delta-T Devices, Cambridge, UK). The measuring range is to 70% vol. with readout of ±3% accuracy. TDR300 is an SMS that measures the SWC in vol.% with high accuracy, does not require prior preparation, is easy to use, can be moved in the field, and does not lead to significant soil disturbance. In this study, the sensor was set to high clay mode, considering that the clay content in the soil is 32.5%, and according to the manufacturer’s recommendation, the high clay mode will be more accurate for soils with higher clay contents (>27%). The use of this sensor in saline soils is less reliable, which was not an issue in our study, but it is important to point out that the sensor gives different results in soils with an increased clay content, which was present in our case.

2.2. Field Calibration

The SWC was monitored each day during the study period. After rain or irrigation, the SWC was measured at intervals every half hour to monitor the reaction speed of an individual SMS to changes in the SWC at each installation depth. In the results, the daily measurements are presented as an average for each tested SMS and installation depth. Soil samples for field calibration were taken for each observed soil depth after the values on the readers were unchanged within a few hours after the irrigation or rainfall events. Each time after measuring the SWC with a handheld meter or data logger, a soil sample was taken with a soil auger from the soil depth where the sensor was installed, and the standard gravimetric procedure was followed. A soil auger with a 3 cm width was used to collect the 76 soil samples from each soil depth (20, 30, and 40 cm) in three replicates. In total, during the study period, 684 soil samples were collected. The soil samples were placed in paper bags, labeled, and then weighed in the laboratory on a precision digital scale to determine the mass of moist soil (Mms, gr). The performance and accuracy of the SMS was evaluated using the root mean square error (RMSE) equation (Equation (4)) as follows:
R M S E = ( n 1 i = 1 n ( S i O i ) 2 )
where RMSE is the root mean square error, Si is the estimated value, while Oi is the observed value. The RMSE analysis was performed for the evaluation of calibration equations as the difference between SMS readings and gravimetric moisture (θ). Mean absolute error (MAE) was calculated to quantify the deviation of the estimated θv means from the observed θv (Equation (5)):
M A E = 1 N i = 1 N ( S i O i )
where n is the number of observations, and Si and Oi are estimated and observed values. To describe the average difference between the sensor readings and corresponding VWC measurements, the mean difference (MD) was used (Equation (6)) as follows:
M D = i = 1 n ( M s i M g i ) n
where Msi is the sensor reading, Mgi is the θv measurement, and n is the number of samples. The ANOVA, correlation and regression analyses were performed (p < 0.05 and p < 0.01) using STATISTICA 13 (StatSoft, 243 Inc., Tulsa, OK, USA) to compare the SMS readings with the SWC obtained by the gravimetric method.

3. Results

3.1. Climatic Conditions and Soil Water Content

The year 2022 was characterized by a dry spring and an extremely warm and dry summer. During the study period (May–August), the amount of rainfall was lower by 84.7 mm, while the air temperatures were 3.1 degrees higher compared to the mentioned period during the long-term average (LTA, 19611990, Table 3).
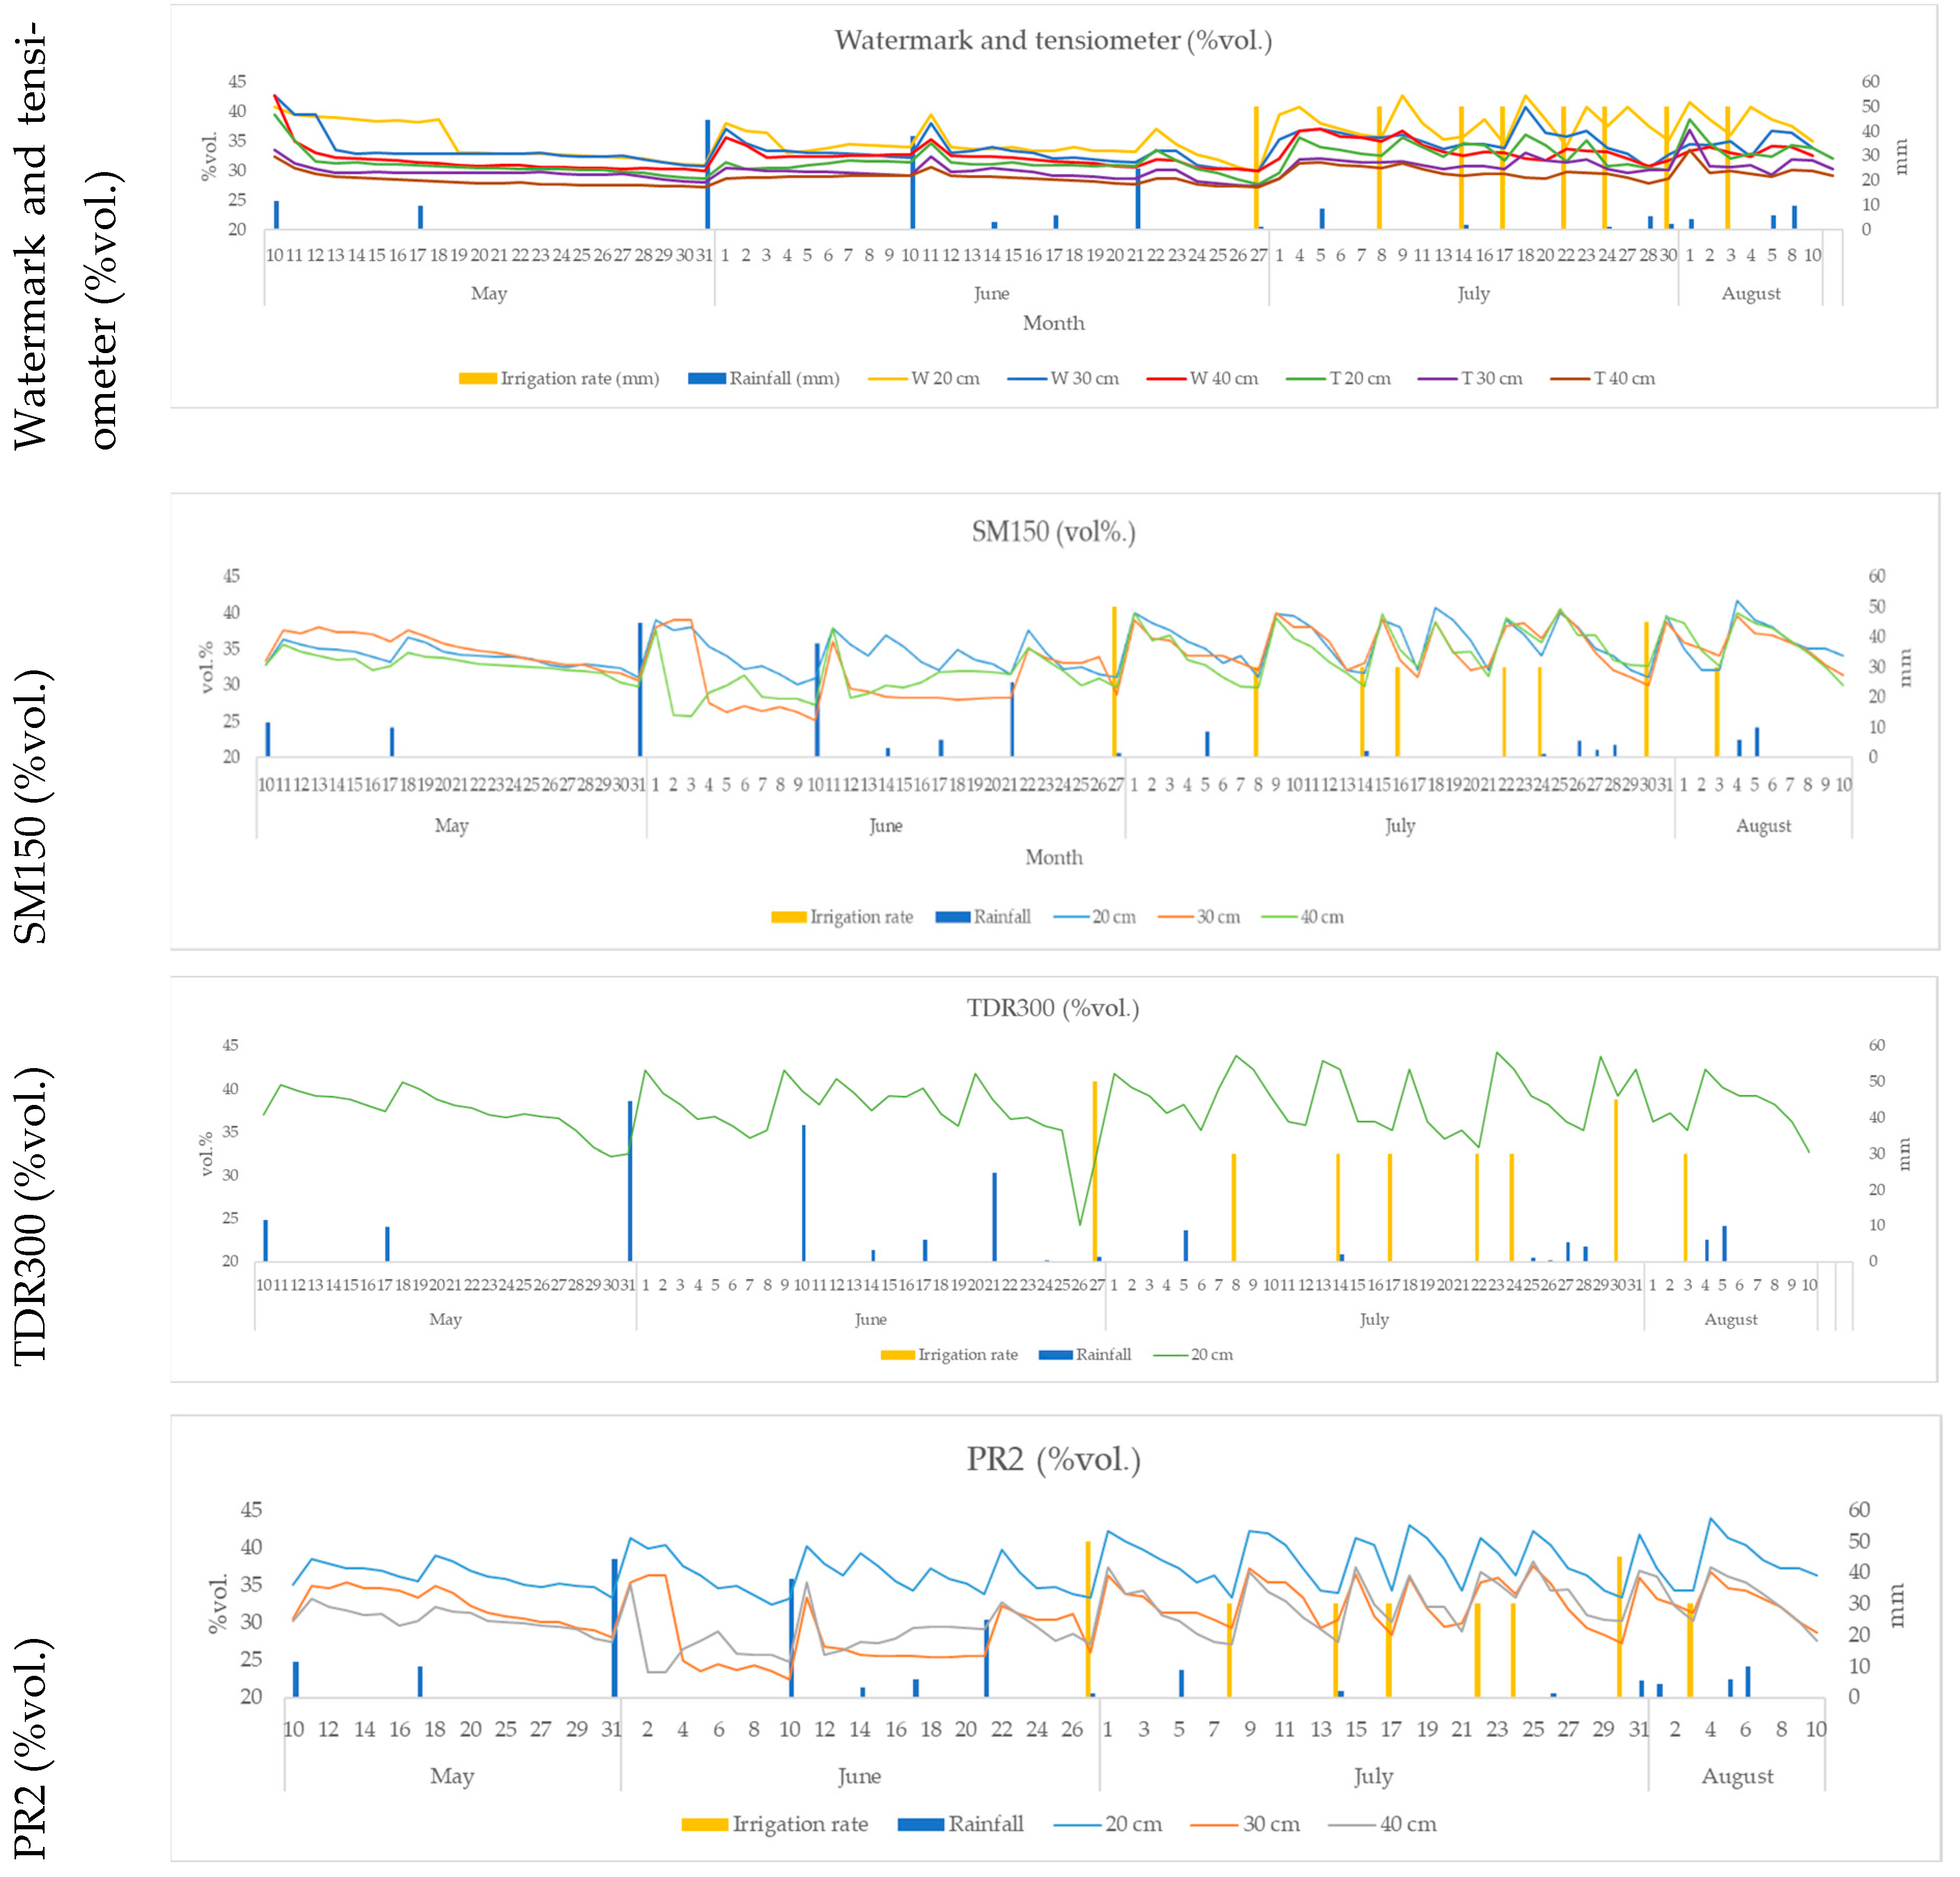
As a result of above-average high air temperatures (+3.1 °C), increased insolation (+1.9 h), and a decrease in air humidity (−11.7%), the average increase in reference (ETo) and crop evapotranspiration (ETc) compared to the LTA was 20.3 mm and 12.3 mm, respectively. During the study period, the negative consequences of climate change in the form of increased CWR were more pronounced due to the below-average amount of rainfall, which conditioned the need to compensate for the lack of water with irrigation. The irrigation rate during the study period was 35 mm for all tested SMSs, with the exception on 27 June and 30 July, when 50 mm and 45 mm of irrigation water was applied. Irrigation doses were increased in the mentioned irrigation events because the SWC at the deepest observed soil depth (40 cm) fell below the MAD (50%). The irrigation requirement according to CROPWAT model was 114 mm, yet the net irrigation rate based on monitoring SWC with SMS was 275 mm. The variation in the SWC (%vol.) monitored by different SMSs and installation depths, rainfall (mm), and irrigation events (mm) are shown in Figure 5.
The average SWC (%vol.) ranged as follows: from 35.76 (20 cm) to 32.51 (40 cm) measured with the Watermark SMS, from 31.80 (20 cm) to 28.96 (40 cm) measured with the tensiometer, from 35.92 (20 cm) to 33.24 measured with SM150, 37.93 (20 cm) measured with TDR300, and from 38.18 (20 cm) to 30.79 (40 cm) measured with the PR2 probe. As for the SWC measured with the gravimetric method, the SWC ranged from 36.23 to 33.36. The factorial ANOVA showed a significant variation in the SWC across soil depths and tested SMSs (Table 4).

3.2. Soil Moisture Sensors’ Performance in an Irrigated Orchard

Linear regression equations were developed to estimate the SWC based on sensor readings. The SMS readings were validated by comparing the SWC (%vol.) readings to those determined gravimetrically (Table 5). Strong correlations (r) were found for SM150 and PR2 (20, 30 and 40 cm), while the weakest correlations were observed for the tensiometer (20, 30, and 40 cm) and TDR300 (20 cm).
Pearson’s correlation coefficient (r) showed the strongest correlation (r = 0.98; p < 0.05) between SM150 and PR2 at a 20 cm soil depth (Table 6). In general, the strongest correlation was found among SM150 and PR2 at all observed soil depths, r = 0.98 (20 cm), r = 0.84 (30 cm), and r = 0.87 (40 cm), and among Watermark and tensiometer, r = 0.74 (20 cm), r = 0.72 (30 cm), and r = 0.85 (40 cm). In average, across SMSs and soil depths, the weakest correlation was found among the tensiometer and TDR300 compared to the SM150 and PR2 SMSs.
The results of the RMSE, MSE and MD indices for the tested SMSs and observed soil layers are presented in Table 7. The RMSE was lowest for PR2 at all observed soil depths, followed by SM150. The MSE and MD revealed similar patterns in SMS performance; MSE—tensiometer > TDR300 > Watermark > PR2 > SM150, and MD—TDR300 > tensiometer > Watermark > SM150 > PR2.

3.3. Soil Moisture Sensor Performance in the Rainfed Treatment

The average SWC (%vol.) in rainfed treatment ranged as follows: 28.23 (20 cm), 27.13 (30 cm), and 29.14 (40 cm) measured with Watermark; 28.47 (20 cm), 28.56 (30 cm), and 26.55 (40 cm) measured with the tensiometer; 25.23 (20 cm) measured with TDR300; 25.22 (20 cm), 23.36 (30 cm), and 21.22 (40 cm) measured with SM150; and 26.58 (20 cm), 24.55 (30 cm), and 23.59 (40 cm) measured with the PR2 probe. As for gravimetric method, the SWC (%vol.) at the observed soil depths was 26.73 (20 cm), 24.56 (30 cm), and 23.27 (40 cm).
Linear regression equations for the SWC evaluation in the rainfed treatment are presented in Table 8. The SMS readings were validated by comparing the SWC (%vol.) readings to those determined by the gravimetric method. Strong correlations (r) were found for Watermark (20 cm = 0.93, 30 cm = 0.90, and 40 cm = 0.89), TDR300 (20 cm = 0.82), SM150 (20 cm = 0.96, 30 cm = 0.95, and 40 cm = 0.92), and PR2 (20 cm = 0.98, 30 cm = 0.97, and 40 cm = 0.93), while the weakest correlations were observed for the tensiometer (20 cm = 0.49, 30 cm = 0.46, and 40 cm = 0.44).
In the rainfed treatment, the strongest correlation (r = 0.94; p < 0.05) was found between SM150 and PR2 at 20 and 30 cm soil depths (Table 9). The strongest correlations were found between SM150 and PR2 at all observed soil depths, r = 0.94 (20 cm), r = 0.82 (30 cm), r = 0.91 (40 cm). Furthermore, strong positive correlations were found among TDR300 and SM150, r = 0.82 (20 cm), r = 0.88 (30 cm), and r = 0.85 (40 cm), among TDR300 and PR2, r = 0.92 (20 cm), r = 0.91 (30 cm), and r = 0.90 (40 cm), and among Watermark and the tensiometer, r = 0.74 (20 cm), r = 0.72 (30 cm), and r = 0.65 (40 cm). In general, the weakest correlation was found among tensiometer, SM150, and PR2.
The results of the RMSE, MSE and MD indices for the tested SMSs and observed soil layers in the rainfed treatment are presented in Table 10. The RMSE was lowest for SM150 and PR2 at all observed soil depths. In the rainfed treatment, the MSE and MD values from highest to lowest were as follows: tensiometer > Watermark > TDR300 > SM150 > PR2.

4. Discussion

The tested SMSs were evaluated based on the reaction time to the SWC change caused by irrigation or rainfall events. Furthermore, they were tested based on the field calibration procedure used to relate the SWC measured with SMSs to the one obtained by the gravimetric method (GM), i.e., accuracy. By comparing the CROPWAT model and the SWC measurement results from different SMSs, a difference in CWR was observed, whereby the CROPWAT model underestimated the CWR for 161 mm (Table 3). Even though the CROPWAT model is a useful tool in irrigation scheduling of different crops, we have verified that using SMSs, the in situ measurement gives more accurate insights into CWR. The range of SWCs between subsequent irrigation events was SMS- and soil layer-dependent. The drip irrigation system showed high efficiency in the irrigation of apple orchards, with slow, lower, and more frequent application rates maintaining the SWC between the FC and MAD, meaning that readily available water was dominant in the soil. The study results showed that irrigation scheduling, i.e., the irrigation rate, was sufficient to wet the observed soil layer (40 cm), since all sensors in this study responded to changes in the SWC (Figure 4). A similar pattern of results was obtained by Svoboda et al. [41]. The authors suggest that irrigation to a maximum soil depth of at least 40–60 cm ensures that the water is available for and depleted by the apple roots. As expected, in this study, the highest SWC was in the upper soil layer (20 cm), while the maximum water uptake occurred in the 30–40 cm soil layer (Figure 4, Table 4). The findings are directly in line with previous findings of Aguzzoni et al. [42]. The authors claim that most of the irrigation water in the apple orchard was present in the 0–0.2 m soil layer, but the irrigation water also infiltrated up to a 0.6 m depth. Additionally, Penna et al. [43] have shown that apple trees rely mostly on the soil water present in the upper 20–40 cm. As for rainfall events in this study, the response of the SMSs depended on the amount of rainfall and the installation depth. For example, at the beginning of the study period (10 May = 11.5 mm, 17 May = 9.8 mm), a change in the SWC was recorded by the SM150 and PR2 SMSs at all observed soil depths, while no change in the SWC was recorded by the remaining SMSs in this study. Moreover, the differences in the SWC at the observed soil depths among SMSs were visible. At the beginning of the study period, till end of the June, the SM150 and PR2 SMSs showed variations in the SWC depending on the installation depth. This is opposite to Watermark and the tensiometer, for which the readings are quite uniform in the mentioned period at all observed soil depths (Figure 4). This is supported by the data from Table 4. It is visible that the SWC values are almost equal at depths of 30 and 40 cm. The above result indicated a slower reaction of the mentioned sensors at depths of 30 and 40 cm, even though the irrigation rate was sufficient to wet the observed soil layer. Furthermore, this means that the sensors underestimated the SWC, which led to overirrigation and unnecessary water consumption. This is also supported by the moderate correlation (r) for the Watermark (20 cm = 0.63, 30 cm = 0.60, and 40 cm = 0.59) and tensiometer (20 cm = 0.29, 30 cm = 0.26, and 40 cm = 0.24) compared to the remaining SMSs used in this study (Table 5). On average, the response time of the Watermark and tensiometer to an irrigation or rainfall event was 2–3 h, while for TDR, SM150, and PR2, the response time was below 5 min (the stated response times refer to a 20 cm installation depth). Additionally, Domínguez-Niño et al. [26] noted that sensors closer to the dripper in position and depth respond quickly. Watermark and tensiometer tended to show synchronized patterns in terms of their responses to irrigation cycles (Figure 4). Their better performance (for a <30 cm soil layer, R2 = 0.91, for a 31–60 cm soil layer, R2 = 0.98) under laboratory conditions suggests the importance of the complex relationship between the soil–plant–irrigation system in the open field. The implications of these findings are also discussed by Domínguez-Niño et al. [26]. The authors stated that variability in readings from SMSs installed in the field lies in the positioning of SMSs in relation to the dripper, i.e., the wet bulbs. As for TDR300 (Table 4), the average SWC was higher than that obtained by the GM (TDR300 = 38.93%vol., GM = 36.23%vol.). According to the results obtained, TDR300 overestimated SWC, which in practice means that water stress can occur due to a lack of water, i.e., a yield reduction and impaired quality, which was confirmed by the weak correlation between TDR300 and SWC obtained with GM (r = 0.32, Table 5). This result ties well with a study by Gong et al. [44], where the authors state that high clay contents cause an overestimation of the SWC measured with TDR in the high moisture range. Furthermore, Tanriverdi et al. [45] state that an increase in the percentage of clay and organic substances in the soil also contributes to the errors in the measurements performed by the TDR equipment. When comparing our results to those of Jama-Rodzeńska et al. [46], it must be pointed out that the study results do not match. The authors measured the SWC in irrigated potatoes in growing pots and stated that TDR300 gave lower SWC values compared to SM150. In our study, TDR300 showed higher SWC values (Table 4, 3% vol.). Overall, in this study, the best SMS performance was noted for SM150 and PR2. As mentioned earlier, both sensors captured rainfall and irrigation events (Figure 4). Minimum deviations were observed in the SWC measured by the mentioned sensors and GM (±1%, Table 4), which was also confirmed with strong correlations (Table 5) for the observed soil depths; SM150—r = 0.95 (20 cm), r = 0.96 (30 cm), and r = 0.72 (40 cm), and PR2—r = 0.96 (20 cm), r = 0.97 (30 cm), and r = 0.91 (40 cm). Regardless of the strong correlation between SM150 and GM measurements, it should be noted that the SM150 SMS underestimated the SWC at all observed soil depths (Table 4), where the most pronounced deviation was at the deepest observed soil depth. In their research results, Zhu et al. [47] stated a better performance of TDR300 compared to SM150, although it should be emphasized that the authors used the high clay mode for TDR300, yet the soil at their study site contained 17% clay. The good performance of PR2 was confirmed by Dhakal et al. [48]. The authors conclude that the PR2 profile probe could be a reliable alternative to more expensive and difficult techniques. The performance evaluation (RMSE) also showed the best performance of PR2 (Table 7) at all observed soil depths. The strongest correlations were found among Watermark and tensiometer, and among SM150 and PR2 (Table 6). Generally, sensors with the strongest correlations can be classified into two categories, as the tensiometer and Watermark measure the soil water tension (kPa), while SM150 and PR2 measure the volumetric SWC (%vol.). The performance of PR2 was also tested by Qi and Helmers [40], Dhakal et al. [48], and Kaman and Özbek [49]. Generally, they concluded that PR2 could be used for the precise measurement of the soil VWC after a calibration for the specific soil type is performed. The results of this study confirm our [31] previous findings where the Watermark and tensiometer overestimated the SWC, while TDR underestimated the SWC. The above refers to the rainfed treatment, while in the irrigated treatment, in this study, the results were opposite, i.e., the Watermark and tensiometer underestimated the SWC, while TDR300 overestimated the SWC. Accordingly, the Watermark and tensiometer tend to overestimate and TDR300 underestimate measured values at a low SWC level, and this should be considered when determining the irrigation time, i.e., irrigation scheduling. Overall, these findings are in accordance with findings reported by Ganjegunte et al. [50]. The authors have also stated that the Watermark and tensiometer have a tendency to underestimate the SWC in irrigated conditions. The higher accuracy of Watermark, tensiometer, and TDR300 in the rainfed treatment (Table 8 and Table 10) indicates a better reaction of the SMSs in conditions in which the dry and wet phases of the soil alternate, i.e., a slower reaction under conditions of a high SWC. The above may be related to a higher clay content, as is the case in this field study (Table 1), where there is a slower release of water, especially in irrigated conditions. Unlike the previously mentioned three sensors, SM150 and PR2 showed high accuracy in the irrigated treatment, as well as under rainfed conditions.
Considering the results of previously presented research, as well as our research, it is important to point out that regardless of the operation principle, each SMS has advantages and disadvantages that should be considered when choosing an SMS for specific agroecological conditions, i.e., spatial scale, soil properties, measured parameter, installation depth and positioning, temperature, salinity, response time, and cost, which have been the subjects of various studies. The SMSs used for irrigation scheduling are mostly confined at a spatial scale with single-point measurements, such as Watermark, tensiometers, TDR, and SM150 used in this study. The PR2 measures the SWC across the vertical soil profile with multiple single-point sensors embedded in a probe or rod. The advantage of this type of sensor design is that it provides an insight into the penetration of water through the root zone and reduces soil disturbance due to the need for the excavation of a larger number of installation holes at different soil depths. Ultimately, the application of PR2 reduces the cost by measuring the SWC at different soil depths with one SMS. Watermark is a relatively affordable single-point SMS and easy to install at any soil depth. It is temperature [51,52] and soil type [52] dependent, with a minimal effect of soil water salinity [53]. For the Watermark SMS, Berrada et al. [54] have reported erratic measurements during prolonged drying cycles exceeding 90 kPa. Perhaps the most important for end users is to highlight the need to calibrate the Watermark SMS, i.e., to convert the soil water potential (cbar) into the volumetric water content for each soil type [18]. The tensiometer is a cost-effective SMS that provides continuous measurements of the SWC (cbar) without soil disturbance. Compared to solid-state sensors such as the Watermark or TDR, tensiometers tend to require more maintenance [55], which, beside the unsuitable SWC measurement in dry soils [56], is often pointed out as the biggest drawback. The TDR is a highly accurate method for measuring the SWC [57], yet is affected by salinity, temperature, and metallic soil components such as ironstone [58]. High conductivity in clay soils results in an overestimation of SWC that was found for the TDR due to the bound water [59]. The SM150 is a capacitance sensor that can be used as a portable sensor or buried in the soil. It is essentially insensitive to soil temperature in silt loam soil, and is marginally sensitive in loamy sand [47]. Kukal et al. [60] reported high accuracy of SM150, where better performance was noted in silt loam with a vertical orientation and a horizontal orientation in loamy sand. The PR2 is multi-sensor frequency domain reflectometry probe that performs repeated measurements of the SWC (%vol.) at one location. Limited study results are available for PR2. Dhakal et al. [48] noted that multi-sensor capacitance probes have identified the importance of calibrating by the soil depth and concluded that the PR2 could be a reliable alternative to more expensive and difficult techniques such as the neutron probe method for the precise measurement of the soil VWC. Additionally, Qi and Helmers [40] state that a site-specific calibration is necessary for the PR2 probe, and equations calibrated by data from a longer period performed better than data from a shorter period. Humidity inside the access tube, non-uniform contact between access tube wall and soil, irregular orientation of the probe in the tube, and poor field installation can vitiate permittivity readings [61].
Furthermore, the accuracy of the SMS depends on the site characteristics, e.g., the soil moisture regime, soil type and homogeneity, and presence of stones and roots [62]. The SMSs also differ in response times to wetting and drying cycles under different agroecological conditions. The SMS response time at different installation depths is conditioned by the soil type and previous agrotechnical operations, i.e., tillage pan. Different soil types will have different water movements (hydraulic conductivity), depending on the soil texture and structure. For example, sandy soils with large pores tend to conduct water more easily than clay soils, i.e., soils with smaller pores. Additionally, a different soil type will condition a good contact of the SMS with the soil, which is very important when installing the SMS, since the accuracy will depend on it. When placing the SMS at different depths in the cultivated soil, the response time will depend on soil compaction, i.e., bulk density and soil porosity. Placing the SMS near the tillage pan can cause low accuracy due to the severe soil compaction, which limits water movement. Moreover, the speed of infiltration depends on the compaction of the soil, which is of particular importance during irrigation or rainfall events, as it will determine the water movement through soil. All of the above will determine the SMS performance and accuracy. As for the SMSs used in this study, Watermark is significantly affected by the soil texture [63] and has a slow response time when considering events of rapid drying or partial rewetting of the soil [39,64]. Vettorello and Marinho [65] noted that during the wetting procedure, Watermark presented a delay of about 2 h in detecting water, while tensiometer detection was almost instantaneous. Watermark and tensiometer performance accuracy in Perea et al. [66] were poorer at 15 cm as compared to a 30 cm depth, which was mostly attributed to more intense soil wetting and drying cycles near the soil surface. The authors also noted poor accuracy in the heavier textured clay soils due to high shrinking and swelling properties. The time delay in the response of the TDR probes to precipitation, evaporation, transpiration, or drainage was previously reported by Hagenau et al. [67]. SM150 showed greater accuracy in the loamy sand than in the silt loam, i.e., the soil type significantly affected the sensor performance in accurately estimating soil moisture, while the sensor installation orientation did not play a role in sensor performance [68]. As for PR2, Dhakal et al. [48] claims that studies on the accuracy of multi-sensor capacitance probes have identified the importance of calibrating by soil depth, and that the site-specific calibration will improve the accuracy of the sensor.
Future research should prioritize investigating soil moisture dynamics concerning bulb wetting patterns, sensor placement relative to plant roots, and soil temperature in irrigated orchards.

5. Conclusions

The performance of four commercially available soil moisture sensors and one soil moisture probe was evaluated in an irrigated apple orchard. The sensors included Watermark, tensiometer, TDR300, and SM150, and the PR2 soil moisture probe. The sensor performance was determined by comparing its readings with gravimetric measurements of the soil water content obtained during the study period. In general, all sensors responded to wetting and drying, whereby the performance ranking from high to low was PR2, SM150 (horizontal installation), Watermark, tensiometer, and TDR300 (high clay mode). In addition, although SM150 showed a high level of accuracy compared to the remaining sensors, it is important to point out that the soil water content was underestimated at all observed soil depths. Although the results of this study highlight that the soil moisture probe (PR2) showed better performance in an irrigated orchard compared to single point-based soil moisture sensors, additional field studies need to be conducted within variable agroecological conditions to evaluate the performance and to provide guidelines on soil moisture measuring techniques in irrigated orchards. Future research should be focused on the application of soil moisture tests in relation to bulb wetting patterns, placement in relation to the plant, i.e., the roots, and the influence of EC and soil temperature in an irrigated orchard.

Author Contributions

Conceptualization, M.M. and A.A.; methodology, M.M. and D.J.; formal analysis, Ž.B. and A.T.; data curation, M.R. and A.A.; writing—original draft preparation, M.M., M.R. and M.M.K.; writing—review and editing, M.M., M.M.K. and M.R.; visualization—Ž.B. and A.T.; supervision, A.A. and D.J. All authors have read and agreed to the published version of the manuscript.

Funding

This research received no external funding.

Institutional Review Board Statement

Not applicable.

Data Availability Statement

The original contributions presented in the study are included in the article, further inquiries can be directed to the corresponding author.

Acknowledgments

The study was fully supported by Croatian Science Foundation under the project “Assessment of conservation soil tillage as advanced methods for crop production and prevention of soil degradation–ACTIVEsoil” (IP-2020-02-2647).

Conflicts of Interest

The authors declare no conflicts of interest.

References

  1. Alvino, A.; Marino, S. Remote sensing for irrigation of horticultural crops. Horticulturae 2017, 3, 40. [Google Scholar] [CrossRef]
  2. Fernández García, I.; Lecina, S.; Ruiz-Sánchez, M.C.; Vera, J.; Conejero, W.; Conesa, M.R.; Domínguez, A.; Pardo, J.J.; Léllis, B.C.; Montesinos, P. Trends and challenges in irrigation scheduling in the semi-arid area of spain. Water 2020, 12, 785. [Google Scholar] [CrossRef]
  3. Simić, D.; Pejić, B.; Bekavac, G.; Mačkić, K.; Vojnov, B.; Bajić, I.; Sikora, V. Effect of different ET-based irrigation scheduling on grain yield and water use efficiency of drip irrigated maize. Agriculture 2023, 13, 1994. [Google Scholar] [CrossRef]
  4. Wang, B.; van Dam, J.; Yng, X.; Ritsema, C.; Du, T.; Kang, S. Reducing water productivity gap by optimizing irrigation regime for winter wheat-summer maize system in the North China Plain. Agric. Water Manag. 2023, 280, 108229. [Google Scholar] [CrossRef]
  5. Hussain, S.; Mubeen, M.; Nasim, W.; Fahad, S.; Ali, M.; Ehsan, M.A.; Raza, A. Investigation of irrigation water requirement and evapotranspiration for water resource management in Southern Punjab, Pakistan. Sustainability 2023, 15, 1768. [Google Scholar] [CrossRef]
  6. Zulfiqar, U.; Ahmad, M.; Valipour, M.; Ishfaq, M.; Maqsood, M.F.; Iqbal, R.; Ali, M.F.; Roy, R.; El Sabagh, A. Evaluating optimum limited irrigation and integrated nutrient management strategies for wheat growth, yield and quality. Hydrology 2023, 10, 56. [Google Scholar] [CrossRef]
  7. Zapata-García, S.; Temnani, A.; Berríos, P.; Espinosa, P.J.; Monllor, C.; Pérez-Pastor, A. Using soil water status sensors to optimize water and nutrient use in melon under semi-arid conditions. Agronomy 2023, 13, 2652. [Google Scholar] [CrossRef]
  8. Shrestha, B.; Stringam, B.L.; Darapuneni, M.K.; Lombard, K.A.; Sanogo, S.; Higgins, C.; Djaman, K. Effect of irrigation and nitrogen management on potato growth, yield, and water and nitrogen use efficiencies. Agronomy 2024, 14, 560. [Google Scholar] [CrossRef]
  9. Gu, Z.; Qi, Z.; Burghate, R.; Yuan, S.; Jiao, X.; Xu, J. Irrigation scheduling approaches and applications: A Review. J. Irrig. Drain. 2020, 6, 146. [Google Scholar] [CrossRef]
  10. Yu, L.M.; Gao, W.L.; Shamshiri, R.R.; Tao, S.; Ren, Y.Z.; Zhang, Y.J.; Su, G. Review of research progress on soil moisture sensor technology. Int. J. Agric. Biol. Eng. 2021, 14, 32–42. [Google Scholar] [CrossRef]
  11. Oluwasegun Olamide, F.; Abidemi Olalekan, B.; Uthman, T.S.; Abdulwakiil Adeyemi, M.; Oladipupo Julius, J.; Kehinde Oluwaseyi, F. Fundamentals of irrigation methods and their impact on crop production. In Irrigation and Drainage-Recent Advances; Sultan, M., Ahmad, F., Eds.; IntechOpen: London, UK, 2023. [Google Scholar] [CrossRef]
  12. Zhao, H.; Di, L.; Guo, L.; Zhang, C.; Lin, L. An automated data-driven irrigation scheduling approach using model simulated soil moisture and evapotranspiration. Sustainability 2023, 15, 12908. [Google Scholar] [CrossRef]
  13. Yu, L.Y.; Zhao, X.N.; Gao, X.D.; Siddique, K.H.M. Improving/maintaining water-use efficiency and yield of wheat by deficit irrigation: A global meta-analysis. Agric. Water Manag. 2020, 228, 105906. [Google Scholar] [CrossRef]
  14. Li, M.N.; Zhang, Y.L.; Ma, C.Z.; Sun, H.R.; Ren, W.; Wang, X.G. Maximizing the water productivity and economic returns of alfalfa by deficit irrigation in China: A meta-analysis. Agric. Water Manag. 2023, 287, 108454. [Google Scholar] [CrossRef]
  15. Hrvatske Vode. Novelacija nacionalnog projekta navodnjavanja i gospodarenja poljoprivrednim zemljištem i vodama (NAPNAV). 2021. Available online: https://voda.hr/sites/default/files/dokumenti/PUVP3%20-%20OUE%20-%200016.pdf (accessed on 27 May 2024).
  16. Holjevac, M.C.; Pavlović, D.; Pandzic, K. Drought conditions and management strategies in Croatia. In Proceedings of the 1st Regional Workshop on Capacity Development to Support National Drought Management Policies for Eastern European Countries, Bucharest, Romania, 9–11 July 2013; Volume 201, pp. 46–50. [Google Scholar]
  17. Quinones, H.; Ruelle, P.; Nemeth, I. Comparison of three calibration procedures for TDR soil moisture sensors. Irrig. Drain. 2003, 52, 203–217. [Google Scholar] [CrossRef]
  18. Leib, B.G.; Jabro, J.D.; Matthews, G.R. Field evaluation and performance comparison of soil moisture sensors. Soil Sci. 2003, 168, 396–408. [Google Scholar] [CrossRef]
  19. Cardenas-Lailhacar, D.; Dukes, M.D. Precision of soil moisture sensor irrigation controllers under field conditions. Agric. Water Manag. 2010, 97, 666–672. [Google Scholar] [CrossRef]
  20. El Marazky, M.S.A.; Mohammad, F.S.; Al-Ghobari, H.M. Evaluation of soil moisture sensors under intelligent irrigation systems for economical crops in arid regions. Am. J. Agric. Biol. Sci. 2011, 6, 287–300. [Google Scholar] [CrossRef]
  21. SU, S.L.; Singh, D.N.; Baghini, M.S. A critical review of soil moisture measurement. Measurement 2014, 54, 92–105. [Google Scholar] [CrossRef]
  22. Sui, R. Irrigation scheduling using soil moisture sensors. J. Agric. Sci. 2018, 10, 1–11. [Google Scholar] [CrossRef]
  23. Datta, S.; Taghvaeian, S.; Ochsner, T.E.; Moriasi, D.; Gowda, P.; Steiner, J.L. Performance assessment of five different soil moisture sensors under irrigated field conditions in Oklahoma. Sensors 2018, 18, 3786. [Google Scholar] [CrossRef] [PubMed]
  24. Chen, Y.; Marek, G.W.; Marek, T.H.; Heflin, K.R.; Porter, D.O.; Moorhead, J.E.; Brauer, D.K. Soil water sensor performance and corrections with multiple installation orientations and depths under three agricultural irrigation treatments. Sensors 2019, 19, 2872. [Google Scholar] [CrossRef] [PubMed]
  25. Millán, S.; Casadesús, J.; Campillo, C.; Moñino, M.J.; Prieto, M.H. Using soil moisture sensors for automated irrigation scheduling in a plum crop. Water 2019, 11, 2061. [Google Scholar] [CrossRef]
  26. Domínguez-Niño, J.M.; Oliver-Manera, J.; Arbat, G.; Girona, J.; Casadesús, J. Analysis of the variability in soil moisture measurements by capacitance sensors in a drip-irrigated orchard. Sensors 2020, 20, 5100. [Google Scholar] [CrossRef] [PubMed]
  27. Jabro, J.D.; Stevens, W.B.; Iversen, W.M.; Allen, B.L.; Sainju, U.M. Irrigation scheduling based on wireless sensors output and soil-water characteristic curve in two soils. Sensors 2020, 20, 1336. [Google Scholar] [CrossRef] [PubMed]
  28. Amiri, Z.; Gheysari, M.; Mosaddeghi, M.R.; Amiri, S.; Tabatabaei, M.S. An attempt to find a suitable place for soil moisture sensor in a drip irrigation system. Inf. Process. Agric. 2022, 9, 254–265. [Google Scholar] [CrossRef]
  29. Orouskhani, E.; Sahoo, S.; Agyeman, B.; Bo, S.; Liu, J. Impact of sensor placement in soil water estimation: A real-case study. Irrig. Sci. 2023, 41, 395–411. [Google Scholar] [CrossRef]
  30. Singh, A.; Gaurav, K.; Sonkar, G.K.; Lee, C.C. Strategies to measure soil moisture using traditional methods, automated sensors, remote sensing, and machine learning techniques: Review, bibliometric analysis, applications, research findings, and future directions. IEEE Access 2023, 11, 13605–13635. [Google Scholar] [CrossRef]
  31. Marković, M.; Krizmanić, G.; Brkić, A.; Atilgan, A.; Japundžić-Palenkić, B.; Petrović, D.; Barač, Ž. Sustainable management of water resources in supplementary irrigation management. Appl. Sci. 2021, 11, 2451. [Google Scholar] [CrossRef]
  32. Sokol Jurković, R. Water balance components during recent floods in Croatia. Hrvat. Meteorol. Čas. 2016, 51, 61–70. Available online: https://hrcak.srce.hr/168221 (accessed on 1 June 2024).
  33. Marinović, I.; Cindrić Kalin, K.; Güttler, I.; Pasarić, Z. Dry spells in Croatia: Observed climate change and climate projections. Atmosphere 2021, 12, 652. [Google Scholar] [CrossRef]
  34. Brleković, T.; Tadić, L. Hydrological drought assessment in a small lowland catchment in Croatia. Hydrology 2022, 9, 79. [Google Scholar] [CrossRef]
  35. Özmen, S. Responses to irrigation onto apple tree grown under the farmer condition: A case study of Düzce Region. JOTAF 2016, 13, 37–47. [Google Scholar]
  36. Kojić, A.; Marković, M.; Marček, T.; Velić, N.; Lojková, L.; Atilgan, A.; Japundžić-Palenkić, B. The benefit of mycorrhizal fungi and beneficial soil bacteria in drought exposed lettuce (Lactuca sativa var. capitata) is genotype and environment dependent. Appl. Sci. 2023, 13, 12117. [Google Scholar] [CrossRef]
  37. FAO, Food and Agricultural Organization of United Nations. Standard Operating Procedure for Soil Moisture Content by Gravimetric Method; Food and Agriculture Organization of the United Nations: Rome, Italy, 2023. [Google Scholar]
  38. Walker, W.R. Guidelines for Designing and Evaluating Surface Irrigation Systems; Irrigation and Drainage Paper 45; FAO, Food and Agricultural Organization of United Nations: Rome, Italy, 1989. [Google Scholar]
  39. Muñoz-Carpena, R.; Li, Y.; Klassen, W.; Dukes, M. Field comparison of tensiometer and granular matrix sensor automatic drip irrigation on tomato. HortTechnology 2005, 15, 584–590. [Google Scholar] [CrossRef]
  40. Qi, Z.; Helmers, M.J. The conversion of permittivity as measured by a PR2 capacitance probe into soil moisture values for Des Moines lobe soils in Iowa. Soil Use Manag. 2010, 26, 82–92. [Google Scholar] [CrossRef]
  41. Svoboda, P.; Haberle, J.; Moulik, M.; Raimanová, I.; Kurešová, G.; Mészáros, M. The effect of drip irrigation on the length and distribution of apple tree roots. Horticulturae 2023, 9, 405. [Google Scholar] [CrossRef]
  42. Aguzzoni, A.; Engel, M.; Zanotelli, D.; Penna, D.; Comiti, F.; Tagliavini, M. Water uptake dynamics in apple trees assessed by an isotope labeling approach. Agric. Water Manag. 2022, 266, 107572. [Google Scholar] [CrossRef]
  43. Penna, D.; Zanotelli, D.; Scandellari, F.; Aguzzoni, A.; Engel, M.; Tagliavini, M.; Comiti, F. Water uptake of apple trees in the Alps: Where does irrigation water go? Ecohydrology 2021, 14, e2306. [Google Scholar] [CrossRef]
  44. Gong, Y.; Cao, Q.; Sun, Z. The effects of soil bulk density, clay content and temperature on soil water content measurement using time-domain reflectometry. Hydrol. Process. 2003, 17, 3601–3614. [Google Scholar] [CrossRef]
  45. Tanriverdi, C.; Degirmenci, H.; Gonen, E.; Boyaci, S. A comparison of the gravimetric and TDR methods in terms of determining the soil water content of the corn plant. Sci. Pap. Ser. A Agron. 2016, 59, 153–158. [Google Scholar]
  46. Jama-Rodzeńska, A.; Walczak, A.; Adamczewska-Sowińska, K.; Janik, G.; Kłosowicz, I.; Głąb, L.; Sowiński, J.; Chen, X.; Pęczkowski, G. Influence of variation in the volumetric moisture content of the substrate on irrigation efficiency in early potato varieties. PLoS ONE 2020, 15, e0231831. [Google Scholar] [CrossRef] [PubMed]
  47. Zhu, Y.; Irmak, S.; Jhala, A.J.; Vuran, M.C.; Diotto, A. Time-domain and frequency-domain reflectometry type soil moisture sensor performance and soil temperature effects in fine- and coarse-textured soils. Appl. Eng. Agric. 2019, 35, 117–134. [Google Scholar] [CrossRef]
  48. Dhakal, M.; West, C.P.; Deb, S.K.; Kharel, G.; Ritchie, G.L. Field calibration of PR2 capacitance probe in Pullman clay-loam soil of Southern High Plains. Agrosyst. Geosci. Environ. 2019, 2, 180043. [Google Scholar] [CrossRef]
  49. Kaman, H.; Özbek, Ö. Performance evaluation of PR2 in determination of soil water content. Yuz. Yıl Univ. J. Agric. Sci. 2021, 31, 543–550. [Google Scholar] [CrossRef]
  50. Ganjegunte, G.K.; Sheng, Z.; Clark, J.A. Evaluating the accuracy of soil water sensors for irrigation scheduling to conserve freshwater. Appl. Water Sci. 2012, 2, 119–125. [Google Scholar] [CrossRef]
  51. Spaans, J.M.; Baker, J.M. Calibration of Watermark soil moisture sensors for soil matric potential and temperature. Plant Soil 1992, 143, 213–217. [Google Scholar] [CrossRef]
  52. Raper, T.; Henry, C.G.; Espinoza, L.; Ismanov, M.; Oosterhuis, D. Response of two inexpensive commercially produced soil moisture sensors to changes in water content and soil texture. Agric. Sci. 2015, 6, 1148–1163. [Google Scholar] [CrossRef]
  53. Hignett, C.; Evett, S. Electrical resistance sensors for soil water tension estimates. In Field Estimation of Soil Water Content. A Practical Guide to Methods, Instrumentation and Sensor Technology; IAEA: Vienna, Austria, 2008; pp. 123–129. [Google Scholar]
  54. Berrada, A.; Hooten, T.M.; Cardon, G.E.; Broner, I. Assessment of irrigation water management and demonstration of irrigation scheduling tools in the full service area of the Dolores Project: 1996–2000. Part III: Calibration of the Watermark Soil Moisture Sensor and ETgage Atmometer. In Agricultural Experiment Station Technical Report; TR01-7; Colorado State University: Fort Collins, CO, USA, 2001. [Google Scholar]
  55. Patel, R.J.; Rank, H.D. Performance analysis of electrical resistance based granular matrix sensors for measuring soil water potential in clay loam soil. AGRES 2016, 5, 313–319. [Google Scholar]
  56. Lieth, H.; Oki, L.R. Irrigation in soilless production. In Soilless Culture: Theory and Practice, 2nd ed.; Raviv, M., Lieth, J.H., Bar-Tal, A., Eds.; Elsevier: Chennai, India, 2019; pp. 381–423. [Google Scholar]
  57. Jones, S.B.; Wraith, J.M.; Or, D. Time domain reflectometry measurement principles and applications. Hydrol. Process. 2002, 16, 141–153. [Google Scholar] [CrossRef]
  58. Hignett, C.; Evett, S. Direct and surrogate measures of soil water content. In Field Estimation of Soil Water Content. A Practical Guide to Methods, Instrumentation and Sensor Technology; IAEA: Vienna, Austria, 2008; pp. 1–22. [Google Scholar]
  59. Abdullah, N.H.H.; Kuan, N.W.; Ibrahim, A.; Ismail, B.N.; Majid, M.R.A.; Ramli, R.; Mansor, N.S. Determination of soil water content using time domain reflectometer (TDR) for clayey soil. AIP Conf. Proc. 2018, 2020, 020016. [Google Scholar]
  60. Kukal, M.S.; Irmak, S.; Sharma, K. Development and application of a performance and operational feasibility guide to facilitate adoption of soil moisture sensors. Sustainability 2020, 12, 321. [Google Scholar] [CrossRef]
  61. Morgan, K.T.; Parsons, L.R.; Wheaton, T.A.; Pitts, D.J.; Obreza, T.A. Field calibration of a capacitance water content probe in fine sand soils. Soil Sci. Soc. Am. J. 1999, 63, 987–989. [Google Scholar] [CrossRef]
  62. Mittelbach, H.; Lechner, I.; Seneviratne, I. Comparison of four soil moisture sensor types under field conditions in Switzerland. J. Hydrol. 2012, 430–431. [Google Scholar] [CrossRef]
  63. Payero, J.; Qiao, X.; Khalilian, A.; Mirzakhani-Nafchi, A.; Davis, R. Evaluating the effect of soil texture on the response of three types of sensors used to monitor soil water status. J. Water Resour. Prot. 2017, 9, 566–577. [Google Scholar] [CrossRef]
  64. Thompson, R.; Gallardo, M.; Agüera, T.; Valdez, L.; Fernandez, M. Evaluation of Watermark sensor for use with drip irrigated vegetable crops. Irrig. Sci. 2006, 24, 185–202. [Google Scholar] [CrossRef]
  65. Vettorello, D.L.; Marinho, A.M. Evaluation of time response of GMS for soil suction Measurement. MATEC Web Conf. 2021, 337, 01014. [Google Scholar] [CrossRef]
  66. Perea, H.; Enciso, J.; Jifon, J.; Nelson, S.; Fernandez, C. On-farm performance of tensiometer and granular matrix soil moisture sensors in irrigated light, medium, and heavy textured soils. Subtrop. Plant Sci. 2013, 65, 1–7. [Google Scholar]
  67. Hagenau, J.; Kaufmann, V.; Borg, H. Monitoring water content changes in a soil profile with TDR-probes at just three depths-How well does it work? Braz. J. Water Resour. 2019, 25, e8. [Google Scholar] [CrossRef]
  68. Sharma, K.; Irmak, S.; Kukal, M.S.; Vuran, M.C.; Jhala, A.; Qiao, X. Evaluation of soil moisture sensing technologies in silt loam and loamy sand soils: Assessment of performance, temperature sensitivity, and site- and sensor-specific calibration functions. Am. Soc. Agric. Biol. Eng. 2021, 64, 1123–1139. [Google Scholar] [CrossRef]
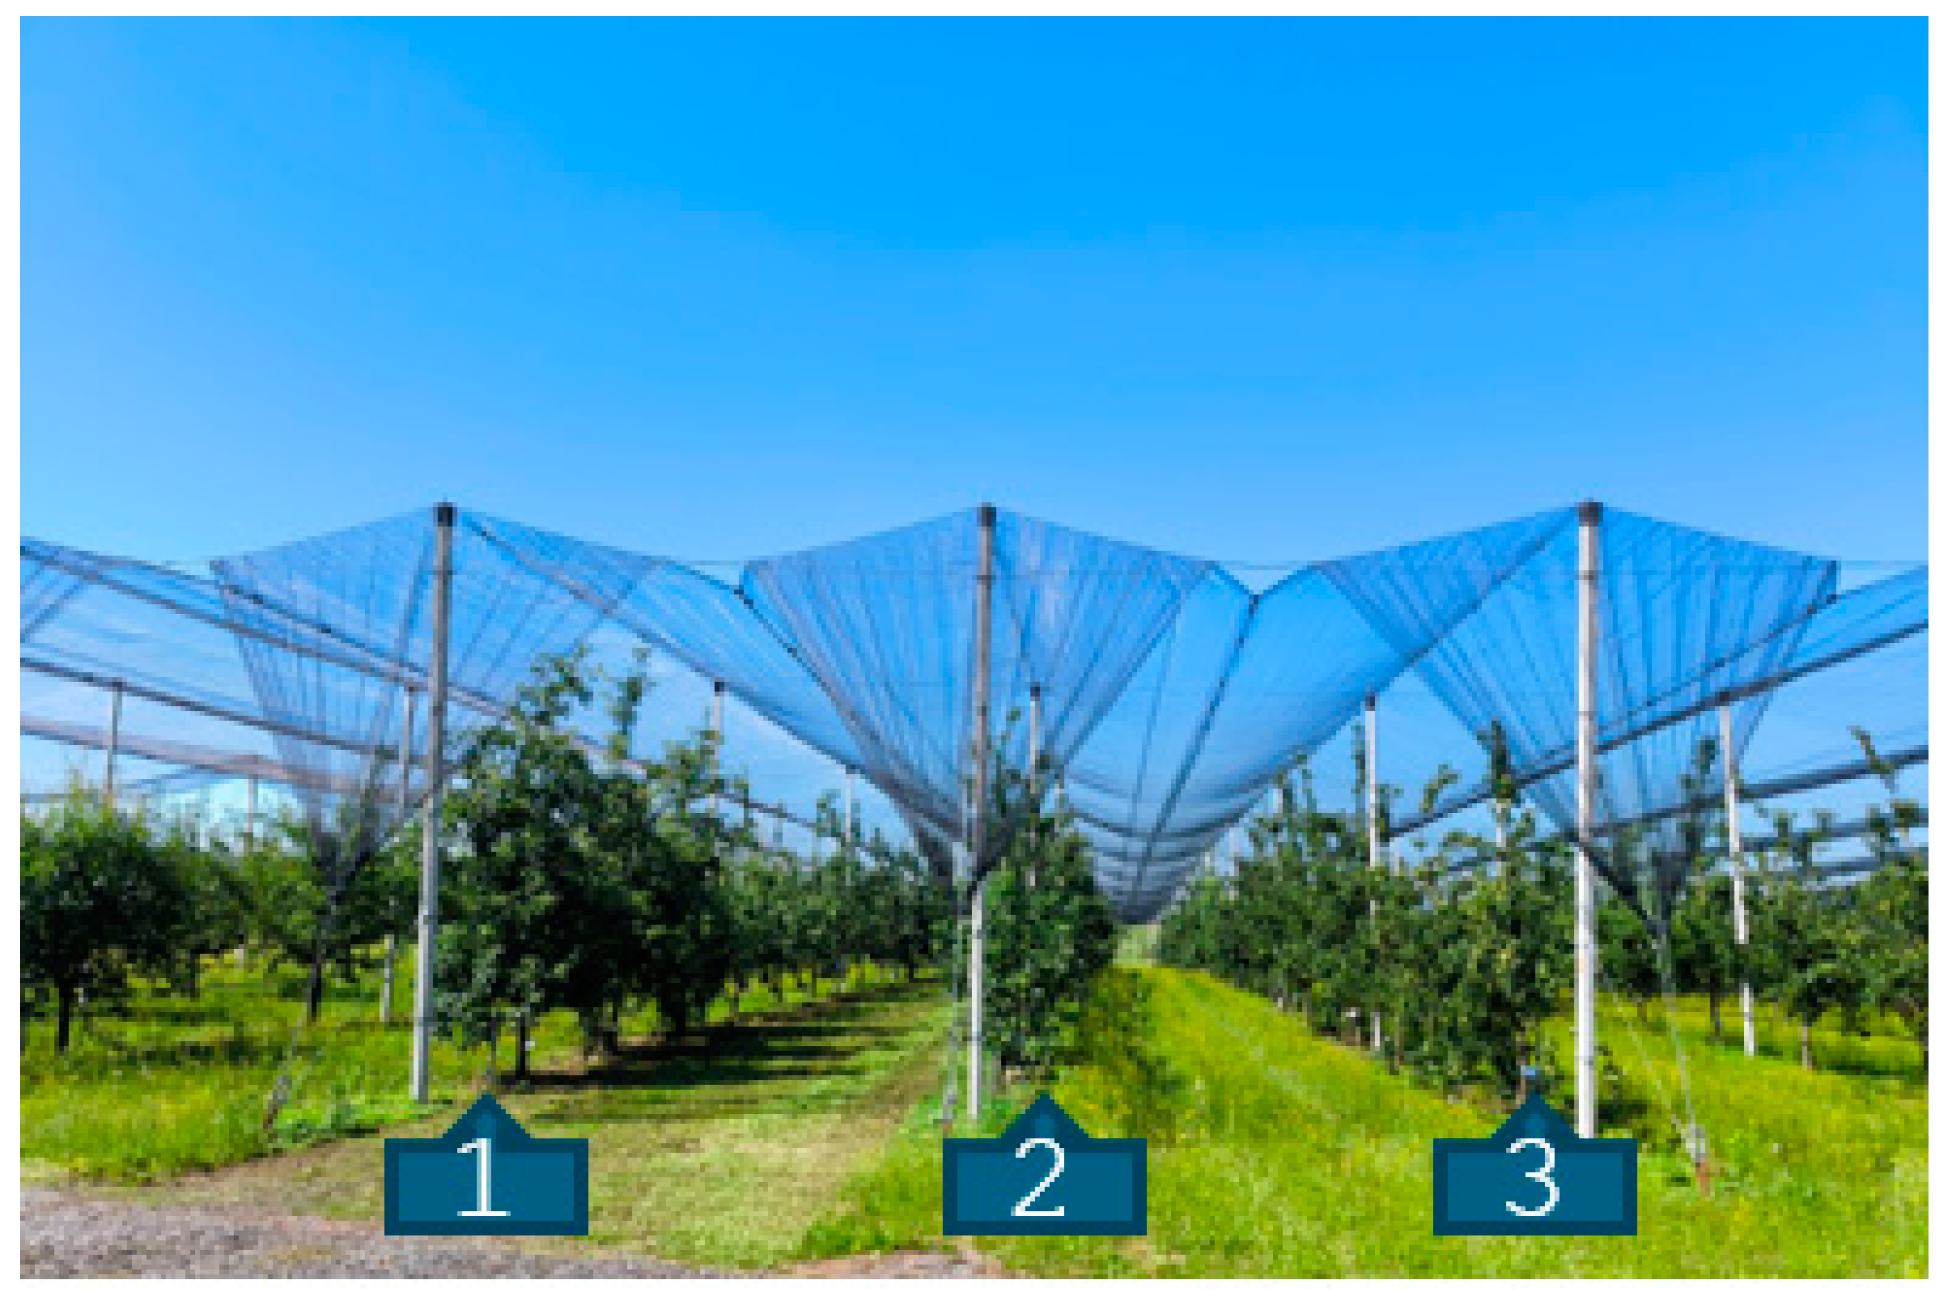
Figure 1. Study replicates 1–3.
Agriculture 14 01239 g001
Figure 2. Position of soil moisture sensors (red square) in an irrigated apple orchard.
Agriculture 14 01239 g002
Figure 3. Soil sensors’ installation depths and positions (A—Watermark, B—tensiometer, C—PR2, D—SM150, E—TDR300).
Agriculture 14 01239 g003
Figure 4. The laboratory calibration for Watermark and the tensiometer.
Agriculture 14 01239 g004
Figure 5. Soil water content (%vol.) monitored with different soil moisture sensors (Watermark, tensiometer, SM150, TDR300 and PR2) at different soil depths (20, 30, and 40 cm).
Agriculture 14 01239 g005
Table 1. Physical and chemical soil properties at the study site.
Physical Properties
DepthSiltClaySandPRCACPWPPD
(cm)%%%%%%%g/cm3
0–3064.732.52.844.839.65.223.72.75
30–5066.431.32.342.137.84.324.52.66
Chemical properties
DepthpHAl-P2O5Al-K2OOrganic matterCaCO3
(cm)H2OKClmg 100 g−1%%
0–305.596.6026.4029.702.551.25
30–506.857.6413.7525.331.632.51
P—porosity; RC—retention capacity; AC—air capacity; PWP—permanent wilting point; PD—particle density.
Table 2. Analysis of irrigation water.
UnitsUsual RangeResult UnitUsual RangeResult
Turbidity 3Mgme L−10–53.9
pH 6.5–8.47.4Came L−10–206.8
ECdS m−10–30.7Kme L−10–21.3
Toxicity
Clmg L−10–303.4
Bmg L−10–20.6
Namg L−10–402.6
Table 3. Monthly weather data during the study period (May–August) and long-term average (LTA, 1961–1990).
PeriodMayJuneJulyAugustAverage/TotalAberration
Monthly rainfall (mm)202266.077.219.222.7185.1−84.7
LTA58.588.064.858.5269.8
Efficient rainfall (mm)202259.067.518.429.5174.4−65.3
LTA53.075.658.153.0239.7
Monthly air temperature (°C)202219.023.323.823.722.5+3.1
LTA16.519.521.120.319.4
Air humidity (%)202258.263.552.557.858.0−11.7
LTA69.070.668.570.869.7
Wind speed (m s−1)20221.81.92.11.91.9+0.2
LTA1.91.81.71.61.8
Sunshine (h)20228.710.811.39.410.05+1.9
LTA6.97.68.37.58.2
ETo (mm month)202297.0129.3143.2111.6120.3+20.3
LTA88.4103.8113.897.0100.8
ETc (mm month)202244.480.492.271.572.1+12.1
LTA39.865.176.360.760.5
Table 4. Average soil water content (%vol.) measured with the tested soil moisture sensors and gravimetric method, and ANOVA results.
Average Soil Water Content (%vol.)
WatermarkTensiometerTDR300SM150PR2Gravimetric
20 cm32.7631.8038.9335.9236.1836.23
30 cm30.8330.12 33.4034.2334.11
40 cm30.5130.96 31.2433.7933.36
ANOVA
FpSMSLSD0.05LSD0.01
SMS112.60.00Watermark0.8221.080
Soil depth110.30.00Tensiometer0.5310.698
SMS × Soil depth4.90.00SM1501.0831.423
PR20.8651.137
SMS—soil moisture sensor, LSD—least significant difference.
Table 5. Parameters of the linear regression equation.
Soil DepthrInterceptSlopep-Value
Watermark
20 cm0.6332.4720.1050.045
30 cm0.6046.243−0.3880.000
40 cm0.5926.6860.2050.013
Tensiometer
20 cm0.2934.1120.0670.011
30 cm0.2649.135−0.5320.085
40 cm0.2426.9270.2220.481
TDR300
20 cm0.3241.377−0.1360.508
SM150
20 cm0.951.9200.9870.000
30 cm0.960.5790.0760.000
40 cm0.720.6130.0140.000
PR2
20 cm0.960.9121.0000.000
30 cm0.970.6510.1140.000
40 cm0.910.1261.0170.000
Significant (p < 0.05) values are highlighted.
Table 6. Pearson’s correlation coefficients (r) among tested soil moisture sensors at different soil depths.
W
20 cm
W
30 cm
W
40 cm
T
20 cm
T
30 cm
T
40 cm
TDR300
20 cm
SM150
20 cm
SM150 30 cmSM150 40 cm
W 20 cm-
W 30 cm0.69
W 40 cm0.610.79
T 20 cm0.740.760.75
T 30 cm0.680.720.670.89
T 40 cm0.660.700.850.850.86
TDR300 20 cm0.460.390.260.290.260.24
SM150 20 cm0.100.380.330.240.150.230.15
SM150 30 cm0.160.160.470.370.140.180.170.56
SM150 40 cm0.210.590.290.130.160.120.180.510.68
PR2 20 cm0.310.560.590.210.140.370.120.980.620.63
PR2 30 cm0.360.180.470.220.140.260.180.560.840.71
PR2 40 cm0.350.600.690.120.170.740.140.510.770.87
W—Watermark, T—tensiometer; significant correlations (p < 0.05) are highlighted.
Table 7. Values of the RMSE, MSE and MD indices obtained at 20, 30 and 30 cm soil depths for the tested soil moisture sensors.
W
20 cm
W
30 cm
W
40 cm
T
20 cm
T
30 cm
T
40 cm
TDR300
20 cm
SM150
20 cm
SM150
30 cm
SM150
40 cm
PR2
20 cm
PR2
30 cm
PR2
40 cm
RMSE3.864.243.675.814.535.515.032.242.182.341.801.311.55
MSE14.8618.0113.3633.7820.5630.325.255.022.931.893.231.702.39
MD3.133.123.04.753.924.574.422.03.913.261.341.241.51
W—Watermark, T—tensiometer; significant correlations (p < 0.05) are highlighted.
Table 8. Parameters of the linear regression equation for the rainfed treatment.
Soil DepthrInterceptSlopep-Value
Watermark
20 cm0.933.4540.1250.035
30 cm0.904.2310.3480.010
40 cm0.893.6740.2250.023
Tensiometer
20 cm0.4914.1120.0970.016
30 cm0.4619.1350.4220.075
40 cm0.4416.9270.2820.321
TDR300
20 cm0.821.3920.1130.012
SM150
20 cm0.960.8410.9270.000
30 cm0.950.4620.0160.000
40 cm0.920.6000.0190.000
PR2
20 cm0.980.6120.0200.000
30 cm0.970.1510.0140.000
40 cm0.930.1461.0190.000
Significant (p < 0.05) values are highlighted.
Table 9. Pearson’s correlation coefficients (r) among tested soil moisture sensors at different soil depths in the rainfed treatment.
W
20 cm
W
30 cm
W
40 cm
T
20 cm
T
30 cm
T
40 cm
TDR300
20 cm
SM150
20 cm
SM150 30 cmSM150 40 cm
W 20 cm-
W 30 cm0.82
W 40 cm0.810.89
T 20 cm0.740.760.65
T 30 cm0.780.720.670.79
T 40 cm0.760.700.650.750.86
TDR300 20 cm0.660.590.560.540.560.54
SM150 20 cm0.220.410.320.240.190.260.82
SM150 30 cm0.260.360.410.370.190.280.880.66
SM150 40 cm0.250.530.310.130.150.320.850.570.78
PR2 20 cm0.390.530.610.210.130.370.920.940.680.65
PR2 30 cm0.390.280.520.220.180.310.910.940.820.74
PR2 40 cm0.390.540.410.120.160.740.900.810.790.91
W—Watermark, T—tensiometer; significant correlations (p < 0.05) are highlighted.
Table 10. Value of the RMSE, MSE and MD indices obtained at 20, 30 and 30 cm soil depths for the tested soil moisture sensors in the rainfed treatment.
W
20 cm
W
30 cm
W
40 cm
T
20 cm
T
30 cm
T
40 cm
TDR300
20 cm
SM150
20 cm
SM150
30 cm
SM150
40 cm
PR2
20 cm
PR2
30cm
PR2
40 cm
RMSE2.362.142.174.214.135.002.131.941.841.221.001.111.15
MSE11.2410.2110.1313.2114.5420.474.843.212.872.981.641.742.01
MD2.412.062.543.013.123.782.021.981.901.201.141.141.01
Disclaimer/Publisher’s Note: The statements, opinions and data contained in all publications are solely those of the individual author(s) and contributor(s) and not of MDPI and/or the editor(s). MDPI and/or the editor(s) disclaim responsibility for any injury to people or property resulting from any ideas, methods, instructions or products referred to in the content.