Article

Development of an Intelligent Service Platform for a Poultry House Facility Environment Based on the Internet of Things

1
College of Water Resources and Civil Engineering, China Agricultural University, Beijing 100083, China
2
Information Office (Network Technology Center), China Agricultural University, Beijing 100083, China
3
CRRC Industrial Institute (Qingdao) Co., Ltd., Qingdao 266000, China
*
Authors to whom correspondence should be addressed.
Agriculture 2024, 14(8), 1277; https://doi.org/10.3390/agriculture14081277
Submission received: 14 June 2024 / Revised: 19 July 2024 / Accepted: 31 July 2024 / Published: 2 August 2024
(This article belongs to the Special Issue Optimization of Livestock Housing Management)

Abstract

:
In recent years, the poultry breeding industry has been converted into a large-scale, intensive, and intelligent production mode. The Internet of Things (IoT) is under rapid development, which promotes the development of precision livestock farming. In this study, we developed an intelligent service platform for a facility environment based on the IoT structure, utilizing the capabilities of Platform as a Service (PaaS). The platform consists of four layers, including an information perception layer, network layer, management service layer, and application layer. By using the cloud service model with a distributed network architecture, asynchronous data transmission, and a distributed file system, the platform can centrally manage multiple farm’s data. The intelligent service platform includes the following functions: displaying environmental data, water and electricity consumption, data analysis, and managing production data. Over a 500-day trial period in a live poultry house, the platform demonstrated high data integrity (>87%) and resilience against network disruptions and power outages. The data validity of each environmental element exceeded 94%, among which the validity of the temperature, humidity, and carbon dioxide concentration exceeded 99%. The overall accuracy of the dataset remained relatively high, providing a robust data foundation for further research. Key features included audio analysis, environmental monitoring, and production data management. The platform’s operational status was efficiently communicated via data statistics and email alerts, facilitating timely system recovery. The demonstrated modules included sound recognition, psychrometric charts for visual alerts, and financial analysis tools, offering versatile solutions for integrating PLF models and advanced analytics.

1. Introduction

The concept of the Internet of Things (IoT) was first proposed by Professor Ashton of MIT in 1999 when he was working on RFID (Radio Frequency Identification). The IoT is transforming daily lives by creating a smart, connected world, with applications in smart homes [1], intelligent public transport systems [2], smart parking [3], and human health monitoring [4]. In agriculture, the IoT enables precision livestock farming [5], smart greenhouse management [6], smart aquaculture [7], and weather monitoring [8], fostering advancements in the sector. With the continuous development of perceptive technology in all walks of life, the IoT provides the opportunity for precision livestock farming (PLF). Differing in both its application context and primary objectives, our research focuses on large-scale, intensive, and intelligent poultry farming. The core aim is to harness IoT and PaaS technologies to achieve smart management of the poultry-rearing environment, enhancing managerial oversight of the production process and boosting operational efficiency.
The use of “IoT+” technology has become increasingly prevalent in poultry farming. In different studies, the perception layer, network layer, application layer, and business layer of the IoT are different, but coupling them forms the core of IoT architecture. The perception layer can collect and process large volumes of data in real-time, enabling farmers to make informed decisions and achieve better breeding outcomes [9]. Table 1 shows the differences in a comprehensive comparison of various IoT systems across different components. Table 2 provides a list of various technologies employed in agricultural monitoring systems, encompassing their functional descriptions, primary benefits, and potential drawbacks. With the development of the IoT, more sensors are applied in poultry breeding processes. For instance, sound sensors can be employed to monitor the welfare level of chickens [10], while digital image sensors [11] and near-infrared sensors [12] can be utilized to observe birds’ condition. Additionally, acceleration sensors can capture more intricate movements and actions of chickens [13]. These advances allow the IoT to better perceive and understand information from their environment and hens’ behavior. For the network layer, relevant research has integrated sensor technology and mobile communication technology based on traditional environmental control [14]. For example, wireless sensor technology based on the ZigBee network protocol combined with an embedded server [15], Long Range Radio (LoRa), and Message Queuing Telemetry Transport (MQTT) communication technology [16] developed and obtained the environmental data acquisition scheme based on IoT technology, and adopted 3G [17], 3G + VPN [18] communication technology to design a real-time poultry monitoring platform. Through the data collected by the IoT, a fuzzy logic approach for the decision-making system of context-based livestock control systems was established [19]. With the development of cloud platform technology, a comprehensive digital intelligent monitoring system was formed through the integration of a data acquisition system and background management system [20,21]. Cloud computing provides the hardware, software, and storage computing resources required for system operation to store, process, and analyze large amounts of data and provide services to users over the network [22]. By leveraging the remote server infrastructure provided by cloud platforms, users can engage in remote work seamlessly from any location, enhancing flexibility and productivity [23]. Clouds can be classified as methods of providing services such as IaaS (Infrastructure as a Service), Pass (Platform as a Service), and SaaS (Software as a Service). IaaS requires users to build platforms on cloud infrastructure, PaaS offers customized cloud environments for platform development, and SaaS provides software applications directly from service providers [24]. In addition, combined with the intelligent management platform constructed by behavioral physiology and production performance tracking, an automatic detection system for sick chickens based on ResNet (residual network) was developed with broilers as experimental objects [25]. Pereira W F et al. [26] proposed a low-cost scheme combining software and hardware to monitor the environmental parameters of poultry farms and formed a collection system based on the Android software (versions 4.0+) program. These systems use IoT technology to monitor and analyze field data, predict potential issues, and reduce manpower. IoT technology also addresses the challenge of remote management, enabling full-time monitoring of poultry breeding environments. By leveraging historical data, the breeding process can be fine-tuned, and environmental controls can be adjusted in real-time, resulting in improved animal welfare [27]. In the field of cultivation, researchers proposed and established an information service system rooted in the agricultural IoT’s technical architecture, actively developing a deep belief neural network-based model for forecasting agricultural product prices [28]. However, there are still some challenges in applying the IoT in poultry farms. One is the need to upload various types of data, including sensor data (e.g., temperature, humidity, feed consumption), audio and video data. The reliability of data is also important. It refers to ensuring the reliability, continuity, and consistency of data, whether during the data collection process or after uploading it to the cloud or other storage/processing platforms. Another one is the analysis and processing of the collected data, such as the comprehensive analysis of environmental data and the analysis of production data.
In this study, an intelligent service platform was developed based on IoT, using the cloud service as a distributed system for data storage and transmission. The acquired raw data were stored in the local server and simultaneously uploaded to the cloud database. Audio and video data in the breeding chosen from each hour were stored in local storage and then uploaded to the cloud storage. The real-time monitoring of the whole growth process of laying hens was realized in an experimental poultry house. The data validity of each environmental element was calculated. The overall accuracy of the dataset was tested as well.

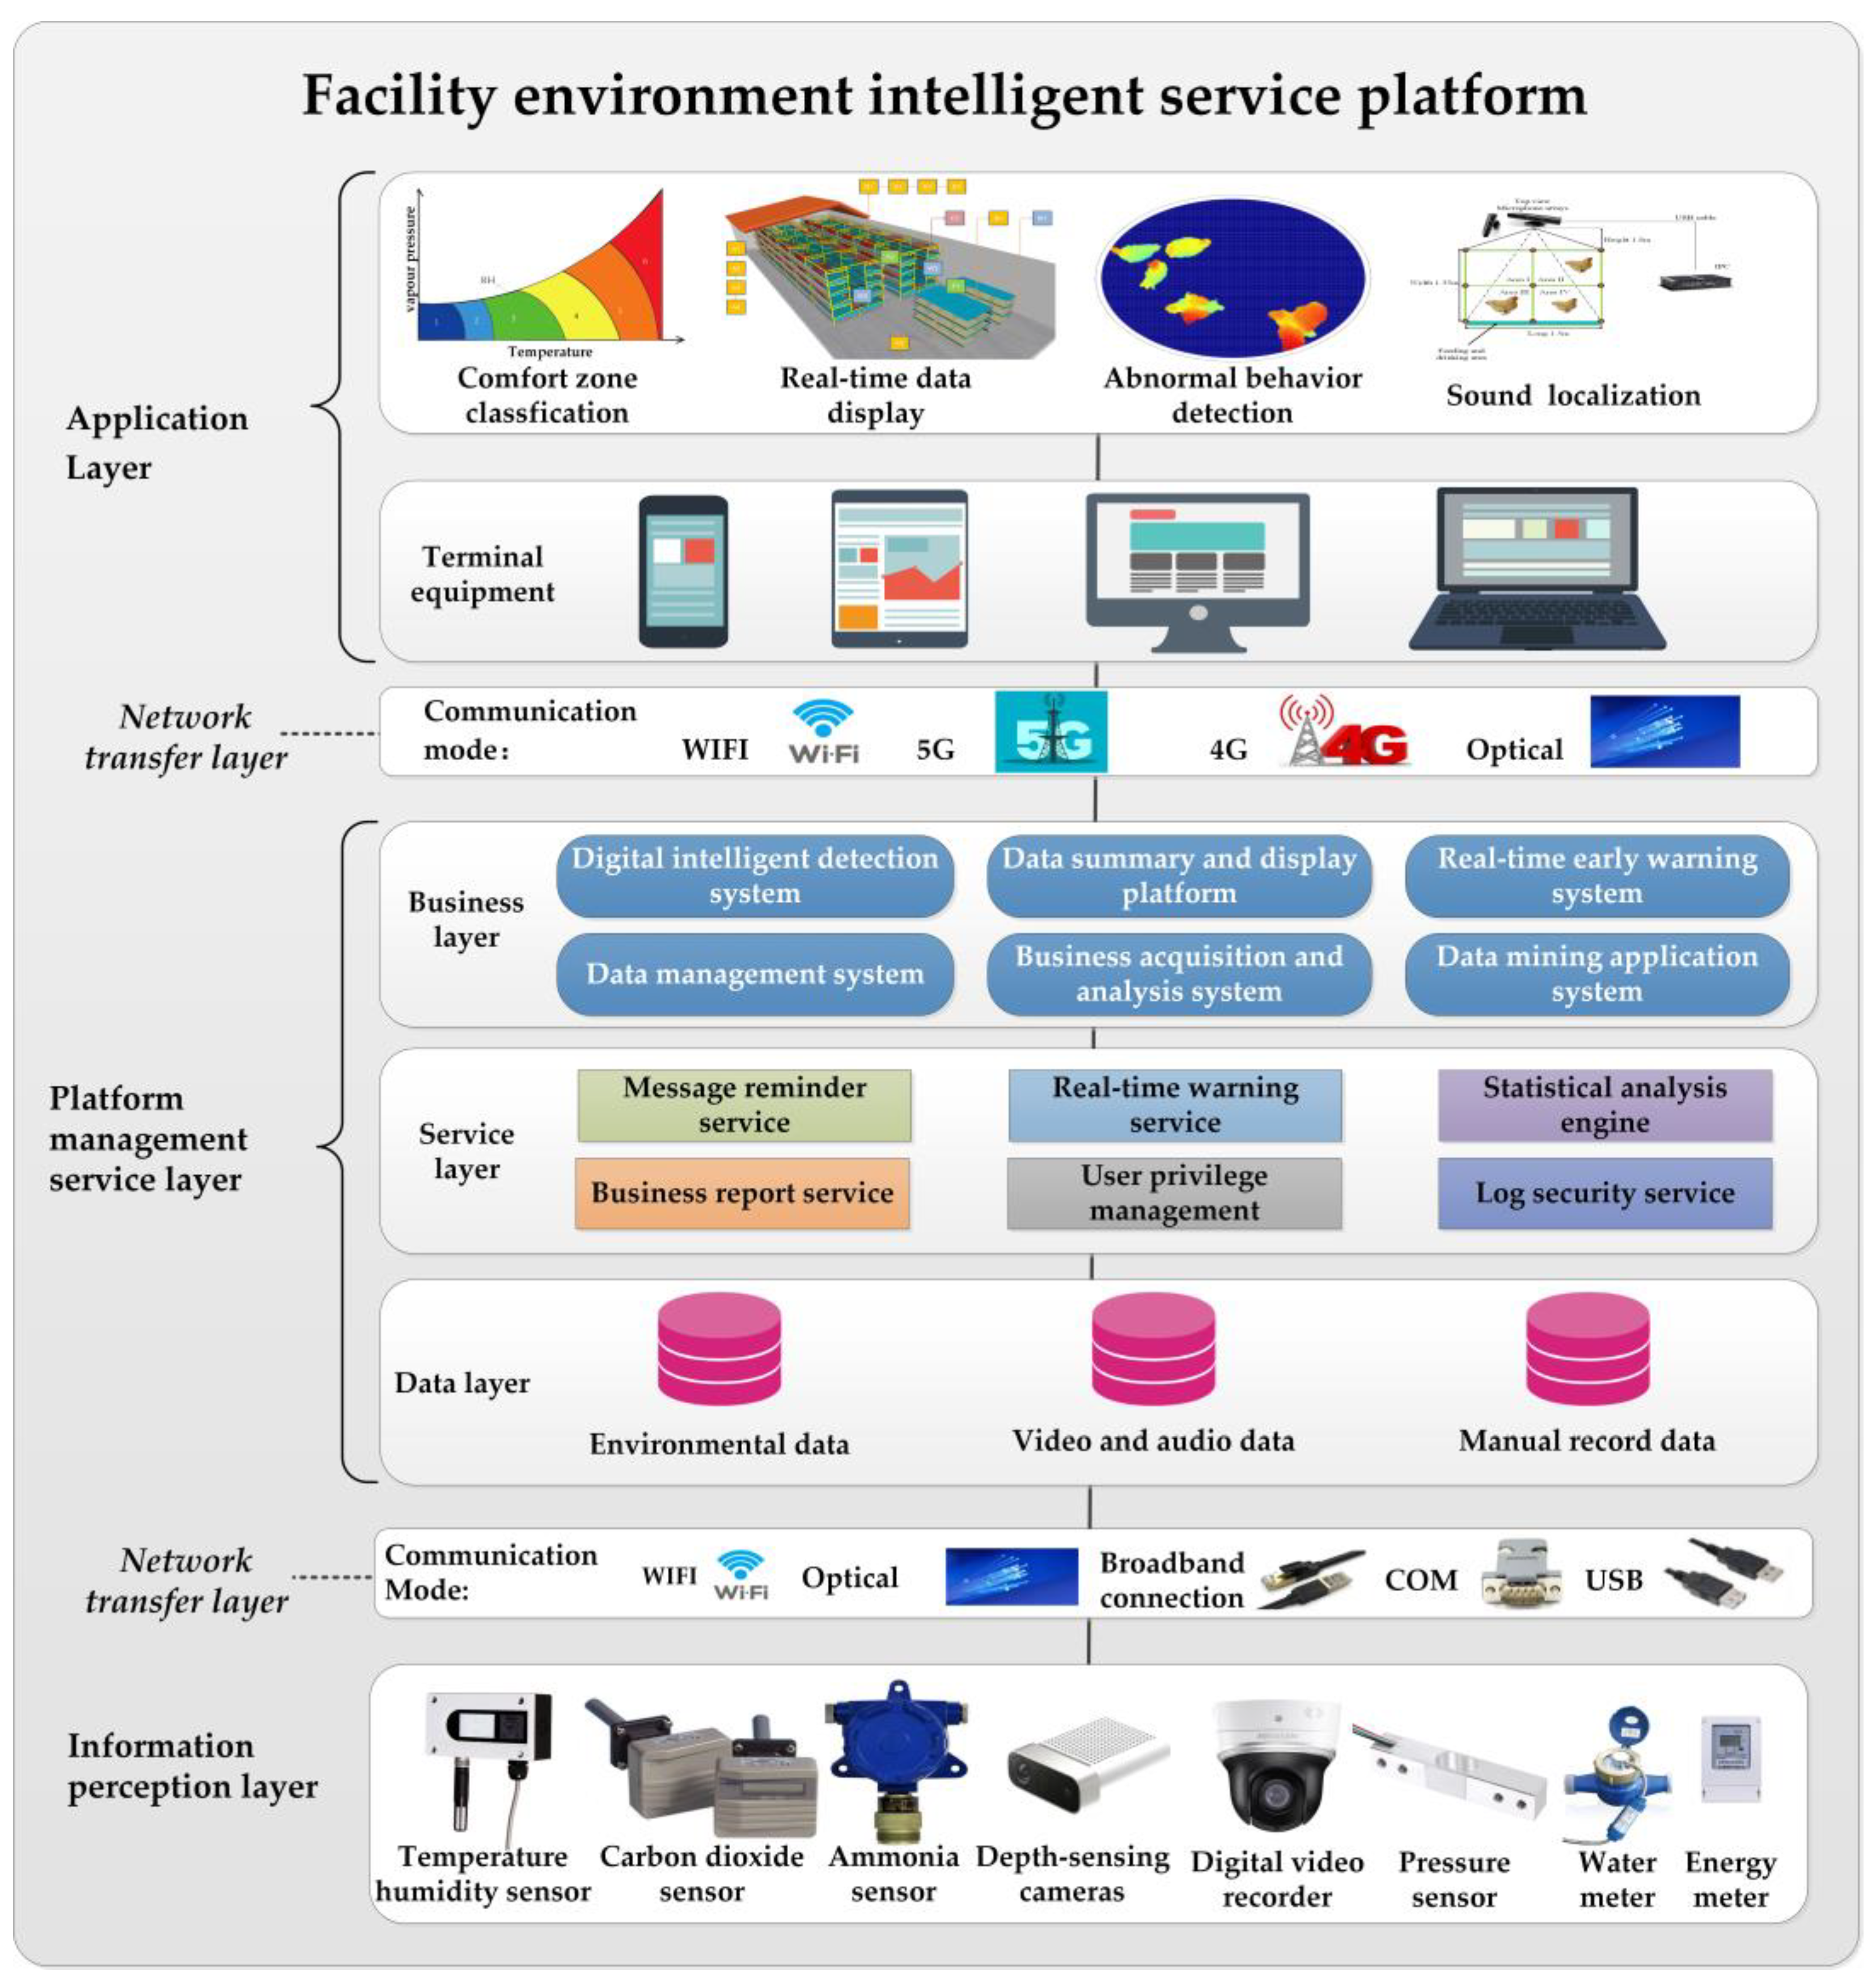
2. Design of Platform System Structure

The construction of an intelligent service platform for a facility environment (Figure 1) is based on the architecture of the IoT, which can be mainly divided into four layers, including the information perception layer, network transfer layer, platform management service layer, and application layer.
The information perception layer collects data on the poultry house environment, growth performance, and production consumption. After data collection, the network layer facilitates end-to-end data transmission between source and destination hosts, playing a crucial role in network connectivity and data routing. It includes the access network and transport network, enabling access and transmission functions through methods like fiber optic, wireless, and Ethernet access. Data flow from the network transfer layer to the platform management services layer and then to the application layer. This layer is divided into data storage, service provision, and business services sub-layers. The integrated application layer processes data and offers services to users, including real-time data displays and analysis. For example, it can display the classification of heat stress levels in poultry houses using psychrometric charts [29], show the locations of abnormal sounds [30] and detect abnormal behaviors [31]. Users can interact with the user interface to view recent historical data from different locations.

2.1. Data Acquisition Scheme

In this platform, there are multiple data collected and recorded to provide comprehensive information support. These data can be classified into three main categories: ecological data, physiological data, and production process data.
Ecological data include temperature, humidity, carbon dioxide concentration, ammonia concentration, and air velocity. Indoor environmental data are collected every five minutes, 24/7. The sensors used for ecological data are shown in Table 3.
Figure 2 shows the data collection and display process. Ecological data collection involves converting physical signals into digital form using sensors and data acquisition (DAQ) systems. LabVIEW (Laboratory Virtual Instrument Engineering Workbench), a graphical programming language, was employed in this study to write the data acquisition program. LabVIEW facilitates communication with data acquisition cards, supporting various protocols like GPIB, VXI, RS-232, and RS-485. The data acquisition system typically converts analog signals to digital signals for processing, incorporating sensors, signal conditioning circuits, and analog-to-digital converters. Processed digital signals are then transmitted to computers via interfaces like USB, PXI, RS-485, RS-232, Ethernet, or wireless networks for display. These digitized data enable the easy transmission, storage, and in-depth analysis of environmental conditions for producers.
Physiological data focus on the growth status of the poultry. The necessary data were obtained by employing strategically placed audio and video recording modules within the poultry houses. To acquire and locate the abnormal sounds, we used a Kinect microphone array (consisting of three microphones), as introduced in [30], and audio data were stored in the *.wav format, single-channel, 32-bit, 16 kHz, with 1 segment per minute. The acquisition of video data primarily involves the use of Hikvision cameras (Hikvision Digital Technology Co., Ltd., Hangzhou, China), which are utilized to enable remote monitoring through the provided video transmission API. Additionally, depth images were obtained using the Kinect camera for Windows V1 (Microsoft Corp., Washington, WA, USA) and were processed and analyzed using LabVIEW software (version 2015), as described in [31], and depth images (the resolution is 640 × 480 pixels) were recorded in the .txt format at one frame per second. The data were transferred through USB or the Ethernet for storage in specific nodes within the houses and periodically uploaded to the platform. This allowed farmers to have timely insights into the physiological condition of each individual animal, enabling appropriate management and decision-making.
Production process data involve monitoring water and electricity consumption, feed intake, and production performance metrics. Water and electricity meters measure usage and transmit data via RS-485 signals. A serial port server (USR Technology Co., Ltd., Jinan, Shandong, China) converts RS-485 signals to the Ethernet for network communication. LabVIEW software is employed to manage and store serial port data. Feed consumption data are manually recorded. Key production performance indicators such as hen mortality, egg production rate (EPR), cumulative mortality rate (CMR), and hen weight necessitate manual input into the platform for a comprehensive understanding of poultry production.
This system monitors the external environment using Davis Vantage Pro 2 monitoring nodes (Davis Instruments Corp., Hayward, CA, USA) placed on a nearby one-story high roof within a kilometer of the chicken coop. Data collected includes air temperature, humidity, wind direction, speed, rainfall, and barometric pressure. A data acquisition program developed in LabVIEW runs every five minutes, storing weather station data locally and syncing it with the cloud database. This information offers insights into environmental changes, aiding users in anticipating impacts and making informed decisions based on observed conditions.

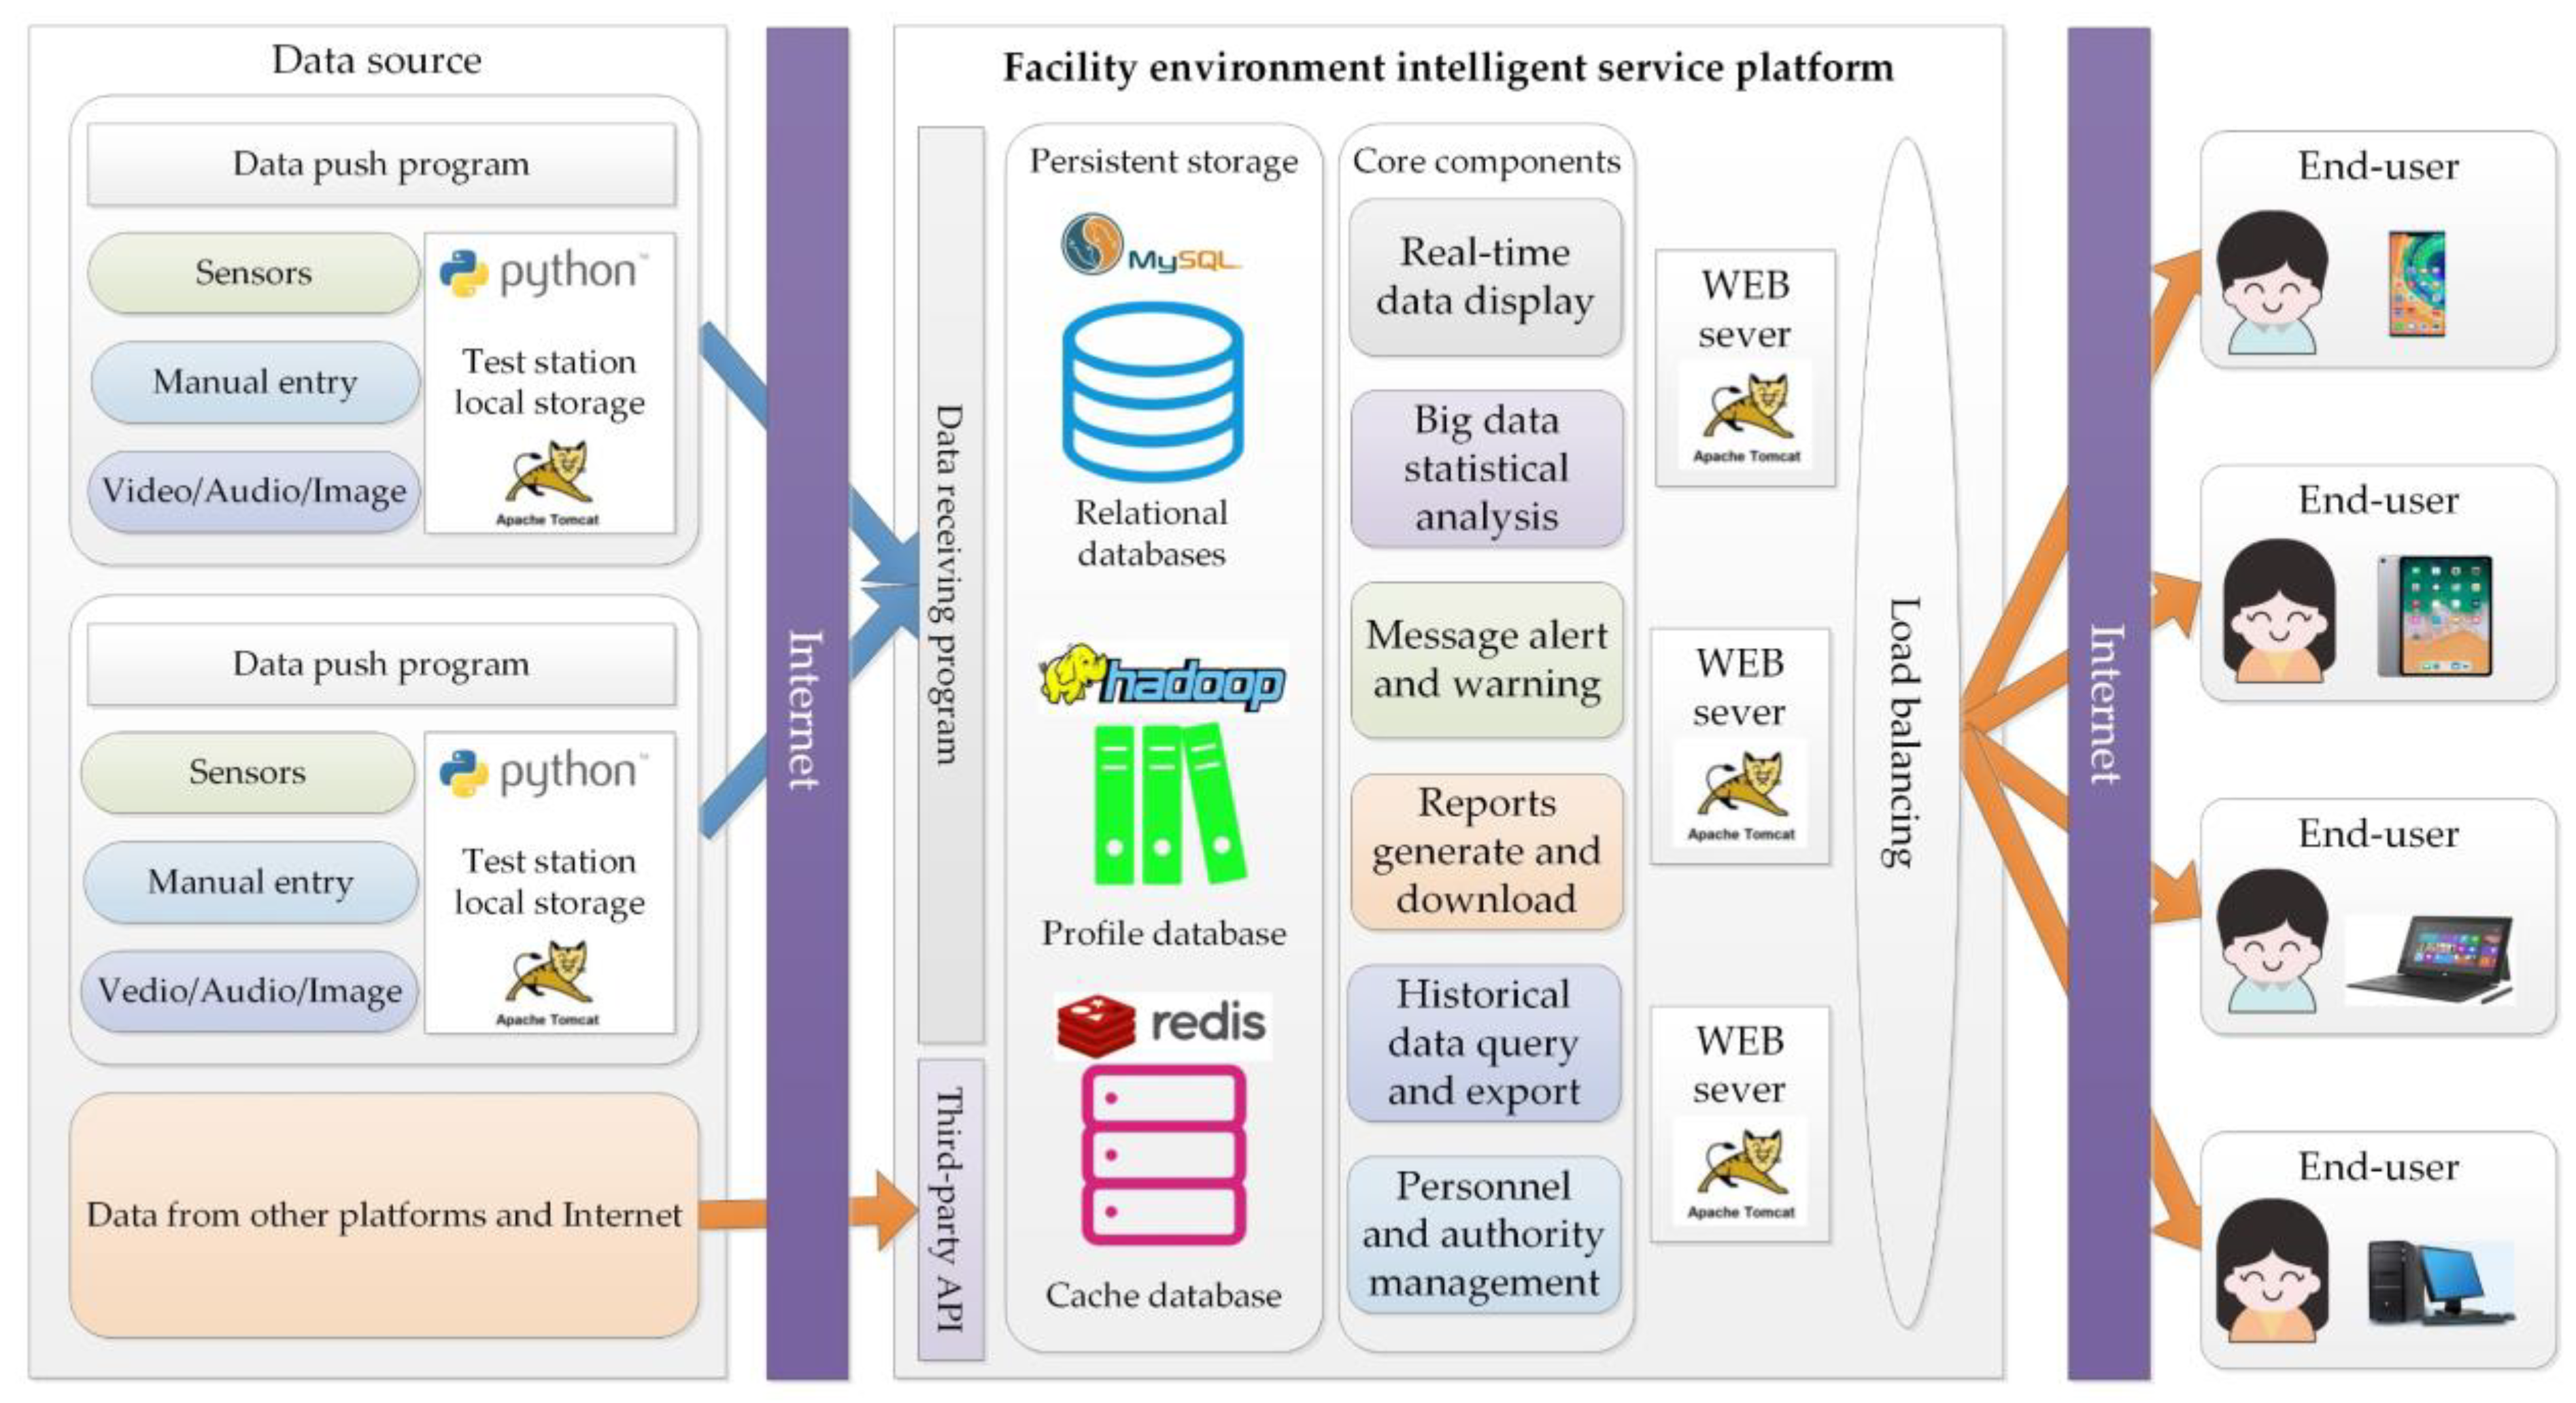
2.2. Data Flow and Storage Scheme

The data flow structure of the platform is presented in Figure 3. This system uses a distributed network architecture for centralized data management across multiple feeding areas, employing asynchronous data transmission and a distributed file system. It efficiently handles on-site farming data and cloud server data at the network level, enabling real-time data processing and distribution. While traditional storage relies on local servers for security and customization, it faces limitations in scalability and flexibility. Cloud storage offers scalability, cost-effectiveness, and accessibility, allowing users to adapt data storage resources to evolving business needs. Despite concerns about data correctness and security, cloud service providers implement stringent measures to safeguard data integrity and security [32].
The data flow and storage process can be divided into four key steps. Firstly, field data are uploaded in real-time using a client/server architecture based on LabVIEW + MySQL. Secondly, a local program is deployed on the local server at the farming site to asynchronously synchronize structured data to the cloud MySQL database and synchronize unstructured data to the file system of the cloud platform. Additionally, data from other platforms [33] are synchronized through custom-developed interfaces, leveraging the scalability of cloud platforms. In the third step, the cloud data center performs real-time processing and analysis of the production of big data. Lastly, by deploying a browser/server architecture based on JAVA + Tomcat + MySQL, clients can access the data and application services provided by this system in real-time through mobile devices or web browsers.
In the data flow and storage scheme, raw data are stored in on-site processors and promptly sent to the cloud database. Data from other platforms are uploaded into the cloud database through customized interfaces. Processed image and audio data are kept in a structured database. Additionally, selected image and audio data from each hour are uploaded to the cloud profile database as needed. This scheme ensures data integrity, reliability, and efficiency, offering robust data support for analysis and decision-making.

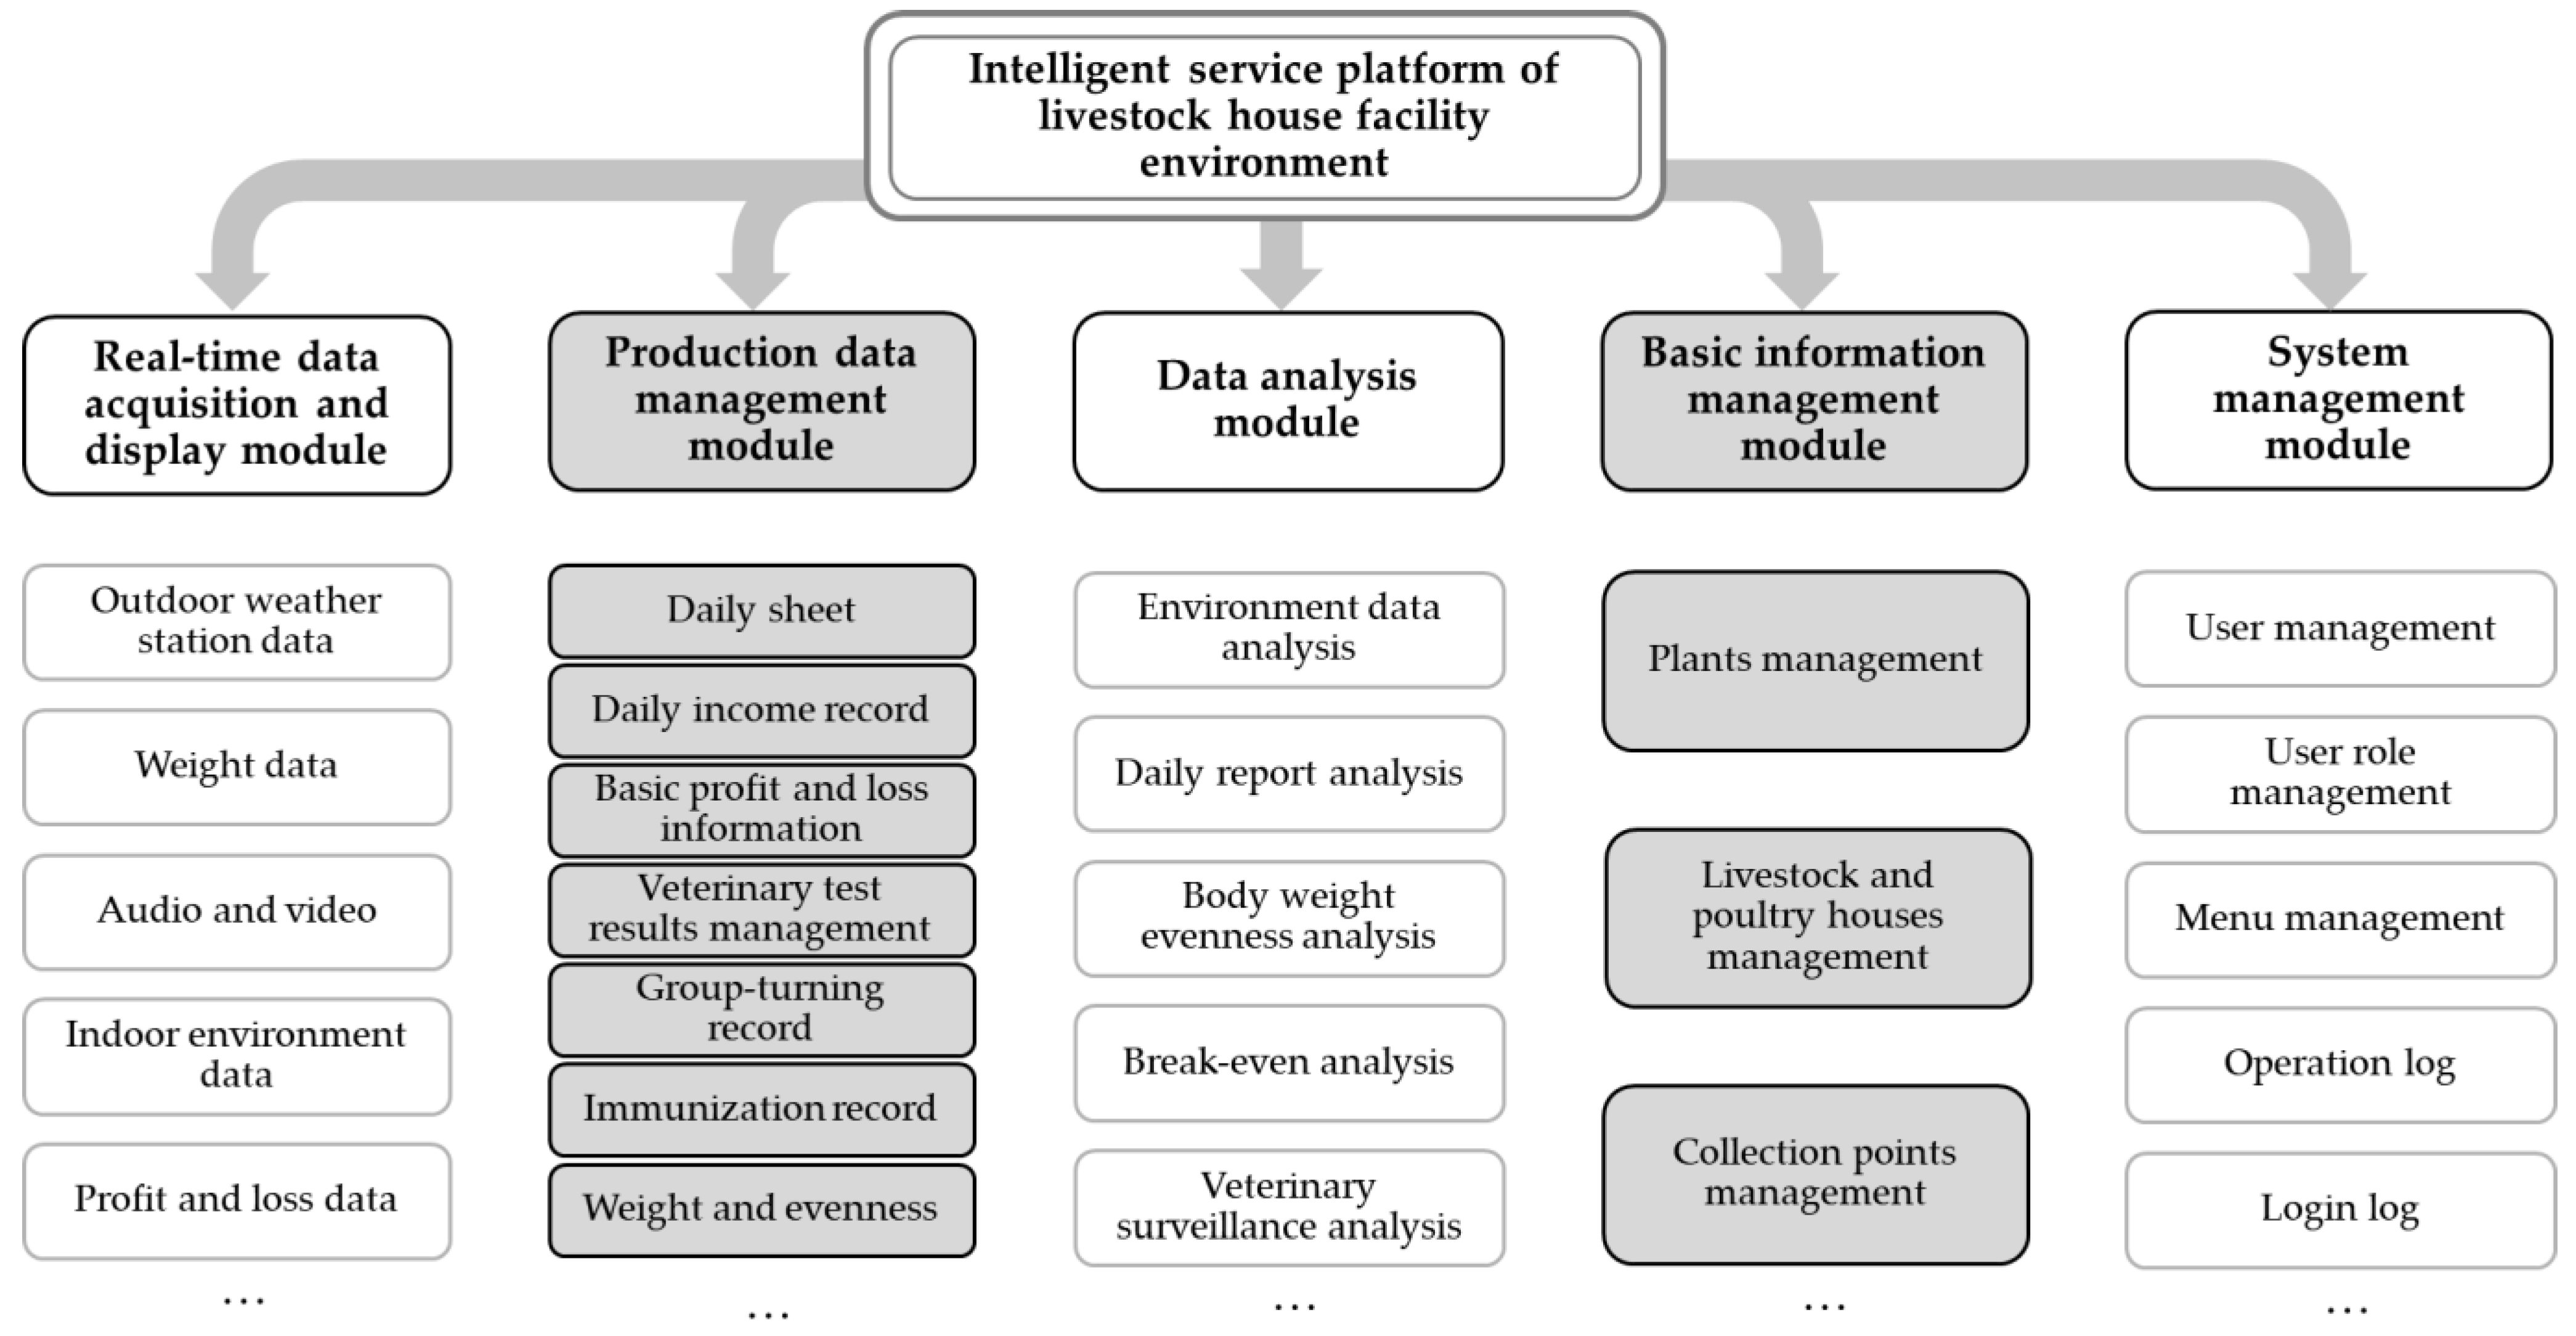
3. System Design and Implementation

Tencent Cloud (Tencent Cloud Computing (Beijing) Co., Ltd., Beijing, China) is a comprehensive cloud computing service platform. This study leverages the PaaS service provided by Tencent Cloud for development. The PaaS service simplifies the development, deployment, and management processes of applications, allowing developers to focus more on the logic and functionality of their applications.
The functions implemented by the facility environment intelligent service platform are presented in Figure 4, including real-time data collection and display, data analysis, production data management, basic information management, and system management.

3.1. Real-Time Data Collection and Display

This part is mainly used to visualize the growth status of poultry animals by means of videos and charts. The data acquisition and transmission scheme introduced in Section 2.1 and Section 2.2 can be used to ensure the stability of the data. In addition, data synchronization can be reflected by the data count of the day.
The real-time data module displays animal survival conditions using live video streaming and sensor data like temperature and humidity. It provides schematic diagrams for easy understanding. Evaluations are based on preset thresholds, showing environment status through color and text. This helps users quickly assess conditions and make informed decisions, enhancing animal welfare and production standards.

3.2. Production Data Management

This section includes daily reports, daily revenue records, profit and loss base information, veterinary management, transfer records, immunization records, and information on weight and evenness. The production data are filled in by the breeder every day and can be filled in and uploaded through the web interface or mobile client.
Figure 5 displays a daily report template for poultry management, covering housing details, the move-in date, age, mortality rate, egg production metrics, and environmental factors like temperatures. Managers can edit and view data, enabling better understanding, monitoring, efficiency, and cost savings. Digitizing production data ensures centralized storage, streamlining access and enhancing data reliability for analysis and decision-making.

3.3. Data Analysis

This module integrates and analyzes environmental and production data from Section 3.1 and Section 3.2, covering environmental data, daily reports, weight uniformity, profit and loss, and veterinary monitoring. The data analysis interface allows users to query and display historical data through line graphs and charts. It enables the comparison of environmental parameters over different time ranges, tracks historical data changes, and provides insights into production performance metrics like mortality rate, egg production rate, and feed efficiency. Weight uniformity analysis assesses growth consistency, reflecting feeding management effectiveness and health evaluations. Profit and loss analysis focuses on economic data for specific farm buildings or the entire operation, aiding in cost reduction and profit optimization. Veterinary monitoring analyzes pathology test reports to evaluate animal health, disease control effectiveness, and welfare enhancement. Overall, this module enables managers to enhance decision-making, optimize practices, and boost production efficiency.

3.4. Basic Information Management and System Management

The information management module covers farms, poultry houses, and collection point management. Sensors are linked to specific farms, house numbers, and personnel for data monitoring and issue resolution. Abnormal data trigger timely contact with field personnel for repairs, ensuring data continuity and accuracy.
The system management module includes user management, role configuration, menu management, operation logs, and login log management. Different user levels are defined, with a super administrator having the highest authority. Roles and menu visibility are configured for security and data confidentiality. Log management tracks user activities for traceability and security monitoring. Operation logs record user actions like data modifications and report generation, while login logs monitor login details for abnormal behavior detection.
Through basic information management and system management, poultry farms can effectively manage and control the process of data collection and ensure the security and reliability of the system. Administrators can reasonably manage users’ data access rights according to different roles and authority assignments to protect the security of sensitive information. The log management function can provide a tracking function to ensure the integrity and reliability of data. The effective use of these management functions can help improve the management efficiency and data security of poultry farms and promote the optimization and development of production processes.

3.5. System Implementation

A small-scale experimental farm (116° E, 40° N, Beijing, China) was selected for the experiment to build the IoT system. The system was operated from November 2019 to June 2021, and the environmental data collection distribution points are shown in Figure 6. The farm housed 2952 Beijing Pink No. 6 laying hens, with 2592 hens in a new three-dimensional perch system and 360 in stacked cages. Longitudinal mechanical ventilation was used, and the chickens were free to drink water during the rearing period. Rearing practices, temperature, humidity, lighting, and feeding adhered to the guidelines of the “Beijing Pink No. 6 Commercial Egg Laying Chickens Rearing Management Manual”.
The architecture of the field network system is shown in Figure 7. Wireless routers transmit data to the cloud server for remote access. Various sensors in the poultry house collected data like power usage, water consumption, wind speed, CO2 levels, ammonia levels, temperature, and humidity. These sensors connected to local servers through serial port servers and DAM-3058F(I) (Beijing ART Technology Development Co., Ltd., Beijing, China, with eight channels of 0 mA to 20 mA as the current input and a 10 hz sampling frequency), DAQ cards, and then as LAN via switches. The cloud server receives and distributes data to remote users for viewing and management on personal computers, display screens, and mobile devices.

4. Results and Discussions

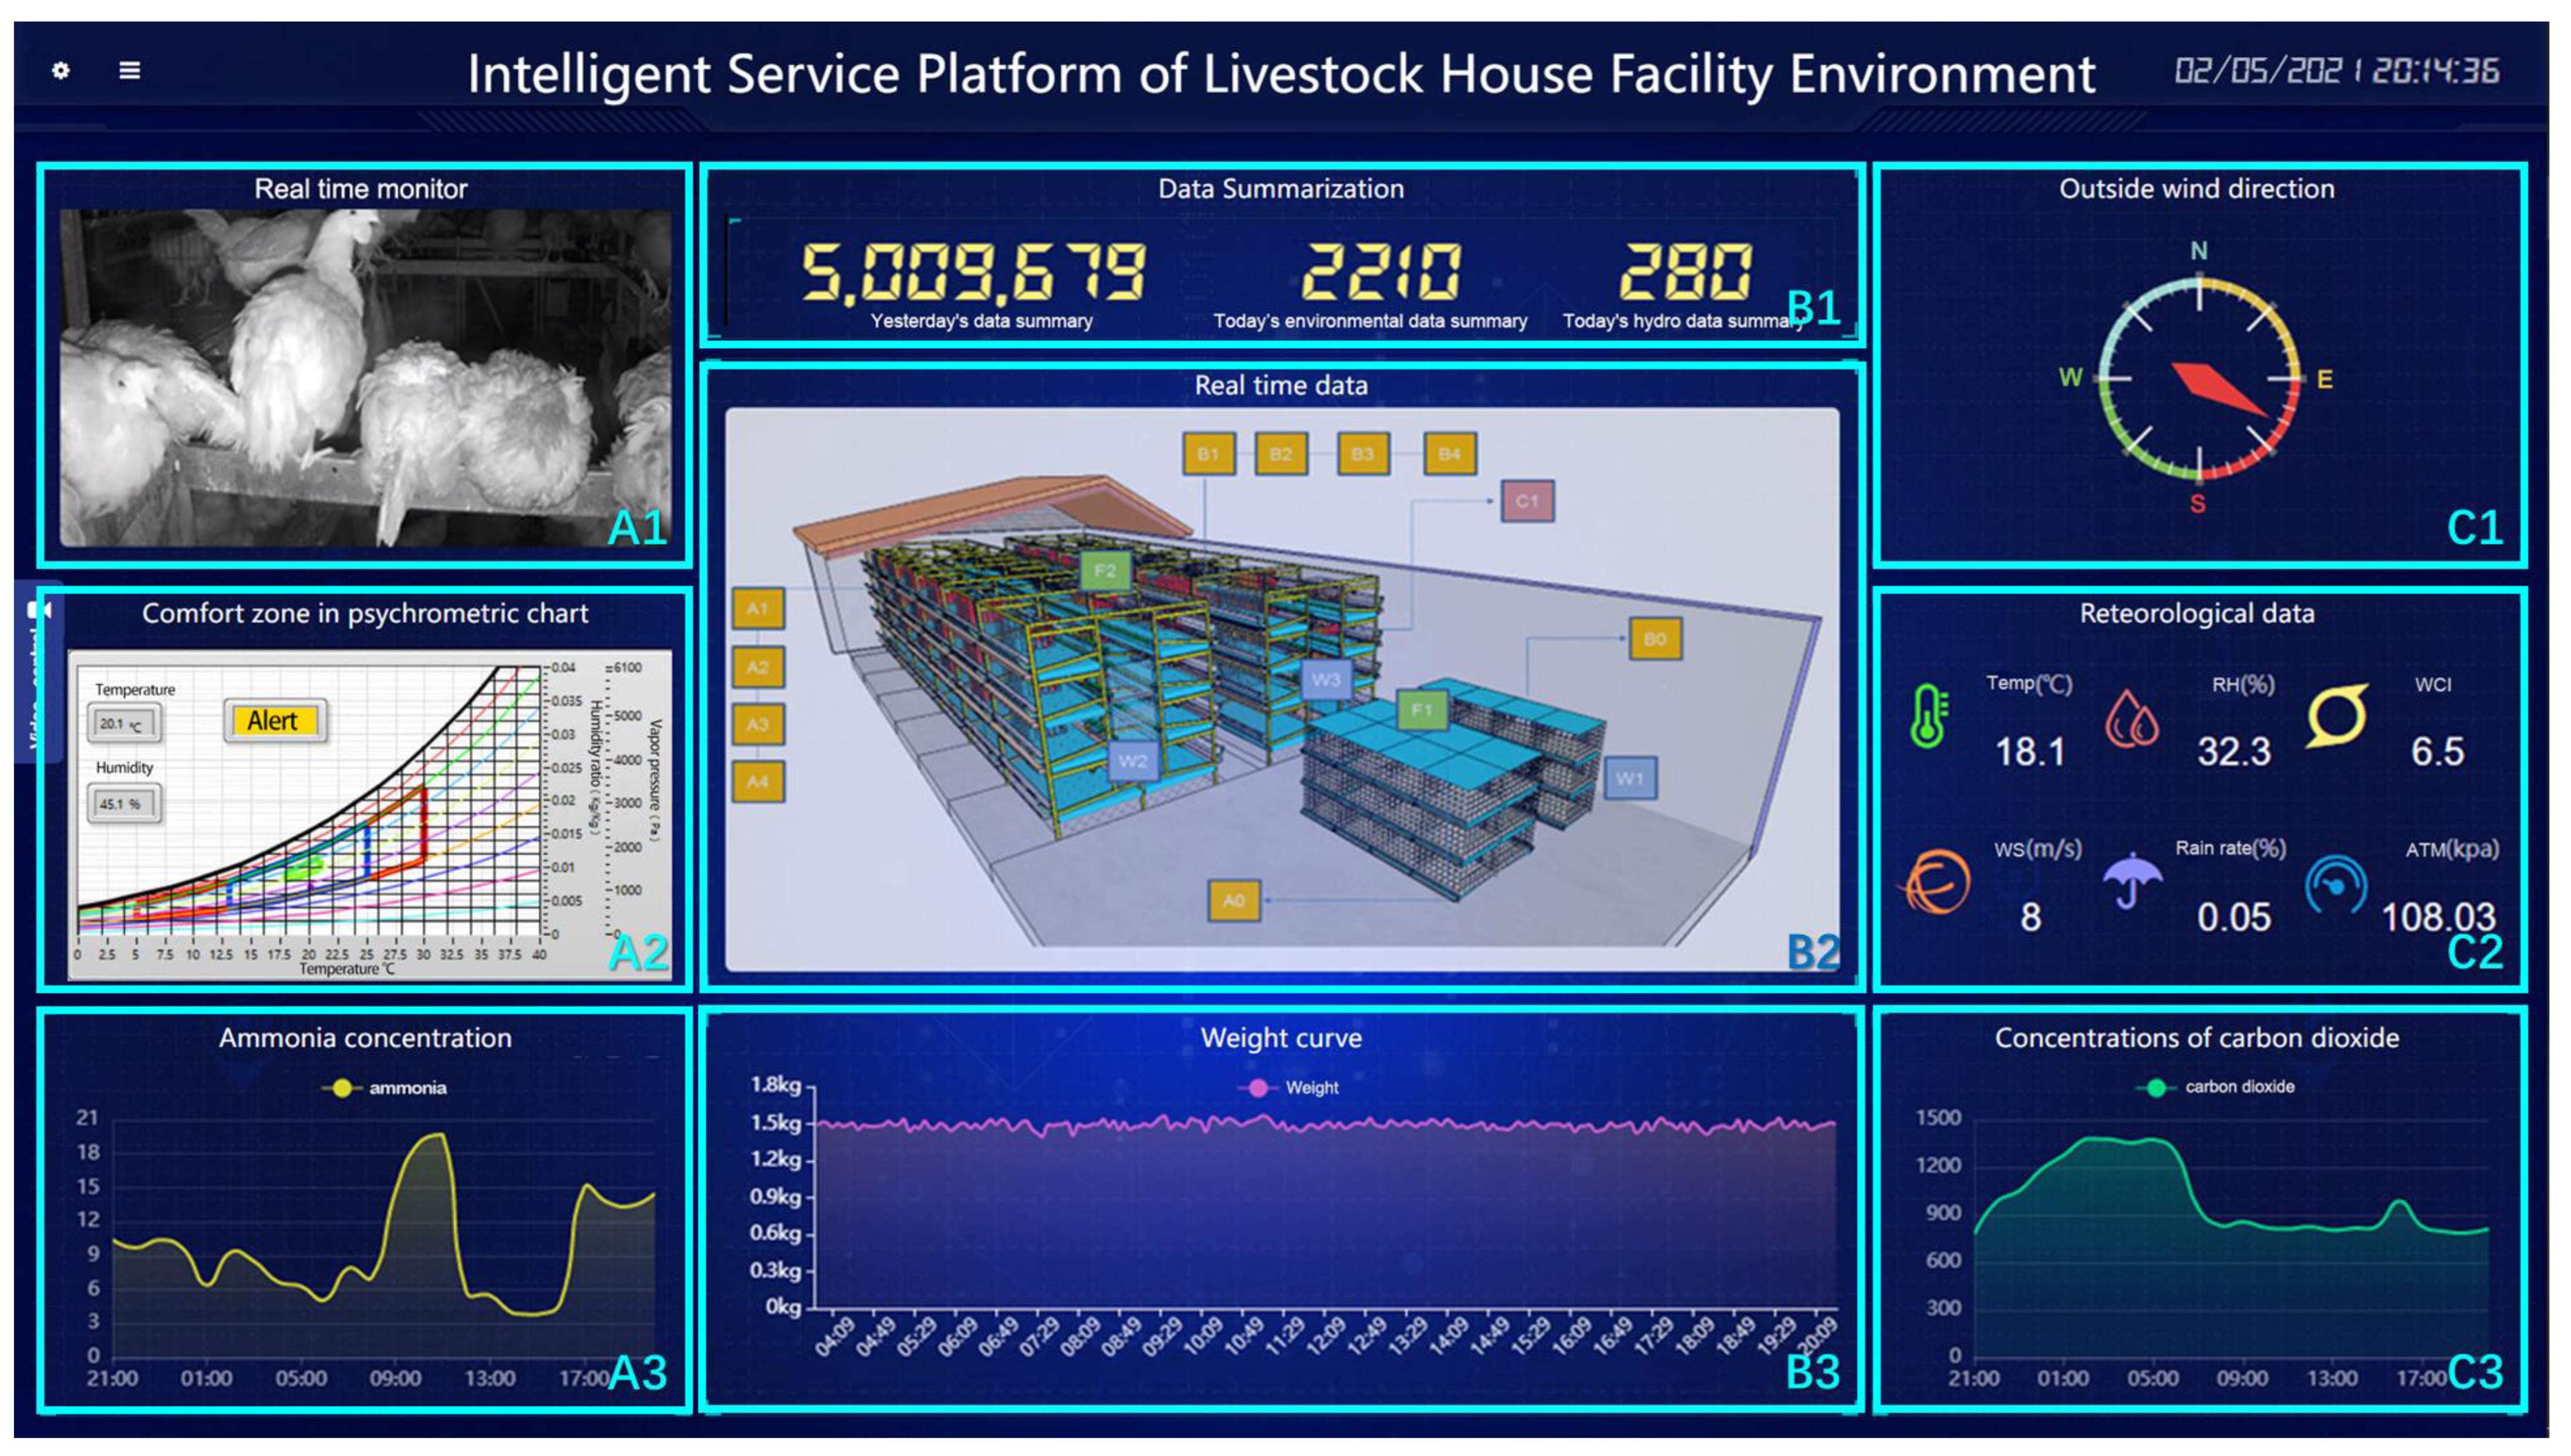
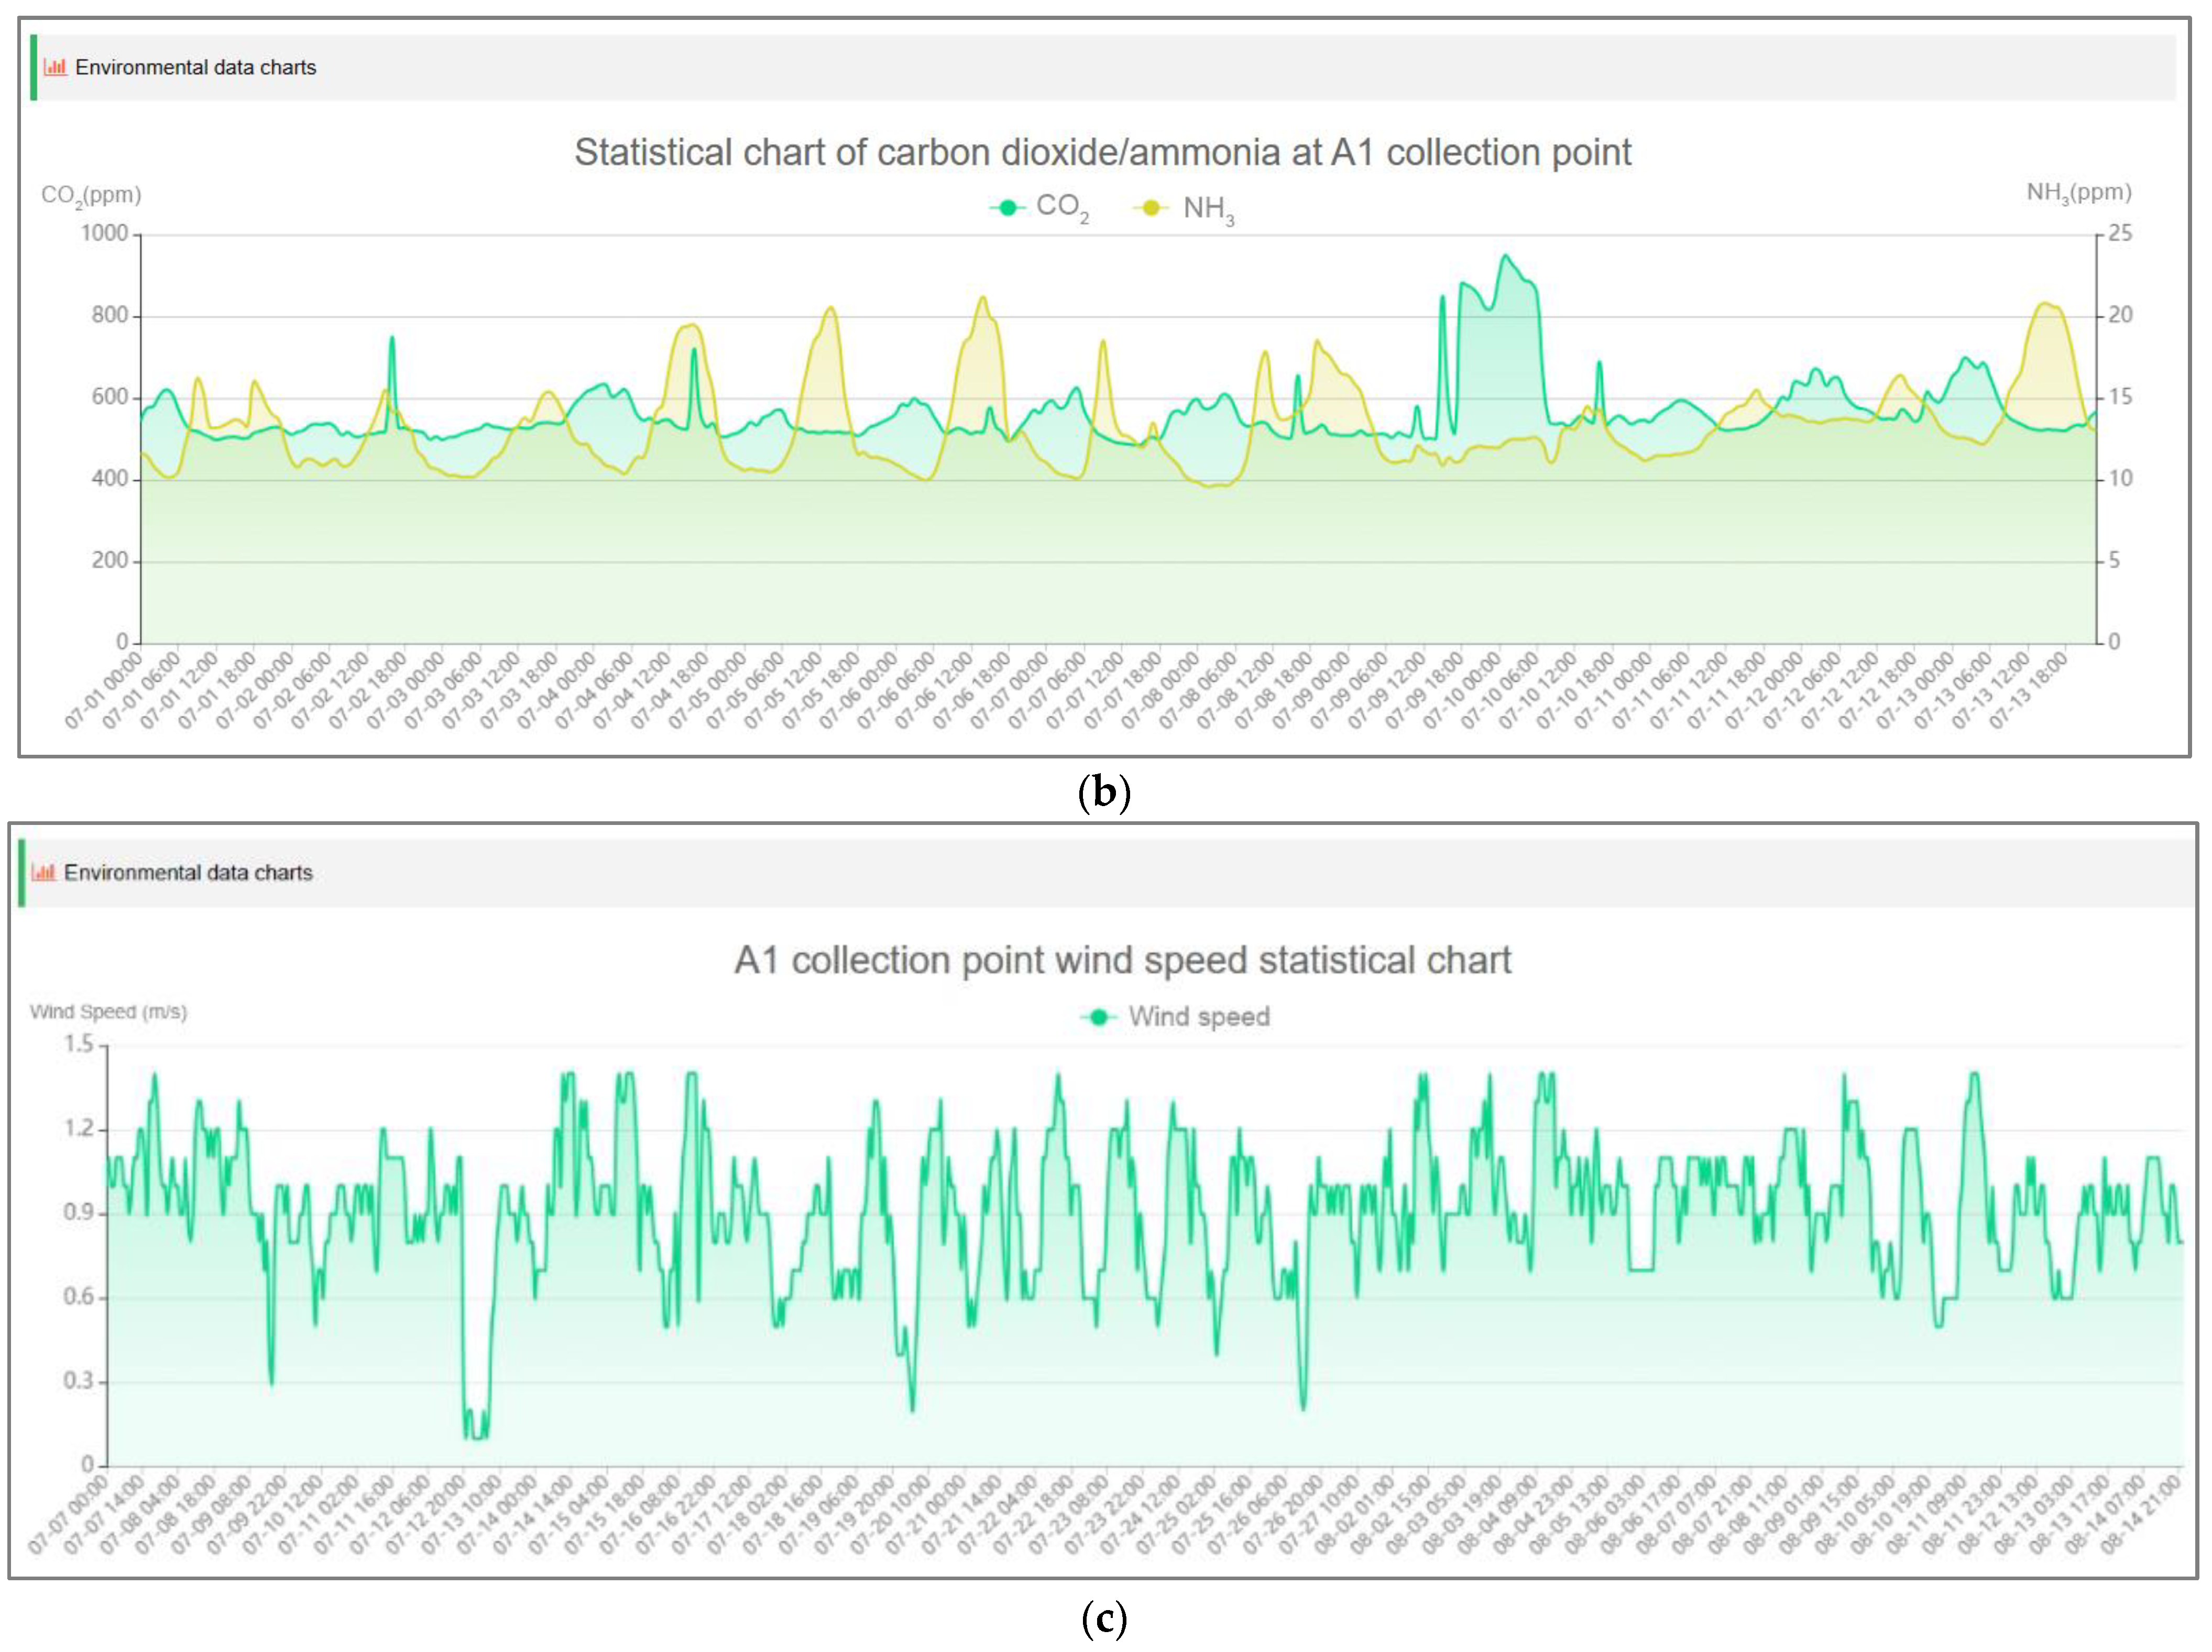
4.1. Data Display Interface on Web Page

The real-time web display interface of the system is shown in Figure 8. Users can access the system through a PC terminal or mobile terminal and view the internal situation of the chicken house in real-time on the web page. The interface mainly displays the ecological data, physiological data, and production process data. At a set time each day, the system sends an email to the administrator, reminding them of the data volume obtained from each section. This assists managers in confirming the system’s operation and making necessary adjustments.
Field data are uploaded to the cloud for easy access via an IP address. Cloud-based solutions for data management have been referenced in a specific research paper [21]. Accessible through any internet-connected browser, this system ensures data security with a login portal. The main interface displays both indoor and outdoor environmental data, aiding managers in obtaining comprehensive facility information. Real-time production updates enable thorough analysis alongside environmental data. The system assesses environmental data using enthalpy charts to establish animal comfort zones and issue real-time alerts. Historical data can be retrieved for the previous day, week, or month. Custom two-dimensional diagrams of the poultry house allow the interactive tracing of environmental data. Diverse data types are integrated into a large-screen display, with future expansion options for additional interfaces and toggle buttons. Users can customize the system interface layout and functions to suit their preferences.
The voice recognition system integrates chicken abnormal sound recognition and sound source localization algorithms [30] and embeds a sound display module. A voice recognition system interface is presented in Figure 9. It shows the current area of abnormal sound, historical audio playback interface, real-time sound recognition results, and a summary, allowing users to switch between viewing one day or seven days of data statistics and supporting data export.

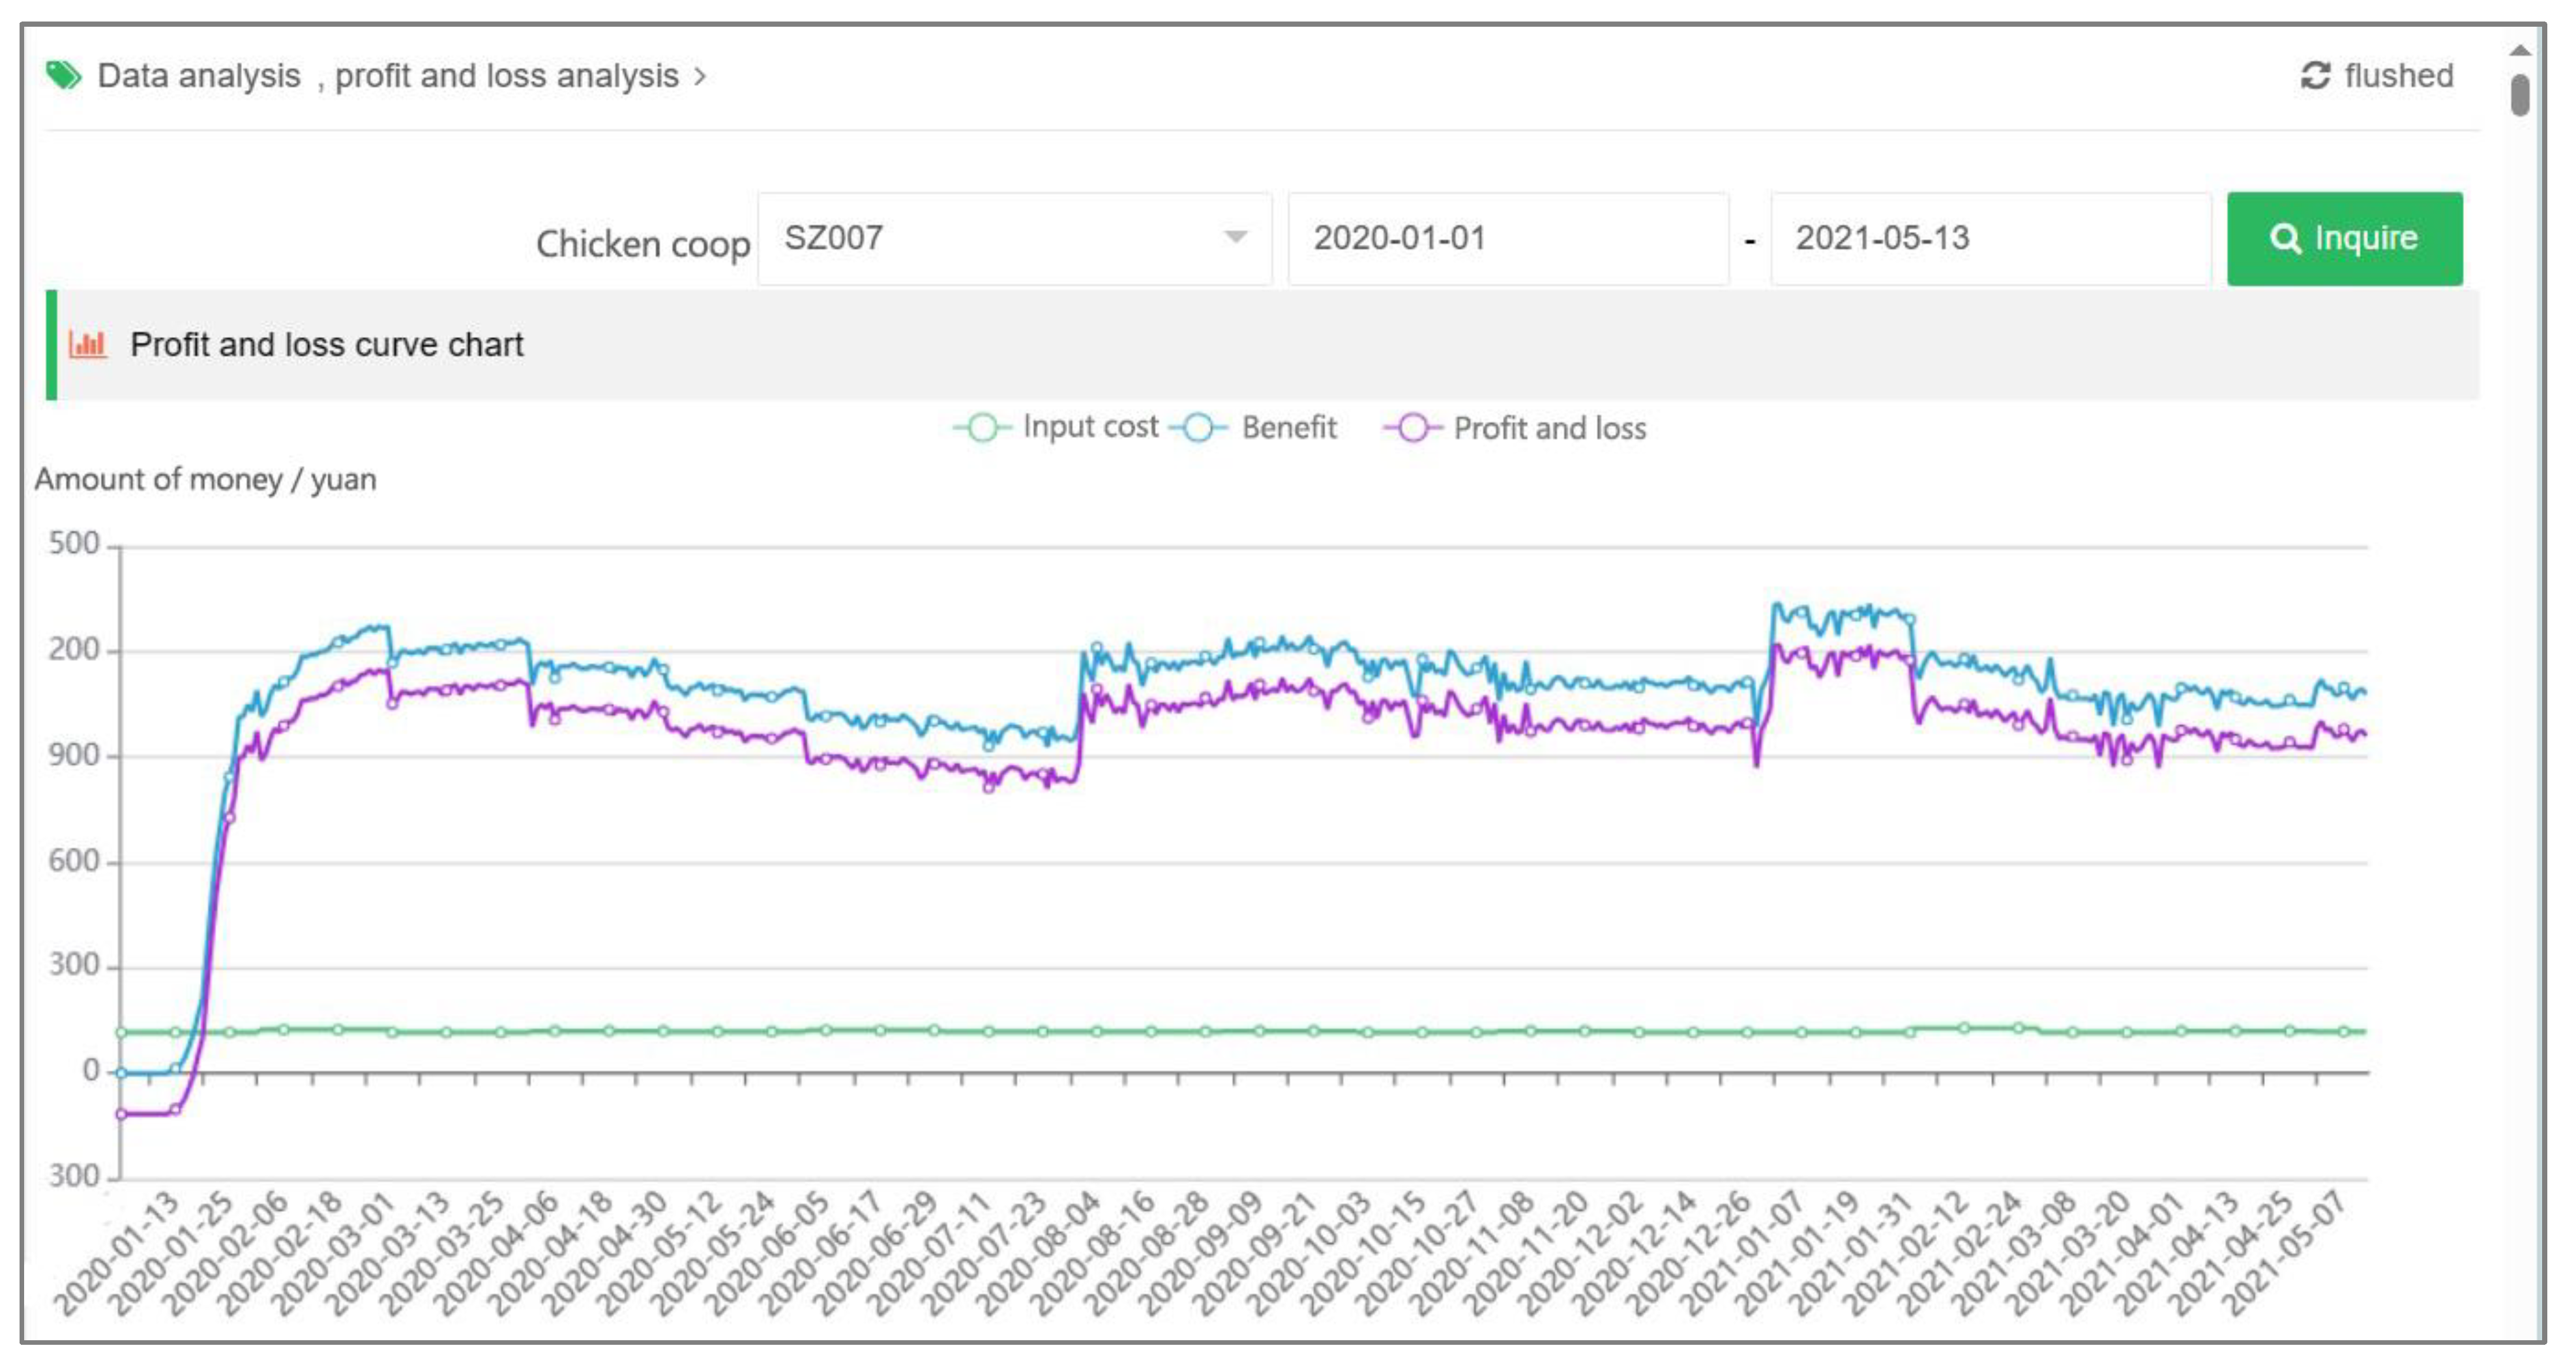
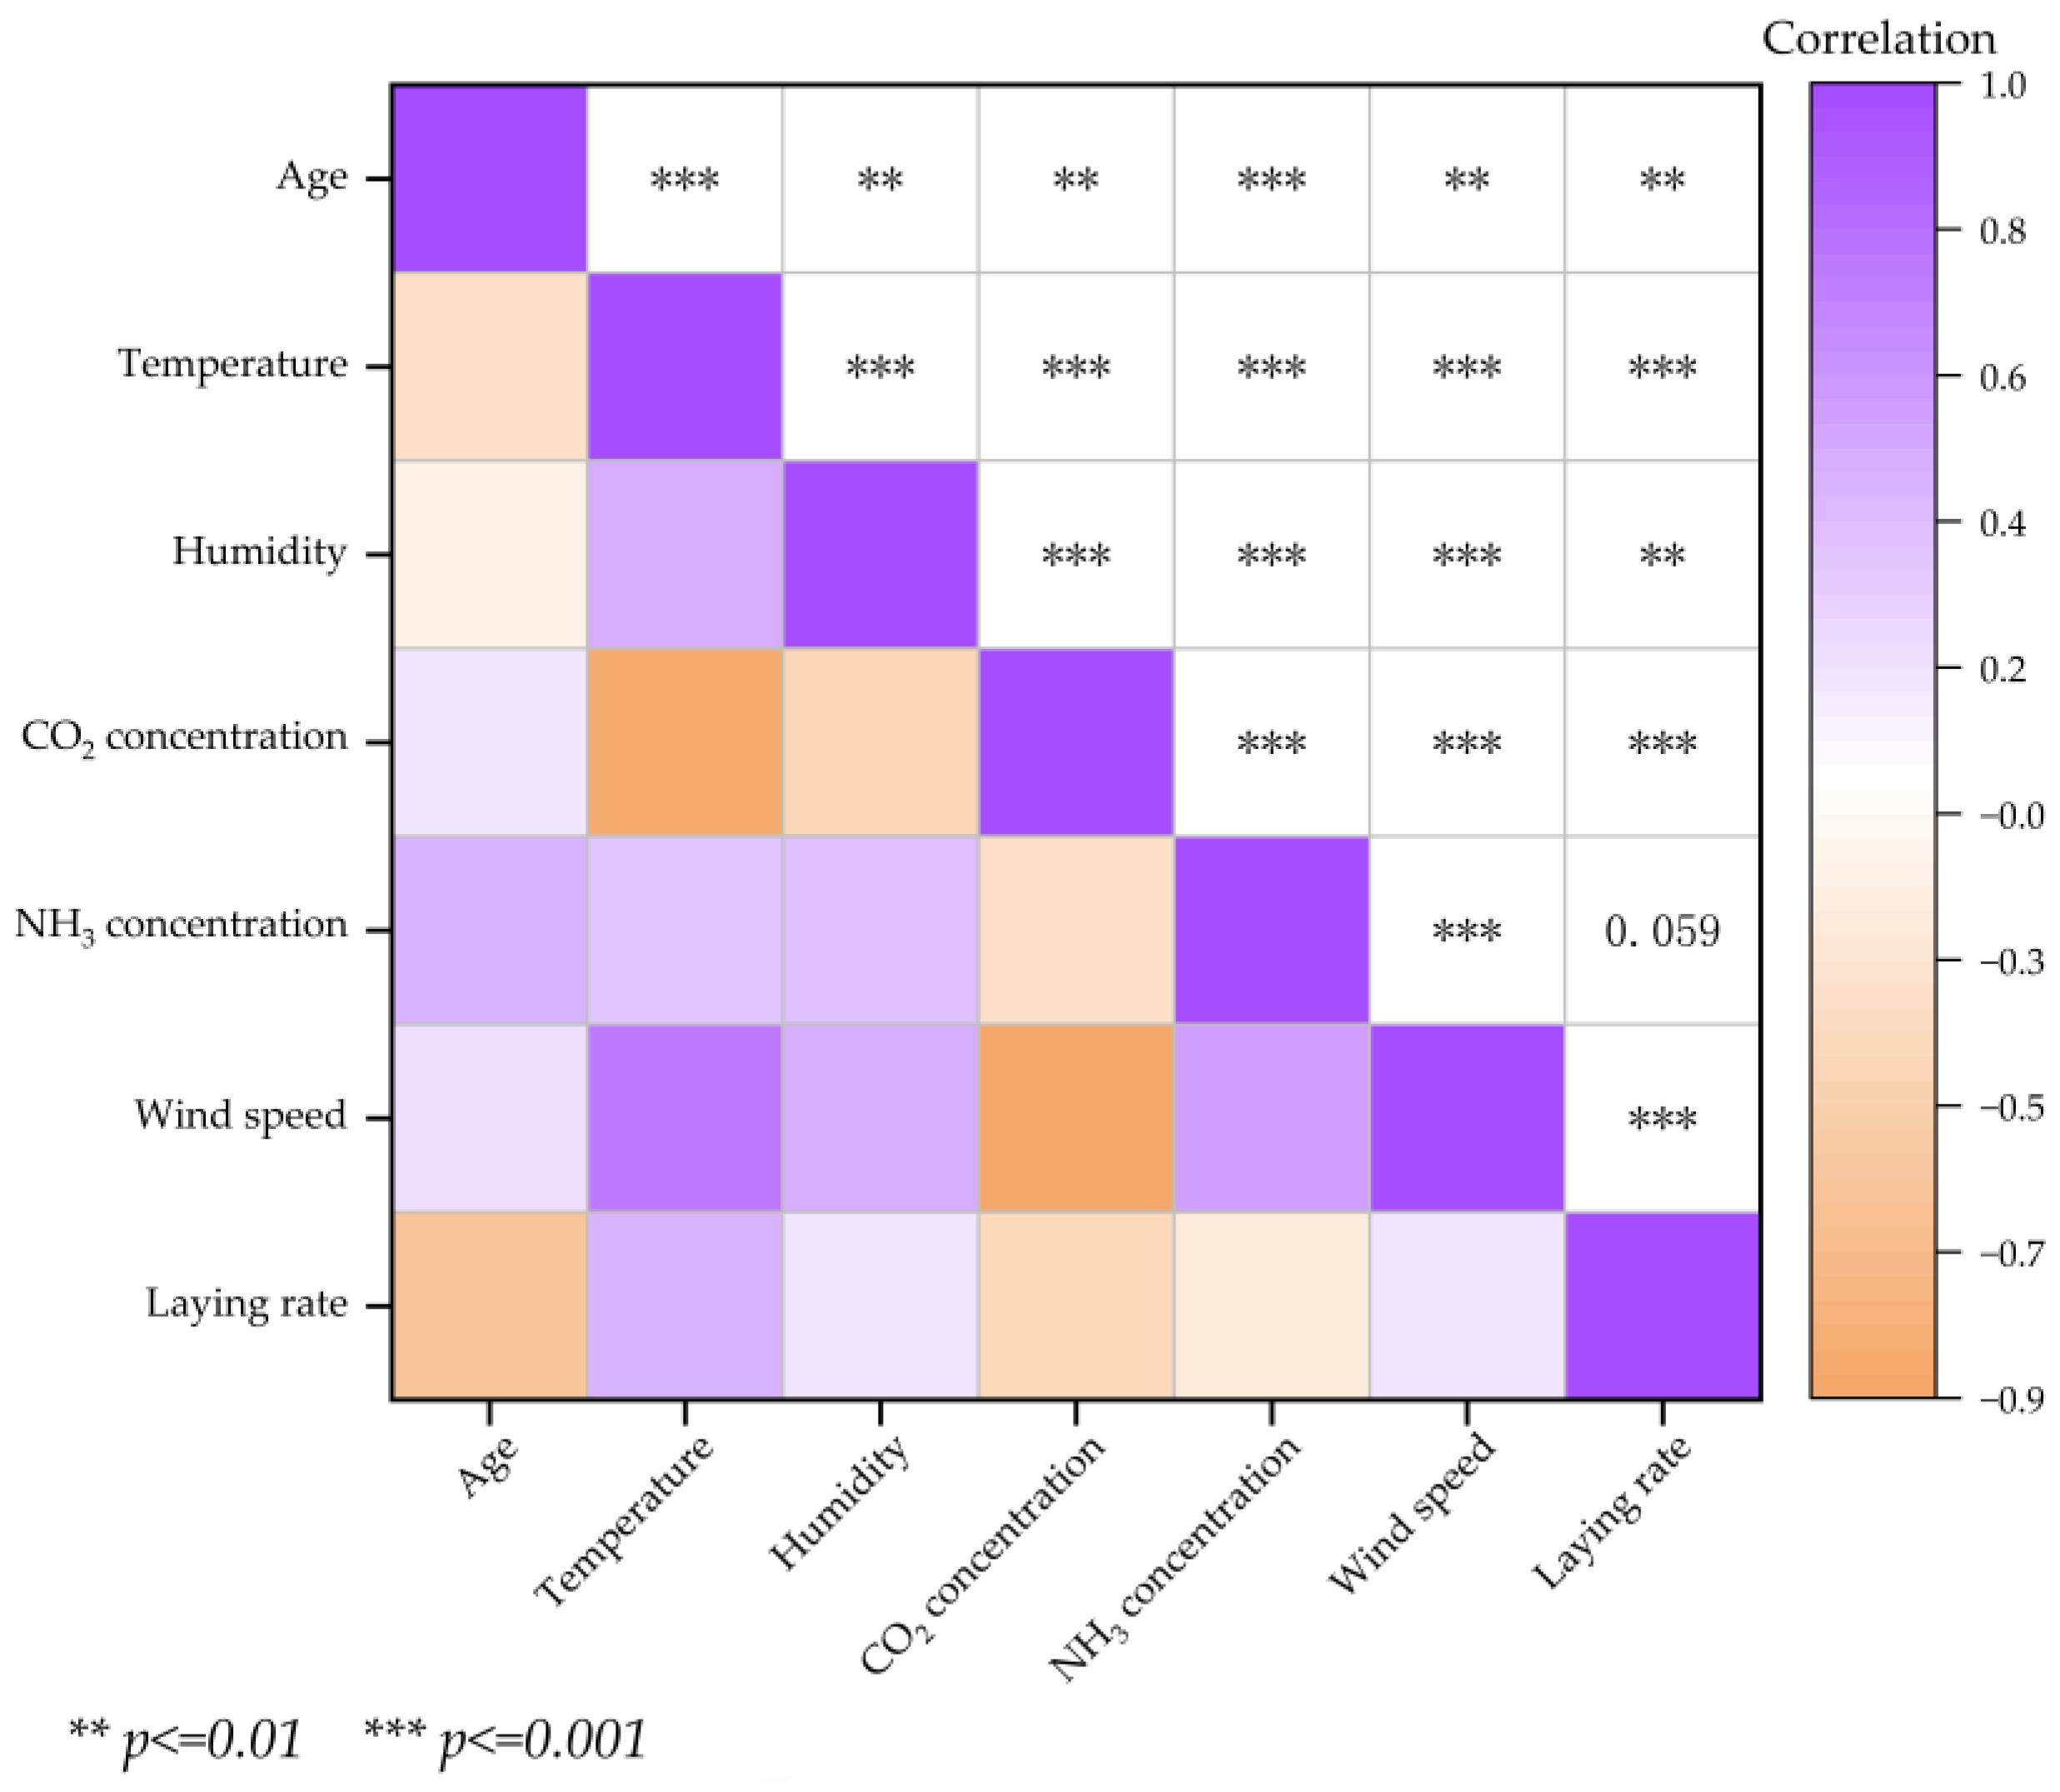
4.2. Comprehensive Analysis of Historical Data

In the data analysis module of our system, Figure 10 shows the historical data query and display function for production data. The cumulative mortality rate (CMR) measures the total number of deaths over a period relative to the initial population of chickens. The equation for CMR is as follows:
CMR = D/N × 100%,
where D is the cumulative number of deaths and N is the number of chickens initially transferred to the house.
The egg production rate (EPR) measures the productivity of the chickens in terms of eggs laid per chicken on any given day. The equation for EPR is as follows:
EPR = E/C,
where E is the number of eggs laid on the current day, and C is the total number of chickens.
As the age of the chickens increases, the CMR shows a generally uniform upward trend, reflecting that the daily mortality rate varies relatively little, and the overall number of chickens culled during the entire breeding period remains within an acceptable range. However, it should be noted that from 7 July 2020 to 15 August 2020, the mortality rate slightly increased, possibly due to the chickens experiencing heat stress during the summer, which affected the mortality rate. After August 15, the mortality rate began to decline.
As the chickens aged, CMR generally rose uniformly, indicating stable mortality levels throughout the breeding period. However, a slight increase in mortality occurred from 7 July 2020 to 15 August 2020, likely due to heat stress during summer. Subsequently, the mortality rate decreased. Overall, the trend in EPR is consistent with the production manual, although the onset of production was slightly delayed compared to the manual, which may be influenced by the temperature of autumn and winter. There were some fluctuations in EPR during the high-temperature phase (7 July 2020 to 15 August 2020), seasonal transition phase (6 October 2020 to 14 November 2020), and late egg production phase (24 March 2021 to 15 May 2021), but overall, the egg production rate remained above 80%.
Figure 11 shows the variation in environmental data collected at point A1 inside the chicken coop from 7 July 2020 to 15 August 2020. In Figure 11a, temperatures peaked around noon and, in the afternoon, ranged from 18.5 °C to 32.1 °C, with relative humidity fluctuating between 48.4% and 98.9%. Higher temperatures corresponded to lower humidity, aligning with the inverse humidity–temperature relationship. Over 40% of the time, temperatures exceeded 25 °C, mainly during midday and the afternoon, dropping during the night and morning. The wet curtain cooling system raised indoor humidity due to high temperatures, maintaining humidity above 60% and peaking over 90% for half the time. In Figure 11b, it is shown that carbon dioxide levels remained below 800 ppm for 94% of the time, spiking above after approximately 6 days. Figure 11c shows airflow mostly between 0.5 m·s−1 and 1.2 m·s−1, rarely exceeding 1.5 m·s−1. In summer, fans operated continuously to maintain a comfortable environment for laying hens despite the high outdoor temperatures.
Figure 12 shows the profit and loss (P and L) curve of the experimental poultry house from 1 January 2020 to 15 May 2021. The P and L curve for laying hen’s production illustrates the farm’s operational and hen productivity status. Henhouse costs involve fixed (e.g., depreciation, construction, equipment, labor) and variable (feed, water, electricity, chicks, disinfection, and immunization) costs. Revenue sources include egg sales, cull chicken proceeds, and chicken manure income. P and L are computed by deducting the total costs from total income. The equation for calculating P and L is as follows:
P and L = egg income + cull chicken income+ chicken manure income −
fixed costs + variable costs,
where egg income is the revenue generated from selling eggs; cull chicken income is the money received from selling non-productive or dead chickens; chicken manure income is the income earned from selling chicken manure as fertilizer; fixed costs include building depreciation, construction costs, equipment investment, and labor wages; and variable costs include feed prices, water and electricity consumption, chick purchases, and disinfection and immunization expenses.
By systematically collecting production data, real-time analysis was conducted on expenses like water, electricity, and feed in large-scale poultry houses alongside income sources, such as eggs and culling. A calculation model was developed to generate a profit and loss curve, offering a daily production status chart for the chicken house. This aids farm management in understanding production efficiency. The use of data from production data management (introduced in Section 3.2), daily input costs, benefits, and P and L were calculated.
Figure 12 shows the P and F of the poultry house from 1 January 2020 to 15 May 2021. Before 15 January 2020, when the hens started laying eggs, farms incurred fixed personnel costs, consumables, and expenses for water, electricity, and feed, resulting in a negative overall profit and loss. As egg sales began, income gradually surpassed costs, leading to a positive P and L value that increased with higher egg production. However, as hens’ age and egg production decline, the daily P and L values decrease.
In Figure 13, a Pearson correlation analysis was conducted to examine the relationship between the egg production rate and factors such as the hens’ age in days, environmental temperature, humidity, carbon dioxide and ammonia concentrations, and wind speed. The results indicated a strong positive correlation (p ≤ 0.001) between the egg production rate and temperature as well as wind speed, an exceptionally significant positive correlation (p ≤ 0.01) with relative humidity, a marked negative correlation (p ≤ 0.001) with carbon dioxide concentration, and a significant negative correlation (p ≤ 0.05) with the age of the hens. There was no significant correlation between egg production and ammonia concentration. Wind speed demonstrated a strong positive correlation (p ≤ 0.001) with ammonia concentration, air humidity, temperature, and age while showing a significant negative (p ≤ 0.001) correlation with carbon dioxide concentration. Additionally, it displayed an exceptionally strong positive correlation (p ≤ 0.01) with age. Ammonia concentration exhibited strong positive associations (p ≤ 0.001) with age, temperature, and humidity and a significant negative correlation (p ≤ 0.001) with carbon dioxide concentration. Carbon dioxide concentration was found to have a significant positive correlation (p ≤ 0.01) with age and a notable negative correlation (p ≤ 0.001) with temperature and humidity. Relative humidity displayed a substantial negative correlation (p ≤ 0.01) with age and a significant positive correlation (p ≤ 0.001) with temperature. Lastly, temperature exhibited a significant negative correlation (p ≤ 0.001) with age.

4.3. Data Collection Volume and Validity

Raw data collected from November 2019 to June 2021 underwent cleaning using a box plot method to obtain processed data. The estimated data quantity was determined by multiplying the collection frequency by the acquisition period. The box plot method involves calculating the quartiles of the data and removing values that fall either above 1.5 times the interquartile range (IQR), above the upper quartile (Q3), or below 1.5 times the IQR below the lower quartile (Q1). The quantity of raw data, processed data, and estimated data were calculated, and then the data efficiency and data validity were computed; the results are shown in Table 4.
The integrity of the environmental data (temperature, humidity, wind speed, carbon dioxide concentration, and ammonia concentration) exceeds 94.5%, surpassing the 85% threshold, rendering them suitable for subsequent analysis. The data validity of each factor exceeds 94%, among which the validity of temperature, humidity, and carbon dioxide concentration exceeds 99%. The overall accuracy of the dataset remains relatively high, providing a robust data foundation for further research.

4.4. Discussion

In this study, an intelligent service platform for egg-laying chicken houses based on the PaaS architecture was developed using a cloud platform. This platform collected physiological, ecological, and production environment data from animals during the breeding process and conducted comprehensive data analysis. The use of cloud services reduced the development of complexity and maintenance costs, providing a user interface based on web pages [34]. Leveraging the scalability and flexibility of cloud services, the platform enabled the upload of multi-terminal data, including automatic environmental data collection with production via data entry. A real-time on-site data display was achieved by accessing cloud databases, enabling remote data access and historical data retrieval. In the actual system setup, wireless sensor nodes (WSNs) [14] were not employed for environmental data collection despite being employed in many research studies [35,36,37]. This decision was influenced by the lengthy duration of egg-laying chicken breeding; in this case, the rearing period exceeded 500 days, potentially necessitating battery replacements for wireless sensors. Additionally, concerns were raised about the shielding effect of the cage equipment in the chicken house, which could impact sensor data transmission. However, no relevant experiments were conducted in this study. Nevertheless, the cloud-based intelligent management system exhibited good scalability, retaining interfaces for the transmission of third-party data. The system also currently receives data uploaded by a portable particulate monitoring unit (PPMU) [33] system and can potentially integrate data from wireless collection systems in the future.
On the system display interface, real-time environmental data from different locations are integrated for visualization. Users can interact with the interface to select specific points and view both real-time and historical data. By utilizing psychrometric charts, the system visualizes the livable range for animals, providing a clear depiction of the current living conditions of the breeding animals. This functionality offers environmental management recommendations to the operators based on the displayed information. A voice recognition system uses non-intrusive, continuous, and real-time sound analysis technology to assist farmers in monitoring abnormal vocations of nocturnal animals. IoT systems excel at data visualization, enabling the analysis of real-time and historical data. They facilitate the real-time monitoring of livestock health status, environmental parameters, and production data, allowing for the timely identification of potential issues and the implementation of preventive measures. In the future, the integration of Digital Twins technology [38] can further enhance these capabilities and virtually display on-site data, making information more intuitive and comprehensible. The combination of IoT systems and Digital Twin technology can empower managers to continuously optimize livestock farming conditions and production processes.
In the operational processes of the IoT system utilized in this research, the unique environmental conditions within the henhouse, characterized by elevated dust concentrations [39] and high humidity levels (showed in Figure 11a), necessitated the deployment of sensors with a robust combination of waterproofing, dust resistance, and high sealing capabilities to effectively address these challenges. Alternatively, sensors demonstrating insensitivity to dust and humidity may serve as viable alternatives in such specialized settings. Despite efforts made in this study to replace the affected carbon dioxide sensors, this substitution still introduced a certain level of impact on the overall integrity of the system’s data. Furthermore, it is recommended to integrate a data anomaly detection module into the system’s architecture. This module can play a crucial role in promptly alerting administrators to investigate any deviations from the norm, ensuring timely intervention in cases of abnormal conditions, and thereby safeguarding the effectiveness and completeness of the data. This proactive approach aligns with best practices in ensuring the reliability of data in IoT systems within specialized environments.
The data analysis module of the platform can conduct separate analyses on environmental, acoustic, and productivity performance. Additionally, it is capable of comprehensively analyzing the physiological and ecological production process data collected through the production system, allowing for an understanding of the relationship between animal growth and intra-house environmental parameters, as well as revealing the degree and pattern of an environmental parameter’s impact on production data. In this case study, Pearson correlation analysis was applied to demonstrate the correlations between environmental parameters and production performance. Temperature, humidity, and wind speed all had a positive impact on egg production rate. This indicates that under suitable temperature, humidity, and ventilation conditions, the egg production rate of hens can increase. The carbon dioxide concentration is significantly negatively correlated with the egg production rate, suggesting that high levels of carbon dioxide may adversely affect the egg production rate of hens. In summer, ventilation time is generally longer, and carbon dioxide is not usually the primary basis for ventilation. In the “Environmental Quality Standards for the Livestock and Poultry Farm” (NY/T388-1999) statement, the upper limit of carbon dioxide concentration in chicken houses is set at 1500 mg·m−3 (approximately 765 mg·kg−1). Some studies have suggested that the parameter control standard for carbon dioxide concentration in conveyor belts that clean manure chicken houses could be set at 5000 mg·m−3 [40]. Further research is needed to determine the threshold at which carbon dioxide affects laying hens. Ammonia concentrations do not show a significant correlation with the egg production rate. When the concentration of ammonia changes, it has little effect on the egg production rate of hens. Age is significantly and negatively correlated with the egg production rate, and as the age of laying hens increases, the egg production rate shows a trend of initially rising and then falling, which is consistent with production manuals. Wind speed is significantly and positively correlated with ammonia concentration, air humidity, and temperature. As the temperature rises, the ventilation fans are controlled to open, and with a moderate increase in temperature, the cooling capacity inside the house decreases. Therefore, it is necessary to increase wind speed to improve the ventilation rate and maintain the indoor environment within a comfortable range. In livestock management, it is necessary to comprehensively consider various factors in the environment of livestock and poultry houses to improve breeding efficiency.
From Table 4, it can be observed that the data integrity during the entire breeding process (over 500 days) was relatively high. Despite brief power outages and network disconnections during the feeding process, the power-off restart function utilized by the data collection program ensured that data could be collected once power was restored, maximizing the integrity of local data. The breakpoint for resuming the function of local data uploads allows for data continuation after network recovery, ensuring consistency between cloud and local data, as well as data integrity. Among the five environmental data collected during the process, temperature, humidity, wind speed, and ammonia concentration show relatively high data integrity, with stable collection and transmission. However, the integrity of carbon dioxide data is relatively low. This is mainly attributed to damage to the carbon dioxide sensors due to high humidity inside the poultry house despite timely replacement by on-site personnel. Although efforts were made to address this issue, it still had some impact on the integrity of certain data. The integrity of other data may be influenced by errors in on-site data collection procedures or issues with on-site hardware equipment. In the analysis of data validity, temperature, humidity, and carbon dioxide concentrations showed higher validity, indicating fewer errors in these three sets of data. On the other hand, wind speed and ammonia concentrations exhibit more errors, possibly due to the relatively small actual numerical values of these two datasets. The measurement process generates relatively large relative errors, and minor fluctuations in the indoor environment of the shed have a significant impact, resulting in some errors that affect the validity of the data.
Additionally, predictive models can be applied to analyze environmental and production data [41], offering valuable insights to management personnel. These models leverage advanced statistical techniques, such as machine learning algorithms, to uncover patterns, trends, and relationships within the data. By utilizing predictive modeling, management can make informed decisions, optimize processes, and enhance overall operational efficiency based on the actionable intelligence derived from the analysis of environmental and production data.

5. Conclusions

The developed IoT-based platform comprises four layers: information perception, networking, management services, and applications. Utilizing LabVIEW + MySQL, it collects data efficiently in poultry farming. With a distributed network design, the system achieves real-time data acquisition, analysis, and visualization. Key features include environmental monitoring and analysis, audio analysis, and production data management. After 500 days of testing in a poultry house, data integrity reached over 87%, and validity exceeded 94% for all metrics, with temperature, humidity, and CO2 levels showing validity over 99%. The system maintains accuracy despite network disruptions or power failures. Alert modules and data statistics effectively monitor system status, facilitating rapid recovery through program restarts. Demonstrated functionalities, like sound recognition, psychrometric chart alerts, and profit-loss analysis, offer integrated PLF model solutions and comprehensive data insights. Future enhancements can include smart sensor integration, blockchain for enhanced security, Digital Twin tech for visualization, and AI for advanced warning systems, optimizing production and decision-making processes.

Author Contributions

Conceptualization, M.L. and G.T.; Data curation, M.L., X.D. and Y.Z.; Formal analysis, M.L.; Funding acquisition, G.T.; Investigation, Z.Z. and Y.Z.; Methodology, M.L. and H.C.; Project administration, G.T.; Resources, M.L.; Software, M.L., H.C. and X.D.; Supervision, H.C. and G.T.; Validation, M.L., Z.Z. and Y.Z.; Visualization, M.L.; Writing—original draft, M.L.; Writing—review and editing, X.D., H.J. and G.T. All authors have read and agreed to the published version of the manuscript.

Funding

This research was funded by National Key R&D Program of China, grant number 2023YFD2000805.

Institutional Review Board Statement

Not applicable.

Data Availability Statement

Restrictions apply to the datasets. The datasets presented in this article are not readily available because the data are part of an ongoing study, and the research project has not yet been concluded.

Acknowledgments

This work is supported by the Key Laboratory of Agricultural Engineering in Structure and Environment, which provided research farms, hardware, and technical assistance. Special thanks go to Mingyue Zhang for technical support.

Conflicts of Interest

Author Xiaodong Du was employed by the company CRRC Industrial Institute (Qingdao) Co., Ltd. The remaining authors declare that the research was conducted in the absence of any commercial or financial relationships that could be construed as a potential conflict of interest.

Abbreviations

Symbols and Expressions
CMRcumulative mortality rate
DAQdata acquisition
EPRegg production rate
IaaS Infrastructure as a Service
IoTInternet of things
IQRinterquartile range
LabVIEWLaboratory Virtual Instrument Engineering Workbench
LANlocal area network
LoRaLong Range Radio
MQTTMessage Queuing Telemetry Transport
PaaSPlatform as a Service
PPMUportable particulate monitoring unit
PLFprecision livestock farming
P and Lprofit and loss
RFIDRadio Frequency Identification
ResNetresidual network
SaaSSoftware as a Service
Q1the lower quartile
Q3the upper quartile
WSNswireless sensor nodes

References

  1. Alaa, M.; Zaidan, A.A.; Zaidan, B.B.; Talal, M.; Kiah, M.L.M. A review of smart home applications based on Internet of Things. J. Netw. Comput. Appl. 2017, 97, 48–65. [Google Scholar] [CrossRef]
  2. Chavhan, S.; Gupta, D.; Chandana, B.N.; Khanna, A.; Rodrigues, J.J.P.C. IoT-Based Context-Aware Intelligent Public Transport System in a Metropolitan Area. IEEE Internet Things J. 2020, 7, 6023–6034. [Google Scholar] [CrossRef]
  3. Anand, D.; Singh, A.; Alsubhi, K.; Goyal, N.; Abdrabou, A.; Vidyarthi, A.; Rodrigues, J.J.P.C. A Smart Cloud and IoVT-Based Kernel Adaptive Filtering Framework for Parking Prediction. IEEE T Intell. Transp. 2023, 24, 2737–2745. [Google Scholar] [CrossRef]
  4. Khullar, V.; Singh, H.P.; Miro, Y.; Anand, D.; Mohamed, H.G.; Gupta, D.; Kumar, N.; Goyal, N. IoT Fog-Enabled Multi-Node Centralized Ecosystem for Real Time Screening and Monitoring of Health Information. Appl. Sci. 2022, 12, 9845. [Google Scholar] [CrossRef]
  5. Schmidt, T.B.; Lancaster, J.M.; Psota, E.; Mote, B.E.; Hulbert, L.E.; Holliday, A.; Woiwode, R.; Perez, L.C. Evaluation of a novel computer vision-based livestock monitoring system to identify and track specific behaviors of individual nursery pigs within a group-housed environment. Transl. Anim. Sci. 2022, 6, txac82. [Google Scholar] [CrossRef] [PubMed]
  6. Song, Y.; Bi, J.; Wang, X. Design and implementation of intelligent monitoring system for agricultural environment in IoT. Internet Things-Neth. 2024, 25, 101029. [Google Scholar] [CrossRef]
  7. Rastegari, H.; Nadi, F.; Lam, S.S.; Ikhwanuddin, M.; Kasan, N.A.; Rahmat, R.F.; Mahari, W.A.W. Internet of Things in aquaculture: A review of the challenges and potential solutions based on current and future trends. Smart Agric. Technol. 2023, 4, 100187. [Google Scholar] [CrossRef]
  8. Kodali, R.K.; Rajanarayanan, S.C.; Boppana, L. IoT Based Weather Monitoring and Notification System for Greenhouses; IEEE: Chennai, India, 2019; pp. 342–345. [Google Scholar]
  9. Astill, J.; Dara, R.A.; Fraser, E.D.G.; Roberts, B.; Sharif, S. Smart poultry management: Smart sensors, big data, and the internet of things. Comput. Electron. Agr. 2020, 170, 105291. [Google Scholar] [CrossRef]
  10. Du, X.D.; Carpentier, L.; Teng, G.H.; Liu, M.L.; Wang, C.Y.; Norton, T. Assessment of Laying Hens’ Thermal Comfort Using Sound Technology. Sensors 2020, 20, 473. [Google Scholar] [CrossRef]
  11. Peña Fernández, A.; Norton, T.; Tullo, E.; van Hertem, T.; Youssef, A.; Exadaktylos, V.; Vranken, E.; Guarino, M.; Berckmans, D. Real-time monitoring of broiler flock’s welfare status using camera-based technology. Biosyst. Eng. 2018, 173, 103–114. [Google Scholar] [CrossRef]
  12. Zhao, Y.; Xin, H.; Dong, B. Use of infrared thermography to assess laying-hen feather coverage. Poultry Sci. 2013, 92, 295–302. [Google Scholar] [CrossRef]
  13. Okada, H.; Suzuki, K.; Kenji, T.; Itoh, T. Applicability of Wireless Activity Sensor Network to Avian Influenza Monitoring System in Poultry Farms. J. Sens. Technol. 2014, 04, 18–23. [Google Scholar] [CrossRef]
  14. Arshad, J.; Rehman, A.U.; Othman, M.T.B.; Ahmad, M.; Tariq, H.B.; Khalid, M.A.; Moosa, M.A.R.; Shafiq, M.; Hamam, H. Deployment of Wireless Sensor Network and IoT Platform to Implement an Intelligent Animal Monitoring System. Sustainability 2022, 14, 6249. [Google Scholar] [CrossRef]
  15. Li, H.; Wang, H.; Yin, W.; Li, Y.; Qian, Y.; Hu, F. Development of a remote monitoring system for Henhouse environment based on IoT technology. Future Internet 2015, 7, 329–341. [Google Scholar] [CrossRef]
  16. Todero, E.L.; de Santana Weizenmann, G. Remote Monitoring System for Aviaries. In Proceedings of the 14th IEEE International Conference on Industry Applications(INDUSCON), Sao Paulo, Brazil, 15–18 December 2021; pp. 308–315. [Google Scholar]
  17. Yu, L.; Teng, G.; Li, B.; Zhang, Y.; Lao, F.; Xing, Y. A Remote-Monitoring System for Poultry Production Management using a 3G-Based Network. Appl. Eng. Agric. 2013, 29, 583–601. [Google Scholar] [CrossRef]
  18. Fengdan, L.; Ligen, Y.; Guanghui, T.; Junjun, Z. Design and implementation of 3G+VPN monitoring and control system for protected agriculture. J. China Agric. Univ. 2011, 16, 155–159, (In Chinese with English Abstract). [Google Scholar]
  19. Saraswathi, S.; Hong-Geun, K.; Jangwoo, P.; Yongyun, C. A study on decision support system based on the fuzzy logic approach for the livestock service management. Int. J. Serv. Technol. Manag. 2017, 23, 83–100. [Google Scholar]
  20. Chen, H.Q.; Xin, H.; Teng, G.H.; Meng, C.Y.; Du, X.D.; Mao, T.T.; Wang, C. Cloud-based data management system for automatic real-time data acquisition from large-scale laying-hen farms. Int. J. Agr. Biol. Eng. 2016, 9, 106–115. [Google Scholar] [CrossRef]
  21. Zheng, H.; Zhang, T.; Fang, C.; Zeng, J.; Yang, X. Design and Implementation of Poultry Farming Information Management System Based on Cloud Database. Animals 2021, 11, 900. [Google Scholar] [CrossRef]
  22. Wu, C.; Buyya, R.K.U.; Ramamohanarao, K. Cloud Pricing Models: Taxonomy, Survey, and Interdisciplinary Challenges. ACM Comput. Surv. 2020, 52, 1–36. [Google Scholar] [CrossRef]
  23. Choudhary, A.; Verma, P.K.; Rai, P. Comparative Study of Various Cloud Service Providers: A Review. In Proceedings of the 2022 International Conference on Power, Energy, Control and Transmission Systems (ICPECTS), Chennai, India, 8–9 December 2022; pp. 1–8. [Google Scholar]
  24. Mansouri, Y.; Toosi, A.; Buyya, R. Data Storage Management in Cloud Environments: Taxonomy, Survey, and Future Directions. ACM Comput. Surv. 2018, 50, 1–51. [Google Scholar] [CrossRef]
  25. Zhang, H.; Chen, C. Design of Sick Chicken Automatic Detection System Based on Improved Residual Network; IEEE: Chongqing, China, 2020; Volume 1, pp. 2480–2485. [Google Scholar]
  26. Pereira, W.F.; Fonseca, L.D.S.; Putti, F.F.; Góes, B.C.; Naves, L.D.P. Environmental monitoring in a poultry farm using an instrument developed with the internet of things concept. Comput. Electron. Agr. 2020, 170, 105257. [Google Scholar] [CrossRef]
  27. Sun, X.; Pan, Z.; Bertino, E. Intelligent Poultry Environment Control System Based on Internet of Things; Springer International Publishing AG: Cham, Switzerland, 2018; Volume 11067, pp. 407–417. [Google Scholar]
  28. Luo, J.; Zhao, C.; Chen, Q.; Li, G. Using deep belief network to construct the agricultural information system based on Internet of Things. J. Supercomput. 2022, 78, 379–405. [Google Scholar] [CrossRef]
  29. Zhu, P.; Teng, G.; Liu, J.; Chen, W.; Wu, J. Visualization Evaluation Method for Hygrothermal Environment Comfort of Broiler Breeder. China Poult. 2023, 45, 86–94, (In Chinese with English Abstract). [Google Scholar] [CrossRef]
  30. Du, X.D.; Lao, F.D.; Teng, G.H. A Sound Source Localisation Analytical Method for Monitoring the Abnormal Night Vocalisations of Poultry. Sensors 2018, 18, 2906. [Google Scholar] [CrossRef] [PubMed]
  31. Du, X.; Teng, G. An automatic detection method for abnormal laying hen activities using a 3D depth camera. Eng. Agr.-Jaboticabal 2021, 41, 263–270. [Google Scholar] [CrossRef]
  32. Goswami, P.; Faujdar, N.; Debnath, S.; Khan, A.K.; Singh, G. Investigation on storage level data integrity strategies in cloud computing: Classification, security obstructions, challenges and vulnerability. J. Cloud Comput. Adv. Syst. Appl. 2024, 13, 23–45. [Google Scholar] [CrossRef]
  33. Lu, Y.; Yang, X.; E, L.; Fang, Z.; Li, Y.; Liang, C.; Shi, Z.; Wang, C. Characterizing a Year-Round Particulate Matter Concentration and Variation under Different Environmental Controls in a Naturally Ventilated Dairy Barn. Agriculture 2023, 13, 902. [Google Scholar] [CrossRef]
  34. Mateo-Fornés, J.; Pagès-Bernaus, A.; Plà-Aragonés, L.M.; Castells-Gasia, J.P.; Babot-Gaspa, D. An Internet of Things Platform Based on Microservices and Cloud Paradigms for Livestock. Sensors 2021, 21, 5949. [Google Scholar] [CrossRef]
  35. Lashari, M.H.; Karim, S.; Alhussein, M.; Hoshu, A.A.; Aurangzeb, K.; Anwar, M.S. Internet of Things-based sustainable environment management for large indoor facilities. Peerj Comput. Sci. 2023, 9, e1623. [Google Scholar] [CrossRef]
  36. Mahbub, M. A smart farming concept based on smart embedded electronics, internet of things and wireless sensor network. Internet Things 2020, 9, 100161. [Google Scholar] [CrossRef]
  37. Zhang, H.; Qian, S. Network Architecture for Intelligent Identification of Faults in Rabbit Farm Environment Monitoring Based on a Biological Neural Network Model. Comput. Intel. Neurosc. 2022, 2022, 6377043. [Google Scholar] [CrossRef]
  38. Neethirajan, S.; Kemp, B. Digital Twins in Livestock Farming. Animals 2021, 11, 1008. [Google Scholar] [CrossRef]
  39. Costa, A.; Ferrari, S.; Guarino, M. Yearly emission factors of ammonia and particulate matter from three laying-hen housing systems. Anim. Prod. Sci. 2012, 52, 1089. [Google Scholar] [CrossRef]
  40. Wang, Y.; Wang, C.Y.; Li, B.M. Determination of carbon dioxide concentration standards and minimum ventilation rates of layer house in winter. Trans. Chin. Soc. Agric. Eng. 2017, 33, 240–244, (In Chinese with English Abstract). [Google Scholar]
  41. Yin, H.; Wu, Z.; Wu, J.; Chen, Y.; Chen, M.; Luo, S.; Gao, L.; Hassan, S.G. A Multistep Interval Prediction Method Combining Environmental Variables and Attention Mechanism for Egg Production Rate. Agriculture 2023, 13, 1255. [Google Scholar] [CrossRef]
Figure 1. Schematic diagram of the hierarchy of the Internet of Things.
Agriculture 14 01277 g001
Figure 2. Schematic diagram of data collection and display processes.
Agriculture 14 01277 g002
Figure 3. Data flow structure diagram of the platform. Local data from multiple data collection points (including data from different plants or different platforms) are uploaded to the cloud through the network, in which structured data are stored in the MySQL database, and unstructured data are stored in the file database. APECH TOMCAT is used to provide services to end users using different core components after WEB publishing.
Agriculture 14 01277 g003
Figure 4. Function structure diagram of intelligent service platform of facility environment.
Agriculture 14 01277 g004
Figure 5. Manually filled daily report template on website.
Agriculture 14 01277 g005
Figure 6. Sensor layout diagram in hen houses.
Agriculture 14 01277 g006
Figure 7. Network system architecture in experimental farm.
Agriculture 14 01277 g007
Figure 8. Real-time interface display of intelligent service platform (A1) for real-time monitoring; (A2) comfort zone in the psychrometric chart; (A3) Ammonia concentration; (B1) data summarization; (B2) environmental data at different locations of the chicken house; (B3) hens’ weight curve; and (C1, C2) environmental data outside the house; (C3) for CO2 levels.
Agriculture 14 01277 g008
Figure 9. Voice recognition system interface.
Agriculture 14 01277 g009
Figure 10. Querying and displaying production data (for cumulative mortality rate (CMR) and egg production rate (EPR)) from 1 January 2020 to 21 June 2021.
Agriculture 14 01277 g010
Figure 11. A1 collection points of environmental data from 7 July 2020 to 15 June 2020: (a) temperature and humidity statistical curve; (b) carbon dioxide and ammonia concentration statistical curve; and (c) wind speed statistical curve.
Agriculture 14 01277 g011aAgriculture 14 01277 g011b
Figure 12. Profit and loss (P and F) curve from 1 January 2020 to 15 May 2021.
Agriculture 14 01277 g012
Figure 13. Correlation analysis between environmental parameters, chicken age, and egg production rate. Heatmap of Pearson correlation analysis. Color key: the color intensity represents the strength of the Pearson correlation coefficient, ranging from orange-red to purple. Positive correlation: darker shades of purple indicate a positive correlation. Negative correlation: darker shades of orange-red indicate a negative correlation.
Agriculture 14 01277 g013
Table 1. Comparative analysis of IoT systems in different system components.
System
Component
Technology ApplicationFunctionality DescriptionReferences
Perception LayerSound sensorsMonitor chicken welfare level[10]
Digital image sensorsObserve bird conditions[11]
Near-infrared sensorsAssist in observing birds[12]
Acceleration sensorsRecord intricate chicken movements[13]
Network LayerZigBee wireless sensor network + embedded serverCollect environmental data[15]
LoRa and MQTT communication technologyDevelop environmental data acquisition scheme[16]
3G communication technologyDesign real-time poultry monitoring platform[17]
3G + VPN communication technologyDesign real-time poultry monitoring platform with enhanced security[18]
Application LayerFuzzy Logic Decision SystemEstablish decision-making system for livestock control[19]
Business LayerCloud computing platformForm comprehensive digital intelligent monitoring system[20,21]
Remote server infrastructureEnable seamless remote work[23]
Table 2. Comparative analysis of technologies in agricultural monitoring systems.
Technology ApplicationFunctionality DescriptionProsConsReferences
IoT-Based Weather Monitoring SystemMonitoring and notifying deviations in greenhouse weather parametersOffers ergonomic, power-efficient, and scalable solutions for greenhouse weather monitoring.Scalability and accuracy improvement challenges[8]
Smart Poultry Management SystemUsing smart sensors, big data, and IoT tech for monitoring house environment monitor, bird welfare, precision feeding, and disease detectionEnhances production while minimizing costs and resource usage, offering real-time data collection.Sensors and devices technical problems and data governance[9]
Camera-Based Real-Time MonitoringBroiler flock welfare, assessing activity and occupation patternsCorrelates activity and occupation patterns with welfare assessmentsLatent limitations during dark period[11]
Wireless Activity Sensor NetworkAvian influenza monitoring, abnormal states detectionEarly chicken abnormal state detection, earlier than body-temperature sensingfalse positive detections may be due to bird physiology and movement patterns[13]
Smart Animal Monitoring SystemWireless sensor network and IoT platform for monitoring animal health, and environmental parameter monitoringProvides continuous mobile surveillance of the entire dairy farm and saves on labor expenses.Extension needed by adding body-area sensors for capturing animal health data and AI/ML algorithms[14]
IoT-Based Henhouse Monitoring SystemRemote henhouse environment monitoring using IoT technology, collecting data through wireless sensorsUsing wireless monitoring and environmental factors with high estimation accuracy.Requires strategies for data loss recovery and missing data filling[15]
Aviary Remote Monitoring SystemIoT-based environmental parameter monitoring for poultry farmingCost-effective and provides real-time monitoring capabilities.May have limitations in wireless signal range and reliability[16]
3G-Based Remote Monitoring System3G network-based poultry production management systemReliable environmental parameter monitoringDependent on 3G network availability and quality[17]
3G + VPN Remote Monitoring SystemRemote monitoring system based on 3G and VPN, sufficient video bandwidth and cheap wireless network accessEconomical, feasible remote monitoringCurrently unable to run uninterrupted, requiring development of automatic reconnection for improved stability[18]
Smart Poultry Management Systemprecision livestock farming technologies, big data analytics, and IoT-based poultry farming systemOffers real-time monitoring, automated farm procedures, and data-driven decision-makingRequires manual sampling and operation for biosensor-based diagnostics[20]
Cloud-Based Poultry Farming Information Management SystemCloud-based poultry farming information management, including production management and office management modulesFlexibility and scalability data management, enabling data mining and traceability.Relies on secure and reliable cloud services for data storage and management[21]
Sick Chicken Automatic Detection SystemImproved residual network-based sick chicken detectionImproves identification speed and accuracy, saving manpower costs.Needs extensive training data and computational resources[25]
IoT-Based Environmental Monitoring InstrumentDeveloped an IoT instrument for monitoring temperature, humidity, light intensity, and ammonia levels in poultry farms.Low-cost alternative, efficient data recording, and quick data transmission.IoT connectivity dependence and may need software improvements and additional sensors for air quality maintenance[26]
IoT-Based Intelligent Poultry Environment Control SystemIoT-based system for intelligent control of poultry house environments, collecting and analyzing environmental dataAutomates environmental data collection and analysis for optimal poultry house conditions.Requires robust network infrastructure for seamless operation[27]
Deep Belief Network in IoT-Based Agri-SystemAgricultural information system using deep belief networkCapable of handling complex data patterns in agricultural settings.High computational cost and large dataset requirements[28]
Table 3. The environmental sensor performance parameters.
TypeRangeResolutionAccuracyModel
Temperature/°C
Relative humidity/%
−20~60
0~100%
0.1
0.1
±0.3 °C
±1.5%
JWSH-5
CO2 concentration/ppm
NH3 concentration/ppm
0~5000
0~500
1
0.01 (0~100 ppm), 0.1 (100~500 ppm)
±(40 ppm + 3%FS *)
±3%
JQAW-3AC
JQB-G-NH3-1
Air velocity/m·s−10~50.01±(0.2 + 3%FS *)KL-15G
* FS (Full Scale) means the full range of a sensor’s measurement capabilities.
Table 4. The proportion of available data.
Environmental DataRaw Data QuantityProcessed Data QuantityEstimated Data QuantityData Integrity * (%)Data Validity ** (%)
Temperature1,633,5901,628,4911,684,80096.9699.69
Humidity1,632,9491,632,0221,684,80096.9299.94
Wind speed1,643,8681,553,5351,684,80097.5794.50
Carbon dioxide concentration1,466,4541,459,9081,684,80087.0499.55
Ammonia concentration796,320770,576842,40094.5396.77
* Data integrity (%) = raw data quantity/estimated data quantity × 100%. ** Data validity (%) = processed data quantity/raw data quantity × 100%.
Disclaimer/Publisher’s Note: The statements, opinions and data contained in all publications are solely those of the individual author(s) and contributor(s) and not of MDPI and/or the editor(s). MDPI and/or the editor(s) disclaim responsibility for any injury to people or property resulting from any ideas, methods, instructions or products referred to in the content.

