Article

Vertical Spatial Differentiation and Influencing Factors of Rural Livelihood Resilience: Evidence from the Mountainous Areas of Southwest China

1
Faculty of Geography, Yunnan Normal University, Kunming 650500, China
2
School of History and Administration, Yunnan Normal University, Kunming 650500, China
3
Center for Integrative Conservation, Xishuangbanna Tropical Botanical Garden, Chinese Academy of Sciences, Mengla 666303, China
4
School of Geographical Sciences, Harbin Normal University, Harbin 150025, China
*
Author to whom correspondence should be addressed.
Agriculture 2024, 14(8), 1295; https://doi.org/10.3390/agriculture14081295
Submission received: 2 July 2024 / Revised: 2 August 2024 / Accepted: 3 August 2024 / Published: 5 August 2024
(This article belongs to the Section Agricultural Economics, Policies and Rural Management)

Abstract

:
Rural livelihood resilience (RLR) is significant for the sustainability of rural areas, farmers and agriculture. This research takes the mountainous areas of Southwest China as the study areas and integrates the buffer, adjustment and renewal capabilities to construct a RLR analysis framework and evaluation indicator system. The RLR of 234 sample counties was evaluated using set pair analysis, and the influencing factors of RLR were investigated using Geodetector. The aim is to scientifically analyze the vertical spatial differentiation and influencing factors of RLR and fully explore the risk-resistant potential of rural livelihood systems in mountainous areas. The results show that (1) From 2000 to 2020, RLR increases significantly, but the level is still low, and its structure shows a primary pattern of “buffer capability > adjustment capability > renewal capability”. (2) There is no significant negative correlation between RLR and terrain gradients, especially in the middle and low mountains. RLR in high mountainous areas is significantly lower than in low and medium mountainous areas, but the gap is narrowing. There are no significant gaps in RLR and various capabilities between low and medium mountain areas. (3) Economic development, non-agricultural industries and grassroots autonomous organizations are essential determinants for RLR. Economic development, grassroots autonomous organizations and transportation conditions are more important in low and medium mountain areas, while non-agricultural industries and medical conditions contribute more to high mountainous areas. (4) To enhance the RLR, policy recommendations should place a strong emphasis on extending the agricultural industry chain, improving rural production and living infrastructure and strengthening the supply of high-quality social public services. The findings can provide a scientific basis for governments to implement rural revitalization strategies and improve farmers’ well-being, as well as practical guidance for enhancing the risk resistance ability of underdeveloped mountainous rural areas.

1. Introduction

The United Nations World Conference on Environment and Development (UNCED) identified the establishment of stable livelihoods as the primary objective of poverty eradication in 1992. The United Nations Sustainable Development Goals (SDGs) further identified poverty eradication as the primary task of sustainable development in 2015 [1]. This indicates that sustainable livelihood is one of the most important topics in sustainable development. However, in the 21st century, increasingly frequent climate disasters and the impacts of urbanization, industrialization and informatization have brought more uncertainty and complexity to rural societies and economies [2,3]. Rural livelihood resilience (RLR) evaluation is becoming an important tool for studying sustainable rural development. Enhancing RLR is essential for the sustainability of farmers’ livelihoods and rural development [4,5].
The concept of resilience originated from physics, referring to the ability of an object to undergo deformation under external impact without breaking [6]. Ecologist Holling was the first to introduce resilience into ecology [7]. He defined it as the ability of an ecosystem to withstand external shocks and maintain its own structural and functional stability [8]. This laid the foundation for modern resilience theory. As resilience theory has been introduced into more and more research fields [9,10,11,12], its conceptual connotations have been expanded and deepened. It no longer simply refers to the system returning to its initial equilibrium state but emphasizes the system’s self-innovation and achieving a new balance through absorbing interference and restructuring [13].
Research on livelihood resilience has been active due to the combination of resilience theory and livelihoods studies [14,15]. The research themes mainly include the livelihood resilience analysis framework construction, livelihood resilience evaluation and its influencing factors analysis and livelihood resilience enhancement strategies. For example, the livelihood resilience analysis framework proposed by Speranza et al. [16] integrating buffering, self-organizing and learning capabilities is well-known and widely used [14,17,18]. It lays the theoretical foundation for the quantitative evaluation and comprehensive analysis of RLR. Li et al. quantitatively evaluated the livelihood resilience of pastoralists on the Qinghai–Tibetan Plateau and analyzed its spatial patterns using the spatial autocorrelation method [17]. Mavhura used systems thinking to analyze the impacts of floods, droughts and livelihood capital on farmers’ livelihood resilience in Zimbabwe [19]. Zhang et al. pointed out that tourism development is an effective way to enhance the livelihood resilience of rural residents in ethnic areas [20]. Overall, substantial advancements have been achieved but with certain constraints: (1) Emphasis has been placed on evaluating the livelihood resilience of individuals, households or families from a micro perspective at small regional scales [15,21,22,23]. The consideration of RLR from the macro perspective of rural livelihood systems at large spatial scales is lacking. (2) Exploration of the spatial differentiation of livelihood resilience has focused on horizontal spatial differentiation [17,24,25], while vertical spatial differentiation has been somewhat neglected.
The rural livelihood system, formed by the interaction and coupling of the natural environment, farmers’ livelihoods and government regulation, is a complex and mechanistic system of “nature—economy—society” with specific structures and functions [26]. This study attempts to introduce the concept of resilience into rural livelihood systems and defines rural livelihood resilience (RLR) as “the capability of rural livelihood systems to buffer shocks, self-adjust and repair, and evolve towards a new equilibrium state when subjected to external disturbances [4]”. Different rural livelihood systems have varying levels of resilience in their formation and development. Rural areas with strong RLR can effectively buffer external disturbances; resolve risks through self-adjustment and achieve self-development through factor restructuring, structural optimization and functional upgrading [27]. On the contrary, the equilibrium of rural livelihood systems can easily be disturbed by external disturbances and thus fall into stagnation or even recession [27]. Therefore, improving RLR is crucial for the sustainable development of rural areas, farmers and agriculture.
The terrain is a limiting factor for population distribution and socioeconomic development [28,29]. It inevitably influences the formation of the rural livelihood system, which further affects the presentation of RLR [30]. The mountainous areas of Southwest China are not only one of the most significant areas in the world with vertical zonation and surface fragmentation but are also the typical representative of underdeveloped mountainous areas. These areas are characterized by fragile and sensitive ecological environments, frequent natural disasters and the concentration of ethnic minorities, all of which make the rural livelihood systems there extremely vulnerable to external disturbances. It is therefore significant to investigate the dynamics of vertical spatial differentiation of RLR in these areas over the last 20 years, and it is imperative to further explore its influencing factors. This study aims to scientifically analyze the vertical spatial differentiation and influencing factors of RLR and to explore the risk resistance potential of rural livelihood systems. In addition to offering policy recommendations for the Chinese government to consolidate the achievements of poverty alleviation and support the rural revitalization strategy, it has theoretical and practical significance for sustainable rural development and farmers’ livelihood in underdeveloped mountainous areas.

2. Materials and Methods

First, construct the analytical framework. According to the composition of the rural livelihood system, a RLR analysis framework that integrates buffer, adjustment and renewal capabilities has been constructed, and a RLR evaluation index system has also been established. Second, classify the types of terrain gradients. According to the relief degree of the land surface (RDLS), the natural breaks method is used to divide the mountainous areas of Southwest China into high, medium and low mountainous areas. Third, quantitatively evaluate the RLR. The range standardization method and entropy weight method are used to preprocess original data and determine indicator weights, while set pair analysis (SPA) is used to quantitatively evaluate the RLR. Then, the descriptive statistical method was used to analyze the overall evolution and vertical spatial differentiation of RLR. Finally, explore the influencing factors. Pearson correlation coefficients and Geodetector were utilized to investigate the influencing factors of RLR. The methodological framework of this study is shown in Figure 1.

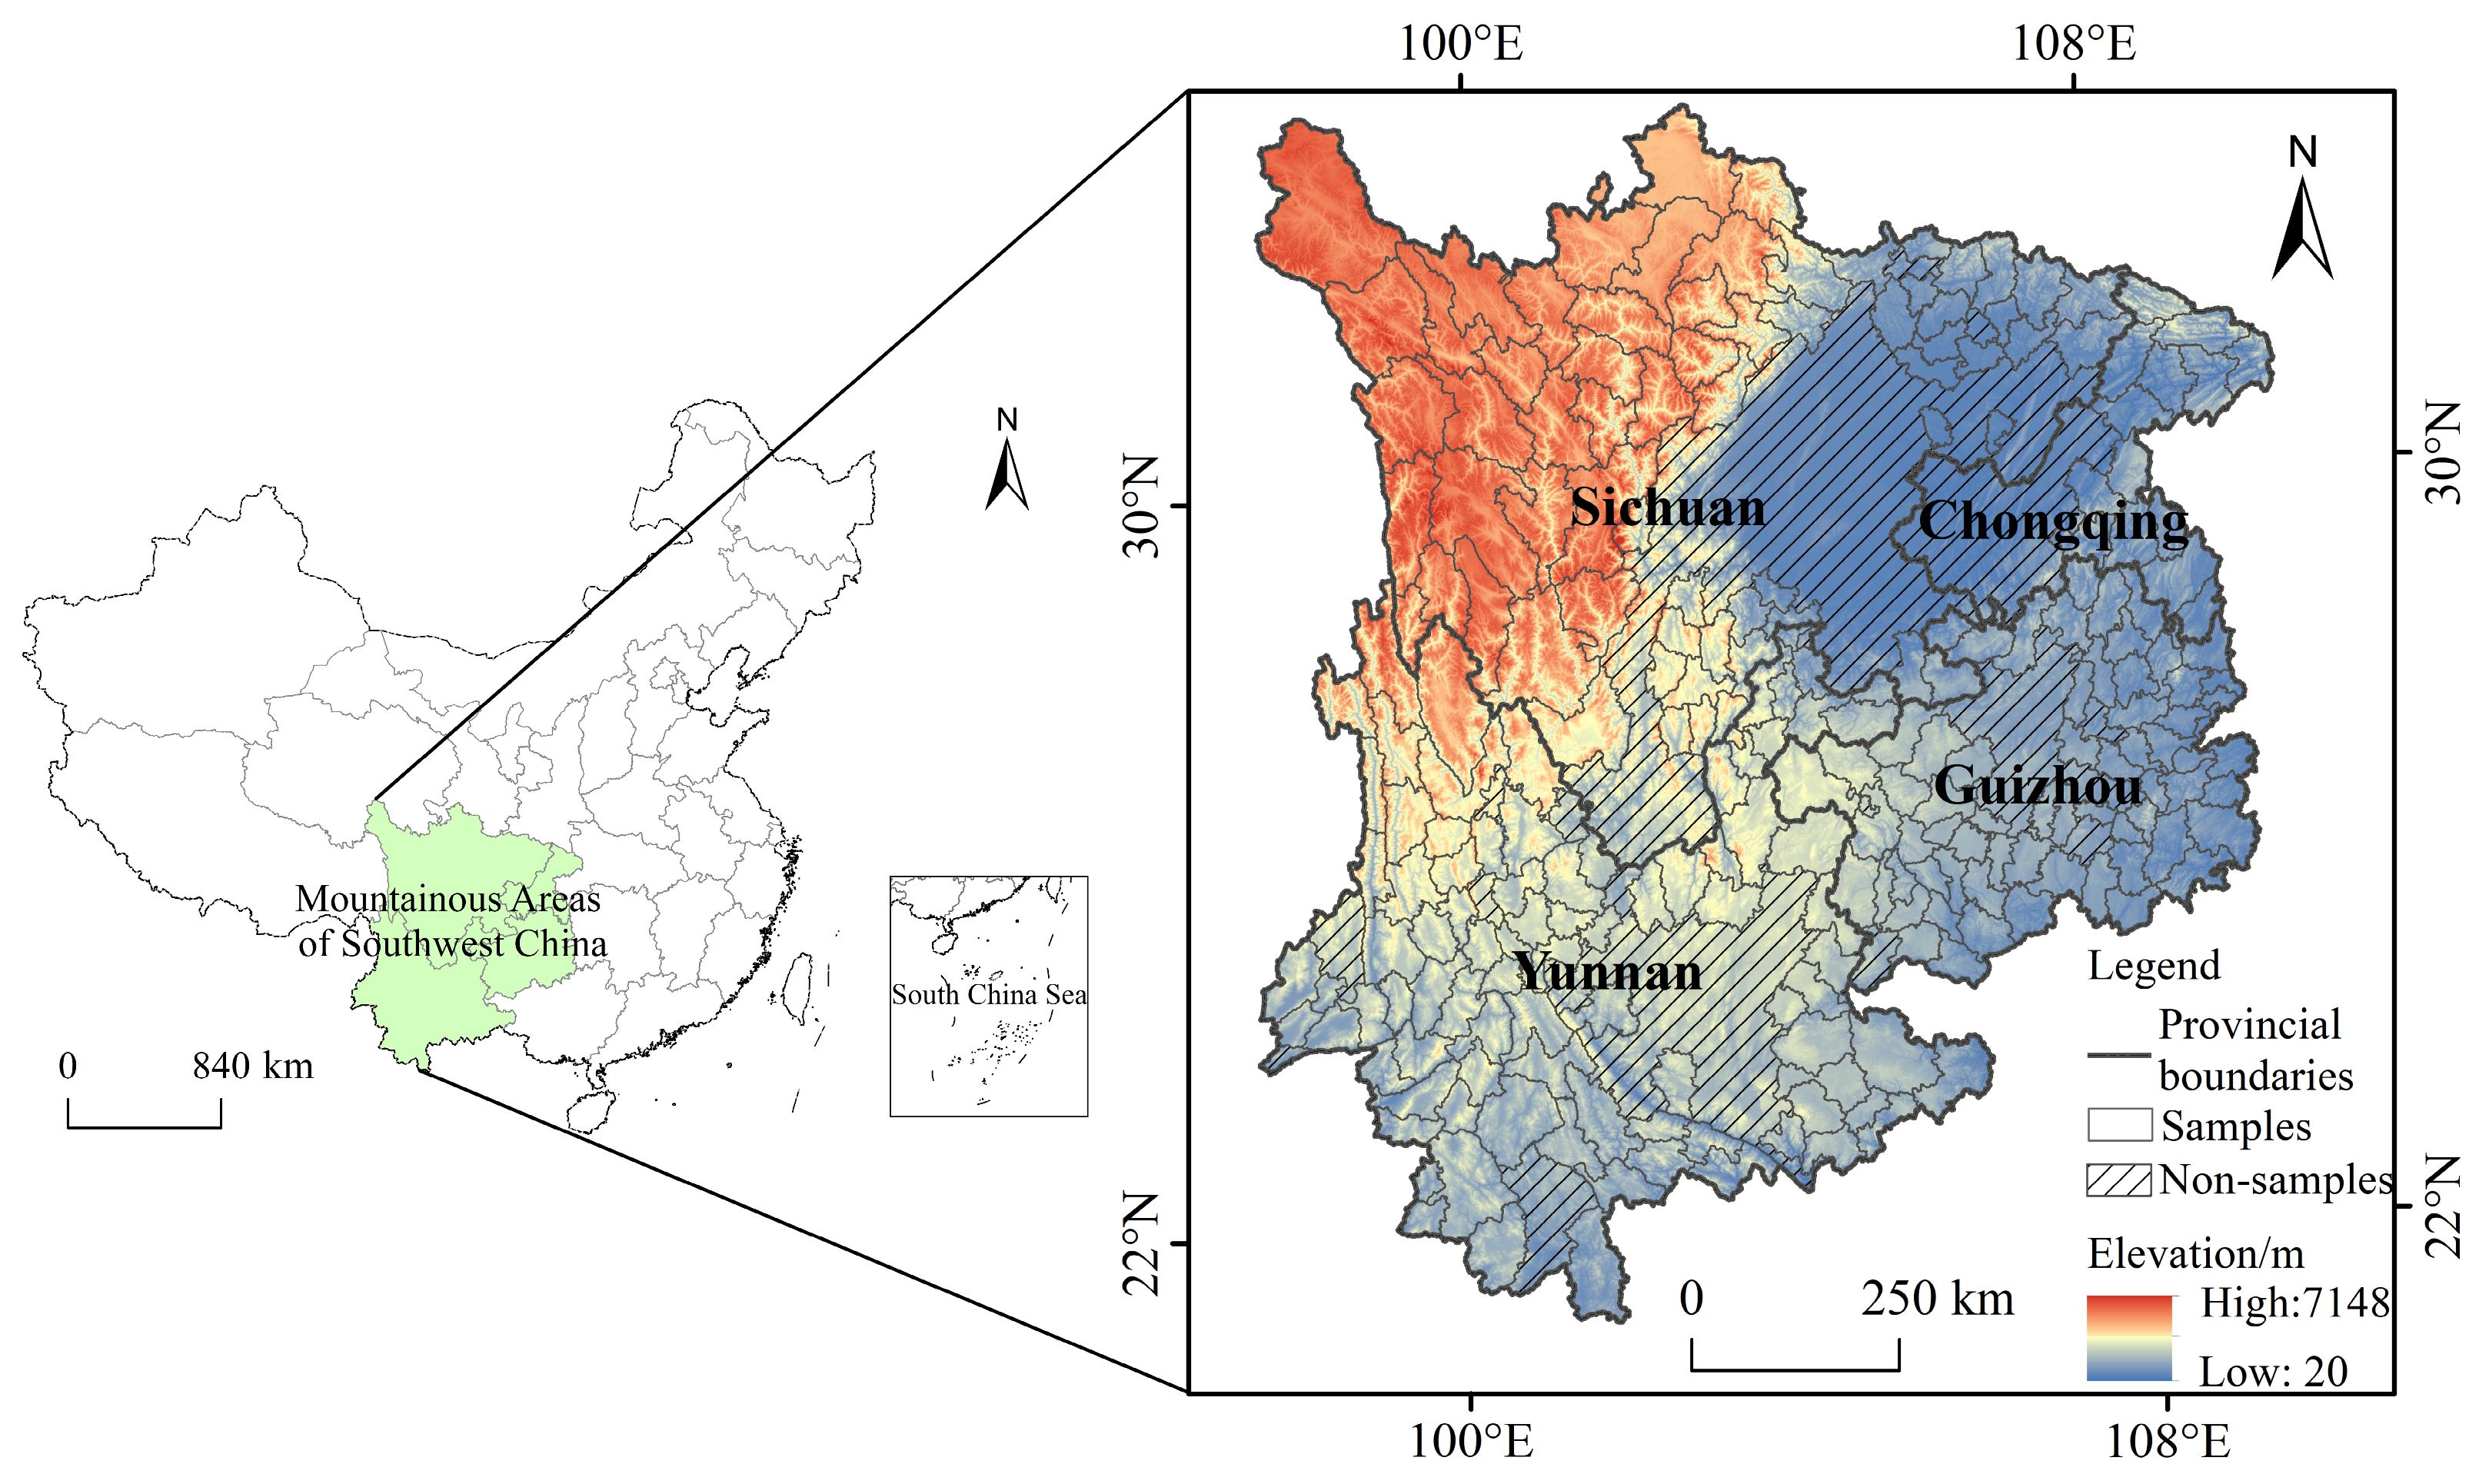
2.1. Study Area and Samples

The mountainous areas of Southwest China generally include the provinces of Yunnan, Guizhou, Sichuan and Chongqing (a municipality directly under the central government). The mountainous area accounts for up to 96%, with a weak foundation for rural socioeconomic development and significant vulnerabilities in farmers’ livelihoods. By the end of 2020, all 234 national-level poverty-stricken counties and 26.72 million rural poor people there had been lifted out of absolute poverty (based on the Chinese government’s poverty alleviation standards). However, most out-of-poverty villages and farmers are concentrated in remote mountainous areas. The production and living infrastructure there are insufficient, and their ability to resist risks is still weak. Considering that rural areas within the same county are quite similar in geographic environment, resource endowment and socioeconomic development, they can form a regional community under the unified management of the county government and jointly deal with external disturbances [27]. It is reasonable to evaluate RLR based on the county level. Therefore, 234 out-of-poverty counties in mountainous areas of Southwest China were selected as the study samples (Figure 2).

2.2. Methods

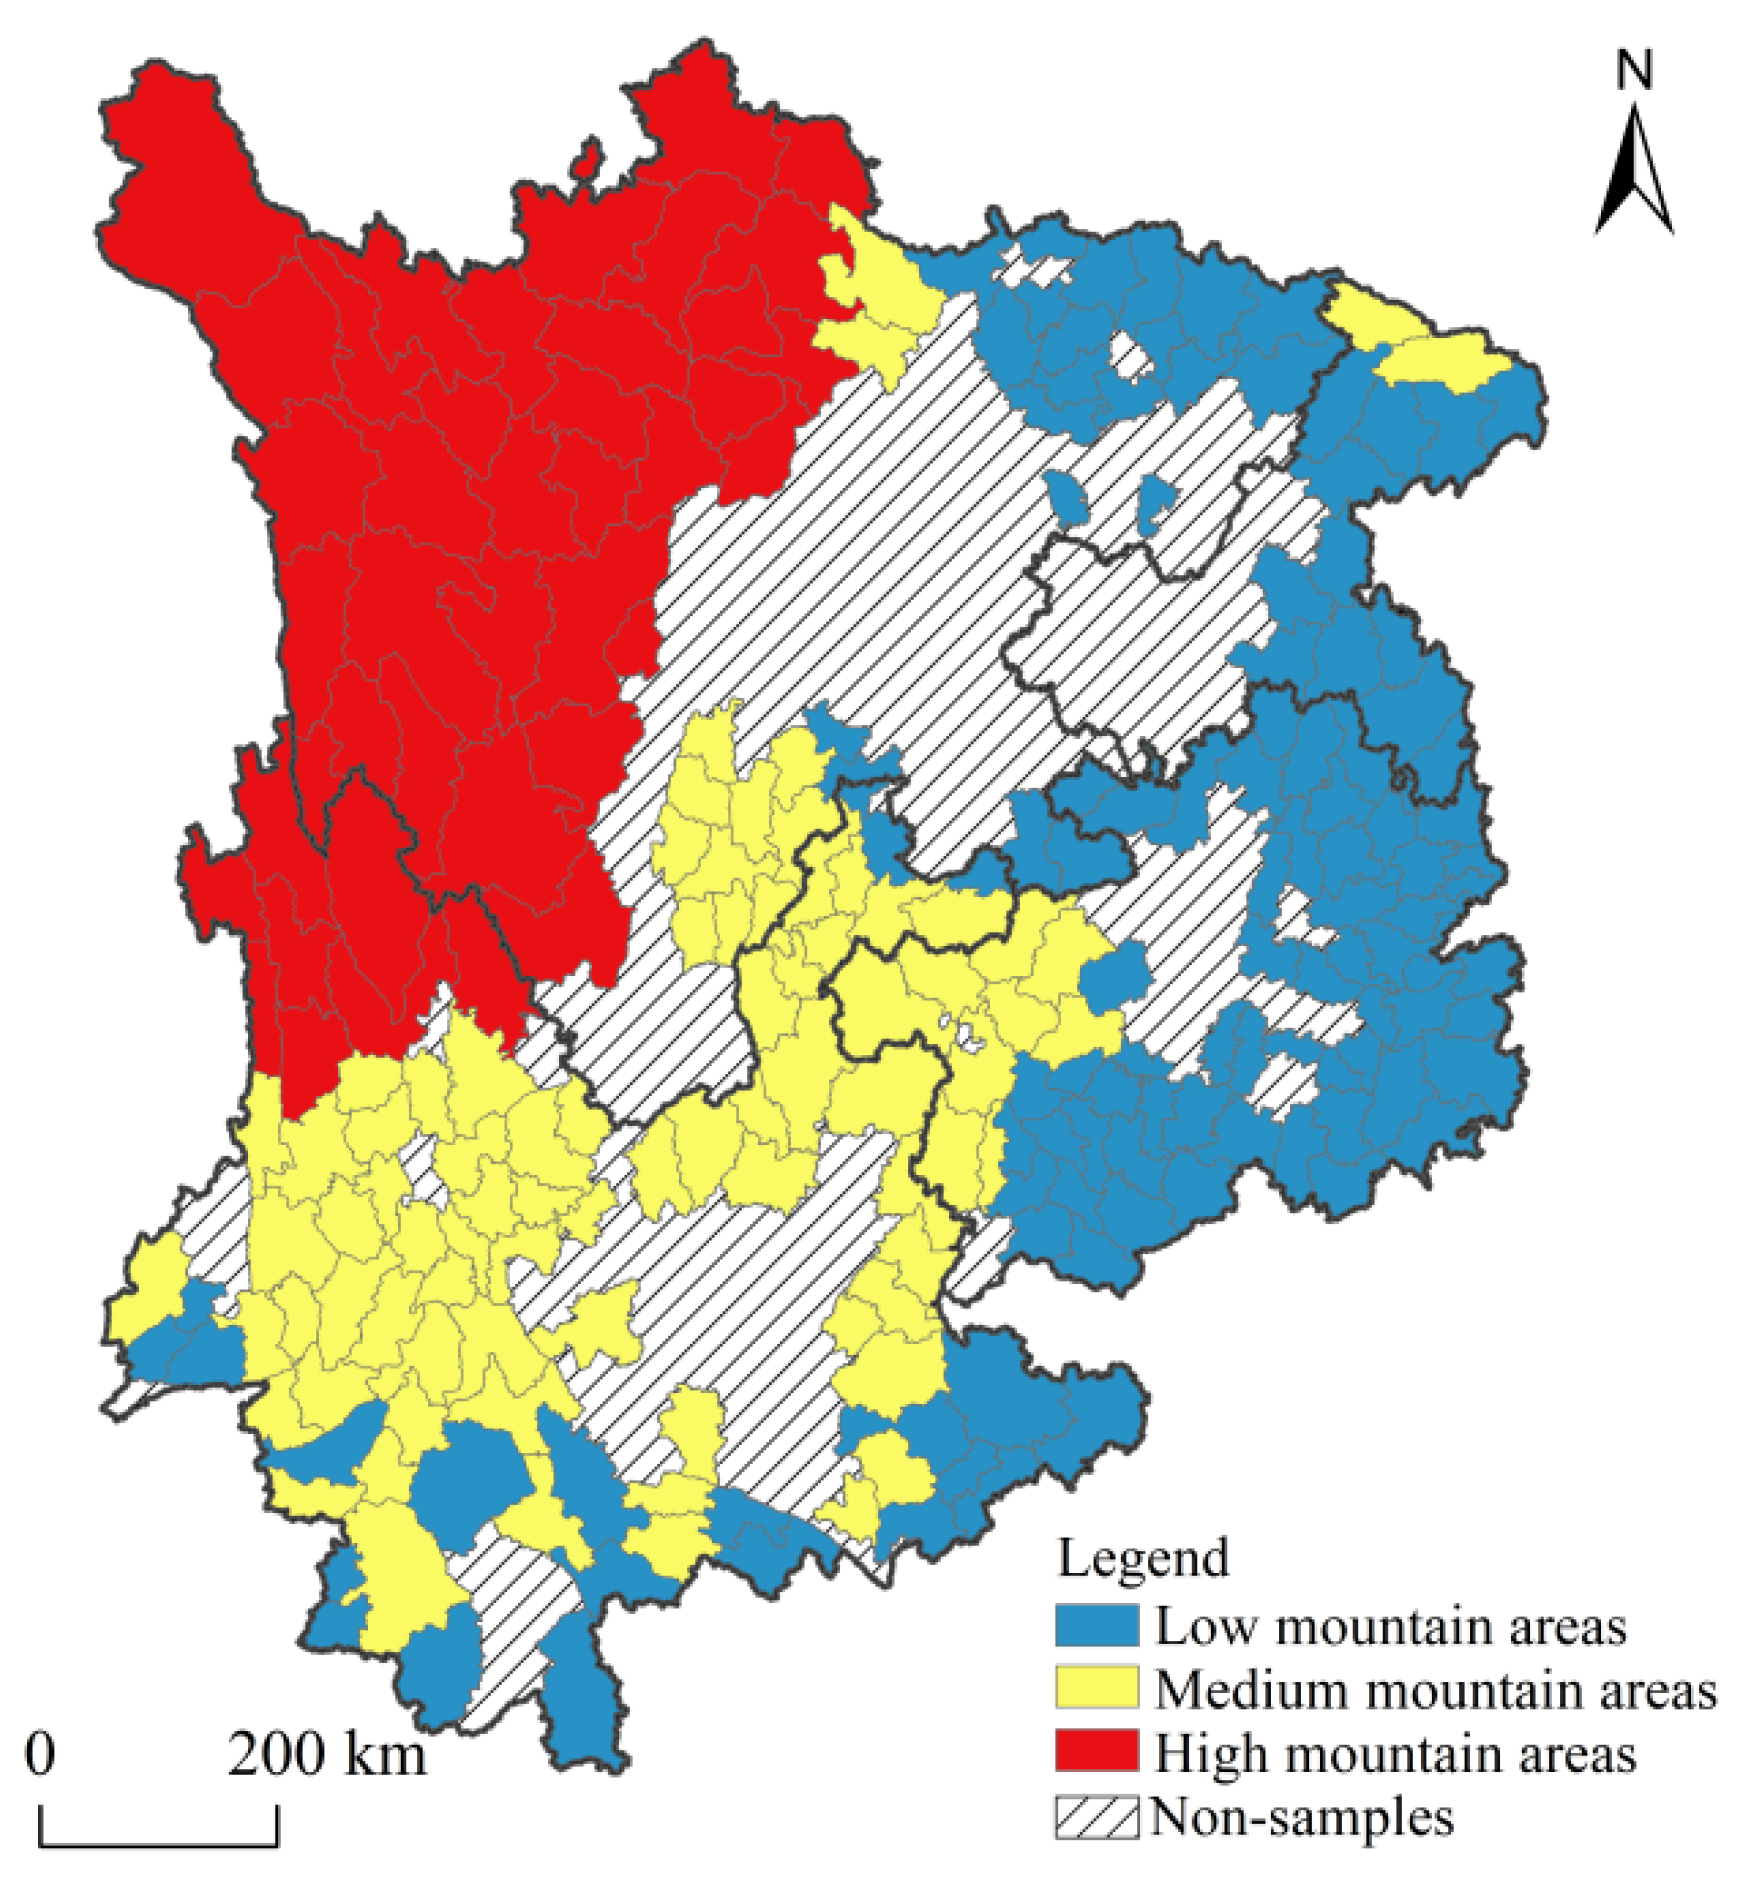
2.2.1. Sample Classification Based on Terrain Gradients

First, 234 sample counties were classified based on the relief degree of land surface (RDLS) and the natural breaks method. As a comprehensive representation of surface roughness (relative gradient) and altitude (absolute gradient), RDLS is one of the key markers of the classification of terrain gradients [31]. Previous studies have shown that RDLS is an important indicator of the human settlement environment and is significantly negatively correlated with socioeconomic development and population distribution [28,30,32]. Therefore, RDLS is bound to have an impact on the rural livelihood system, which, in turn, affects the presentation of RLR. The calculation formula for RDLS is as follows [32]:
R D L S = A E / 1000 + { A E D × [ 1 F ( A ) / A ] } / 500
where AE is the average elevation of the county, AED is the average elevation difference of the county, F(A) is the flat area of the county and A is the area of the county. AE, AEC, P(A) and A were extracted using ArcGIS 10.2 based on the digital elevation model (DEA) of the study areas. Then, 234 out-of-poverty counties were classified as low, medium and high mountain areas using the natural breaks method (Figure 3).
  • Low mountain areas (0.39 < RDLS ≤ 1.71). Distributed in Southern Yunnan, Northern Sichuan and Eastern Guizhou and Chongqing, totaling 112 counties, accounting for 47.86% of the area.
  • Medium mountain areas (1.72 < RDLS ≤ 3.10). Distributed in Western Yunnan, as well as the junction area of Yunnan–Guizhou–Sichuan, totaling 82 counties, accounting for 31.05% of the area.
  • High mountain areas (3.11 < RDLS < 4.69). Concentrated in Western Sichuan and Northeastern Yunnan, totaling 40 counties, accounting for 35.45% of the area.

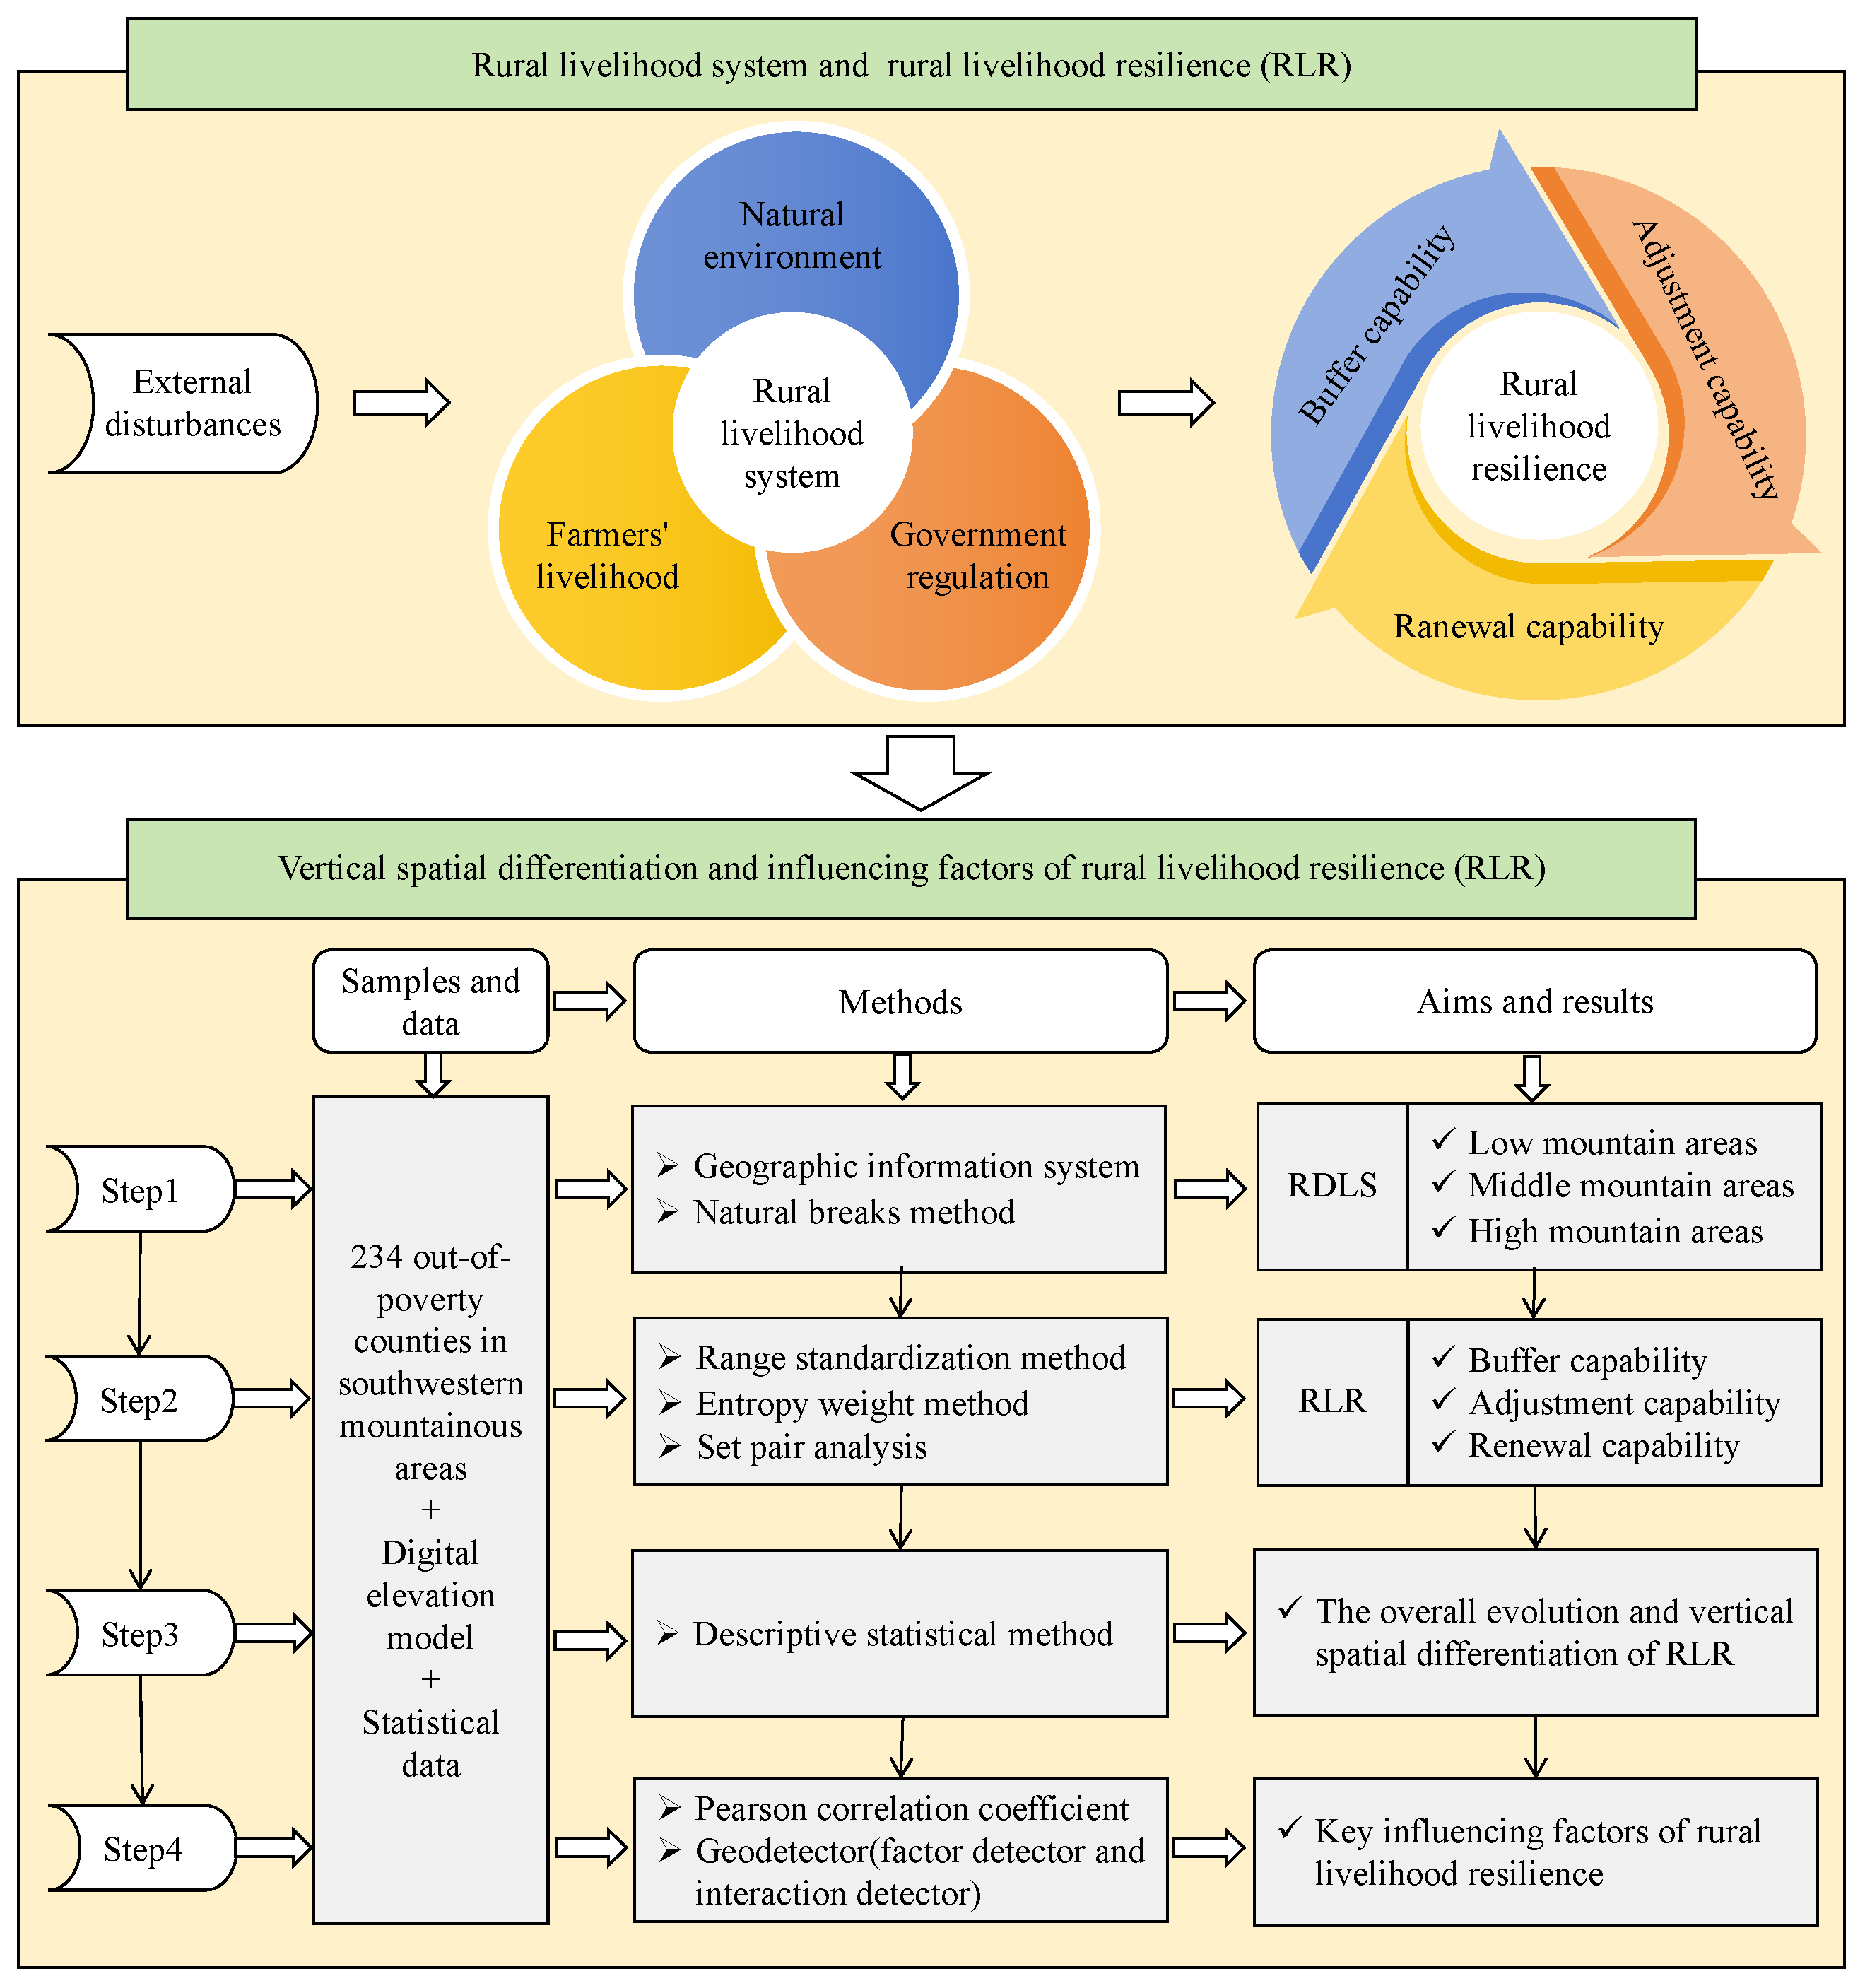
2.2.2. Rural Livelihood Resilience Evaluation

On the basis of constructing the RLR analysis framework, a RLR evaluation index system is established, and then, set pair analysis is used to quantitatively evaluate the RLR. RLR, as an intrinsic property of rural livelihood systems, refers to the capability to buffer shocks, self-adjust and repair and further evolve towards a new equilibrium when the system is subjected to external disturbances. Based on the livelihood resilience analysis framework proposed by Speranza et al. [16] and drawing on related studies on rural economic resilience [33,34], agricultural resilience [35] and urban resilience [36,37], rural livelihood resilience is deconstructed in this study into three dimensions: buffer capability, adjustment capability and renewal capability. These capabilities cascade and interact with each other and, together, contribute to the development of RLR.
Buffer capability refers to the rural livelihood system resisting disturbances by utilizing resources and asset endowments to maintain the integrity of its functions and structure, which is usually characterized by livelihood capital [38]. The Department for International Development (DFID) of the UK has developed a paradigm for sustainable livelihood analysis that breaks down livelihood capital into five sub-capitals: natural, physical, financial, social and human capital [39]. Natural capital encompasses the natural resources available for famers’ production and living, such as cultivated land, water and forests [40]. Physical capital mainly focuses on material conditions, such as production tools and housing [41,42]. Financial capital is characterized by income and consumption [43]. Social capital mainly targets the government’s social security system and the civil mutual aid network [18]. Human capital mainly focuses on farmers’ employment, skills and health conditions [44,45].
Adjustment capability refers to the ability of rural livelihood systems to adapt to external disturbances, self-adjust and repair damage [18]. It is the result of the endogenous interaction between farmers’ livelihood activities and the government’s policy support. Farmers’ livelihood activities focus on agricultural production, such as farmland quality, agricultural output, agricultural infrastructure and rural electrification [4,46]. Government policy support mainly considers financial self-sufficiency and resource allocation [4,18].
Renewal capability refers to the ability of the rural livelihood system to transform a new development mode through experience accumulation, knowledge acquisition and scientific and technological innovation to achieve a new stable and sustainable development state [17,47]. It is mainly characterized by the education level of farmers, urbanization, agricultural modernization, advanced industry, green development and the development level of science and technology [18,26,48]. Based on the concept review and the availability of data, 24 specific indicators were selected to construct the RLR indicator system (Table 1).
First, data preprocessing. To reduce the impact of various dimensions and attributes on later processes, the original data are normalized using the range standardization method [49]. The formula is as follows:
Positive   indicators   Z i j = ( X i j X min ) / ( X max X min ) Negative   indicators   Z i j = ( X max X i j ) / ( X max X min )
where Xij is the original value of indicator j of sample i, Zij is the normalized value of Xij and Xmin and Xmax are the minimum and maximum values of indicator j of all samples.
Second, weight determination. The weights of the indicators are determined using the entropy weight method. The principle is to calculate objective weights based on the variability of each indicator [50]. The formula is as follows:
p i j = Z i j i = 1 m Z i j e j = 1 ln ( m ) i = 1 m ( p i j ln p i j ) d j = 1 e j w j = d j j = 1 n d j
where pij is the proportion of indicator j for sample i, ej is the entropy value of indicator j, wj is the weight of indicator j, m represents the number of samples (m = 702, 234 counties in 3 study years) and n represents the number of indicators (n = 24). Third, RLR quantitative evaluation. RLR is evaluated using set pair analysis (SPA). The main goal of SPA is to efficiently accomplish a multi-attribute comprehensive evaluation and multi-objective decision-making by quantitatively inferring the certainty and uncertainty of complex systems based on identity–discrimination–contrary [51,52]. Assume that, in the context of question Q, the sets A and B make up the set pair H. The certainty set A is made up of identity and discrimination, and the uncertain set B is made up of the opposite. N features—where S is the number of common features, P is the number of opposing features and F (F = N − S − P) is the number of uncertain features—are obtained by analyzing the set pair H. Next, in the context of question Q, the connection degree μ of sets A and B can be calculated as follows [4]:
μ = S N + F N i + P N j = a + b i + c j
where, a, b and c, respectively, represent the degree of identity, discrimination and contrary of sets A and B in the context of question Q, and a + b + c = 1. i is the discrimination coefficient, and its value range is [−1, 1]; j is the contrary coefficient, which is a constant −1. According to the core idea of SPA, the RLR evaluation is set as Q = {F, D, E, W}, where the scheme set F = {f1, f2, f3,…, fm}, the indicator set D = {d1, d2, d3,…, dn}, the object set E = {e1, e2, e3,…, ek} and the indicator weight set W = {w1, w2, w3,…, wn}. The best scheme set U = {u1, u2, u3,…, un} and the worst scheme set V = {v1, v2, v3,…, vn} are further determined by comparing the evaluation schemes; un and vn are the best and worst values of the indicators, respectively. For the set pair {fm, U} on interval [U, V], the connection degree μ (fm, U) is as follows:
{ μ ( f m , U ) = a m + b m i + c m j a m =   w p a p k c m =   w p c p k p = ( 1 , 2 , 3 , , n ) , k = ( 1 , 2 , 3 , , n )
where apk and cpk are the degree of identity and discrimination between the indicator dpk and the set [vp,up], respectively, and wp is the weight of the pth indicator. When dpk is a positive indicator, the formula is
{ a p k = d p k v p + u p c p k = v p u p d p k ( v p + u p )
When dpk is a negative indicator, the formula is
{ a p k = v p u p d p k ( v p + u p ) c p k = d p k v p + u p
The formula for the degree of association between the scheme fm and the optimal scheme set U is as follows:
r m = a m a m + c m
The range of rm values is [0, 1], and the greater the rm value, the closer it is to the ideal scheme. Therefore, the rm value can be used to evaluate the RLR; that is, the larger the rm value, the stronger the RLR.

2.2.3. Influencing Factors Analysis

Relevant studies have found that the natural environment, socioeconomic development, industrial structure and policy interventions have important impacts on farmers’ livelihoods and rural development [26,53,54,55]. Based on these, with RLR as the dependent variable, 9 possible influencing factors were selected as independent variables to explore the influencing factors of RLR. Average slope (X1) and distance from the provincial government (X2) indicate the geographical environment, which are limiting factors for the formation and development of rural livelihood systems. Per capita gross domestic product (X3) and road density (X4) indicate the economic foundation. The better the economic foundation, the stronger the rural livelihood system’s ability to resist risks. The Herfindahl–Hirschmann index (X5) and proportion of non-agricultural population (X6) indicate industrial diversity, which is directly related to sustainable rural economy and farmers’ livelihoods. The number of grassroots autonomous organizations (X7), per capita beds in medical institutions (X8) and number of state-owned cultural institutions (X9) indicate social public services, which provide positive support for the development of RLR. Among these, the average slope and distance from the provincial government are extracted from ArcGIS10.2. The Herfindahl–Hirschmann index is a negative indicator, meaning that the smaller the value, the higher the industrial diversity, and the calculation method is detailed in Reference [27]. All indicators need to be processed through the range standardization method (Formula (2)) and then discretized using the natural breaks method.
Based on Pearson correlation coefficient, Geodetector was further used to analyze the key influencing factors of RLR. Geodetector is a spatial statistical method for analyzing the spatial heterogeneity influencing factors of geographic data [56], which can effectively avoid the problem of the collinearity of variables [57]. The software can be obtained for free on the website http://www.geodetector.cn/ (accessed on 1 June 2024).
(1)
Factor detector. Factor detector is employed to assess the explanatory power of a single factor on the dependent variable. The explanatory power of each factor is quantified by q-value:
q = 1 h = 1 L N h σ h 2 N σ 2  
where q is explanatory power of factor (X) on RLR (Y) change, h is the number of discretized classifications of factor (X) or RLR (Y), Nh and N are the number of units for classification h and the whole region, respectively, and σh2 and σh are the variance of RLR (Y) for the units in classification h and the whole region, respectively. The range of q-values is [0, 1], and the larger the q-value, the stronger the explanatory power of factor (X) on RLR (Y) change. The significance level of q-value is determined through the noncentral F-test.
(2)
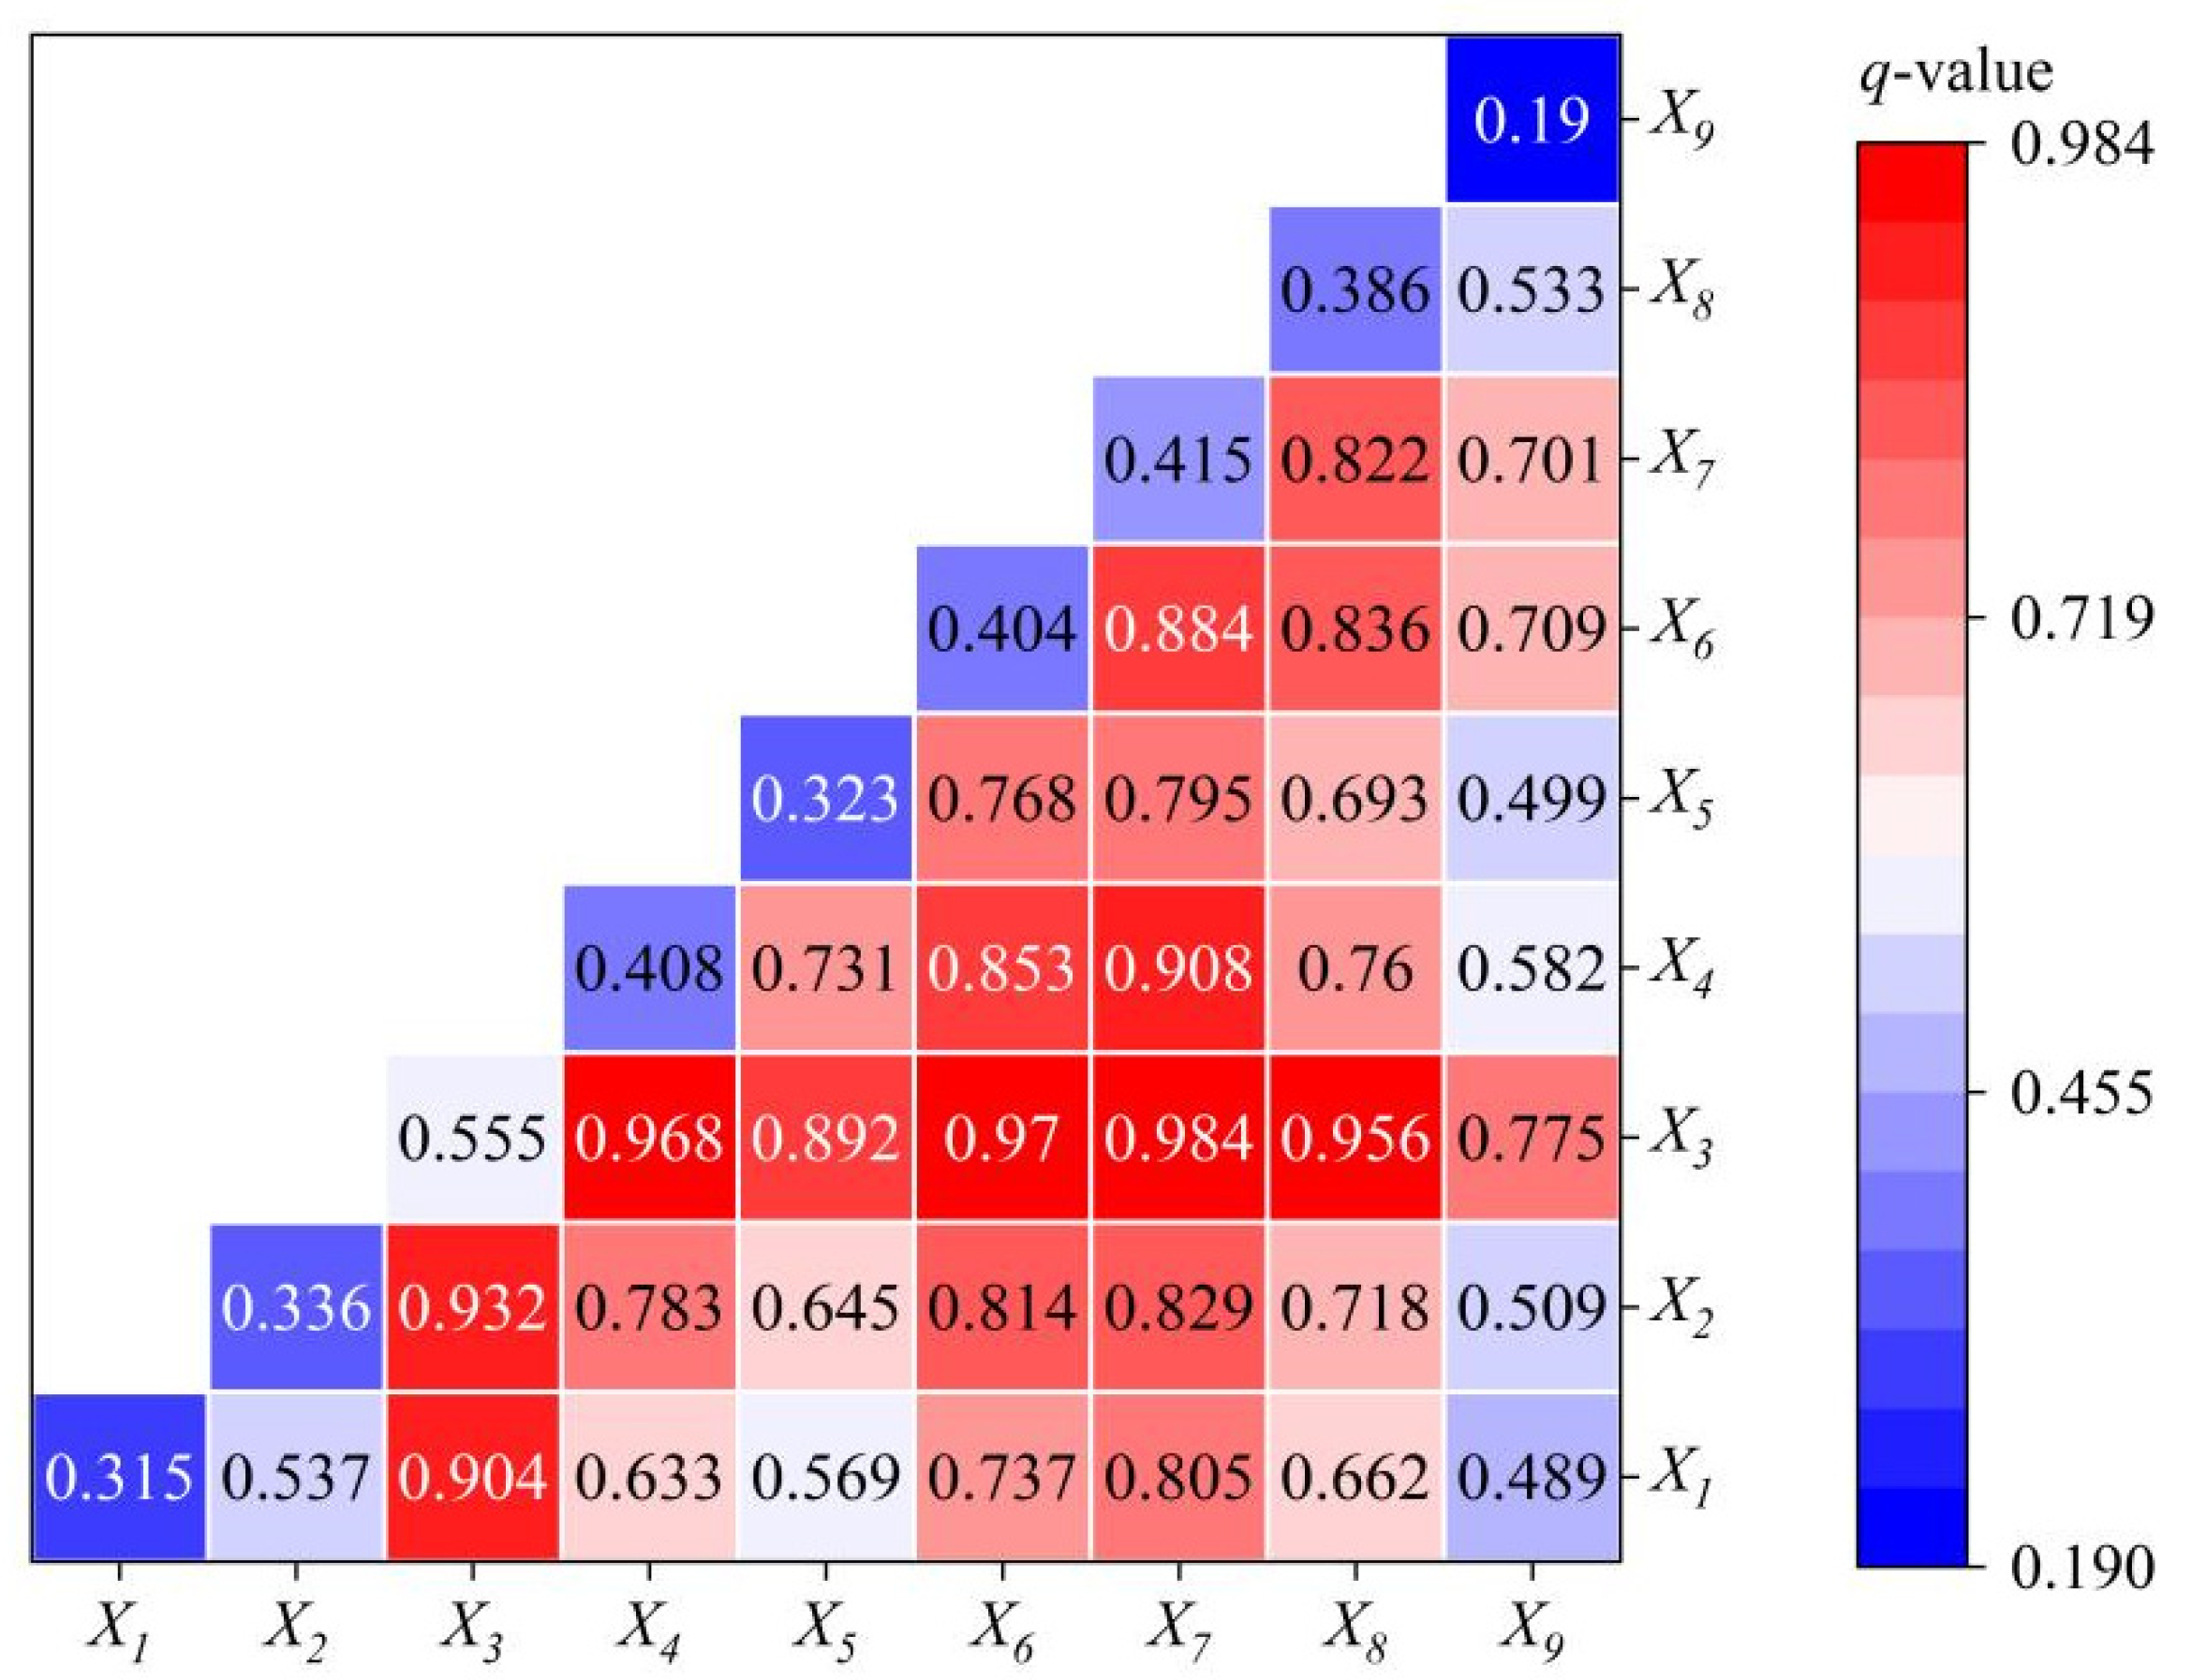
Interaction detector. Interaction detector is used to detect whether the explanatory power under the influence of two factors is enhanced, weakened or independent of each other by comparing the single factor q-values (q(Xn) and q(Xm)) and interaction q-values (q(Xn∩Xm)).

2.3. Date Source

The digital elevation model (DEM) at 30 m pixel resolution used for extracting the RDLS was obtained from the Geospatial Data Cloud https://www.gscloud.cn/ (accessed on 7 April 2024) with the geodetic coordinate system of WGS_1984_Albers. The statistical data used for RLR evaluation and influencing factors analysis were mainly obtained from the China County Statistical Yearbooks, the Statistical Yearbooks of Yunnan Province, Guizhou Province, Sichuan Province and Chongqing City, as well as the Statistical Bulletins of each county in 2001, 2011 and 2021 https://www.stats.gov.cn/; http://stats.yn.gov.cn/; http://stjj.guizhou.gov.cn/; http://tjj.sc.gov.cn/; http://tjj.cq.gov.cn/ (accessed on 11 April 2024). Data not covered in the Statistical Yearbooks and Statistical Bulletins were obtained through the business consultation function on the official website of the Bureau of Statistics. Partially missing data were estimated by linear regression. In addition, the number of farmer professional cooperatives was obtained from TianYanCha https://www.tianyancha.com (accessed on 16 April 2024).

3. Results

3.1. Overall RLR Evolution

The RLR index value range is [0, 1], and based on the equal intervals principle, it can be further classified into four levels: low level [0, 0.25), medium level [0.25, 0.50), sub-high level [0.50, 0.75) and high level [0.75, 1] [38]. The results show that, by 2020, within the RLR of all the samples, 17.09% fall into the sub-high level, 82.48% belong to the medium level, 0.43% are at the low level and no sample has attained the high level yet. For sub-high-level samples, the proportions of low, medium and high mountain areas are 50%, 47.5% and 2.5%, respectively. For the medium-level samples, the proportions of low, medium and high mountain areas are 47.67%, 32.64% and 19.69%, respectively. The only low level sample is Fugong County in Yunnan Province.
In terms of the evolution tendency, the average RLR in the mountainous areas of Southwest China went from 0.131 to 0.427 between 2000 and 2020, growing at an average annual growth rate of 6.42%, moving from a low level to a medium level. Furthermore, it is evident that, from 2010 to 2020, RLR and other capacities advanced dramatically in comparison to from 2000 to 2010. In terms of various capabilities, with an average yearly growth rate of 5.55%, the average buffering capability rose from a low level of 0.195 to a sub-high level of 0.544. With an average yearly growth rate of 9.34%, the average adjustment capability has grown quickly, from a low level of 0.077 to a medium level of 0.420. With an average annual growth rate of 8.36%, the average renewal capability rose from 0.050 to 0.230, but it has stayed at a low level. Overall, despite constant improvement over the study period, the RLR is still at a relatively low level. One weakness that prevents RLR from developing healthily is its much lower renewal capability when compared to the buffer and adjustment capabilities. A primary pattern of “buffer capability > adjustment capability > renewal capability” has always been evident in the RLR structure (Figure 4).

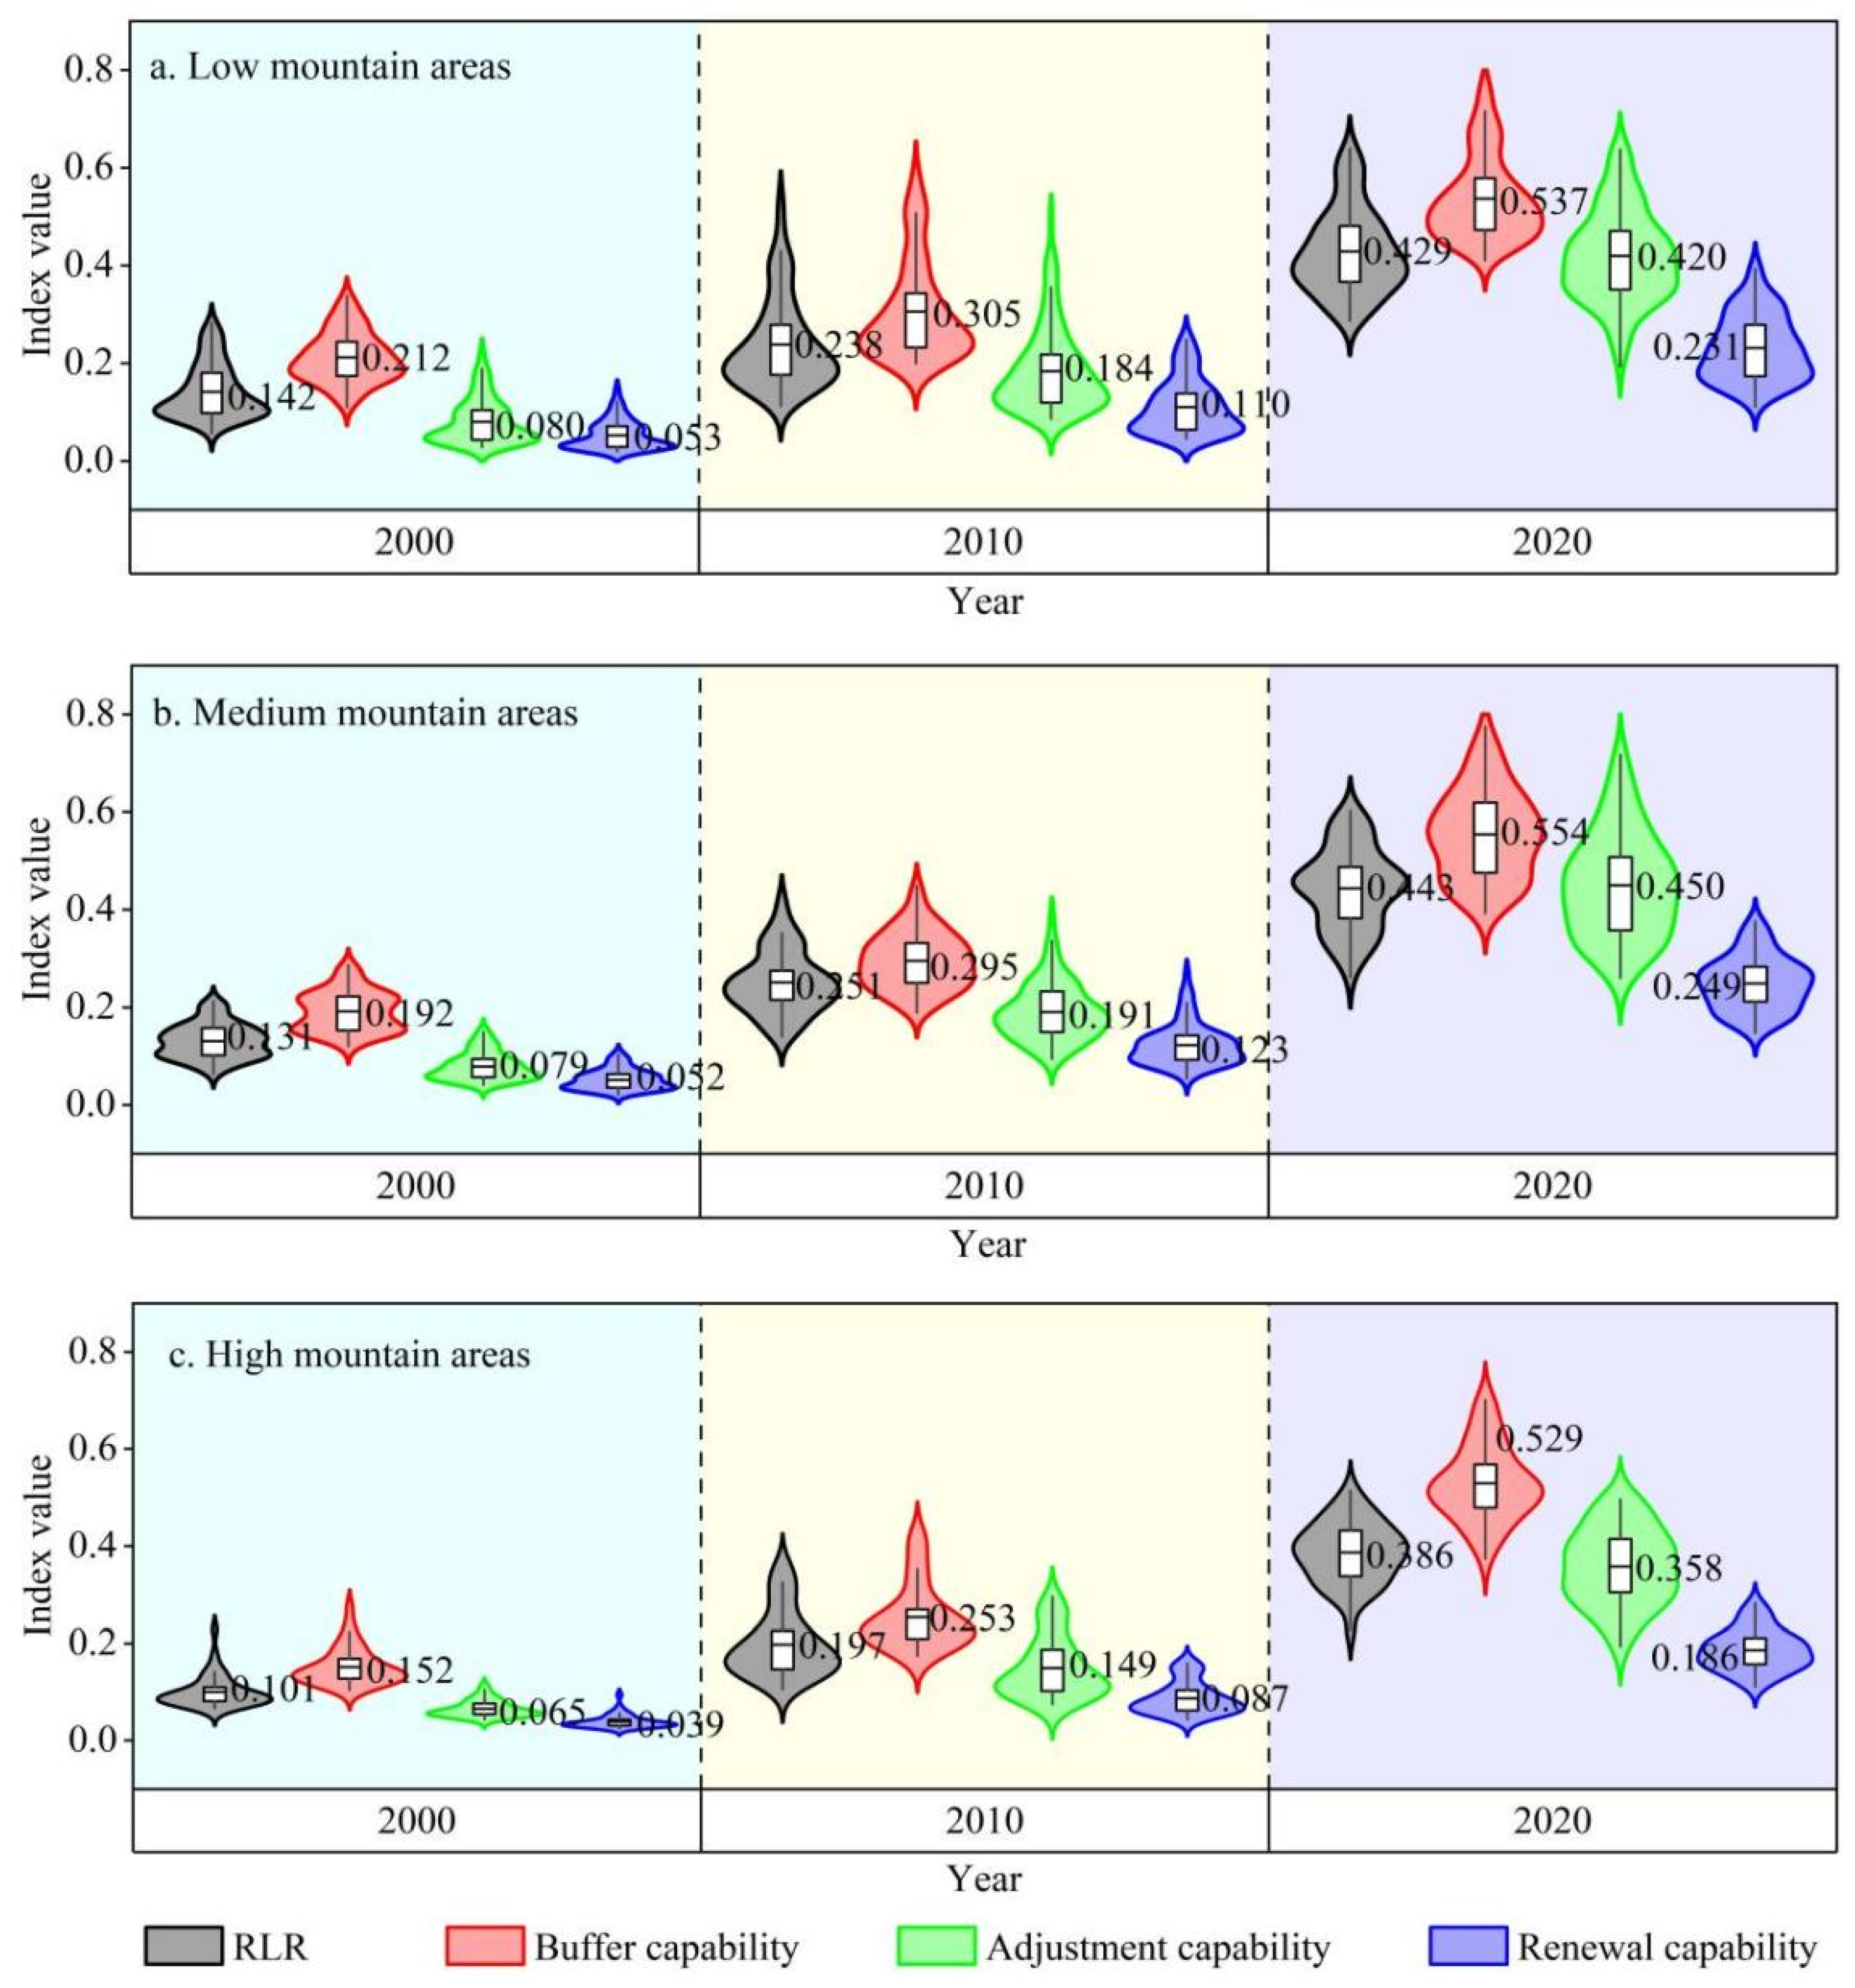
3.2. RLR Presentation in Different Terrain Gradients

To explore the vertical spatial differentiation characteristics of RLR and clarify the RLR presentation in different terrain gradients, the RLR index and buffer, adjustment and renewal capability index of low, medium and high mountain areas from 2000 to 2020 were compared and analyzed. It was discovered that there were variations and gaps in the RLR and differing capabilities over different terrain gradients and that these variations and gaps were ever-changing (Figure 5).
In low mountain areas, the respective average annual growth rates of RLR, buffering capability, adjustment capability and renewal capability are 5.99%, 5.01%, 9.12% and 8.06%. It can be observed that there exists a phenomenon of low-value clustering in various indices; that is, the clustering intervals of the various indices are significantly lower than the average value, which is particularly evident in 2010 and 2020. There were also small-scale high-value clusters in various indices in 2010 and 2020. Further investigation into the reasons for this reveals that the samples of high-value clustering are predominantly the counties in Chongqing Municipality and Sichuan Province, while the samples of low-value clustering are mainly the counties in Guizhou Province. This is attributed to the low level of socioeconomic development associated with Guizhou, resulting in a poorer basis for the formation of rural livelihood systems.
In medium mountain areas, the respective average annual growth rates of RLR, buffering capability, adjustment capability and renewal capability are 6.62%, 5.74%, 9.59% and 8.59%, all of which are higher than those in low mountain areas. This leads to the various indices in medium mountain areas outstripping those in low mountain areas in 2010 and 2020. In contrast, the various indices within the medium mountain areas are relatively equilibrated; that is, the index values are clustered around the average value. This may be due to the fact that 70.73% of the sample counties are located in Yunnan, and these areas have relatively favorable natural conditions for agricultural development and a stable and rapid rate of economic development.
In high mountain areas, the average annual growth rates of RLR, buffer capability, adjustment capability and renewal capability are 7.31%, 6.78%, 9.40% and 8.57%, respectively. However, due to weak foundations, the various indices in high mountain areas are significantly lower than those in low and medium mountain areas. Among them, the buffer capacity has increased by 250.33% in the past 20 years, significantly narrowing the gaps between low and medium mountain areas. However, the development of the adjustment and renewal capability is relatively slow, and the gaps between low and medium mountain areas are gradually widening. This shows that rural livelihood systems in high mountain areas can buffer some shocks when facing risks, but it is difficult to effectively self-adjust to repair damage, not to mention breaking out of the original development pattern.

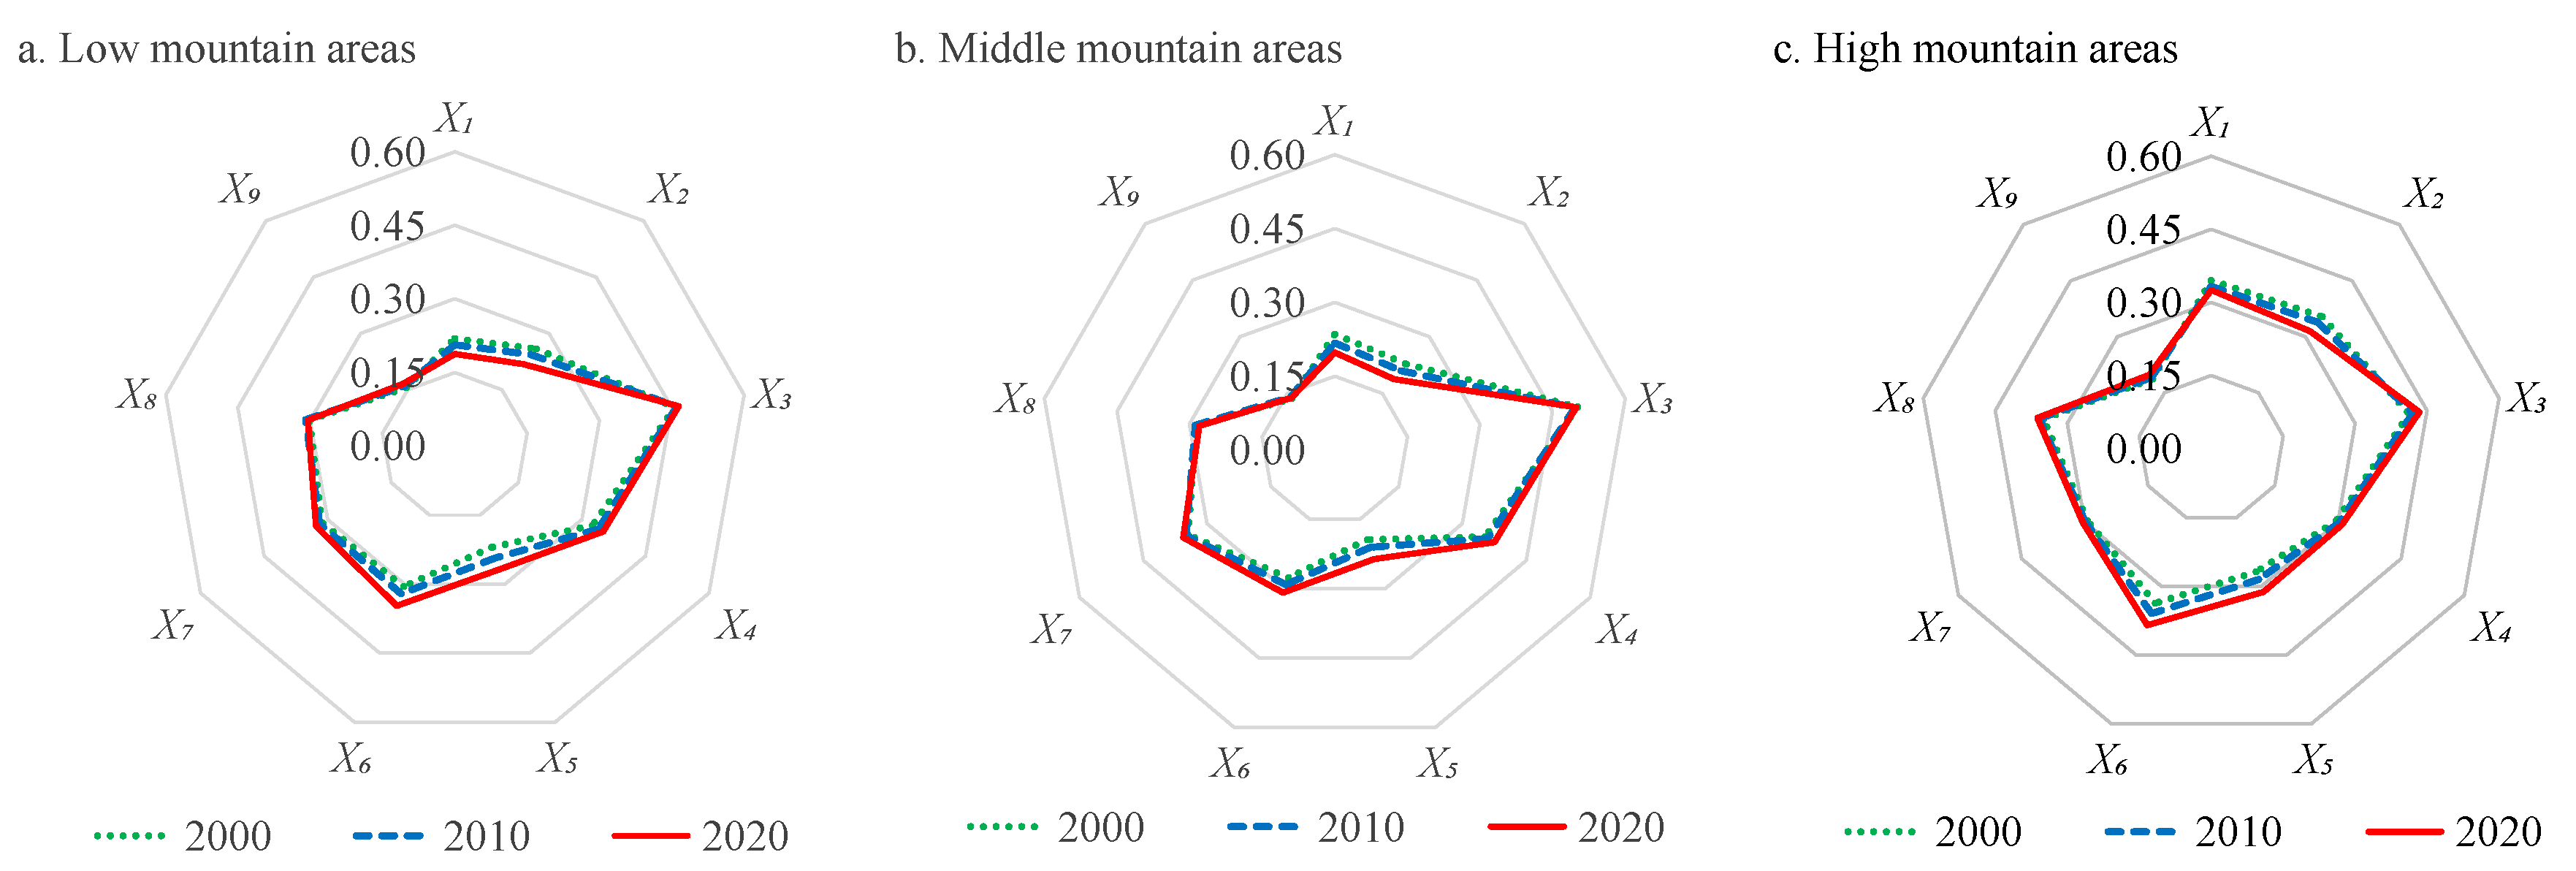
3.3. Influencing Factors of RLR

Through Pearson correlation analysis, the Pearson correlation coefficients of nine influencing factors in 2000, 2010 and 2020 were calculated (Table 2). The results show that factors X1 and X2 are negative, indicating that slope and location have a negative impact on RLR, and factors X3, X4, X5, X6, X7, X8 and X9 are positive, indicating that economic foundation, industrial diversity and social public services have a promoting effect on RLR. Among these, X2, X3, X4, X7 and X8 passed significance tests in the years 2000, 2010 and 2020, and the correlation coefficients and significance levels were constantly changing, indicating that RLR is dynamically influenced by multiple factors.
To verify the robustness of the Pearson correlation analysis, Geodetector was further used to analyze the explanatory power of these factors. The results of the factor detector (Table 3) show that X1, X2, X3, X4, X6, X7 and X8 have passed the significance test, and in terms of the explanatory power (q-value), in 2000, X3 > X2 > X7 > X4 > X8 > X1 > X6; in 2010, X3 > X4 > X7 > X8 > X2 > X6 > X1; in 2020, X3 > X7 > X4 > X6 > X8 > X2 > X1. The explanatory power and significance of X3 and X4 have always been relatively strong. The explanatory power of X6, X7 and X8 has increased, while the explanatory power and significance of X1 and X2 have weakened. This indicates that the economic foundation plays an important driving role in RLR, the influence of industrial diversity and social public services is gradually increasing and the influence of the geographical environment is constantly decreasing. Combining the results of the Pearson correlation coefficients and factor detector analysis further reveals that economic development, transportation conditions, non-agricultural industries, grassroots autonomous organizations and medical conditions are the key influencing factors of RLR.
The results of the interaction detector (Figure 6) show that the explanatory power for RLR generated by the pairwise interaction of the nine factors was significantly increased in 2020. Among the 36 interactions, 14 manifested as “enhanced, double factors” (q(Xn∩Xm) > Max(q(Xn),q(Xm))), and 22 manifested as “enhanced, nonlinear” (q(Xn∩Xm) > q(Xn) + q(Xm)) [56], with no weakening or independence. This further confirms that the spatial heterogeneity of RLR is the result of the combined effect of multiple factors, and any combination of two factors have a greater impact than a single factor. In particular, X3, X6 and X7, when superimposed on the other factors, their interaction explanatory power (q-values) always exceeds 0.7. This indicates that X3, X6 and X7 have significant additive effects on the other factors and further reveals that economic development, non-agricultural industries and grassroots autonomous organizations are essential determinants for RLR in the mountainous areas of Southwest China.
The factor detector was used to determine the explanatory power of various influencing factors on various terrain gradients to investigate the variations in the impact of nine influencing factors on RLR in low, medium and high mountain areas. The results (Figure 7) show that, in low mountain areas, the economic foundation (X3 and X4) is a key driving force for RLR, and the explanatory power of non-agricultural industries (X6) and rural autonomous networks (X7) is relatively strong; the situations in the medium and low mountain areas are similar. In contrast, in the medium mountain areas, the driving effect of the economic foundation is more obvious, and the explanatory power of rural autonomous networks is stronger, while the industrial diversity (X5 and X6) is relatively weak; in the high mountain areas, the economic foundation remains important, and the explanatory power of industrial diversity has significantly increased and is playing an increasingly vital promoting role. Furthermore, the negative impact of the geographical environment (X1 and X2) is more pronounced, and the explanatory power of medical services (X8) is relatively high.

4. Discussion

4.1. Evolution and Vertical Spatial Differentiation of RLR

The study found that the RLR in the mountainous areas of Southwest China continued to increase, with a particularly significant increase from 2010 to 2020. The main reason is that, since the 18th National Congress of the Communist Party of China in 2012, the Chinese government has attached great importance to poverty alleviation [58]. As one of the most representative areas of poverty in China, the southwestern mountainous areas have experienced rapid rural economic and social progress under a series of intensive support measures. This has made it possible to significantly improve fiscal revenue and expenditure, infrastructure, agricultural production capability, market regulatory capability and the endogenous driving force of farmers [42,59,60]. All of these improvements have laid the groundwork for future improvements in RLR. However, due to the severely weak development foundation, the level of RLR is still relatively low, with a particularly insufficient renewal capability.
The study also found that there was no statistically significant negative correlation between the RLR and topographic gradient in the mountainous areas of Southwest China. In particular, there was no significant gap between the RLR in the low and medium mountainous areas. This phenomenon is distinct from the general law of significant negative correlation between socioeconomic development and terrain gradient that has been observed in the entire country or some plain and hilly areas [29,31,32,61]. The potential explanations for this phenomenon are (1) the specificity of the natural environment. Over 70% of counties in low mountain areas are situated in the typical karst area of the Yunnan–Guizhou Plateau, which is one of the largest karst landform concentrated distribution areas in the world (mainly including Eastern Yunnan, most of Guizhou and Southeast Chongqing). Due to its fragile ecological environment, scarce arable land resources, infertile soil and severe rocky desertification, the foundation of agricultural development is weak [62,63]. (2) The underdevelopment of industries in low mountain areas. Agricultural development is limited by the natural environment, and the secondary and tertiary industries have failed to fully play the role in promoting the increase in farmers’ income, which further makes it difficult for the RLR to achieve high-quality growth.
In comparison, despite the relatively high terrain gradient in medium mountain areas, numerous small basins suitable for production and habitation have formed among the mountains, thereby creating relatively favorable natural conditions for farmers’ livelihoods [64]. Furthermore, over 70% of the counties in these areas are distributed in Yunnan, where social and economic indicators such as per capita GDP, per capita disposable income of rural residents and the government’s fiscal revenue and expenditure have been consistently higher than those in Guizhou over the past nearly 20 years. Benefiting from this, the RLR in medium mountain areas has shown rapid growth, resulting in a slightly higher growth than in the low mountainous areas in 2010 and 2020. In addition, the polarization of RLR in low mountain areas can be observed from the results. Further exploration reveals that the high-value samples are distributed in Northern Chongqing and Northern Sichuan. This is not a typical karst region and has a clear location advantage due to its proximity to the provincial capital.
Regarding the markedly reduced RLR in the high mountain areas, this is a result of the harsh natural geography superimposed on the backward socioeconomic development. Agriculture development is hampered by uneven and fractured terrain, which makes large-scale agricultural equipment impractical. At the same time, most of the areas there are planned by the government as restricted and prohibited development zones due to their ecological sensitivity, making large-scale secondary industries impossible. Local government revenues are overly dependent on allocations from the central government, and the serious imbalance between fiscal revenues and expenditures leads to insufficient adjustment capability and weak renewal capability. Zhao et al. [38] and Sun et al. [18] also observed the acute scarcity of rural production and living infrastructure, as well as social public services, in high-altitude areas. Furthermore, most farmers have poor levels of education, a severe lack of science and technology and little motivation for urbanization [21]. All these factors limit the potential for the development of rural livelihood systems in high mountain areas.

4.2. Key Influencing Factors of RLR

This study found that, while the geographical environment has exerted a certain influence on RLR in the mountainous areas of Southwest China, this impact is becoming increasingly attenuated. The impact of socioeconomic development is demonstrably increasing and has become a key driving force for RLR. Similarly, Wang et al. [65] and Qin et al. [66] also observed that the rapid development of infrastructure in mountainous areas is reducing the constraints of natural conditions on sustainable rural development. This indicates that socioeconomic prosperity is the foundation and key to sustainable rural development and sustainable livelihood. However, topographic relief and geographic location, as limiting factors for socioeconomic development, still have a profound impact on high mountain areas.
In terms of economic foundation, per capita gross domestic product (economic development) and road density (transportation conditions) are consistently important driving forces of RLR. Ranjan [67] also disclosed that the developed social and economic situation could establish a good development environment for farmers’ livelihoods, thereby offering more opportunities to accumulate livelihood capital and optimize livelihood strategies. Pandey et al. [68] demonstrated that convenient transportation and information flow are significant supports for the sustainable development of mountain villages, conducive to strengthening the connections among rural households, local governments and investors.
In terms of industrial diversification, the non-agricultural industries are progressively exerting a crucial promoting impact on RLR, especially in high mountain areas. This is in line with the previous studies’ findings that part-time households typically have greater livelihood resilience than farming households [69,70]. The rational transfer of farmers from agriculture to non-agricultural industries not only broadens the income sources and boosts the government’s fiscal revenue but also enables farmers to enhance their learning ability and livelihood skills. The high mountain areas in Western Sichuan and Northeastern Yunnan boast magnificent natural landscapes and unique ethnic customs. The tourism has developed rapidly due to the availability of highly attractive tourism resources. To increase their income, many farmers have entered the tourism sector, and government departments have also regarded thriving tourism as an important way to promote socioeconomic development [71], which has greatly improved the RLR. However, the tourism industry has not significantly enhanced the adjustment and renewal capabilities, indicating that a single non-agricultural industry mainly based on tourism cannot drive the high-quality development of RLR. Some studies have also noted that the vulnerability and instability of the tourism industry to external shocks bring more uncertainties to the development of RLR in high mountain areas [72,73].
In terms of social public services, both the number of grassroots autonomous organizations and the per capita beds in medical institutions play a key role. The influence of grassroots autonomous organizations is particularly pronounced in low and medium mountain areas. The potential reason is that the rural population is relatively large and concentrated, allowing them to play a more effective role in self-organization when encountering external disturbances. The influence of medical conditions is more evident in high mountain areas. The reason is that these areas are large and sparsely inhabited, so the high-quality medical services are concentrated in a small number of localities with better socioeconomic circumstances, which deepens the already existing disparity in the standard of healthcare provided in rural and urban areas [45].

4.3. Policy Implications

In today’s uncertain world, improving the RLR of underdeveloped mountainous rural areas is undoubtedly of great significance for sustainable rural development and farmers’ livelihoods. Based on the scientific analysis of the evolution, vertical spatial differentiation and key influencing factors of RLR, combined with the differences in the natural environment and socioeconomic development of different terrain gradients, some targeted policy implications are suggested:
  • Extending the agricultural industry chain to promote efficient rural socioeconomic development. Agriculture is the pillar industry in rural areas, and farmers are the main labor force in agriculture; therefore, upgrading the RLR should be based on agricultural development [44]. In low mountain areas, especially typical karst areas, large-scale and professional animal husbandry (livestock and poultry) should be developed in villages unsuitable for planting; in medium mountain areas, the modern planting industry (e.g., vegetables, tea, flowers, fruits, walnuts, coffee and edible fungi) can be advanced by virtue of the unique low-latitude plateau climate in small mountain basins; in high mountain areas, cold-hardy cash crops (e.g., Chinese herbs, barley, potatoes and rapeseed) and specialty animal husbandry (e.g., yaks, Tibetan pigs and Tibetan chickens) should be encouraged to be planted and farmed in combination with forest and grassland conservation. Based on agricultural development, secondary and tertiary industries such as organic food processing, agricultural product circulation, rural tourism and agricultural insurance should be developed to promote the efficient integration of the primary, secondary and tertiary industries and improve industrial diversity [20,69]. Industrial and commercial capital should also be strongly supported to enter rural industries.
  • Improving rural production and living infrastructure. Increase the financial investment and social capital to encourage rural infrastructure construction and compensate for deficiencies in transportation and logistics, agricultural water conservation, information networks and basic energy in mountainous rural areas [18,27,38]. In low mountain areas, the emphasis should be placed on developing all-encompassing programs to prevent rocky desertification, fortifying rural and agricultural water supply systems, utilizing advanced technology to construct multipurpose methane digesters and enhancing rural logistics and transportation systems; in medium mountain areas, efforts should be made to upgrade the level of agricultural machinery and equipment, increase the degree of automation and the technological content of agriculture and build high-standard farmland; in high mountain areas, the focus should be on improving the standard of rural roads and firmly pushing the all-encompassing project to enhance the rural environment. Relocating rural households to locations with better natural conditions and infrastructure is necessary when it comes to highly unfriendly rural areas.
  • Enhancing the supply of high-quality social public services. It is necessary to establish a fair and sustainable public service system, so that farmers can enjoy more reliable social security; better quality education; higher levels of medical care; more employment opportunities and stronger rural disaster prevention, mitigation and relief capabilities [4,17,45]. In low and medium mountain areas, it is recommended that reliance be placed on grassroots autonomous organizations to organize regular knowledge and skills training by industry employment needs and to export the labor force from villages with a larger population in an organized manner. In high mountain areas, it is essential to maintain a high standard of medical and healthcare provision. Furthermore, the introduction of family doctor services should be considered.

5. Conclusions

In this study, a RLR evaluation framework was constructed that integrates the buffer, adjustment and renewal capabilities. The RLR of 234 out-of-poverty counties in the mountainous regions of Southwest China was quantitatively evaluated by using set-pair analysis, and the influencing factors of the RLR were further investigated by using Geodetector, which aims to scientifically analyze the vertical spatial differentiation and influencing factors of RLR based on the terrain gradients. The findings of the study are shown below:
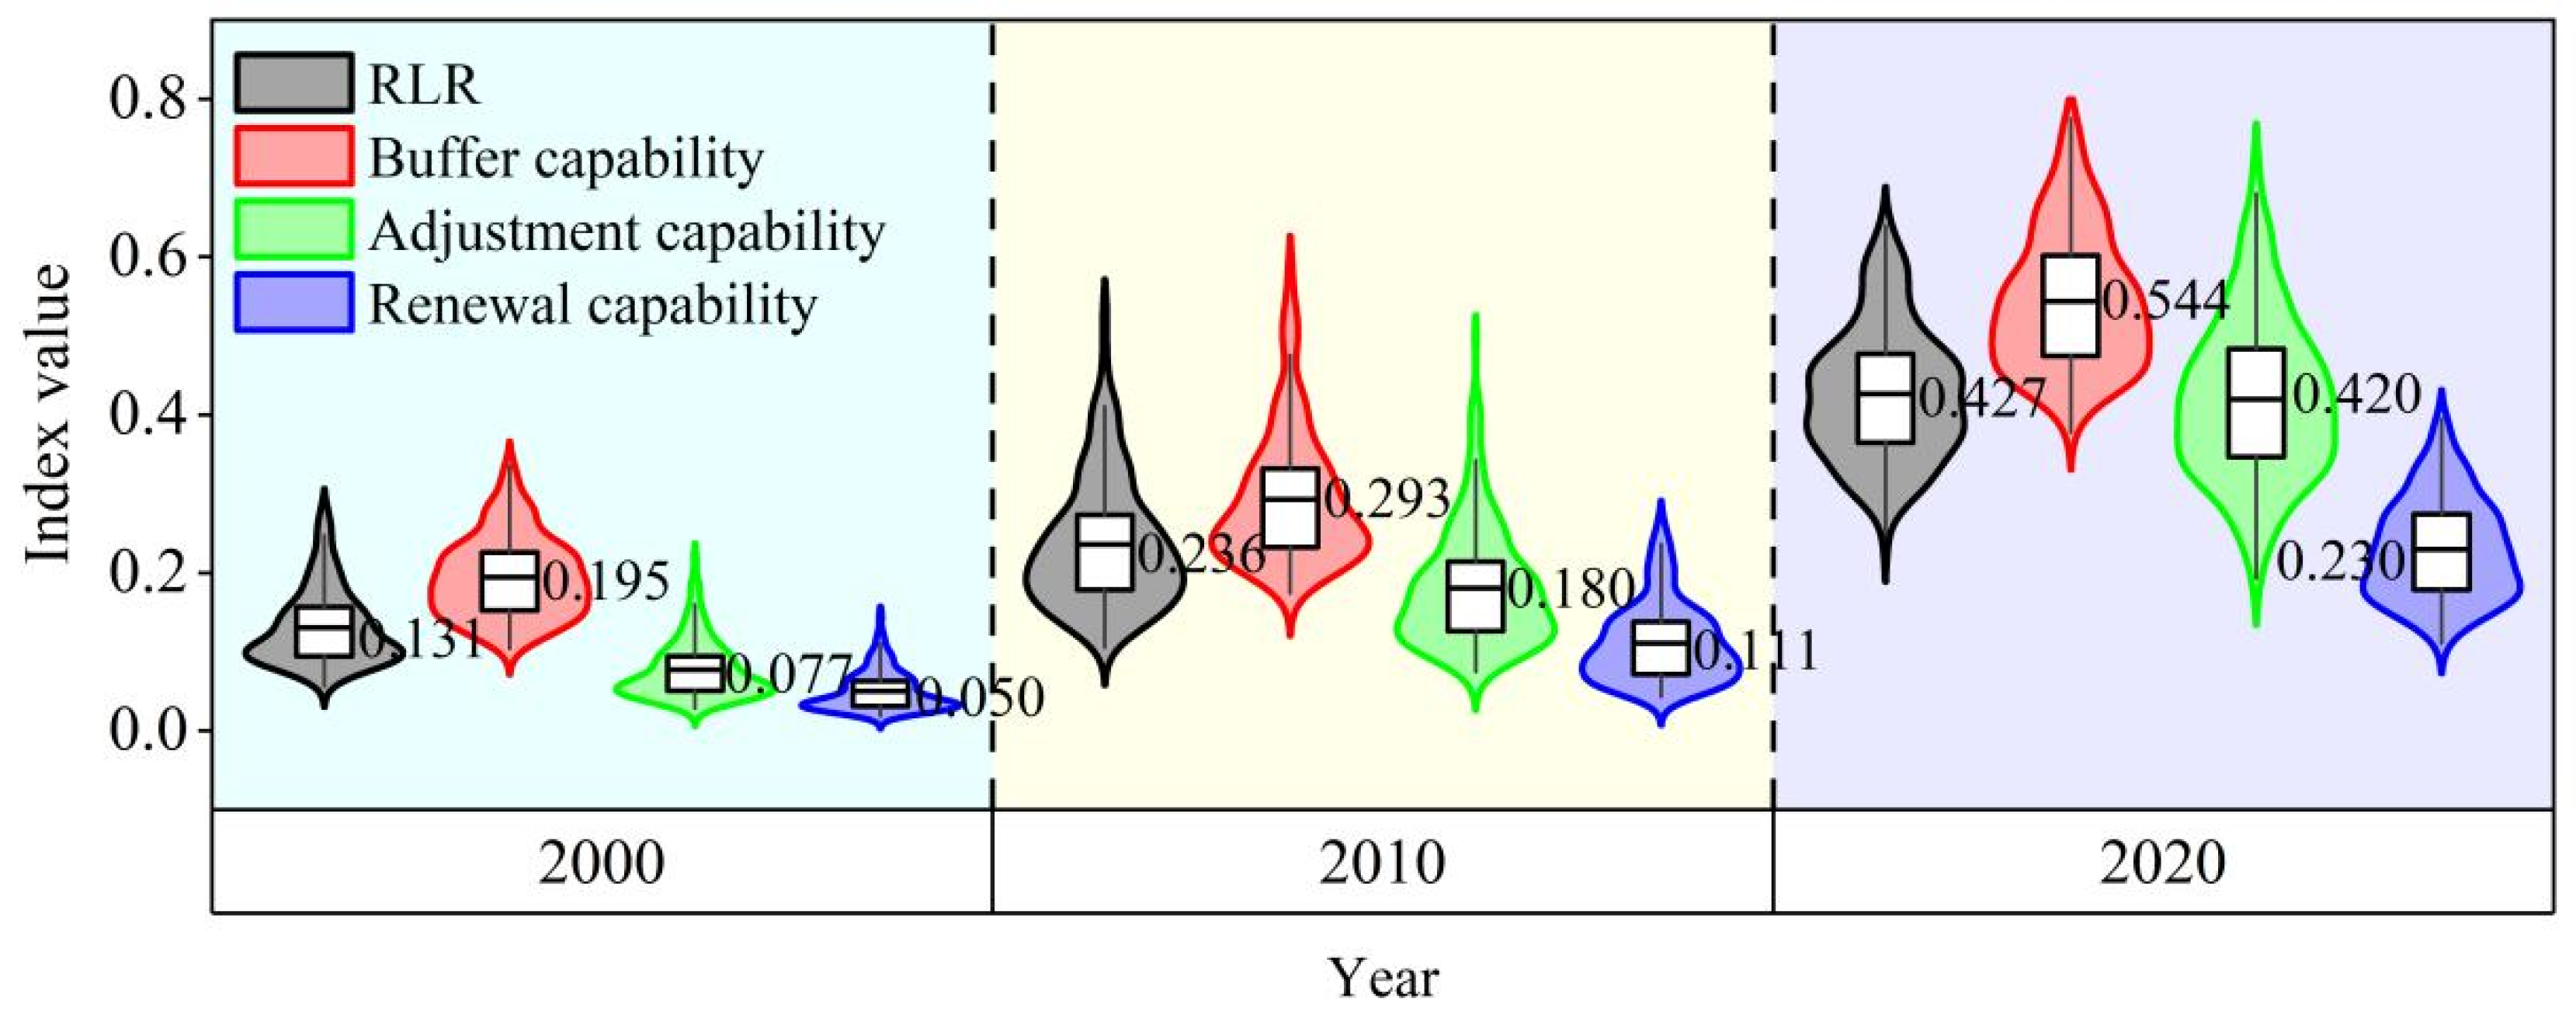
  • From 2000 to 2020, the RLR in the mountainous areas of Southwest China has improved significantly, with the average value of the RLR index growing from 0.131 to 0.427; however, its level is still low. The RLR structure has consistently demonstrated a primary pattern of “buffering capability > adjustment capability > renewal capability”. The renewal capability is much lower than the buffer and adjustment capabilities, which has become a barrier to the high-quality development of RLR.
  • RLR in the mountainous areas of Southwest China does not show a strict negative correlation with the terrain gradients. This is, to some extent, a deviation from the general law that socioeconomic development is significantly negatively correlated with terrain gradients. The RLR in high mountain areas is lower than that in medium and low mountain areas; however, there are no significant gaps in the RLR and various capabilities between low and medium mountain areas. Even the RLR and capacities in medium mountains are outpacing those in low mountains with rapid growth. The reasons for this phenomenon can be reasonably explained by the unique geographical and resource endowments and the actual socioeconomic development of these areas.
  • RLR heterogeneity is the result of the coupling of multiple factors. The geographical environment is becoming less significant, industrial diversity and social public services are becoming more significant and the economic foundation has always been a key driving force of RLR. Economic development, non-agricultural industries and grassroots autonomous organizations are the essential determinants for RLR. Economic development, grassroots autonomous organizations and transportation conditions are more important in low and medium mountain areas, while non-agricultural industries and medical conditions contribute more to high mountainous areas.
  • To enhance the RLR and fully tap into the risk resistance potential of rural livelihood systems, local governments can focus their policies on extending the agricultural industry chain to integrate the primary, secondary and tertiary industries effectively and promoting efficient rural socioeconomic development; improving rural production and living infrastructure and compensating for deficiencies in transportation, agricultural water conservation, information networks and basic energy in mountainous rural areas and enhancing the supply of high-quality social public services and establishing a fair and sustainable social public service system.
The findings reveal that there is not necessarily a strict positive correlation between the RLR and topographic gradients. Socioeconomic elements are becoming more and more influential on the RLR, and the influence of different factors on different terrain gradients also varies. This provides theoretical and practical guidance for fully tapping into the risk-resistant potential of underdeveloped mountainous rural areas. However, some indicators utilize county-level data due to conflicting statistical standards and limited data availability, resulting in no clear demarcation between urban and rural areas. These data may introduce a tiny amount of bias into the conclusions, although they can partially express crucial characteristics of rural livelihood resilience. It needs to be improved by using data from field surveys in later studies.

Author Contributions

Conceptualization, S.Z.; Methodology, S.Z. and Y.K.; Software, S.Z.; Formal analysis, S.Z. and Q.L.; Investigation, S.Z. and Y.W.; Funding acquisition, J.S.; Supervision, J.S.; Writing—original draft preparation, S.Z.; Writing—review and editing, S.Z. and Q.L.; Validation, Y.W. and Z.X.; Data curation, S.Z., Y.X. and G.Z. All authors have read and agreed to the published version of the manuscript.

Funding

This research was supported by the National Natural Science Found of China: 52168001, National Social Science Fund of China: 20FZSB006, Yunnan Revitalization Talent Support Program in Yunnan Province: XDYC-WHMJ-2022-0016 and XDYC-WHMJ-2023-0012, Yunnan Fundamental Research Project: 202401AS070037 and the Key Project of Yunnan Normal University Graduate Research Innovation Fund: YJSJJ24-A18.

Institutional Review Board Statement

Not applicable.

Informed Consent Statement

Not applicable.

Data Availability Statement

The datasets presented in this article are not readily available, because the data are part of an ongoing study. Requests to access the datasets should be directed to the official websites of the National Bureau of Statistics of China, Yunnan Province, Guizhou Province, Sichuan Province and Chongqing Municipality https://www.stats.gov.cn/; http://stats.yn.gov.cn/; http://stjj.guizhou.gov.cn/; http://tjj.sc.gov.cn/; http://tjj.cq.gov.cn/ (accessed on 11 April 2024).

Conflicts of Interest

The authors declare that they have no conflicts of interest.

References

  1. Biggs, E.M.; Bruce, E.; Boruff, B.; Duncan, J.M.A.; Horsley, J.; Pauli, N.; McNeill, K.; Neef, A.; Van Ogtrop, F.; Curnow, J.; et al. Sustainable development and the water-energy-food nexus: A perspective on livelihoods. Environ. Sci. Policy 2015, 54, 389–397. [Google Scholar] [CrossRef]
  2. Long, H.L.; Ma, L.; Zhang, Y.N.; Qu, L.L. Multifunctional rural development in China: Pattern, process and mechanism. Habitat Int. 2022, 121, 102530. [Google Scholar] [CrossRef]
  3. Chen, C.; Woods, M.; Chen, J.L.; Liu, Y.Q.; Gao, J.L. Globalization, state intervention, local action and rural locality reconstitution—A case study from rural China. Habitat Int. 2019, 93, 102052. [Google Scholar] [CrossRef]
  4. Su, F.; Luo, J.Q.; Zhu, X.Q.; Tong, L.; Zheng, Y.Y.; Xie, Y.J. Study on Measurement and Influencing Factors of Livelihood Resilience in Rural Areas of Hubei Province. Adv. Earth Sci. 2021, 36, 1117–1126. [Google Scholar]
  5. Li, Y.H. A systematic review of rural resilience. China Agric. Econ. Rev. 2023, 15, 66–77. [Google Scholar] [CrossRef]
  6. Manyena, S.B. The concept of resilience revisited. Disasters 2006, 30, 433–450. [Google Scholar] [CrossRef]
  7. Holling, C.S. Resilience and stability of ecological systems. Annu. Rev. Ecol. Syst. 1973, 4, 1–23. [Google Scholar] [CrossRef]
  8. Wu, J.; Wu, T. Ecological Resilience as a Foundation for Urban Design and Sustainability. Resil. Ecol. Urban Des. 2013, 3, 211–229. [Google Scholar]
  9. Chaffin, B.C.; Scown, M. Social-ecological resilience and geomorphic systems. Geomorphology 2018, 305, 221–230. [Google Scholar] [CrossRef]
  10. Wang, Z.X.; Wei, W. Regional economic resilience in China: Measurement and determinants. Reg. Stud. 2021, 55, 1228–1239. [Google Scholar] [CrossRef]
  11. Gaillard, J.C. Vulnerability, capacity and resilience: Perspectives for climate and development policy. J. Int. Dev. 2010, 22, 218–232. [Google Scholar] [CrossRef]
  12. Fan, W.R.; Lv, W.Q.; Wang, Z.X. How to measure and enhance the resilience of energy systems? Sustain. Prod. Consum. 2023, 39, 191–202. [Google Scholar] [CrossRef]
  13. Cote, M.; Nightingale, A.J. Resilience thinking meets social theory: Situating social change in socio-ecological systems (SES) research. Prog. Hum. Geogr. 2011, 36, 475–489. [Google Scholar] [CrossRef]
  14. Marschke, M.J.; Berkes, F.E. Exploring strategies that build livelihood resilience: A case from Cambodia. Ecol. Soc. 2006, 11, 42. [Google Scholar] [CrossRef]
  15. Liu, W.; Li, J.; Ren, L.J.; Xu, J.; Li, C.; Li, S.Z. Exploring Livelihood Resilience and Its Impact on Livelihood Strategy in Rural China. Soc. Indic. Res. 2020, 150, 977–998. [Google Scholar] [CrossRef]
  16. Speranza, C.I.; Wiesmann, U.; Rist, S. An indicator framework for assessing Livelihood resilience in the context of social-ecological dynamics. Glob. Environ. Chang. 2014, 28, 109–119. [Google Scholar] [CrossRef]
  17. Li, T.; Cai, S.H.; Singh, R.K.; Cui, L.Z.; Fava, F.; Tang, L.; Xu, Z.H.; Li, C.J.; Cui, X.Y.; Du, J.Q.; et al. Livelihood resilience in pastoral communities: Methodological and field insights from Qinghai-Tibetan Plateau. Sci. Total Environ. 2022, 838, 155960. [Google Scholar] [CrossRef]
  18. Sun, Y.; Zhao, X.Y. Evolution of Livelihood Resilience and Its lnfluencing Factors of Out-of-Poverty Farmers in Longnan Mountainous Area. Sci. Geogr. Sin. 2022, 42, 2160–2169. [Google Scholar]
  19. Mavhura, E. Applying a systems-thinking approach to community resilience analysis using rural livelihoods: The case of Muzarabani district, Zimbabwe. Int. J. Disaster Risk Reduct. 2017, 25, 248–258. [Google Scholar] [CrossRef]
  20. Zhang, Y.; Xie, X.Y.; Qiu, X.P.; Jing, Z.; Yu, Y.Q.; Wang, Y. Study on Livelihood Resilience of Rural Residents under the Rural Revitalization Strategy in Ethnic Areas of Western Sichuan, China. Agriculture 2023, 13, 1957. [Google Scholar] [CrossRef]
  21. Li, H.B. Rural Settlements Research from the Perspective of Resilience Theory. Sci. Geogr. Sin. 2020, 40, 556–562. [Google Scholar]
  22. Fang, Y.P.; Zhu, F.B.A.; Qiu, X.P.; Zhao, S. Effects of natural disasters on livelihood resilience of rural residents in Sichuan. Habitat Int. 2018, 76, 19–28. [Google Scholar] [CrossRef]
  23. Nugraha, A.T.; Zahara, S.; Suhartini, W.; Zahid, U.; Hlahla, J. The Role of Social Capital on Community Resilience in Rural Areas:ACase Study in Ponggok Village, Indonesia. J. Reg. Rural Stud. 2024, 2, 1–14. [Google Scholar]
  24. Li, H.B.; Jin, X.B.; Liu, J.; Feng, D.Y.; Xu, W.Y.; Zhou, Y.K. Analytical framework for integrating resources, morphology, and function of rural system resilience-An empirical study of 386 villages. J. Clean. Prod. 2023, 365, 132738. [Google Scholar] [CrossRef]
  25. Zhao, X.; Xiang, H.X.; Zhao, F.F. Measurement and Spatial Differentiation of Farmers’ Livelihood Resilience Under the COVID-19 Epidemic Outbreak in Rural China. Soc. Indic. Res. 2023, 166, 239–267. [Google Scholar] [CrossRef]
  26. Geng, Y.W.; Li, X.S.; Chen, W.Q.; Liu, X.Z.; Chen, J.Q.; Ji, H.T. Identification of rural regional system resilience types and driving mechanism: Taking Suiyang District, Shangqiu City as an example. Prog. Geogr. 2023, 42, 1755–1768. [Google Scholar] [CrossRef]
  27. Ding, J.J.; Wang, Z.; Liu, Y.H.; Yu, F.W. Measurement of economic resilience of contiguous poverty-stricken areas in China and influencing factor analysis. Prog. Geogr. 2020, 39, 924–937. [Google Scholar] [CrossRef]
  28. Meybeck, M.; Green, P.; Vorosmarty, C. Comments: A New Typology for Mountains and Other Relief Classes: An Application to Global Continental Water Resources and Population Distribution. Mt. Res. Dev. 2001, 21, 34–45. [Google Scholar] [CrossRef]
  29. Zhang, J.J.; Zhu, W.B.; Zhu, L.Q.; Cui, Y.P.; He, S.S.; Ren, H. Topographical relief characteristics and its impact on population and economy: A case study of the mountainous area in western Henan, China. J. Geogr. Sci. 2019, 29, 598–612. [Google Scholar] [CrossRef]
  30. Milan, A.; Ho, R. Livelihood and migration patterns at different altitudes in the Central Highlands of Peru. Clim. Dev. 2014, 6, 69–76. [Google Scholar] [CrossRef]
  31. Feng, Z.M.; Tang, Y.; Yang, Y.Z.; Zhang, D. Relief degree of land surface and its influence on population distribution in China. J. Geogr. Sci. 2008, 18, 237–246. [Google Scholar] [CrossRef]
  32. Feng, Z.M.; Zhang, D.; Yang, Y.Z. Relief Degree of Land surface in China at County Level Based on Gls and Its Correlation between Population Density and Economic Development. Jilin Univ. J. Soc. Sci. Ed. 2011, 51, 146–151, 160. (In Chinese) [Google Scholar]
  33. Li, Y.H.; Huang, H.Q.; Wang, S.Y. Path of Urban-Rural Integrated Development in Traditional Agricultural Zones Based on Rural Economic Resilience: The Study of Typical Counties of Hebei Province. Econ. Geogr. 2021, 41, 28–33, 44. [Google Scholar]
  34. Cui, Z.Z.; Li, E.R.; Li, Y.H.; Deng, Q.Q.; Shahtahmassebi, A. The impact of poverty alleviation policies on rural economic resilience in impoverished areas: A case study of Lankao County, China. J. Rural Stud. 2023, 99, 92–106. [Google Scholar] [CrossRef]
  35. Zhou, J.; Chen, H.P.; Bai, Q.Y.; Liu, L.X.; Li, G.H.; Shen, Q.L. Can the Integration of Rural Industries Help Strengthen China’s Agricultural Economic Resilience? Agriculture 2023, 13, 1813. [Google Scholar] [CrossRef]
  36. Datola, G. Implementing urban resilience in urban planning: A comprehensive framework for urban resilience evaluation. Sustain. Cities Soc. 2023, 98, 104821. [Google Scholar] [CrossRef]
  37. Tang, D.C.; Li, J.N.; Zhao, Z.Q.; Boamah, V.; Lansana, D.D. The influence of industrial structure transformation on urban resilience based on 110 prefecture-level cities in the Yangtze River. Sustain. Cities Soc. 2023, 96, 104621. [Google Scholar] [CrossRef]
  38. Zhao, X.Y.; Chen, H.H.; Zhao, H.L.; Xue, B. Farmer households’ livelihood resilience in ecological-function areas: Case of the Yellow River water source area of China. Environ. Dev. Sustain. 2021, 24, 9665–9686. [Google Scholar] [CrossRef]
  39. DFID. Sustainable Livelihoods Guidance Sheets; Department for International Development: London, UK, 2000; pp. 68–125. [Google Scholar]
  40. Nasrnia, F.; Ashktorab, N. Sustainable livelihood framework-based assessment of drought resilience patterns of rural households of Bakhtegan Basin, Iran. Ecol. Indic. 2021, 128, 107817. [Google Scholar] [CrossRef]
  41. Fang, Y.; Fan, J.; Shen, M.; Song, M. Sensitivity of livelihood strategy to livelihood capital in mountain areas: Empirical analysis based on different settlements in the upper reaches of the Minjiang River, China. Ecol. Indic. 2014, 38, 225–235. [Google Scholar] [CrossRef]
  42. Yang, A.X.; Ye, J.Q.; Wang, Y.H. Coupling and Coordination Relationship between Livelihood Capital and Livelihood Stability of Farmers in Different Agricultural Regions. Land 2022, 11, 2049. [Google Scholar] [CrossRef]
  43. Kuang, F.; Jin, J.; He, R.; Ning, J.; Wan, X. Farmers’ livelihood risks, livelihood assets and adaptation strategies in Rugao City, China. J. Environ. Manag. 2020, 264, 110463. [Google Scholar] [CrossRef] [PubMed]
  44. Dang, X.; Gao, S.; Tao, R.; Liu, G.; Xia, Z.; Fan, L.; Bi, W. Do environmental conservation programs contribute to sustainable livelihoods? Evidence from China’s grain-for-green program in northern Shaanxi province. Sci. Total Environ. 2020, 719, 137436. [Google Scholar] [CrossRef] [PubMed]
  45. Zhu, S.J.; Sun, J.; Wu, Y.M.; Yu, B.H.; Li, H.; Xia, T.S.; Zhang, X.M.; Liang, X.Q.; Zhu, G.F. A rural revitalization model based on regional livelihood capital: A case study of Diqing, China. Front. Environ. Sci. 2023, 11, 1116742. [Google Scholar] [CrossRef]
  46. Awazi, N.P.; Quandt, A. Livelihood resilience to environmental changes in areas of Kenya and Cameroon: A comparative analysis. Clim. Chang. 2021, 165, 33. [Google Scholar] [CrossRef]
  47. Sarker, M.N.I.; Cao, Q.; Wu, M.; Hossin, M.A.; Alam, G.M.M.; Shouse, R.C. Vulnerability and Livelihood Resilience in the Face of Natural Disaster: A Critical Conceptual Review. Appl. Ecol. Environ. Res. 2019, 17, 12769–12785. [Google Scholar] [CrossRef]
  48. Wang, R.; Zhao, X.Y. Can Multiple Livelihood Interventions Improve Livelihood Resilience of Out-of-poverty Farmers in Mountain Areas? A Case Study of Longnan Mountain Area, China. Chin. Geogr. Sci. 2023, 33, 898–916. [Google Scholar] [CrossRef]
  49. Dong, Y.; Jin, G.; Deng, X.Z.; Wu, F. Multidimensional measurement of poverty and its spatio-temporal dynamics in China from the perspective of development geography. J. Geogr. Sci. 2021, 31, 130–148. [Google Scholar] [CrossRef]
  50. Zhao, J.C.; Ji, G.X.; Tian, Y.; Chen, Y.L.; Wang, Z. Environmental vulnerability assessment for mainland China based on entropy method. Ecol. Indic. 2018, 91, 410–422. [Google Scholar] [CrossRef]
  51. Su, F.M.; Li, P.Y.; He, X.D.; Elumalai, V. Set Pair Analysis in Earth and Environmental Sciences: Development, Challenges, and Future Prospects. Expo. Health 2020, 12, 343–354. [Google Scholar] [CrossRef]
  52. Tang, Z.P. Evaluation on Chinese provincial resource input and environmental output efficiencies from 2000 to 2015. Geogr. Res. 2018, 37, 1515–1527. [Google Scholar]
  53. Zhong, F.L.; Chen, R.B.; Luo, X.J.; Song, X.Y.; Ullah, A. Assessing regional resilience in China using a sustainable livelihoods approach: Indicators, influencing factors, and the relationship with economic performance. Ecol. Indic. 2024, 158, 111588. [Google Scholar] [CrossRef]
  54. Duan, Y.F.; Chen, S.P.; Zeng, Y.; Wang, X.T. Factors That Influence the Livelihood Resilience of Flood Control Project Resettlers: Evidence from the Lower Yellow River, China. Sustainability 2023, 15, 2671. [Google Scholar] [CrossRef]
  55. Wang, P.J.; Wang, J.; Zhu, C.B.; Li, Y.; Sun, W.J. Factors Influencing Livelihood Resilience of Households Resettled from Coal Mining Areas and Their Measurement—A Case Study of Huaibei City. Land 2024, 13, 13. [Google Scholar] [CrossRef]
  56. Wang, J.F.; Xu, C.D. Geodetector: Principle and prospective. Acta Geogr. Sin. 2017, 72, 116–134. [Google Scholar]
  57. Zhu, L.J.; Meng, J.J.; Zhu, L.K. Applying Geodetector to disentangle the contributions of natural and anthropogenic factors to NDVI variations in the middle reaches of the Heihe River Basin. Ecol. Indic. 2020, 117, 106545. [Google Scholar] [CrossRef]
  58. Liu, Y.S.; Guo, Y.Z.; Zhou, Y. Poverty alleviation in rural China: Policy changes, future challenges and policy implications. China Agric. Econ. Rev. 2018, 10, 241–259. [Google Scholar] [CrossRef]
  59. He, R.W.; Guo, S.L.; Deng, X.; Zhou, K. Influence of social capital on the livelihood strategies of farmers under China’s rural revitalization strategy in poor mountain areas: A case study of the Liangshan Yi autonomous prefecture. J. Mt. Sci. 2022, 19, 958–973. [Google Scholar] [CrossRef]
  60. Liu, Y.S.; Liu, J.L.; Zhou, Y. Spatio-temporal patterns of rural poverty in China and targeted poverty alleviation strategies. J. Rural Stud. 2017, 52, 66–75. [Google Scholar] [CrossRef]
  61. Yang, Z.; Hong, Y.; Guo, Q.B.; Yu, X.X.; Zhao, M.S. The Impact of Topographic Relief on Population and Economy in the Southern Anhui Mountainous Area, China. Sustainability 2022, 14, 14332. [Google Scholar] [CrossRef]
  62. Wu, Q.; Xiao, H.; Song, S.Z.; Li, Q.; Li, R.; Zhang, H.; Zhou, G.F.; Chen, H. Problems and Countermeasures of Agricultural Development in the Karst Area of Southwest China. Fresenius Environ. Bull. 2019, 28, 4247–4255. [Google Scholar]
  63. Li, H.; Liu, Y.F.; Zhao, R.; Zhang, X.F.; Zhang, Z.N. How Did the Risk of Poverty-Stricken Population Return to Poverty in the Karst Ecologically Fragile Areas Come into Being?-Evidence from China. Land 2022, 11, 1656. [Google Scholar] [CrossRef]
  64. Xu, J.; Zheng, L.J.; Ma, R.Q.; Tian, H. Correlation between Distribution of Rural Settlements and Topography in Plateau-Mountain Area: A Study of Yunnan Province, China. Sustainability 2023, 15, 3458. [Google Scholar] [CrossRef]
  65. Wang, Z.L.; E, S.X.; Du, T.; Zhang, L.Y.; Islam, M.; Li, J. Spatial distribution characteristics and influencing mechanism of rural settlements in mountainous areas. Trans. Chin. Soc. Agric. Eng. 2022, 38, 277–285. [Google Scholar]
  66. Qin, Y.; Luo, G.J.; Li, Y.B.; Tan, Q.; Zheng, C.; Yu, M.; Liao, J.J.; Li, M. Assessment of Sustainable Development of Rural Settlements in Mountainous Areas: A Case Study of the Miaoling Mountains in Southwestern China. Land 2022, 11, 1666. [Google Scholar] [CrossRef]
  67. Ranjan, R. How Socio-Economic and Natural Resource Inequality Impedes Entrepreneurial Ventures of Farmers in Rural India. Eur. J. Dev. Res. 2019, 31, 433–460. [Google Scholar] [CrossRef]
  68. Pandey, R.; Kumar, P.; Archie, M.K.; Gupt, A.K.; Joshi, P.K.; Valente, D.; Petrosillo, I. Climate change adaptation in the western-Himalayas: Household level perspectives on impacts and barriers. Ecol. Indic. 2018, 84, 27–37. [Google Scholar] [CrossRef]
  69. Zhou, W.F.; Guo, S.L.; Deng, X.; Xu, D.D. Livelihood resilience and strategies of rural residents of earthquake-threatened areas in Sichuan Province, China. Nat. Hazards 2021, 106, 255–275. [Google Scholar] [CrossRef] [PubMed]
  70. Zhu, J.G.; Sun, Y.R.; Song, Y.X. Household Livelihood Strategy Changes and Agricultural Diversification: A Correlation and Mechanism Analysis Based on Data from the China Family Panel. Land 2022, 11, 685. [Google Scholar] [CrossRef]
  71. Nguyen, S.V.; Dang, Q.N.; Ba, U.T.; Phuong, N.L.; Quang, N.N.; Minh, P.N.T.; Hoang, M.T.T. Tourism development affects on farmers household’s livelihood: Case study in Vietnam. Environ. Dev. Sustain. 2023, 25, 15163–15181. [Google Scholar] [CrossRef]
  72. Addinsall, C.; Weiler, B.; Scherrer, P.; Glencross, K. Agroecological tourism: Bridging conservation, food security and tourism goals to enhance smallholders’ livelihoods on South Pentecost, Vanuatu. J. Sustain. Tour. 2017, 25, 1100–1116. [Google Scholar] [CrossRef]
  73. Tang, W.Y.; Wang, Q.G.; Cheng, H.; Liu, T.H.; Wan, J.M. Livelihood vulnerability assessment of land-lost farmers in the context of tourism and the COVID-19 pandemic. Environ. Dev. Sustain. 2023. [Google Scholar] [CrossRef]
Figure 1. Methodological framework.
Agriculture 14 01295 g001
Figure 2. Mountainous areas of Southwest China and the study samples.
Agriculture 14 01295 g002
Figure 3. Samples classification based on terrain gradients.
Agriculture 14 01295 g003
Figure 4. The violin plots of the RLR index in the mountainous areas of Southwest China.
Agriculture 14 01295 g004
Figure 5. The violin plots of the RLR index for different terrain gradients in the mountainous areas of Southwest China.
Agriculture 14 01295 g005
Figure 6. The results of the interaction detector in 2020.
Agriculture 14 01295 g006
Figure 7. q-values of the influencing factors in low, medium and high mountain areas.
Agriculture 14 01295 g007
Table 1. RLR evaluation indicators system.
Categories (Subcategories)IndicatorsCalculation MethodsTypeWeight
Buffer capabilityNatural capitalCultivated land resourcesCultivated land area/rural population+0.0423
Water resourcesReservoir storage/total population+0.0432
Forest coverstatistical data+0.0323
Physical capitalPer capita housing area of rural residentsstatistical data+0.0372
Agricultural production toolsTotal power of agricultural machinery/rural population+0.0471
Financial capitalPer capita disposable income of rural residentsstatistical data+0.0460
Per capita GDPstatistical data+0.0485
Social
capital
Social security and employment investmentFiscal expenditure on social security and employment/total population+0.0327
Number of farmer professional cooperativesstatistical data+0.0369
Human capitalProportion of rural employeesRural employees/rural population+0.0462
Coverage of rural subsistence allowancesBeneficiaries of rural subsistence allowances/rural population0.0382
Adjustment capabilityFarmland qualityStable yield standard farmland area/effective irrigated area+0.0503
Agricultural outputGross output value of farming, forestry, animal husbandry and Fishery/rural population+0.0510
Rural electrificationRural electricity consumption/rural population+0.0393
Agricultural infrastructureFixed asset investment in primary industry/rural population+0.0451
fiscal self-sufficiency rateFiscal revenue/fiscal expenditure+0.0487
Resource allocationFiscal expenditure/total population+0.0514
Renewal capabilityPer capita education years of rural residentsstatistical data+0.0379
Urbanization ratestatistical data+0.0486
Agricultural modernizationTotal power of agricultural machinery/sown area of crops+0.0461
Industrial upgrading(Proportion of primary production × 1) + (proportion of secondary production × 2) + (proportion of tertiary production × 3)+0.0442
Green developmentTotal energy consumption/GDP0.0427
Science and technologyFiscal expenditure in science and technology/total population+0.0441
+ represents positive indicators. − represents negative indicators.
Table 2. Pearson correlation coefficients of the influencing factors.
Influencing FactorsX1X2X3X4X5X6X7X8X9
2000−0.383 **−0.445 **0.608 ***0.457 **0.3150.4020.436 *0.432 ***0.268
2010−0.367 *−0.416 *0.586 ***0.463 **0.3520.421 *0.450 **0.457 ***0.276
2020−0.334−0.364 *0.592 **0.470 **0.404 *0.458 **0.477 **0.448 **0.273
*, ** and *** represent significant levels of 0.05, 0.01 and 0.001, respectively. X1, average slope; X2, distance from provincial government; X3, per capita gross domestic product; X4, road density; X5, Herfindahl–Hirschmann index; X6, proportion of non-agricultural population; X7, number of grassroots autonomous organizations; X8, per capita beds in medical institutions; X9, number of state-owned cultural institutions. Same as Table 3.
Table 3. The q-values of the influencing factors.
Influencing FactorsX1X2X3X4X5X6X7X8X9
20000.347 *0.409 *0.564 ***0.390 **0.2550.3410.393 *0.382 **0.185
20100.331 *0.377 *0.547 ***0.403 **0.2870.365 *0.402 *0.393 **0.194
20200.3150.3360.555 **0.408 **0.3230.404 **0.415 *0.386 *0.190
*, ** and *** represent significant levels of 0.05, 0.01 and 0.001, respectively.
Disclaimer/Publisher’s Note: The statements, opinions and data contained in all publications are solely those of the individual author(s) and contributor(s) and not of MDPI and/or the editor(s). MDPI and/or the editor(s) disclaim responsibility for any injury to people or property resulting from any ideas, methods, instructions or products referred to in the content.

