Article

Study on the Structural Characteristics of Mesh Filter Cake in Drip Irrigation: Based on the Growth Stage of Filter Cake

1
College of Water Conservancy and Construction Engineering, Shihezi University, Shihezi 832000, China
2
College of Resources and Environment, Qingdao Agricultural University, Qingdao 266000, China
3
Xinjiang Huili Irrigation Technology Company Limited, Shihezi 832000, China
*
Author to whom correspondence should be addressed.
Agriculture 2024, 14(8), 1296; https://doi.org/10.3390/agriculture14081296
Submission received: 27 June 2024 / Revised: 18 July 2024 / Accepted: 24 July 2024 / Published: 6 August 2024
(This article belongs to the Section Agricultural Technology)

Abstract

:
Mesh filters are frequently employed in water-saving irrigation fields. Studies addressing the method of cake formation and the characteristics of the cake during the mesh filter’s growing phase are still missing. One-way and orthogonal experiments were carried out using mesh filters with 220 μm and 320 μm aperture sizes as the research objects, taking particle concentrations, inlet flow, and growth phases as experimental factors. According to the variation rule of seed pressure drop in the formation process of filter cake, the growth process of filter cake is divided into four stages, which are as follows: slow blockage first and second stages (M1, M2), fast blockage stage (M3), and filter cake filtration stage (M4). Moreover, the size distribution, porosity (ε), pore-to-particle ratio (KP), and median size (d50) of the filter cake were used to represent the structural characteristics. The results show that the growth of filter cake was a process that started with the filling of mesh pores by intercepted particles and progressed to the filling of large-particle skeleton pores by subsequently filtered particles. During this process, the proportion of intercepted particles gradually decreased, while the proportion of filtered particles increased incrementally, and the median size (d50) and porosity (ε) decreased. Meanwhile, the smaller the aperture size of the screen, the smaller the filter cake’s median size (d50) was, but the larger the pore-to-particle ratio (KP) was. As the flow rate increased, the porosity (ε) was augmented in the M1 and M2 stages; however, it decreased in the M3 and M4 stages. The concentration had a minor influence on the filter cake’s porosity. Lastly, the regression model for filter cake porosity under two aperture size conditions was established, based on factors such as flow rate, concentration, and growth stage. The coefficients of determination, R2, for the model were 90.33% and 80.73%, indicating a good fit.

Graphical Abstract

1. Introduction

As an essential component in drip irrigation systems, the mesh filter frequently encounters a serious clogging issue after prolonged operation, which severely restricts the smooth operation of drip irrigation systems [1,2,3]. In order to develop water-saving drip irrigation, in-depth investigations on the clogging mechanism and cake structure of the mesh filter are imperative.
Domestic and international research on filters has focused on filtration performance and causes of clogging. Filtration performance has been studied extensively, focusing primarily on the impact of structural optimization on the flow field, as well as the effects of flow rate, concentration, filter structure, and other factors on filtration efficiency [4,5,6,7]. The studies on mesh filter clogging were limited and outdated. Wen [8] believed that filter cake clogging could enhance the filter performance while also increasing the head loss. Moreover, the two parameters of the filter—permeability and porosity—were used to characterize the degree of filter cake clogging. Zong et al. [9] analyzed the causes of filter clogging and found that the aperture size of the screen and sand content were important factors affecting clogging. A quantitative relationship equation for the pressure drop inside and outside the screen was established based on the experimental results. Zeier et al. [10] studied the effects of different concentrations and particle sizes on clogging, and discovered that small particles led to clogging, whereas large particles were carried along with the water in the inner chamber of the filter. It was also found that the smaller the aperture of the filter mesh, and the higher the sand content, the quicker the clogging occurs. While there are few studies on the structure of filter cake in the clogging of mesh filters, the studies on the structure of filter cake in other fields are also valuable for reference in understanding mesh filters. Fei et al. [11] constructed a three-dimensional digital filter cake and extracted the aperture network model through pressurized filtration tests and CT scanning imaging. They finally established a pore–permeability relationship model. Chen et al. [12] conducted vacuum filtration and dewatering of fine-grained coal under various conditions. They analyzed the aperture structure of the resulting filter cake to obtain the porosity and fractal dimension of the filter cake. Li et al. [13] divided the clogging process of the geotextile into three stages: aperture clogging and filter cake formation, the dynamic growth of the filter cake, and filtration of the filter cake layer through microscopic analysis.
Filter clogging is the dynamic process of filter cake growth [14,15]. Therefore, it is of great significance to study the growth process of filter cake to grasp the filter clogging situation and enhance the efficiency of filter operation. However, current research on the clogging mechanism of mesh filters has mostly focused on the final clogging of the filter cake. Few studies have been conducted to analyze the influence of various factors on the formation and structure of filter cake from the perspective of filter cake growth. By combining the findings of the previous studies, it was found that flow rate, sand concentration, and screen aperture size were considered to be the main factors affecting filter clogging in actual irrigation work. Therefore, this paper focuses on the widely used mesh filter in micro-irrigation systems as the research subject. The research aims to (1) analyze the relationships between the inlet flow rate, the sand content of the water source, the filter cake growth process and the aperture of the mesh, as well as the distribution of the particle sizes of the filter cake particles and the structural parameters of the filter cake; and (2) establish a model of the porosity of the filter cake under different aperture diameters based on the factors of the flow rate, the sand content, and the growth stage. The results of this study can provide an important reference for selecting optimal parameters during filter operation and constructing pressure drop models under various operating conditions relevant to mesh filters.

2. Materials and Methods

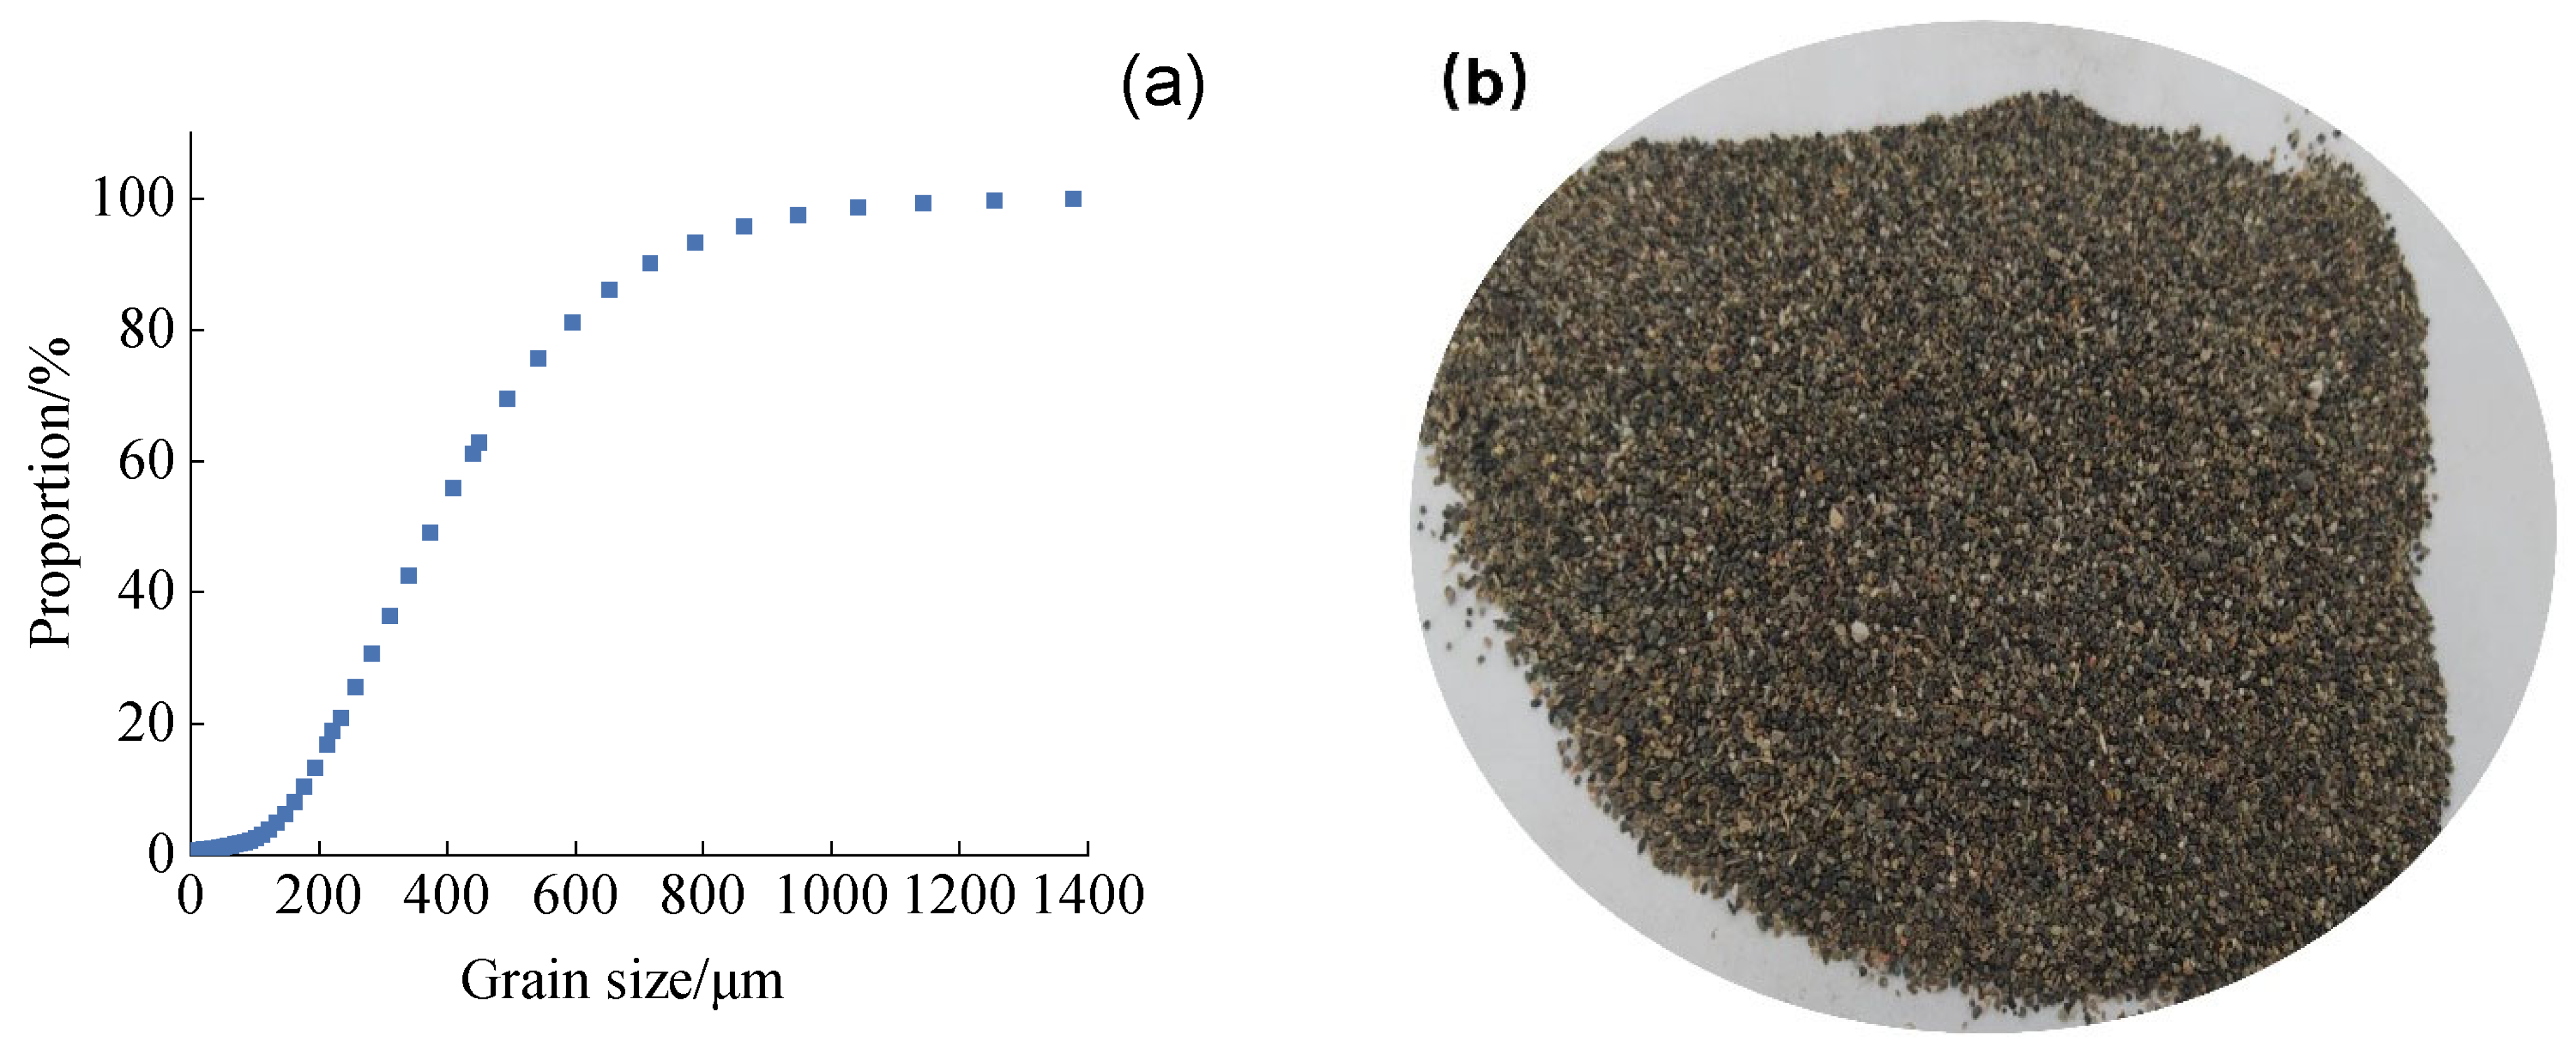
2.1. Experiment Device and Materials

Vertical mesh filters commonly used by farmers for irrigation filtration systems were selected for the experiment (model: 8GSW-150, rated flow rate of 150 m3/h, rated working pressure of 0.3 MPa, filtration accuracy of 320 μm and 220 μm, screen diameter of 0.34 m, screen height of 0.45 m, inlet and outlet diameters of 0.14 m, manufacturer: Xinjiang Golden Land Water Saving Equipment Co., Shihezi, China) The indoor prototype experiment was carried out on a test platform constructed by integrating a water reservoir, a mixing tank, a vertical mesh filter, a water pump, a frequency converter cabinet, an electromagnetic flowmeter, and inlet and outlet connection piping. The test setup is shown in Figure 1. The structure of the filter screen is shown in Figure 2.
Among them, the reservoir measures 450.0 cm in length, 342.0 cm in width, and 180.0 cm in height. The centrifugal pipeline pump model is ISG125-200T, with a power rating of 37 kW and an operating frequency of 50 Hz. The flow rate in the experimental setup can be controlled by the power supply cabinet (model: XL-21, rated frequency: 50 Hz). Flow rate size was measured by an electromagnetic flowmeter (model: XFE125R1BM1R, accuracy class: 0.5, flow rate range: 13.25–500 m3/h), import and export pressure was measured by a digital pressure gauge (model: SIN-Y290, measurement range: 0–0.6 MPa, accuracy class: 0.5%). The experiment instruments also included a beaker, a cylinder, an electronic scale, and other equipment. During the experiment, the sandy water in the mixing tank flowed into the filter from the inlet pipe, was filtered by the screen, and, finally, the filtered water flowed out to the sedimentation tank from the outlet pipe.
The sediment used in the test was natural river sand from the Manas River Basin in Xinjiang. The collected river sand was sieved through a 1.5 mm sieve, considering the existence of preliminary filtration devices in front of actual drip irrigation systems. This makes the sediment gradation used in the experiment more similar to the sediment gradation in an actual irrigation system. The particle grading is shown in Figure 3.

2.2. Experiment Methods

2.2.1. Experimental Factors

The experiment selected two types of aperture filter mesh, 320 μm and 220 μm. Four inlet flows were set based on the actual project flow standard and the experiment pump flow limit. Filter inlet flows were 140, 150, 160, and 170 m3/h, respectively. Additionally, four levels of sand content were set according to the actual irrigation water source sand content and the standard of easily blocked water sediment content. The sediment concentrations were 0.045, 0.087, 0.123, and 0.160 kg/m3, respectively. For each group of conditions, the filter clogging process was divided into four different cake growth stages for four separate stage tests. The basis of the specific growth stages is described in the following experimental methodology sections. The ultimate experiment factors are shown in Table 1.

2.2.2. One-Way Experiments

(1)
Completely clogging experiment
In the filter’s working process, when the filter mesh forms a thicker cake, it is difficult for the water flow to pass through the filter mesh; at some point, it is considered that the filter reaches a completely blocked state. The completely clogging experiment was a one-way experiment with two pore-size filters varying the flow rate at a concentration of 0.087 kg/m3 and varying the concentration at a constant flow rate of 160 m3/h. A total of 16 sets of tests were performed. After switching on the pump and stirrer, when the inlet water flow and sediment concentration were stable, the experiment started. When the inlet pressure increased to a certain value, the flow rate decreased to a certain value, and the two data were basically stable and unchanging, it was considered that the screen had reached a completely blocked state, and the test was over. During the experiment, the inlet pressure, outlet pressure, and inlet flow rate of the filter were recorded. The procedure for handling the filter cake at the end of each set of tests was as follows. (1) After the completion of the experiment, we dismantled the filter, took out the clogged screen, and measured the total volume of the screen and the wet cake by the water-phase over-drain method [16]. The filter cake particles on the screen were cleaned and collected, and the screen, in its clean state, was wetted. The volume of the screen was also measured by the water-phase over-drain method, and this was subtracted from the total of the screen and wet cake to obtain the wet cake volume (v). (2) The collected filter cake particles were dried, and the dry cake mass (m0) was measured. The volume of dry filter cake particles (v0) was also measured by the water-phase over-drain method. The density formula was used to obtain the filter cake bulk density (v/m0) and the absolute density of the sediment particles (v0/m0). (3) Finally, the particle size distribution of the filter cake particles was measured using a laser particle sizer. In actual filter work, the clogging of the filter screen is usually determined by observing the change in pressure drop. Therefore, according to the pattern of pressure drop change with time when the filter is completely clogged under different working conditions, the clogging process was divided into four stages: initial clogging (M1), intermediate clogging (M2), advanced clogging (M3), and complete clogging (M4). At the same time, the pressure drop stage corresponding to each stage’s end time was determined according to the curve of the completely clogged pressure drop with time, which was used as the judgment standard for the end of the stage in the clogging experiment.
(2)
Stages of clogging experiment
The stages of clogging experiments were based on the full clogging experiment, which required a one-way experiment for each of the other three stages, in addition to the full clogging experiments, with a total of 48 sets of experiments. The experimental conditions for the stages of clogging experiments were consistent with the full clogging experiment. The pump was turned on, and the experiment began when the flow rate and sediment content were stable. The stage of the experiment ended when the pressure drop determined in the complete blockage experiment for each phase was reached. After the experiment, the screen was also taken out, and the cake particles were subjected to the same treatment as described above.

2.2.3. One-Way Experiments

In order to construct the porosity model, a three-factor (flow rate, concentration, growth stage), four-level orthogonal experimental design was carried out for the two filter sizes, with a total of 32 sets of experiments. The experimental conditions were the same as those of the one-factor experiment, and at the end of the experiment, the filter cake particles were also processed to obtain the filter cake bulk density and absolute density to calculate the filter cake porosity.

2.3. Test Index and Calculation

2.3.1. Filter Cake Particle Gradation

A laser particle sizer (LS 13 320) was used to measure the gradation of the imported sediment and the particle size distribution of the filter cake particles obtained after each stage of testing.

2.3.2. Median Particle Size and Pore-to-Particle Ratio

The median particle size of the filter cake, d50, reflects the actual particle size of the particles captured by the screen [17]. When the aperture size of the screen varies, it is not possible to effectively compare the median particle size of the filter cake particles that are intercepted. Therefore, the ratio of the median particle size to the screen aperture diameter is introduced and named the pore-to-particle ratio. Thus, we can ignore the effect of different aperture sizes on the particle size distribution and characterize the relative particle size of filter cake particles intercepted by the screen [18]. The pore-to-particle ratio is calculated as follows:
K p = d 50 a
where d50 denotes the median size of cake particles, μm; and a represents the aperture size of the mesh filter, μm.

2.3.3. Porosity

Porosity is an important parameter for characterizing the structure of a filter cake [19], which can be determined based on the bulk density and absolute density of the filter cake [9]. For filter cake, the porosity is calculated as follows:
ε = 1 ρ 0 ρ
where ρ0 denotes the absolute density of the particles forming the filter cake, kg/m3; ρ denotes the bulk density of the wet filter cake, kg/m3. Absolute and bulk densities were derived by measuring the mass and volume of the filter cake in accordance with the method described above.

3. Results

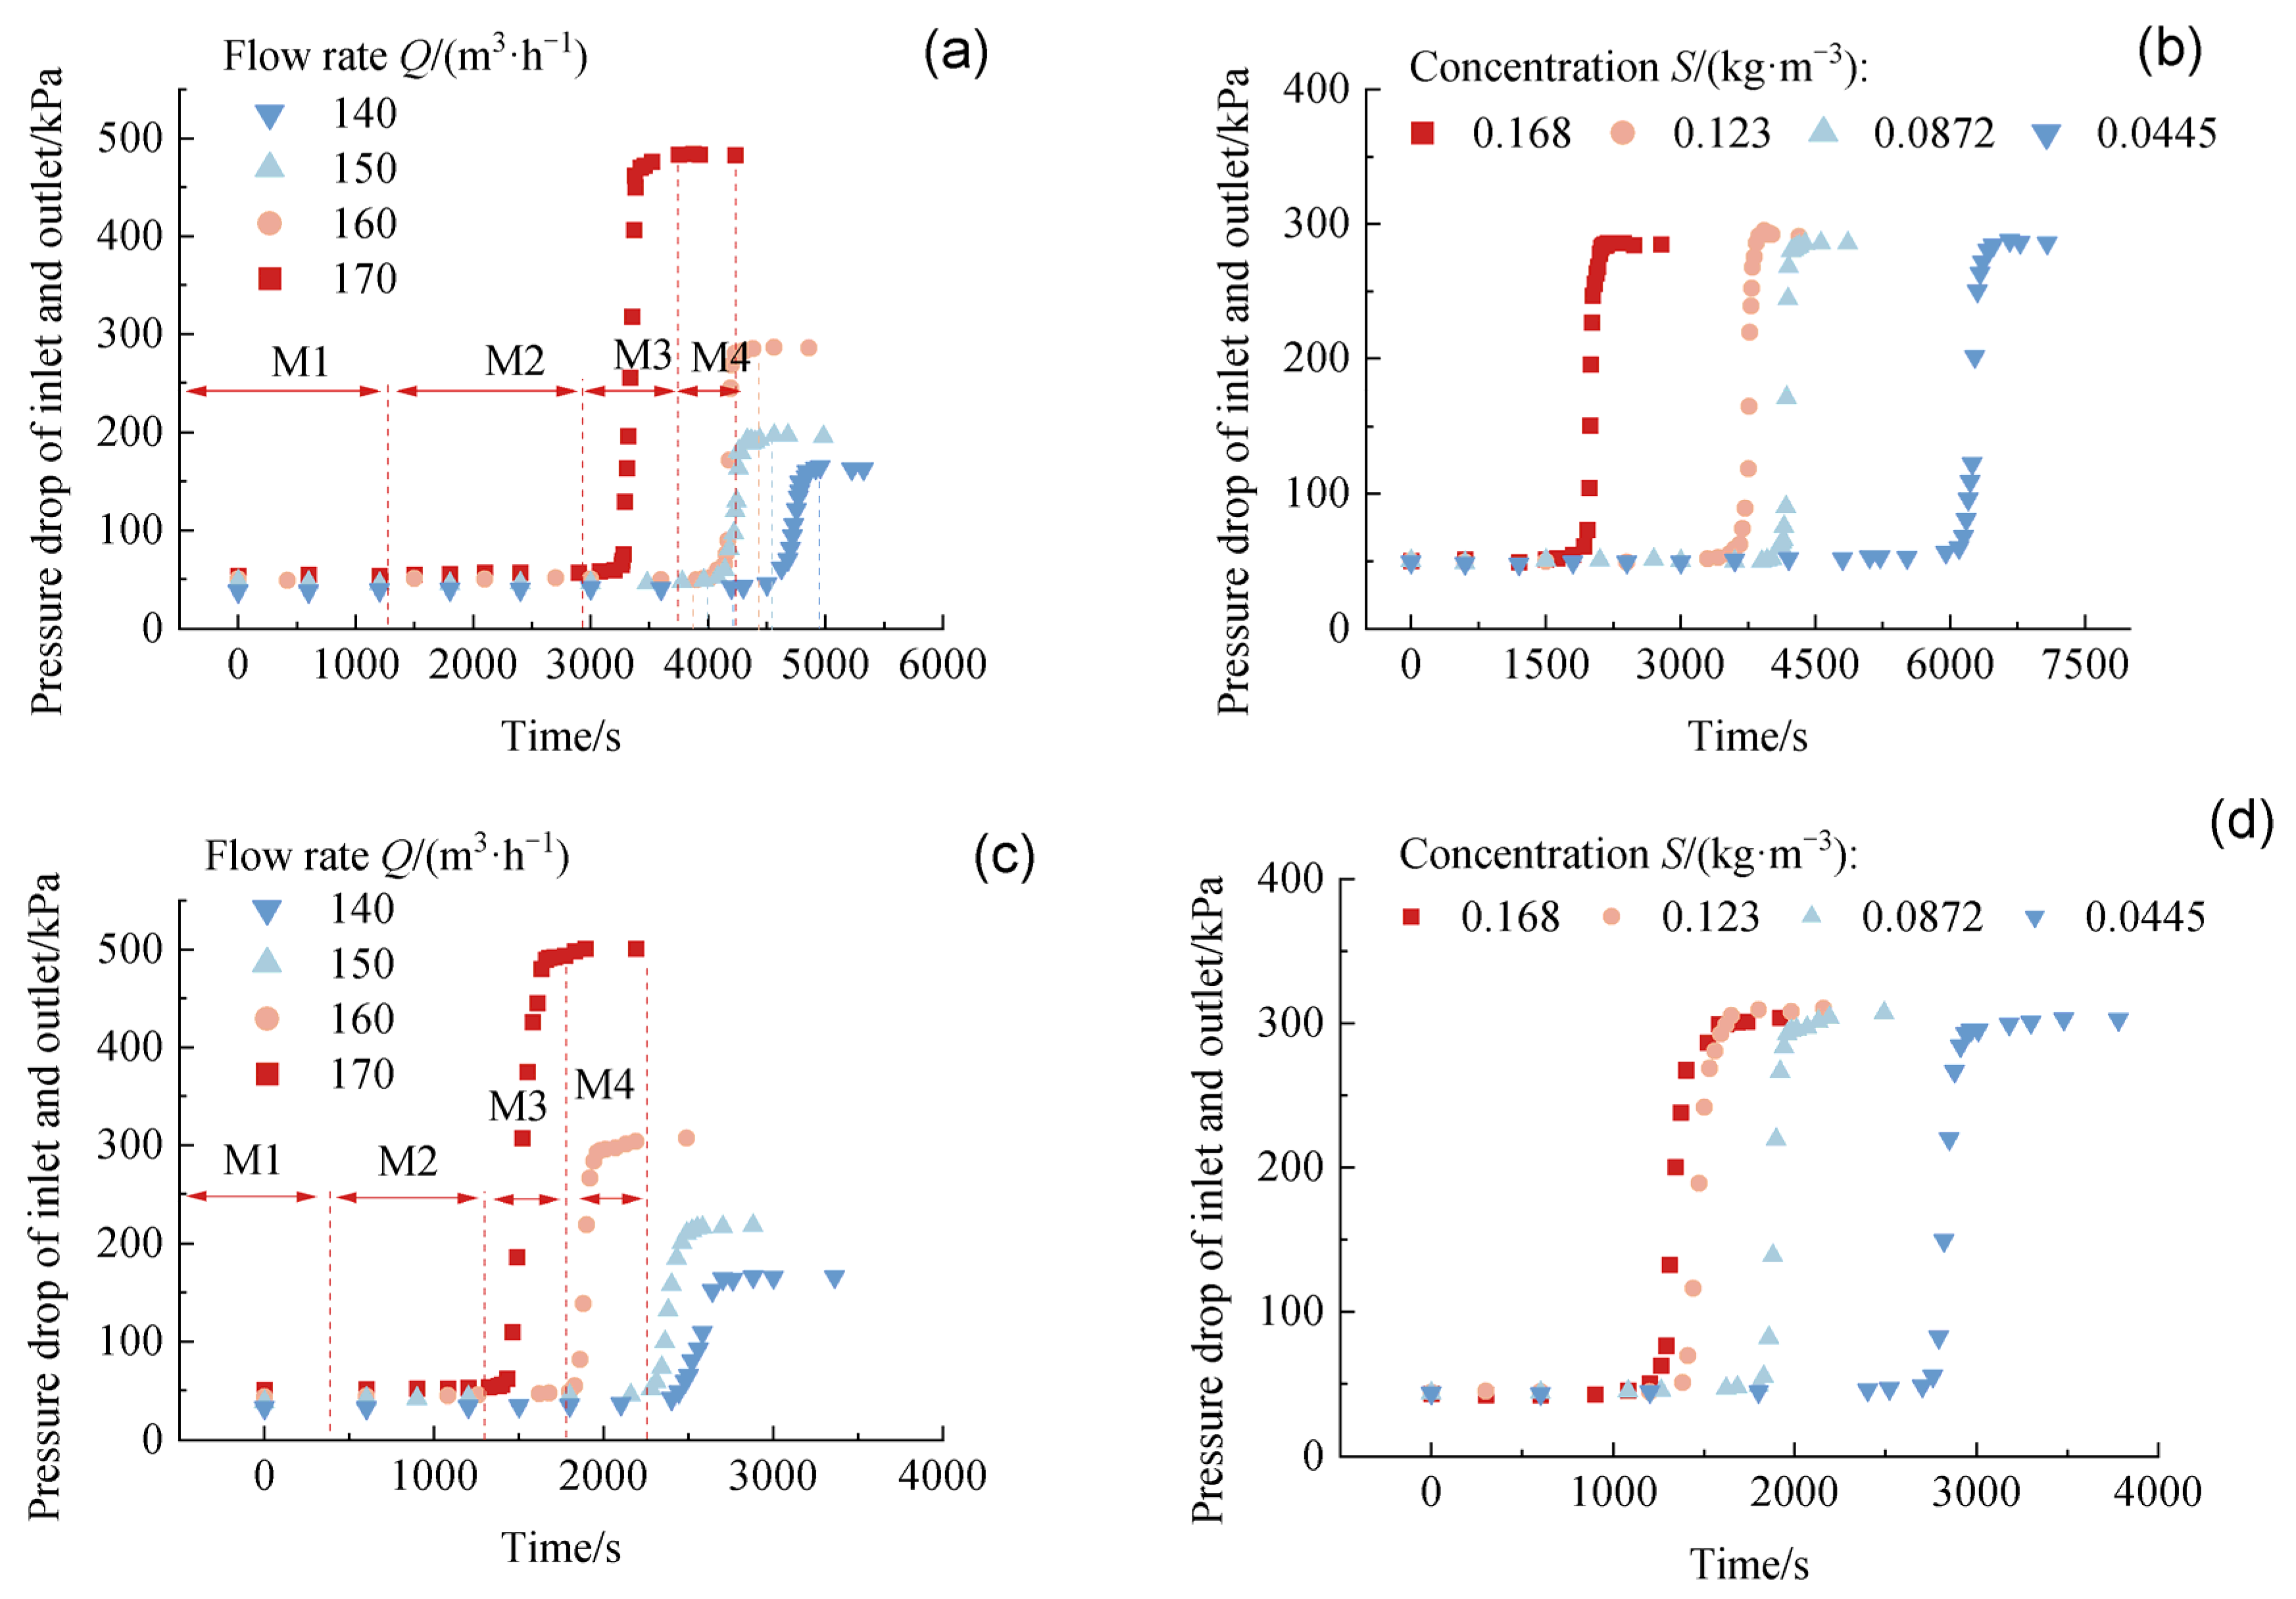
3.1. Growth Stage Division

From Figure 4, it can be observed that the pressure drop of the filter gradually increases over time under each condition. Initially, there was a slight increase, but after a prolonged period, the pressure drop rose significantly, eventually reaching the final clogging pressure drop. Subsequently, it stabilized and remained constant. According to Figure 4, the pressure drop at full clogging increased with the increase in inlet flow rate. Concentration had no effect on the full clogging pressure drop, but only affected the clogging speed of the filter, which could also be described as the cake growth rate. The growth of cake directly caused changes in the filter pressure drop. In order to facilitate the subsequent study of the filter cake growth process, the change rule of the filter pressure drop with time in the full clogging stage under different working conditions was divided into four stages of filter cake growth, as shown in Figure 4a. These four stages were: (1) the pressure drop with time grows slowly stage, considering the process lasts longer, so this stage was divided into the first stage of slow growth (M1) and the second stage of slow growth (M2); (2) the filter pressure drop from the slow to sharp changes in this process was called the rapid growth stage (M3); (3) the pressure drop reaches the final pressure drop tended to stabilize, this process was divided into the cake filtration stage (M4). The structural characteristics of the growing filter cake were subsequently studied in depth through tests conducted at each stage.

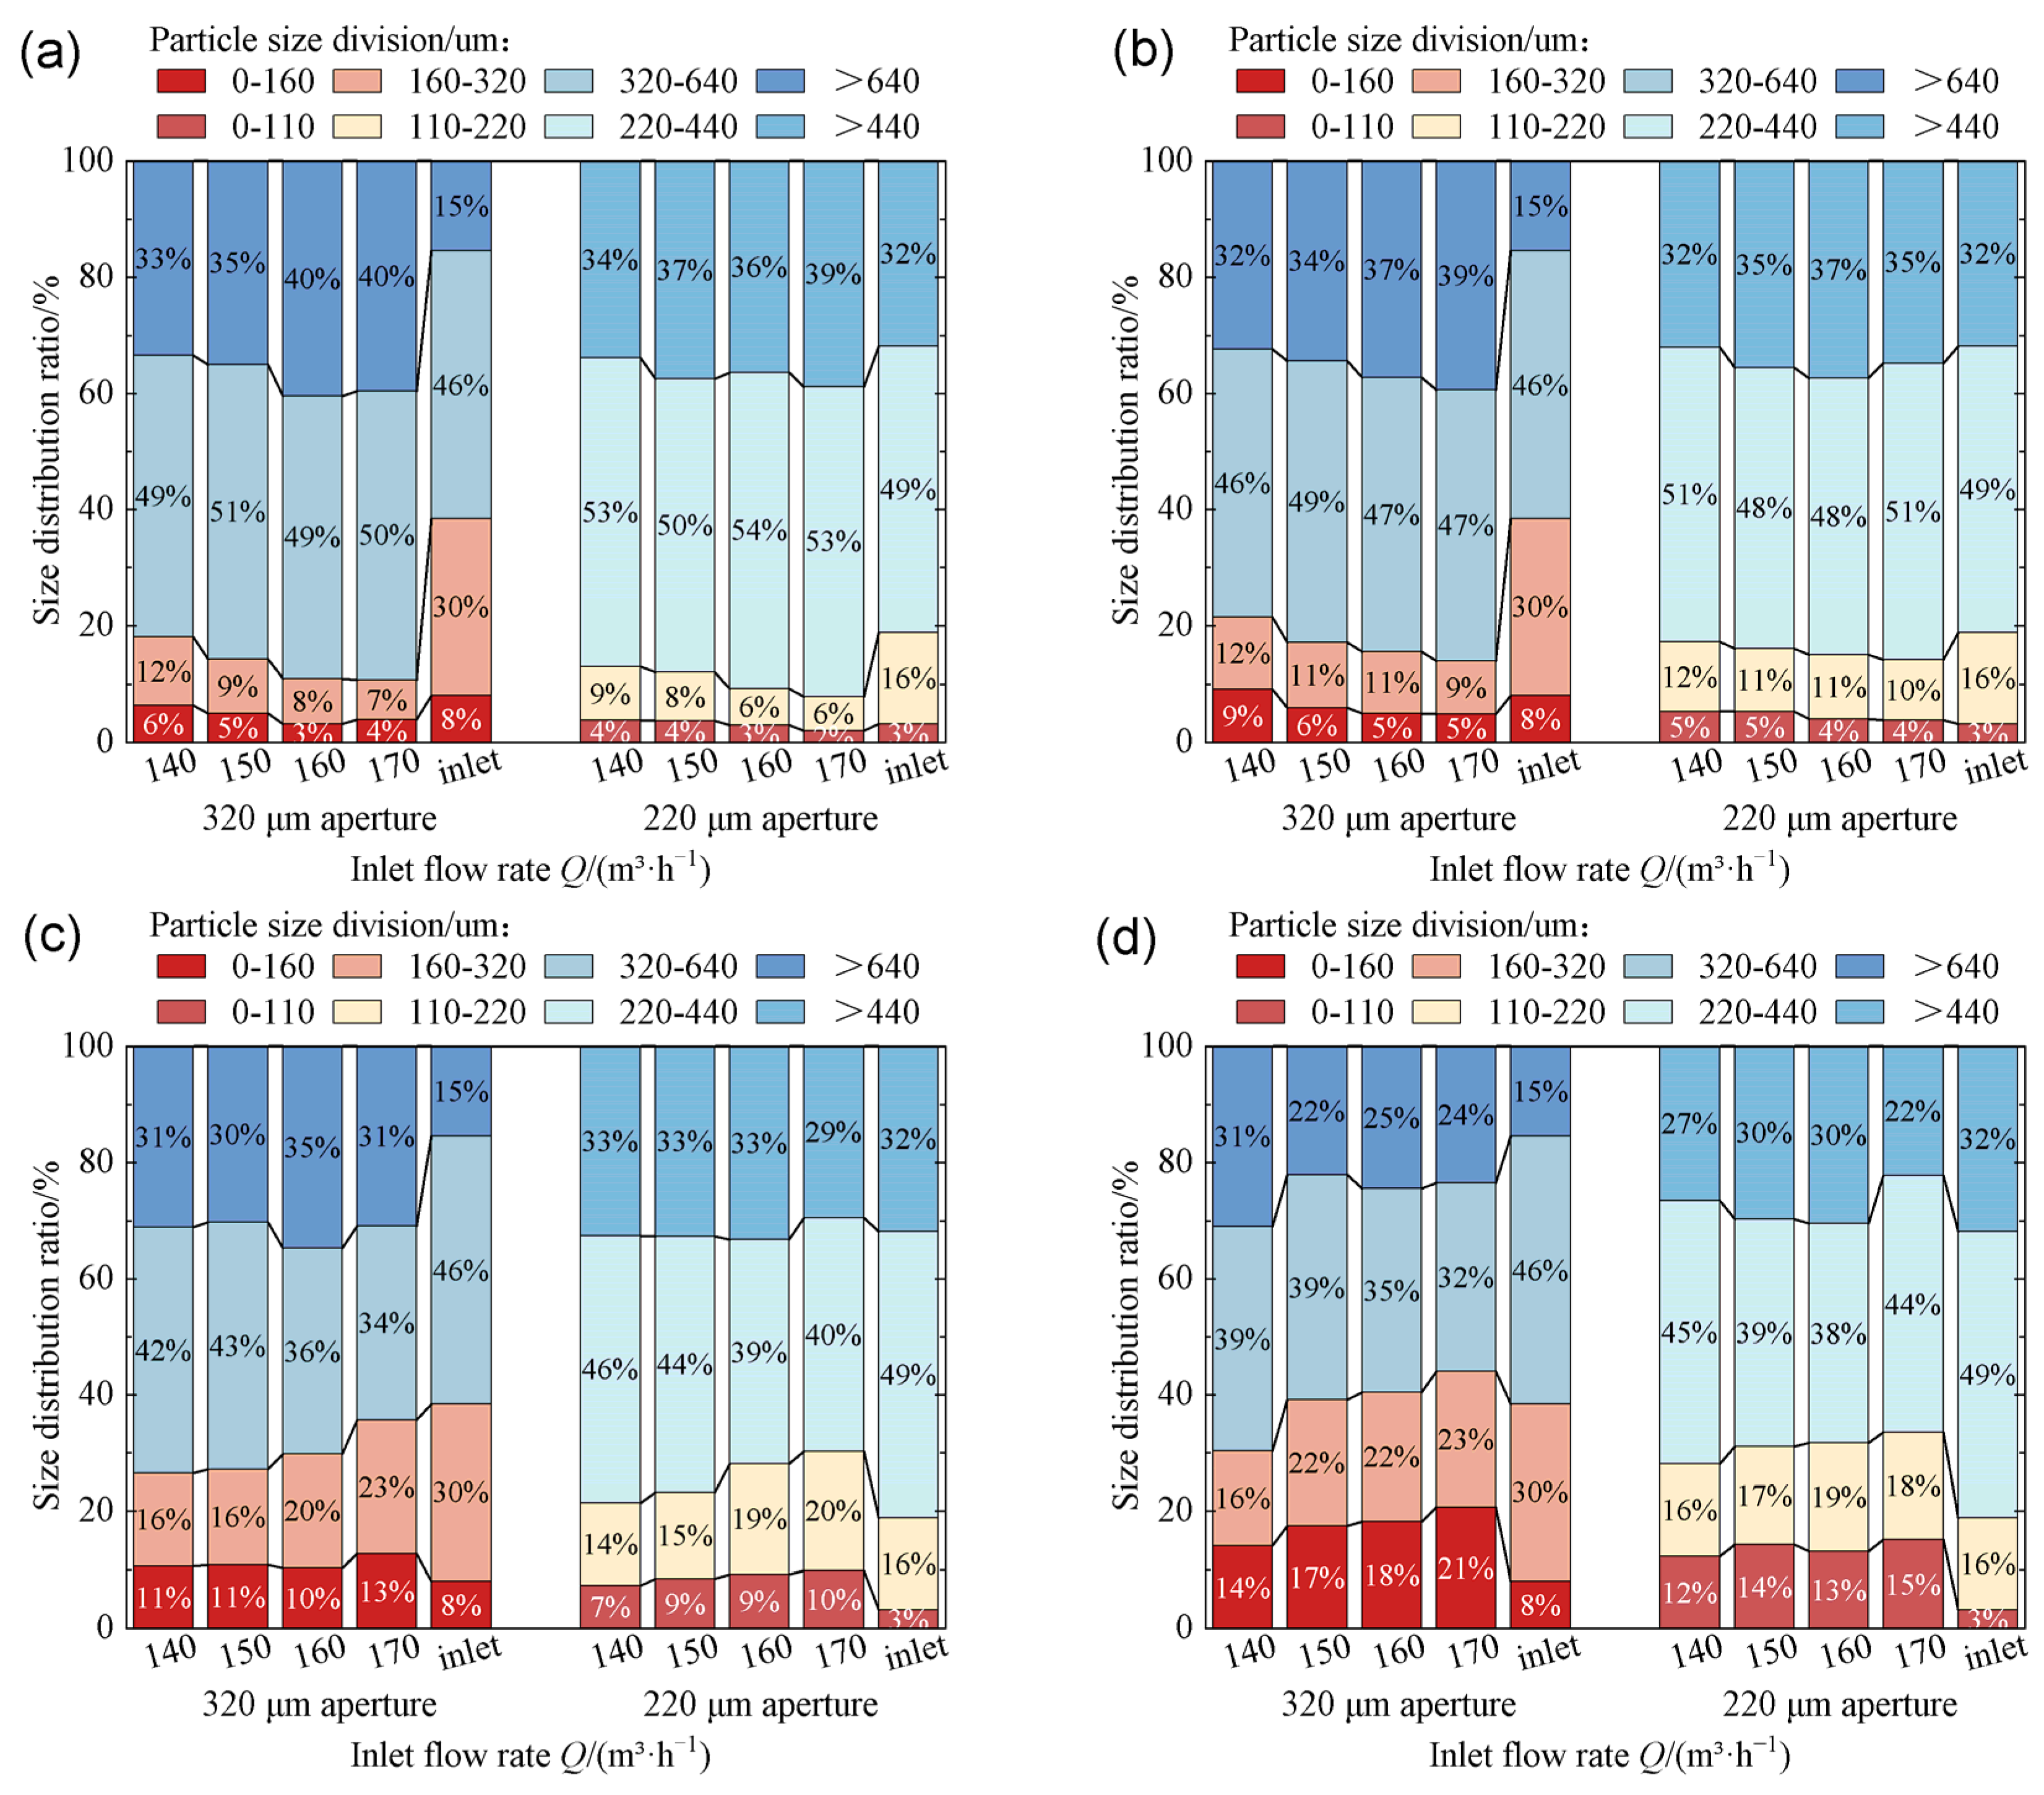
3.2. Characteristics of Particle Size Distribution of Filter Cake at Each Growth Stage under Different Working Conditions

In order to facilitate the exploration of the relationships between the particle size distribution of the filter cake particles, the screen aperture, and the growth process of the cake, the particles were classified into four classes. The four classes were determined according to the filter aperture and the influence of particle size on screen clogging [20]. Particles larger than the aperture of the filter were called intercepted particles, while particles smaller than the aperture of the filter were called filtered particles. Among the filtered particles, those with 0–0.5 times the filter aperture size were filtered-out small particles (0–160 μm in 320 μm aperture filters, 0–110 μm in 220 μm aperture filters); particles sized 0.5–1 times the filter aperture were classified as large particles (160–320 μm in 320 μm aperture filters, 110–220 μm in 220 μm aperture filters). Among the intercepted particles, those within the range of 1–2 times the aperture of the screen were intercepted small particles (320–640 μm in 320 μm aperture filters, 220–440 μm in 220 μm aperture filters); particles larger than 2 times the aperture size were intercepted large particles (>640 μm in 320 μm aperture filters, >440 μm in 220 μm aperture filters). According to the experimental results, the proportion of each type of particle in the four stages of filter cake growth under different working conditions was determined. This analysis aimed to investigate the structure of the filter cake during its growth.
Figure 5 and Figure 6 depict the percentages of the particle size distribution during the formation of filter cake at different flow rates and concentrations. It was found that under different working conditions, the cake’s particle size distribution in the process of filter cake growth was consistent. In the M1 stage, the filter cake particles mainly consisted of intercepted particles, accounting for 80~90% of all particles; intercepted small particles accounted for 50%, which was a greater percentage than the intercepted large particles; the filtered small particles in this stage represented only 2–6% of the total particle proportion. This was due to the size of the intercepted small particles being closer to the filter aperture size, making it easier for them to be captured by the filter wire. On the other hand, large particles in motion were more likely to collide with the filter holes and were not easily captured to form a filter cake. At the M2 stage, the intercepted particles were still dominant, and the percentage of filterable particles had increased, albeit to a lesser extent. This occurred because the intercepted particles clogging the filter hole caused the pores to become smaller. As a result, a small percentage of filtered particles were intercepted by the filter, but most still passed through the filter at this stage. In the M3 stage, the percentage of intercepted particles was reduced to 70%; the percentage of filtered particles increased to about 30%, with 20% being filtered-out large particles and 10% being filtered-out small particles. This stage was primarily characterized by the accumulation of filtered large particles, which indicated that the majority of mesh holes were filled with intercepted particles, leading to a decrease in circulation aperture space. The filtered large particles, which were slightly smaller than the filter holes, started to accumulate in large quantities, filling up the aperture spaces between the skeleton of the large particles. In the M3 and M4 stages, the proportion of filtered particles increased to 40%. This increase was mainly attributed to a significant rise in the proportion of filtered small particles, while the filtered large particles showed a slight increase as well. At this point, a specific thickness of filter cake had been formed, further reducing the water flow channel, and making it more likely for intercepted particles to wander in the chamber. The filtered small particles, under the influence of water, flowed into the pores of the filter cake, filling them further, resulting in a denser filter cake. Eventually, the flow channel became blocked, and the filter lost its filtration capacity.
Comparing the particle size distribution characteristics of the filter cake with two aperture sizes, it was found that in the same growth stage, the percentage of filtered particles in the 320 μm aperture size was higher, while the percentage of intercepted particles was lower. In the M4 stage, under a flow rate of 140–170 m3/h, the percentages of filterable particles corresponding to a 320 μm aperture size were 30%, 39%, 40%, and 44%; for a 220 μm aperture size they were 28%, 31%, 32%, and 33%, respectively. In Figure 5 and Figure 6, the distributions of imported sediment particle sizes are shown; the percentages of filtered particles for 320 μm and 220 μm aperture sizes were 39% and 19%, respectively, and the percentages of intercepted particles were 61% and 81%, respectively. This indicated that for the same water source, the particle gradation in the water source is fixed. For a smaller mesh size, the imported particle gradation contains more large particles. This led to a small percentage of filtered particles and a large percentage of intercepted particles for the 220 μm aperture size compared to the 320 μm aperture size.
The effect of filter cake particle size distribution was investigated for each stage at various flow rates. As shown in Figure 5a,b, in the M1 stage, the percentage of filterable particles corresponding to a 320 μm aperture size at flow rates of 140–170 m3/h are 18%, 14%, 11%, and 11%, and for a 220 μm aperture size, they are 13%, 12%, 9%, and 8%. In the M2 stage, the percentage of filtered particles corresponding to 320 μm aperture size at flow rates of 140–170 m³/h are: 22%, 17%, 16%, and 14%, and for a 220 μm aperture size are: 17%, 16%, 15%, and 14%, respectively. The results showed that the percentage of filterable particles in both aperture sizes decreased with an increasing flow rate in the M1 and M2 stages of cake growth. It was found that the smaller the particle size, the stronger the particle followability.. Therefore, smaller particles were more likely to pass through the filter holes as the flow rate increased due to fluid movement, leading to a decrease in the percentage of filterable particles. The effect of an increase in flow rate on the size distribution of particles forming the filter cake in the M3 stage was not obvious. In the M4 stage, the proportion of filtered particles in the size 320 μm aperture increased from 30% to 44%. Additionally, the proportion of filtered particles in the size 320 μm aperture increased from 28% to 33% with the rise in flow rate. This indicated that in the cake filtration stage, as the flow rate increases, more filterable particles enter the cake layer. The higher the flow rate, the greater the sand-holding force of the water flow, and the stronger the movements of the small particles. Due to the small particle size of the filterable particles, they could enter the pores of the filter cake under the influence of the water flow’s sand-holding force. This resulted in an increased proportion of filterable particles and the formation of a denser filter cake. Upon analyzing Figure 6, it is evident that the percentage of particle size distribution remained consistent across different concentrations for each growth stage. This indicated that the concentration has essentially no effect on the particle size distribution of the filter cake.

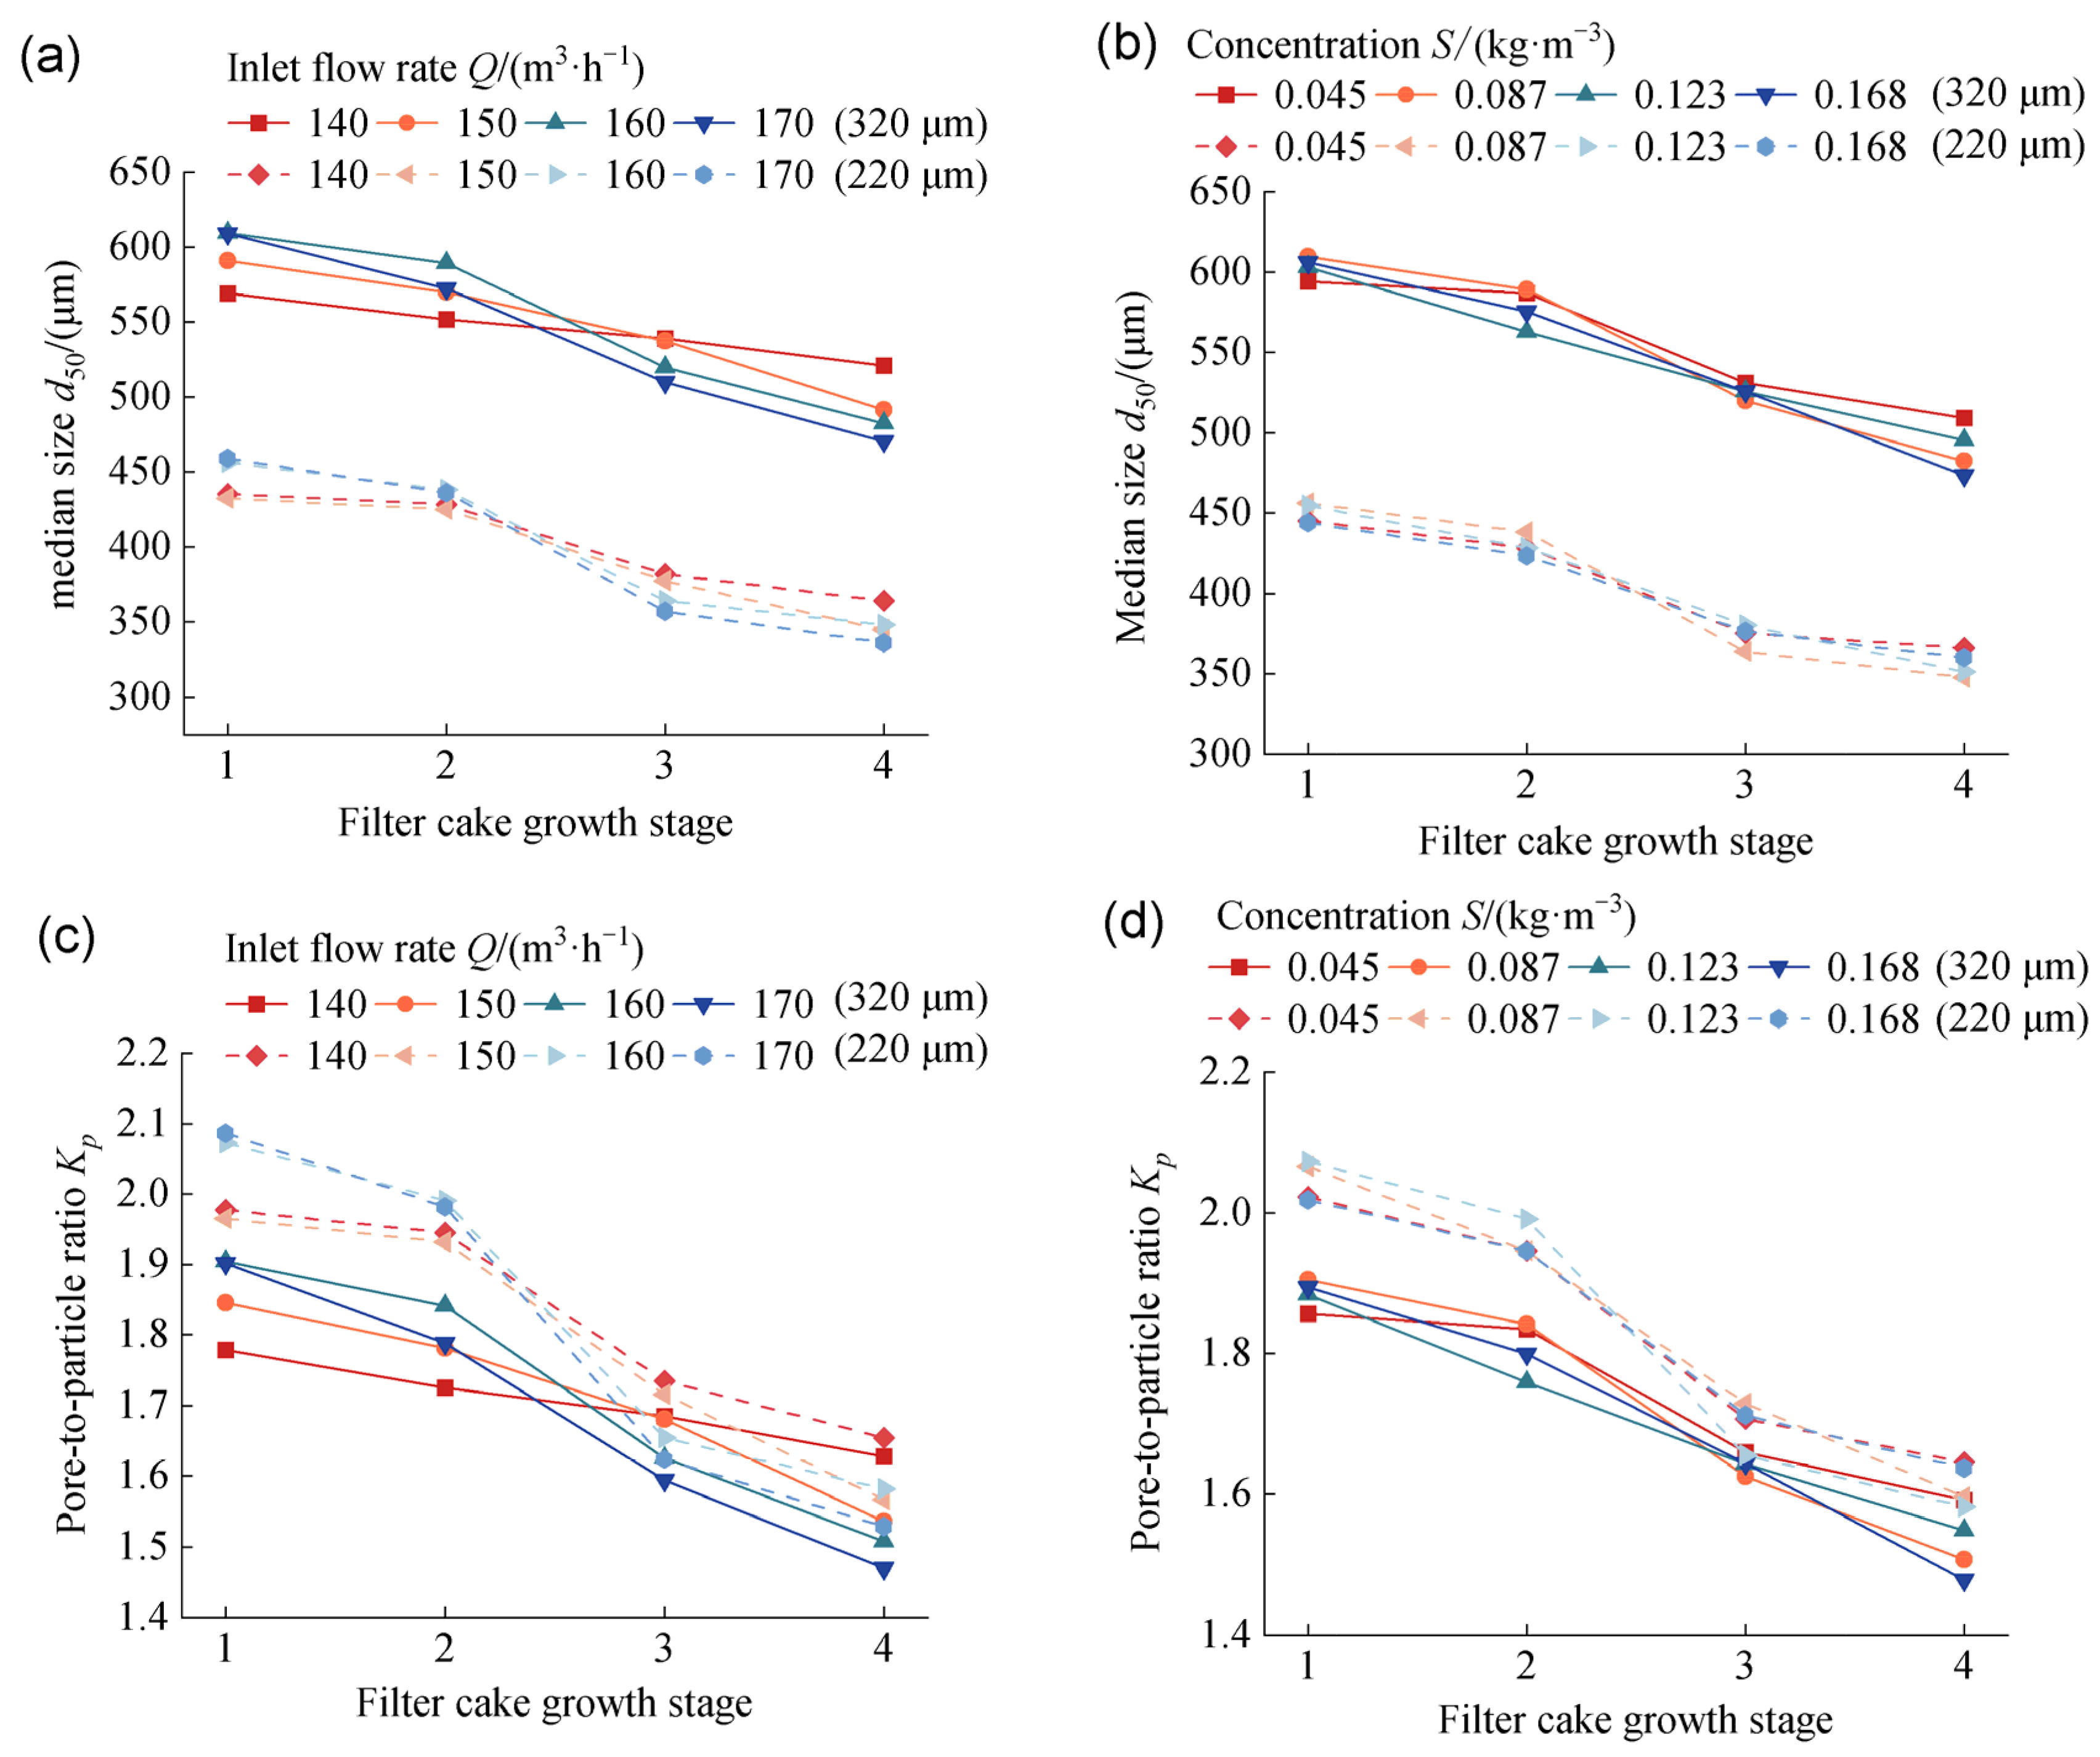
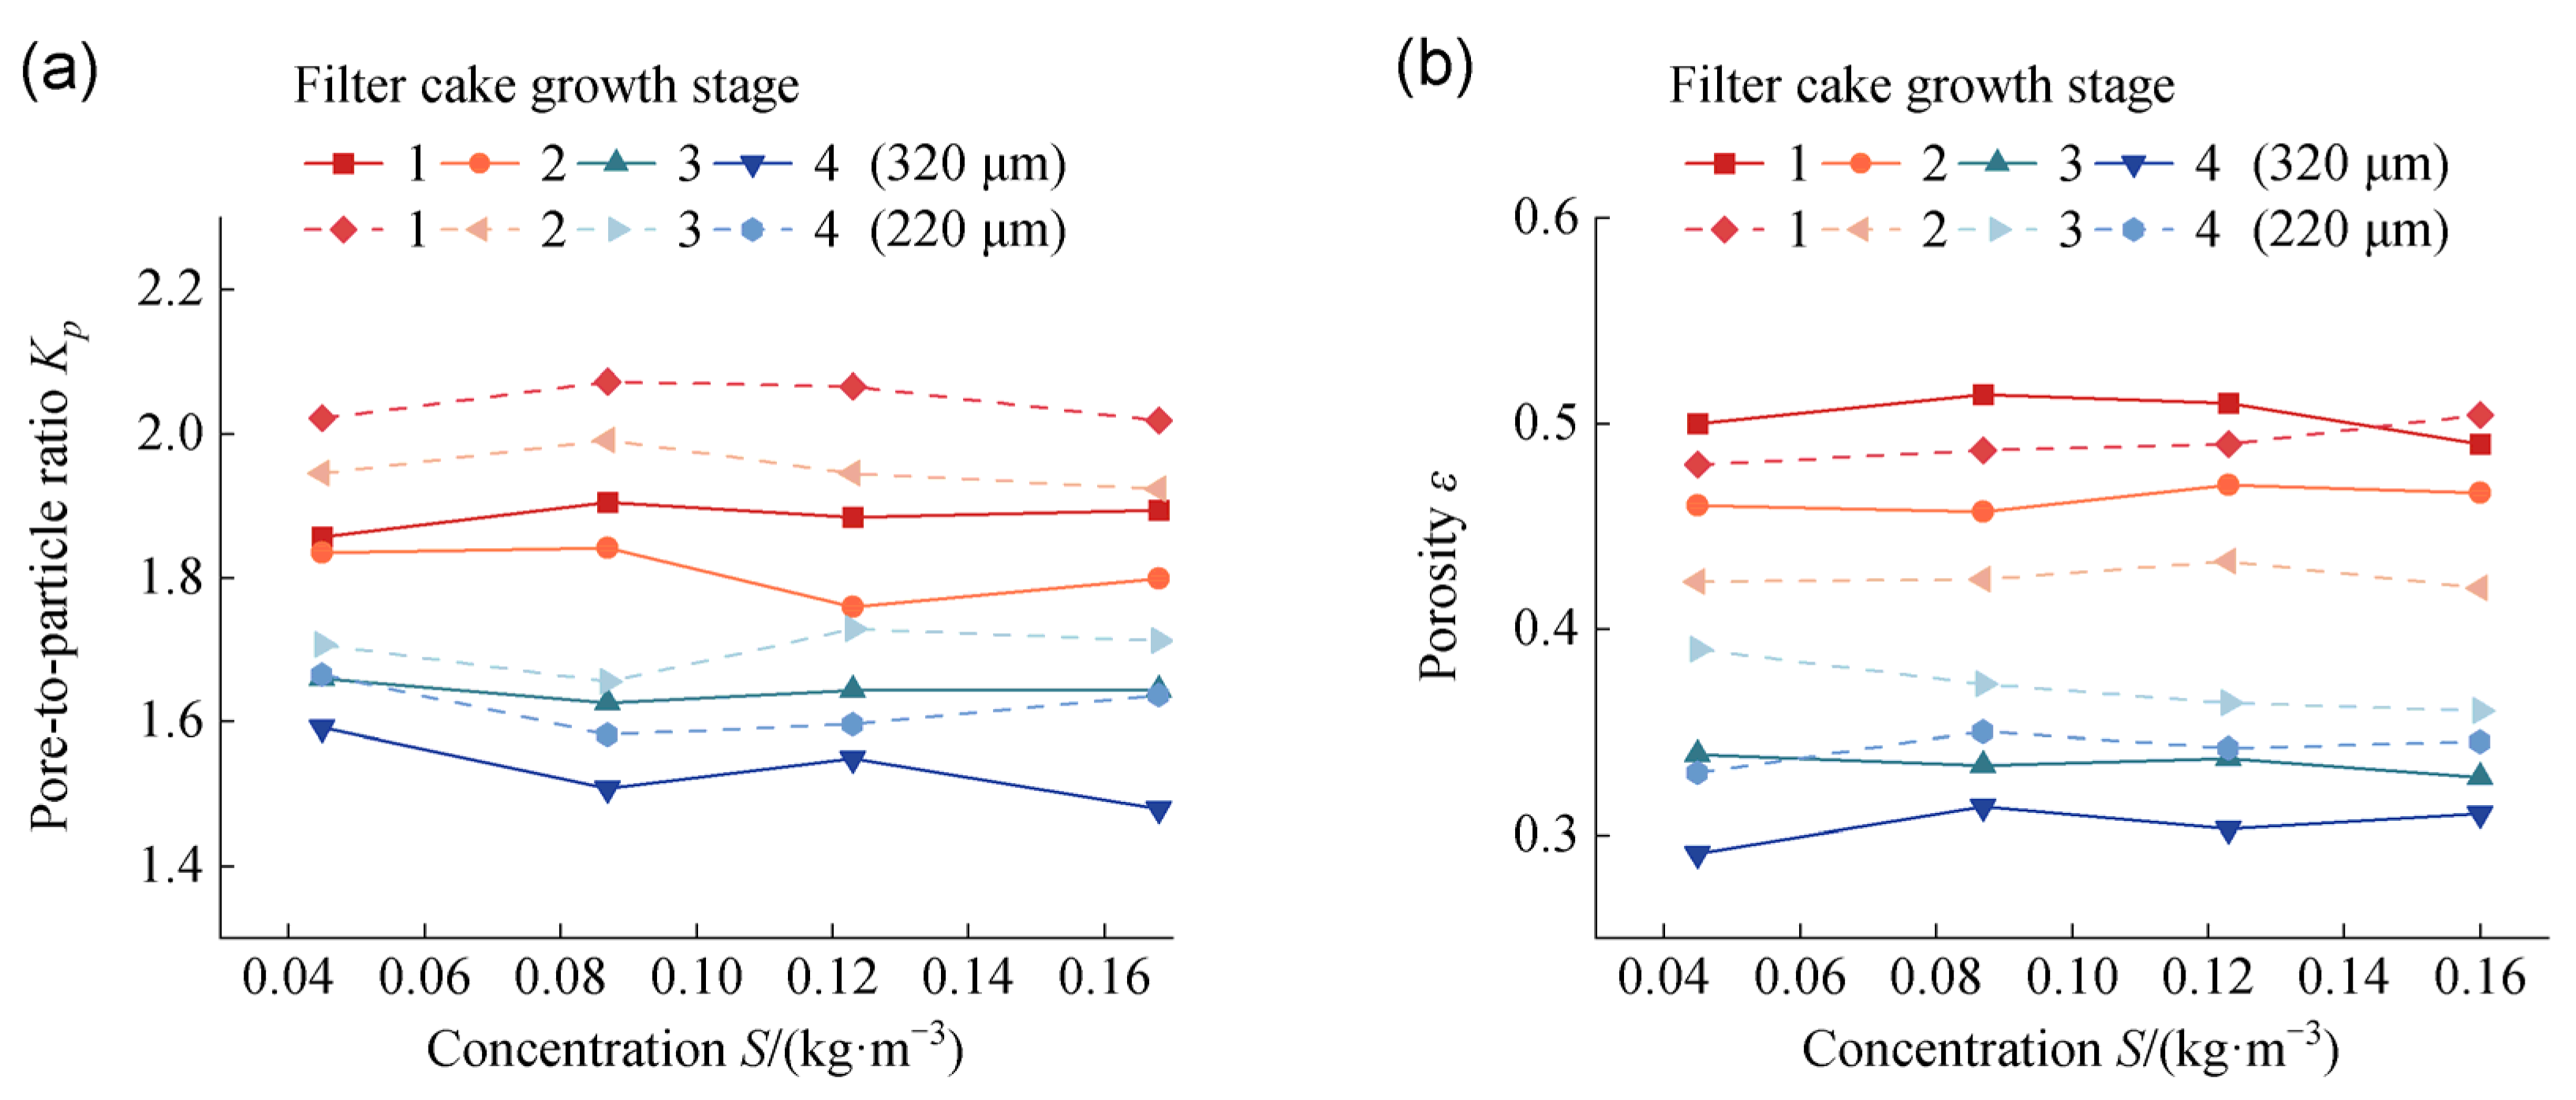
3.3. Aperture Characteristics of Growing Filter Cake under Different Working Conditions

As shown in Figure 7, comparing the structural parameters of filter cake in two aperture sizes, it was found that the median particle size, pore-to-particle ratio, and porosity decreased with the advancement of the filter cake growth stage. This indicated that the cake growth process was a process of filling the aperture space with particles, starting from larger to smaller ones, step by step.
As can be seen in Figure 8, two aperture sizes showed a similar pattern with an increase in flow rate, when the parameters of the filter cake structure were compared under various flow conditions at the same stage. With an increase in flow rate at the M1 and M2 stages, the pore-to-particle ratio and porosity of the filter cake of both mesh sizes increased. For instance, when the flow rate was increased from 140 m3/h to 170 m3/h at the M1 stage, the pore-to-particle ratio of the 320 μm aperture size experimental group increased from 1.78 to 1.9, and the porosity from 0.48 to 0.54. It was found that the influence of flow on the structural parameters of the filter cake was mainly due to the factors of the sand carrying capacity of flow and particle tracking characteristics. The higher the flow rate, the stronger the sand carrying capacity of the flow was, and the stronger the movement of the particle. At the M1 and M2 stages, when the filter mesh was used as the filter medium, the higher flow rate resulted in more filtered particles following the water flow through the mesh. Consequently, the percentage of intercepted filter cake particles on the filter mesh increased. This led to a larger average median particle size of the filter cake and a corresponding increase in porosity. This was consistent with the above analysis of the impact of flow rate on the composition of the cake particle size distribution, which was attributed to the inherent relationship between the particle size composition and the structural parameters of the cake. At the M3 and M4 stages, the pore-to-particle ratio and porosity of the filter cake with two aperture sizes decreased as the flow rate increased. At that time, the intercepted large particles in the filter network formed a cake skeleton; small particles relied on the water flow, constantly filling the small pores in the skeleton structure, and caused the cake’s internal extrusion. With the increase in flow, the particles continuously adjusted their positions. The stronger the interaction between the particles in the cake, the more compact the formation of the cake became, resulting in smaller pores. Comparing the structural parameters of the filter cake under different concentration conditions at the same stage, as shown in Figure 9, it is found that the concentration has a minimal effect on the porosity of the filter cake. With an increase in concentration, the porosity of the filter cake tends to change steadily.
Figure 8a and Figure 9a display the pore-to-particle ratio parameters for the aperture sizes of 320 μm and 220 μm under the same growth phases and circumstances. The findings showed that in every growth stage, the filter cake’s pore-to-particle ratio was higher for the 220 μm aperture. According to the analysis, the 220 μm aperture size filter has a smaller filter aperture and intercepts smaller particles in the filter cake for the same incoming sediment gradation. However, this is because the 220 μm aperture size filter’s inlet particles have a higher concentration of large-sized particles. As a result, for the 220 μm pore size, the intercepted filter cake’s pore-to-particle ratio is higher than for the 320 μm pore size. The porosity of the 320 μm aperture size is greater than that of the 220 μm aperture size at M1 and M2, as Figure 8b and Figure 9b illustrate. The filtering medium in these two phases is a screen, and because the 320 μm aperture size is substantially larger than the 220 μm aperture size, it is more difficult to fill the 320 μm aperture size in the filtration, and more particles with larger sizes are required. Additionally, the 320 μm aperture filter yields a bigger porosity in the cake since its diameter, or the filter wire’s diameter, is likewise substantially larger than that of the 220 μm aperture. This means that the 320 μm aperture also has a larger particle spacing. The porosity of the 220 μm aperture is more than that of the 320 μm aperture at the M3 and M4 stages. There are two reasons for this; one is that the 220 μm aperture has more intercepted particles in the inlet gradation. Therefore, more large particles than those in the 320 μm aperture are intercepted in the 220 μm aperture to form the cake in the following stages, and a larger porosity in the filter cake is the result of more large particles. Second, because the filter cake is the primary filtration medium and the 220 μm aperture is tiny during the early stages of the filter cake skeleton’s aperture creation, the re-entry of small particles becomes more challenging as they get larger. The surface of the filter cake experiences more frequent and severe particle collisions because of the larger particle content of the 220 μm imported particles compared to those of the 320 μm aperture. This ultimately results in a more porous and loose surface structure.

3.4. Porosity Regression Equation Establishment

Cake porosity is an important parameter reflecting the degree of cake densification and filter clogging status. Based on the results of orthogonal experiments under each working condition, shown in Table 2 and Table 3, Minitab Statistical Software (Minitab 20.3) was used to analyze the ANOVA of the filter cake porosity [21,22]. The analysis results are shown in Table 4 and Table 5.
The regression equation for the cake porosity of the 320 μm aperture size screen is
ε = 0.5758 − 0.0150 Q − 0.0451 S − 0.0322 M + 0.0204 Q × S − 0.0090 Q × M + 0.0066 S × M − 0.00340 Q × S × M
As can be seen from Table 2, the p-value of the regression model for cake porosity is less than 0.01, and the regression model is highly significant. The coefficient of determination of the model, R2 =91.33%, indicates that the obtained regression model can reflect 91.33% of the variation in the response value. This means that the experiment’s error is small and the obtained regression equation has a good fitting effect.
The regression equation for the cake porosity of the 220 μm aperture size screen is
ε= 0.466 + 0.0071 Q − 0.0069 S − 0.0242 M + 0.0102 Q × S − 0.0061 Q × M + 0.0023 S × M − 0.00194 Q × S × M
As can be seen from Table 3, the p-value of the regression model for cake porosity is less than 0.01, and the regression model is highly significant. The coefficient of determination of the model, R2 = 80.73%, indicates that the obtained regression model can reflect 80.73% of the variation in the response value. It means that the experiment’s error is small and the obtained regression equation has a good fitting effect.

4. Discussion

4.1. Influence of Different Mesh Aperture Sizes on the Structural Characteristics of Filter Cake

The impact of mesh aperture size on filter cake features is rarely taken into account in the literature currently available for the study of filter cake in mesh filters. As the research object for this work, we use mesh filters with 320 μm and 220 μm aperture sizes to examine the effects of various mesh aperture sizes on the structure of the filter cake. The intercepted filter cake’s median particle size decreased with decreasing mesh aperture size, but the pore-to-particle ratio increased in tandem. Researchers’ study [10,23,24,25] concentrated on how particle size and distribution affected membrane flux and linked the membrane aperture clogging process to the ratio of particle size to membrane aperture size (dp/dm). It was concluded that at dp/dm < 2.4, membrane filtration was controlled by membrane aperture clogging and bridging; at dp/dm > 2.4, membrane contamination was dominated by the cake layer formed by particle deposition. Using this as a guide, the partition of the mesh filter’s blocking state can be viewed as follows: sediment filtration is dominated by the interception of the cake layer created by particle deposition; for 320 μm, the pore-to-particle ratio is Kp < 1.7, and for 220 μm, the pore-to-particle ratio is Kp < 1.95. The results of the experiment showed that as the filter cake grew, the pore-to-particle ratios of the filter cake, which were created by both aperture sizes, proportionately dropped. According to this analysis, the larger the median particle size of the imported sediment, the easier it is to get a larger pore-to-particle ratio for intercepting the filter cake. Additionally, the M1 and M2 stages continue for a longer period of time, effectively delaying the clogging of the filter. This is consistent with the studies of Zhang [26] and Yu [27].
From the analysis shown in Figure 8b and Figure 9b, it is found that when the aperture of the screen is smaller, the aperture size of the filter cake skeleton formed in the early stage is smaller. This results from the higher content of imported large particles at the small aperture screen. More large particles will interact with the filter cake’s surface layer, either by penetrating the cake or by reacting with the surface particles to loosen the filter cake layer’s structure. According to this analysis, the inner layer of the cake structure is more solid and has a smaller porosity during the clogging stage of cake creation when the filter mesh’s aperture size is smaller, while the cake particles’ surface layer is more porous and looser. After the experiment, the filter cake layer was cleaned, and it was discovered that the 220 μm surface layer that corresponded to the filter cake was simple to peel off. However, the particles in the inner layer were tightly embedded and more difficult to clean off. This experiment phenomenon also verified the accuracy of the analysis.

4.2. Effect of Flow on Filter Cake Structure

The effect of flow rate on filter cake structure needs to be analyzed in stages. For the period of slow growth of the filter cake, the proportion of filtered particles in this stage of the cake decreases with the increase in flow rate, and both the pore-to-particle ratio and porosity are positively correlated with the flow rate, whereas in the stage of filter cake filtration, the proportion of filtered particles smaller than the aperture size of the filter screen increases significantly with the increase in flow rate, and both the pore-to-particle ratio and porosity are positively correlated with the flow rate. The main reason for this result is the increased randomness of different particle sizes at different flow rates. Existing works illustrate that the higher the flow rate, the smaller the particle size and the better the particle follows the flow [28,29]. In the early stage of filter cake growth, more small filtered particles follow the water flow through the mesh as the flow rate increases. And after the formation of the filter cake, the greater flow rate will force the small particles into the narrow overflow channels in the filter cake, which will eventually be retained and form a dense filter cake layer. According to the pressure drop time curve, the higher the flow rate, the greater the pressure drop of the blockage, and the greater the force of the water flow on the filter cake layer, resulting in filter cake particles that are constantly squeezed by the force to fill the pores, so the porosity decreases. In actual operation, the existing mesh filter may have an automatic cleaning function [30,31,32], and clogging state is related to cleaning problems; the smaller the cake’s porosity and the denser the cake, the greater the difficulty of self-cleaning. Therefore, according to the acceptable level of porosity during operation, it is important to choose the appropriate filtration flow rate and time to start cleaning to avoid the occurrence of the cake’s porosity being too small. Otherwise the filter mesh cleaning will not be effective.

4.3. Porosity Regression Model Analysis

Based on the experimental findings, a mesh filter cake porosity model was developed, taking into account growth stage, concentration, and flow rate. However, the study did not integrate the effect of the filter aperture size on porosity to establish a unified model of porosity that includes different aperture sizes. A crucial starting point for assessing the clogging condition when the mesh filter is actually operating is the filter pressure drop. The K-C equation [33,34] states that porosity plays a crucial role in determining the pressure drop in the filter cake. Further research can clarify the connection between the porosity model and filter pressure drop. For the relationship between pressure drop and porosity, Zong, Yang [9] used the K-C equation to establish a theoretical formula of filter pressure drop, cake thickness, screen aperture, and cake porosity.
However, measuring the cake’s thickness and porosity is not feasible in real-world operations. In order to more accurately assess and forecast filter clogging in the filtration process under varied working settings, the pressure drop model of filter cake growth was built using the operational variables of the working conditions. Subsequent research can use the porosity model to create a model considering other structural characteristics of the filter cake, together with the theoretical formula for the pressure drop of the filter cake. Finally, a model of the dynamic change of the structural parameters with the growth of the filter cake and a pressure drop model applicable to different operating conditions can be constructed.

5. Conclusions

  • The growth of the filter cake is a process that begins with the filling of the mesh with easily intercepted particles and proceeds to the subsequent filling of the aperture spaces of the large particle skeleton with filtered particles, with the proportion of easily intercepted particles gradually decreasing and the proportion of filtered particles increasing step by step. When the aperture size of the filter mesh is smaller, the intercepted particles’ proportion are larger, and the proportion of filtered particles in the formed filter cake is smaller. For clogged filter cake, the larger the flow rate was, the larger the proportion of filtered particles in the cake was.
  • As the growth stage of the filter cake increases, the median particle size, pore-to-particle ratio, and porosity decrease. These are affected by the sand carrying capacity of the flow. In the M1 and M2 stages, the higher the flow rate, the larger the porosity was; however, in the M3 and M4 stages, the higher the flow rate, the smaller the porosity was; concentration does not correlate well with filter cake porosity. According to the acceptable porosity level for the self-cleaning ability of the filter during operation, the appropriate filtration flow rate and the beginning of the cleaning time should be selected to avoid the situation wherein the cake porosity is too small and the filter mesh is not cleaned.
  • The regression model of filter cake porosity based on flow rate, concentration, and growth stage under 320 μm aperture and 220 μm aperture conditions was established according to the results of orthogonal experiments, and the model coefficients of determination, R2, were 90.33% and 80.73%, respectively, with a good fitting effect. The model can provide a reference for constructing other models of filter cake parameters or pressure drop models under different working conditions of mesh filters.

Author Contributions

Conceptualization, Y.L., Z.L. and H.J.; methodology, Z.L.; software, Y.L.; validation, Y.L., Q.Z. and C.L.; formal analysis, Z.L.; resources, Z.L.; data curation, C.L.; writing—original draft preparation, Y.L.; writing—review and editing, Y.L. and Z.L.; modifications, Q.Z. and H.J.; All authors contributed equally to this paper. All authors have read and agreed to the published version of the manuscript.

Funding

This research was funded by the National Natural Science Foundation of China (12162030).

Institutional Review Board Statement

Not applicable.

Data Availability Statement

Data are contained within the article.

Conflicts of Interest

Author Heyi Jing was employed by the company Xinjiang Huili Irrigation Technology Company Limited. The remaining authors declare that the research was conducted in the absence of any commercial or financial relationships that could be construed as a potential conflict of interest.

References

  1. Ibor, C.S.; Juárez, J.M.; Mollá, M.G. Towards a new efficiency paradigm for drip irrigation? Changes in water allocation and management in irrigation and wetland systems. Agric. Syst. 2024, 216, 103910. [Google Scholar] [CrossRef]
  2. Feng, J.; Jiao, Y.; Yang, L.; Han, M.; Liu, H. Filter drip irrigation system and its performance testing research progress. J. Chin. Agric. Mech. 2020, 41, 74–82. [Google Scholar]
  3. Kolesova, N.G.; Kudryavtseva, L.V.; Afanasyev, V.S. Technical Solutions for Drip Irrigation Systems. Power Technol. Eng. 2023, 56, 639–642. [Google Scholar] [CrossRef]
  4. Yang, H.; Liu, Z.; Lei, C.; Lu, C. Pump before and after pump combination screen filter filtration performance study. J. Drain. Irrig. Mach. Eng. 2024, 1–7. [Google Scholar]
  5. Yu, L.; Li, J.; Li, N.; Chen, Z. Effects of different mesh and cylinder models on the performance of Y-mesh filter. Trans. Chin. Soc. Agric. Eng. 2023, 39, 97–105. [Google Scholar]
  6. Xi, W.; Jin, Z.; Li, Q.; Tao, H. Effect of flow rate and sediment content on hydraulic performance and filtration performance of floating mesh rotary filter. Water Sav. Irrig. 2024, 5, 46–51. [Google Scholar]
  7. Yuan, J.; Zhu, D.; Sun, S. Drip irrigation system laminated filter structure parameter optimization. Trans. Chin. Soc. Agric. Eng. 2024, 40, 133–141. [Google Scholar]
  8. Wen, Q. Study on Filtration Mechanism Analysis and Control System of Automatic Self-Cleaning Filter. Master’s Thesis, Zhejiang University, Hangzhou, China, 2004. [Google Scholar]
  9. Zong, Q.; Yang, H.; Liu, Z.; Ge, Y. Clogging reason analysis and pressure drop calculation of screen filter. Trans. Chin. Soc. Agric. Mach. 2017, 48, 215–222. [Google Scholar]
  10. Zeier, K.R.; Hills, D.J. Trickle irrigation screen filter performance as affected by sand size and concentration. Trans. ASAE 1987, 30, 735–0739. [Google Scholar] [CrossRef]
  11. Fei, Z.; Dong, X.; Fan, Y.; Ma, X. Study on micro-pore structure of filter cake based on micro-CT technique. Min. Res. Dev. 2021, 41, 131–135. [Google Scholar]
  12. Chen, R.; Fan, Y.; Feng, Z.; Li, J. Study on Effect of Concentration and particle size on filter cake structure of fine coal. China Min. Ind. 2017, 26, 133–138. [Google Scholar]
  13. Li, D.D.; Cui, X.; Huang, J.Q.; Han, Y.B. An Experimental on Filtration and Clogging of Geotextile Filters around Drain Pipes in Fine Tailings. KSCE J. Civ. Eng. 2024, 28, 1767–1776. [Google Scholar] [CrossRef]
  14. Vanessa, P.; Kilian, S.; Sergiy, A. A Coupled CFD-DEM Model for Resolved Simulation of Filter Cake Formation during Solid-Liquid Separation. Processes 2021, 9, 826. [Google Scholar] [CrossRef]
  15. Song, Y.; Wang, H.; Li, A.; Wang, X. Shield tail synchronous grouting aqueous silty sand layer cake growth rate research. J. Railw. Sci. Eng. 2023, 20, 2974–2986. [Google Scholar]
  16. TATSUMI, T.; TAMURA, S.; NISHINO, Y. Density measurement by water-phase over-drain method. GPI J. 2016, 2, 130–134. [Google Scholar]
  17. Zhang, K.; Yu, L.; Liu, K.; Cao, D.; Li, N.; Wu, F. Calculation of interception rate of mesh filter and analysis of its influencing factors. Trans. Chin. Soc. Agric. Eng. 2021, 37, 123–130. [Google Scholar]
  18. Zhong, J.; Xu, N.; Shi, J. Effect of particle size and membrane aperture on ceramic membrane microfiltration of micron particle suspension. J. Chem. Eng. Univ. 2000, 230–234. [Google Scholar] [CrossRef]
  19. Martin, H.; Ehsan, F.; Martina, G.; Thomas, B. Compression Mechanism in Multilayered Filter Cakes. Chem. Eng. Technol. 2021, 44, 1900–1907. [Google Scholar]
  20. Lu, J.; Guo, R.; Wang, C.; Lu, W.H. Clogging Mechanism Analysis of Microporous filter membrane based on Solid Particle Size Distribution. Chin. J. Mech. Eng. 2018, 54, 145–151. [Google Scholar] [CrossRef]
  21. Tao, M.; Zhou, M. Analysis of Fiber Mechanics index Measurement System based on Minitab software. High-Tech Fibers Appl. 2020, 45, 45–50. [Google Scholar]
  22. Tolgahan, E.; Fatih, T. Investigation of DOE model analyses for open atmosphere laser polishing of additively manufactured Ti-6Al-4V samples by using ANOVA. Opt. Laser Technol. 2024, 168, 109832. [Google Scholar] [CrossRef]
  23. Mc Donogh, R.M.; Welsch, K.; Fane, A.G.; Fell, C.J. Flux and rejection in the ultrafiltration of colloids. Desalination 1988, 70, 251–264. [Google Scholar] [CrossRef]
  24. Tanaka, T.; Yamagiwa, Y.; Nagano, T.; Taniguchi, M.; Nakanishi, K. Relationship between Cake Structure and Membrane Pore Size in Crossflow Filtration of Microbial Cell Suspension Containing Fine Particles. J. Chem. Eng. Jpn. 2001, 34, 1524–1531. [Google Scholar] [CrossRef]
  25. Hosseini, P.K.; Shariati, F.P.; Amrei, H.D.; Heydarinasab, A. The influence of various orifice diameters on cake resistance and pore blocking resistance of a hybrid membrane photobioreactor (HMPBR). Sep. Purif. Technol. 2020, 235, 116187. [Google Scholar] [CrossRef]
  26. Zhang, G. Discussion on screen size ratio and reasonable value of Two kinds of pressure drop for micro-irrigation filter. Sprink. Irrig. Technol. 1992, 31–35, (In Chinese with English Abstract). [Google Scholar]
  27. Yu, L.; Xu, Z.; Yang, J.; Li, N.; Liu, K. Numerical simulation of local clogging in screen filter based on coupled DEM-CFD. Trans. Chin. Soc. Agric. Eng. 2018, 34, 130–137. [Google Scholar]
  28. Cao, B.; Zou, Y.; Xia, J. Different size particles in unsteady pipe flow follow test. Adv. Water Sci. 2017, 28, 356–363. [Google Scholar]
  29. Wu, Y.; Zhou, Y.; Cao, B. Based on the technology of PIV experimental research on coarse particle in the pipe flow with sex. Water Dyn. Res. Prog. 2017, 32, 739–746. [Google Scholar]
  30. Liu, Z.; Shi, K.; Li, M.; Wen, X.; Xie, Y. Experimental study on head loss of vertical and horizontal self-cleaning mesh filters. J. Irrig. Drain. 2019, 12, 44–50. [Google Scholar]
  31. Xie, Y.; Liu, Z.; LI, J.; Zong, Q.; Jin, J.; Kai, S. Numerical simulation of filtration and sewage discharge process of horizontal self-cleaning mesh filter. J. Zhejiang Univ. (Agric. Life Sci.) 2022, 48, 117–124. [Google Scholar]
  32. Wu, Y.; Liu, Z.; Xie, Y.; Chini, S.F. Numerical Simulation and Structural Optimization of sewage system of Self-cleaning net filter. China Rural. Water Resour. Hydropower 2022, 128–133. [Google Scholar] [CrossRef]
  33. Sanzeni, A.; Colleselli, F.; Grazioli, D. Specific Surface and Hydraulic Conductivity of Fine-Grained Soils. J. Geotech. Geoenviron. Eng. 2013, 139, 1828–1832. [Google Scholar] [CrossRef]
  34. Peijie, Y.; Huihui, S.; Hairui, M.; Wuchao, Y.; Zhi, H.; Xiaonan, Z. The modification of the Kozeny-Carman equation through the lattice Boltzmann simulation and experimental verification. J. Hydrol. 2022, 609, 127738. [Google Scholar]
Figure 1. Test layout.
Agriculture 14 01296 g001
Figure 2. Schematic diagram of mesh holes of mesh filter, (a) 320 μm aperture, (b) 220 μm aperture.
Agriculture 14 01296 g002
Figure 3. Distribution diagram of sediment particles in water source, (a) particle grading curve; (b) sediment particle sample of water source.
Agriculture 14 01296 g003
Figure 4. Pressure drop curves of mesh filter with time under different working conditions. (a) Different flow rates with 320 μm aperture, (b) different concentrations with 320 μm aperture, (c) different flow rates with 220 μm aperture, (d) different concentrations with 220 μm aperture.
Agriculture 14 01296 g004
Figure 5. Proportions of particle size distribution at different growth stages with different flow rates: (a) M1 stage, (b) M2 stage, (c) M3 stage, (d) M4 stage.
Agriculture 14 01296 g005
Figure 6. Proportions of particle size distribution at different growth stages with different particle concentrations: (a) M1 stage, (b) M2 stage, (c) M3 stage, (d) M4 stage.
Agriculture 14 01296 g006
Figure 7. Changes in filter cake parameters at different growth stages: (a) median particle size d50 varies with the growth stage at different flow rates, (b) median particle size d50 varies with the growth stage at different concentrations, (c) pore-to-particle ratio Kp varies with the growth stage at different flow rates, (d) pore-to-particle ratio Kp varies with the growth stage at different concentrations, (e) porosity ε varies with the growth stage at different flow rates, (f) porosity ε varies with the growth stage at different concentrations.
Agriculture 14 01296 g007aAgriculture 14 01296 g007b
Figure 8. Structural parameters of filter cake with different flow rates: (a) pore-to-particle ratio Kp, (b) porosity ε.
Agriculture 14 01296 g008
Figure 9. Structural parameters of filter cake with different flow rates: (a) pore-to-particle ratio Kp, (b) porosity ε.
Agriculture 14 01296 g009
Table 1. Test factor level table.
LeverFlow Rate Q/m3/hConcentration S/kg/m3Growth Stage M
11400.0451
21500.0872
31600.1233
41700.1604
Table 2. Analysis of variance of porosity of 320 μm aperture filter.
SourceDegree of FreedomAdj SSAdj MSF Valuep-Value
Regression70.1091840.01559823.560.000
Flow rate Q10.0000750.0000750.110.745
Concentration S10.0006760.0006761.020.342
Stage M10.0003440.0003440.520.492
Flow × concentration10.0012100.0012101.830.213
Flow × stage10.0002360.0002360.360.567
Concentration × stage10.0001280.0001280.190.672
Flow × concentration × stage10.0003110.0003110.470.512
Error80.0052960.000662
Total150.114480
Table 3. Orthogonal experiment results with 220 μm aperture filter.
Experimental Group Flow Rate Q/m3/hConcentration S/kg/m3Growth Stage MPorosity Factor
11110.451
21220.419
31330.407
41440.380
52120.423
62210.45
72340.351
82430.371
93130.358
103240.342
113310.523
123420.495
134140.327
144230.35
154320.511
164410.531
Table 4. Orthogonal experiment results with 320 μm aperture filter.
Experimental Group Flow Rate Q/m3/hConcentration S/kg/m3Growth Stage MPorosity Factor
11110.485
21220.46
31330.374
41440.36
52120.461
62210.49
72340.333
82430.357
93130.33
103240.303
113310.514
123420.46
134140.27
144230.31
154320.48
164410.55
Table 5. Analysis of variance of porosity of 220 μm aperture filter.
SourceDegree of FreedomAdj SSAdj MSF Valuep-Value
Regression70.0636850.0090989.980.002
Flow rate Q10.0000170.0000170.020.896
Concentration S10.0000160.0000160.020.898
Stage M10.0001950.0001950.210.656
Flow × concentration10.0003040.0003040.330.580
Flow × stage10.0001070.0001070.120.741
Concentration × stage10.0000150.0000150.020.900
Flow × concentration × stage10.0001020.110.747
Error80.000912
Total15
Disclaimer/Publisher’s Note: The statements, opinions and data contained in all publications are solely those of the individual author(s) and contributor(s) and not of MDPI and/or the editor(s). MDPI and/or the editor(s) disclaim responsibility for any injury to people or property resulting from any ideas, methods, instructions or products referred to in the content.

