Article

Genome-Wide Identification of Caffeic Acid O-Methyltransferase Gene Family in Medicago truncatula: MtCOMT13-Mediated Salt and Drought Tolerance Enhancement

1
College of Grassland Science, Qingdao Agricultural University, Qingdao 266109, China
2
Key Laboratory of National Forestry and Grassland Administration on Grassland Resources and Ecology in the Yellow River Delta, Qingdao 266109, China
3
Qingdao Key Laboratory of Specialty Plant Germplasm Innovation and Utilization in Saline Soils of Coastal Beach, Qingdao 266109, China
*
Author to whom correspondence should be addressed.
Agriculture 2024, 14(8), 1305; https://doi.org/10.3390/agriculture14081305
Submission received: 24 May 2024 / Revised: 5 August 2024 / Accepted: 5 August 2024 / Published: 7 August 2024
(This article belongs to the Section Crop Genetics, Genomics and Breeding)

Abstract

:
Legumes are important grains and forages, providing high-quality proteins, vitamins, and micronutrients to humans and animals. Medicago truncatula is a close relative of alfalfa (Medicago sativa). Caffeic acid O-methyltransferase (COMT), a key gene that is identified to be essential for melatonin synthesis, plays a significant role in plant growth, development, and abiotic stress responses. However, a systematic study on the COMT gene family in M. truncatula has still not been reported. In this study, 63 MtCOMT genes were identified and categorized into three groups. Gene structure and conserved motif analyses revealed the relative conservation of closely clustered MtCOMTs within each group. Duplicated events in MtCOMT members were identified, and segmental duplication was the main mean. Cis-acting element prediction revealed the involvement of MtCOMTs in growth and development and response to light, stress, and plant hormones. RNA-seq data analysis showed that 57 MtCOMTs varied under salt and drought stresses. The RT-qPCR expression patterns showed that MtCOMT9, MtCOMT13, MtCOMT22, MtCOMT24, MtCOMT43, and MtCOMT46 were related to salt and drought responses in M. truncatula. Additionally, Arabidopsis thaliana overexpressing MtCOMT13 displayed superior plant growth phenotypes and enhanced tolerance to salt and drought stresses through higher photosynthetic parameters and activities of antioxidant enzymes, which indicated that MtCOMT13 played an important role in positively regulating plant salt and drought tolerance. These findings contribute to an improved understanding of MtCOMTs’ roles in abiotic stress responses in M. truncatula, providing an important theoretical basis and genetic resource for legume species resistance breeding in the future.

1. Introduction

Climate and environmental change lead to land deterioration, which negatively impacts agricultural production and food security [1]. Among environmental constraints, salt and drought are the main abiotic stressors that substantially affect plant physiological and biochemical processes, ultimately resulting in decline in biomass yield [2,3]. For a long time, salt and drought have been recognized as worldwide problems, particularly in arid and semi-arid regions, where their prevalence is higher, with up to 45% in farmlands experiencing water-shortages and 20–50% of saline–alkaline irrigated land, in comparison to normal irrigation conditions [4,5,6,7]. Therefore, it is of great significance to generate and cultivate new plants that can adapt to salt and drought conditions, which will improve the use efficiency of marginal land, increase crop yield, and ensure food security.
Melatonin has been reported to be an important antioxidant in plants [8,9]. It enhances plant tolerance to multiple abiotic stresses, including cold [10], salt [11], drought [12], oxidation [13], and nutrient deficiency [14], through the direct scavenging of reactive oxygen species or indirect effects on antioxidant enzyme activity, photosynthetic efficiency, and metabolite content [15]. In addition, melatonin is reported to be associated with plant developmental regulation like root organogenesis [16], growth [17], flowering [18], and aging [19,20]. In plants, six enzymes are involved in the biosynthesis of melatonin, namely tryptophan decarboxylase (TDC), tryptophan hydroxylase (TPH), tryptamine 5-hydroxylase (T5H), serotonin N-acetyltransferase (SNAT), N-acetylserotonin methyltransferase (ASMT), and caffeic acid O-methyltransferase (COMT) [21]. In plants, melatonin biosynthesis involves four different pathways, all of which require four enzymatic reaction steps and use serotonin as an intermediate, indicating its importance in melatonin synthesis [21]. In the classic pathway of melatonin biosynthesis, firstly, TDC catalyzes the decarboxylation of tryptophan to produce tryptamine, which is catalyzed by the action of T5H into serotonin. Then, serotonin is converted to N-acetyl-5-serotonin by SNAT enzyme [22], and, finally, N-acetyl-5-serotonin is catalyzed by O-methyltransferase (ASMT/COMT) and converted into melatonin.
Previous studies on some plants have shown that the COMT genes play significant roles in different biological functions [23]. The COMT gene is responsible for regulating O-methylation and is involved in S-type lignin biosynthesis [24]. For instance, COMT downregulation in genetically modified alfalfa (Medicago sativa) had a greater impact on S-type lignin than on G-type lignin [25]. Similarly, in Panicum virgatum, the downregulation of COMT has also been proven to change lignification and improve biofuel yield [26]. Overexpressed TaCOMT could improve melatonin levels, contribute to plant growth, and enhance drought tolerance in transgenic Arabidopsis thaliana [27]. In Citrullus lanatus, ClCOMT1 was upregulated by cold, drought, and salt stress and led to an increase in melatonin content [28]. Genome-wide analysis in many plant species has shown that the COMT gene family is composed of multiple members, such as 25 BnCOMTs, 55 GmCOMTs, 92 VcCOMTs, 190 GhCOMTs, and 25 BpCOMTs, respectively, in Brassica napus [29], soybean (Glycine max) [24], blueberry (Vaccinium corymbosum) [30], cotton (Gossypium hirsutum) [31], and Betula pendula [32]. Additionally, the expressions of COMT genes were analyzed, and their functions in abiotic stress responses are gradually being elucidated. In soybean, GmCOMTs expression profiles indicated their potential roles in salt and drought stress responses [24]. In salt-adapted Arabidopsis cells, CCoAOMT1, a key gene involved in the lignin biosynthesis pathway, enhanced lignin accumulation and response to salt stress [33]. Rice (Oryza sativa) OsCOMTs exhibited higher expression levels in stems and were involved in abiotic stress responses, and OsCOMT8, OsCOMT9, and OsCOMT15 played key roles in lignin synthesis as well [34]. Thus, the COMT gene family is crucial for plant tolerance to abiotic stress.
Legumes are important grains and forages, providing high-quality proteins, vitamins, and microelements to humans and animals. Medicago truncatula is considered as a model legume for studying genomic, genetic, and molecular biology issues, due to its characteristics such as small genome size, short life cycle, and self-pollination [35]. However, the investigations on the COMT gene family in M. truncatula have not been reported. In view of the significant roles of plant COMTs, this study conducted a genome-wide analysis of COMT genes to obtain insights into their specific functions in the model legume. In total, 63 COMT genes were identified in M. truncatula, and phylogenetic relationship, gene structure, protein conserved motifs, chromosome distribution, gene collinearity, and cis-acting elements were analyzed to explore the putative gene functions. The expression profiles of MtCOMTs genes in different tissues and abiotic stress responses were analyzed. Additionally, overexpressed MtCOMT13 enhanced the salt and drought tolerance in transgenic A. thaliana. This study offers new insights into the biological functions of the COMT gene family in M. truncatula under salt and drought stress, and it also lays a theoretical foundation for improving the resistance, yield, and quality of leguminous plants under abiotic stress.

2. Materials and Methods

2.1. Identification of MtCOMT Genes

To identify the COMT genes in M. truncatula, its genome and protein sequences were downloaded from the genome database (https://phytozome-next.jgi.doe.gov/, accessed on 23 July 2023). Protein sequences of AtCOMT from A. thaliana, the known model plant, were obtained from TAIR database (https://www.arabidopsis.org/, accessed on 23 July 2023) and queried against the M. truncatula genome database, using Blastp program (E-value threshold at 1.0 × 10⁻⁵). The Hidden Markov Model (HMM) profiles of dimerization domain (PF08100) and O-methyltransferase domain (PF00891) [36,37], downloaded from Pfam database (http://pfam.xfam.org/, accessed on 1 August 2023), were used for screening MtCOMTs through HMMER 3.3.2 software (http://hmmer.org/download.html, accessed on 3 August 2023). Finally, all the candidate protein sequences were uploaded to a conserved domain database (CDD) in NCBI (https://www.ncbi.nlm.nih.gov/Structure/cdd/cdd.shtml, accessed on 3 August 2023) [38] to further confirm the COMT conserved domains. The identified COMT protein sequences with incomplete conserved functional domain were excluded. The physicochemical properties of proteins, including length, molecular weight (Mw), theoretical isoelectric point (pI), coefficient of instability, liposolubility index, hydrophobicity, and hydrophilicity, were predicted, using the online ExPASy-ProtParam tool (http://web.expasy.org/protparam/, accessed on 19 September 2023). Subcellular localization of MtCOMT genes were predicted through Cell-PLoc 2.0 website (http://www.csbio.sjtu.edu.cn/bioinf/Cell-PLoc-2/, accessed on 19 September 2023).

2.2. Multiple Sequence Alignment and Phylogenetic Analysis

Full-length protein sequences of all COMTs from M. truncatula, M. sativa, A. thaliana, G. max, and O. sativa were aligned using software of Gtf/Gff3 Sequences Extract, Batch Translate CDS to Protein, Two Sequence Files, Simple HMM Search, and Interactive Venn Graph in TBtools package (version 2.008). Phylogenetic tree of COMTs in the above five species was constructed using online software EMBL-EBI [39] (https://www.ebi.ac.uk/Tools/msa/clustalo/, accessed on 20 September 2023) and that of COMTs in M. truncatula was constructed using MEGA-X software 7.0 [40], with both of them adopting the Neighbor-Joining (NJ) method and 1000 bootstraps. Modification and visualization of the phylogenetic tree were available via Interactive Tree Of Life (iTOL) V6 [41] (https://itol.embl.de/, accessed on 20 September 2023).

2.3. Gene Structure and Protein Conserved Motif Analyses

Exon, intron, and UTR structure of MtCOMTs were identified via aligning CDS sequences against corresponding genome annotation files using Gene Structure View (Advanced) software in TBtools package (version 2.008) [42]. Conserved motifs of proteins were obtained through the Multiple Em for Motif Elicitation (MEME) Suite website [43] (http://meme-suite.org, accessed on 10 September 2023), with a maximum motif width, minimum motif width, and maximum motif number of 29, 21, and 6, respectively.

2.4. Chromosomal Localization and Collinearity Analysis

The positional distribution of MtCOMT genes on M. truncatula chromosomes was analyzed based on the annotated gff3 file, which was obtained from Ensembl Plants database (https://plants.ensembl.org/index.html/, accessed on 20 September 2023). MtCOMTs’ physical positions on chromosomes were mapped and illustrated using the software of Gene Location Visualize from GTF/GFF in TBtools package (version 2.008). Genes were designated according to their order of appearance on chromosomes. Intraspecific collinearity and gene duplication events were analyzed using Multiple Collinear Scan Toolkit (MCScanx), Fasta Stats, Text Merge For MCScanX, Text Transformat for MicroSynteny View, Text Block Extract and Filter, Table Row Extract or Filter, and Advanced Circos in TBtools package (version 2.008). Furthermore, interspecific collinearity relationships of COMT genes between the homologs in M. truncatula, M. sativa, G. max, A. thaliana, and O. sativa were verified and visualized with Blastp file and software of One Step MCScanX-super Fast and Dual Systeny Plot in TBtools package (version 2.008).

2.5. Cis-Acting Element Analysis of Gene Promoters

The promoter sequence of the MtCOMT gene (i.e., the sequence 2000 bp upstream of translation initiation codon) was extracted from M. truncatula genome using GXF Sequences Extract and Fasta Extract (Recommended) software in TBtools package (version 2.008). The Cis-acting element in promoter regions was predicted through the PlantCARE website [44] (http://bioinformatics.psb.ugent.be/webtools/plantcare/html/, accessed on 21 September 2023) and visualized using Simple BioSequence View and HeatMap software in TBtools package (version 2.008) [42].

2.6. Expression Pattern Analysis

The data from Gene Expression Atlas (MtExpress V3) for model legume M. truncatula, a comprehensive and curated RNAseq-based database [45] (https://lipm-browsers.toulouse.inra.fr/pub/expressionAtlas/app/v3/, accessed on 21 September 2023), were used to analyze MtCOMT expression patterns in different tissues and responses to salt, drought, and cold stress. MtCOMT expression levels were represented with a log2 scale, and the clustering heatmaps of expression patterns were generated using the HeatMap software in TBtools package (version 2.008).

2.7. Stress Treatments, RNA Extraction, and RT-qPCR Analysis

The M. truncatula (R108 ecotype) seeds used in this study were stored in a −20 °C freezer. Seeds of uniform size were selected and germinated in Petri dishes (110 mm × 110 mm) that were covered by three layers of filter paper moistened with distilled water. Then, seeds were cultured at 20 °C and 40% relative humidity for 16 h of light and 8 h of dark. After 7 days, normal seedlings with consistent growth were selected, fixed with a 5 mm thick polystyrene foam board and sponge, and placed into a culture basin (330 mm × 230 mm × 150 mm) that contained 0.5 × Hoagland nutrient solution. Seedlings were continued to be grown at 25 °C and 45% relative humidity, with a light intensity of 150 μmol/(m2·s) and a photoperiod of 16 h of light and 8 h of dark. The 0.5 × Hoagland nutrient solution was replaced by 1× Hoagland solution after one week, and once a week thereafter. Four-week-old plants were transferred into Hoagland nutrient solution for treatments of salt and drought stress. Simulated salt stress was treated with 100, 150, and 200 mM NaCl; and for drought stress, 200 and 300 mM of mannitol were applied. Roots were, respectively, collected at 0, 6, 12, and 24 h of treatments, immediately frozen in liquid nitrogen, and stored at −80 °C for subsequent RT-qPCR analysis.
Total RNA extraction was performed using Fastpure Plant Total RNA Isolation Kit (Vazyme, Nanjing, China). Then, RNA was reversely transcribed to synthesize the first-strand cDNA using HiScript III 1st Strand cDNA Synthesis Kit (+gDNA wiper) (Vazyme, Nanjing, China). RT-qPCR analysis was carried out using ChamQ SYBR Color qPCR Master Mix (Vazyme, Nanjing, China). MtActin was used as an endogenous reference gene. Primer sequences were designed using Beacon Designer 8 (Table S1), and the specificity was verified by Primer-BLAST program in NCBI (https://ncbi.nlm.nih.gov, accessed on 29 November 2023). The relative expression level of MtCOMTs was determined by the 2−∆∆CT method [46].

2.8. Gene Cloning, Vector Construction, and Genetic Transformation

The specific amplification primers, pCAMBIA3301-MtCOMT13-F/R, were used to amplify the full-length CDS sequence of MtCOMT13 in M. truncatula, with cDNA of R108 ecotype as the template (Table S1). After detection on 1% agarose gel and purification with FastPure Gel DNA Extraction Mini Kit (Vazyme, Nanjing, China), the amplification products were confirmed by sequencing (Sangon Biotech, Shanghai, China). Then, the correctly sequenced PCR product of MtCOMT13 was ligated into pCAMBIA3301 plant transformation vector that was digested by Nco I and Pml I enzymes and driven by CaMV 35S promoter, using a homologous recombination method. After further confirmation by sequencing (Sangon Biotech, Shanghai, China), the pCAMBIA3301-MtCOMT13 recombinant plasmid was transferred into the Agrobacterium tumefaciens EHA105 strain. The pCAMBIA3301-MtCOMT13 vector was transformed into Arabidopsis plants via floral dip method [47]. Transformed Arabidopsis seeds were harvested and cultured on a 0.5 × MS medium that was supplemented with 7.5 mg/L phosphinothricin (PPT) (Solarbio, Beijing, China) for 7 days. Homozygous T3 seeds were obtained and used for further phenotypic and physiological experiments. The regenerated Arabidopsis plants overexpressing MtCOMT13 were verified as transgenic positive lines by PCR and RT-qPCR using pCAMBIA3301-MtCOMT13-F/pCAMBIA3301-R and MtCOMT13-F/R primers, respectively (Table S1).

2.9. Evaluation of Salt and Drought Tolerance in Transgenic Arabidopsis

Sterilized MtCOMT13 transgenic and WT (Col-0 ecotype) Arabidopsis seeds were incubated on a 0.5 × MS medium that was supplemented with 150 mM NaCl or 300 mM mannitol, at 24 °C and 40% relative humidity with a photoperiod of 16 h of light and 8 h of dark. The 0.5 × MS medium without NaCl and mannitol was used as control. During the 7-day germination process, germinated seeds and normal seedlings were counted daily. The seeds were judged to have completed germination when the radicle protruded through the seed coat, and normal seedling morphogenesis was considered complete when there were no defects in root and leaf structures. Germination percentage (or seedling percentage) was calculated as the number of germinated seeds (or normal seedlings)/number of tested seeds × 100%.
After 7 days of cultivation on the 0.5 × MS medium, MtCOMT13-overexpressed and WT Arabidopsis seedlings were transferred to vertical culture dishes containing 150 mM NaCl or 300 mM mannitol on the 0.5 × MS medium. Seedlings continued to grow for another 15 days at 24 °C conditions with 16 h of light and 8 h of dark. The lateral root number, root length, and fresh weight of seedlings were assayed.
Meanwhile, MtCOMT13-overexpressed and WT Arabidopsis seedlings were transplanted into pots and watered regularly for three weeks. Subsequently, plants were irrigated with a 300 mM NaCl solution once a week or subjected to natural drought by withholding water for a period of 21 days. The continuously growing plants without salt and drought treatments were taken as controls. Then, plant growth phenotypes were recorded through photography. Photosynthetic parameters were measured using a photosynthesizer (LI-6800, LI-COR, Lincoln, NE, USA), including chlorophyll content, stomatal conductance, intercellular CO2 concentration, transpiration rate, and net photosynthetic rate. Physiological and biochemical indicators were detected using assay kits (Solarbio, Beijing, China), including content of soluble protein, soluble sugar, proline, and malondialdehyde (MDA), as well as enzyme activity of superoxide dismutase (SOD), peroxidase (POD), and catalase (CAT). Three independent biological replicates were conducted.

2.10. Subcellular Localization of MtCOMT13

The coding sequence of the MtCOMT13 gene was amplified by PCR and inserted into XbaI and BamHI restriction sites of the pAN580-GFP vector, thereby creating the pAN580-MtCOMT13-GFP recombinant plasmid driven by the CaMV 35S promoter. Then, the fusion plasmid was transferred into an Escherichia coli DH5α strain and confirmed by sequencing using pAN580-F/R primers. Thereafter, the correctly sequenced pAN580-MtCOMT13-GFP fusion plasmids were transferred into protoplasts of tobacco (Nicotiana benthamia) leaves, with an empty pAN580-GFP vector as the control. After culturing for 18–24 h in darkness, the transformed protoplasts were monitored under a confocal laser scanning microscope (ZEISS LSM 980, Oberkochen, Germany).

2.11. Statistical Analysis

The data were statistically analyzed with Excel 2010 (Microsoft, Redmond, WA, USA), IBM SPSS Statistics 20.0 (IBM, Armonk, NY, USA), and SigmaPlot 10.0 (Systat, San Jose, CA, USA). Significant differences were analyzed by variance (ANOVA) with Duncan’s test for multiple comparisons at a threshold value of p < 0.05. Experiments including RT-qPCR analysis, seed germination test, seedlings evaluation, photosynthetic parameters, and physiological and biochemical identification were carried out with three independent biological replicates. Data were presented as the mean ± stand error (SE).

3. Results

3.1. Identification of COMT Genes in M. truncatula

In silico analysis, using AtCOMT sequences against M. truncatula database, followed by COMT-specific domain analysis, identified a total of 63 COMT genes, which were designated as MtCOMT1-MtCOMT63 according to their position on chromosomes (Table S2).
The physicochemical properties of MtCOMT members were analyzed and listed in Table S2. Gene length ranged from 509 bp (MtCOMT51) to 7264 bp (MtCOMT13), and CDS length changed from 351 bp (MtCOMT53) to 1497 bp (MtCOMT35). Protein length of MtCOMTs ranged from 116 (MtCOMT53) to 498 (MtCOMT35) amino acids, corresponding to the predicted molecular weight from 12.87 kDa to 56.42 kDa. The pI was between 4.63 (MtCOMT51) and 8.77 (MtCOMT50). In addition, 39 MtCOMTs were predicted to be located in cytoplasm, and others were in the chloroplasts (6), cytoskeleton (5), nucleus (12), and vacuolar membrane (1).

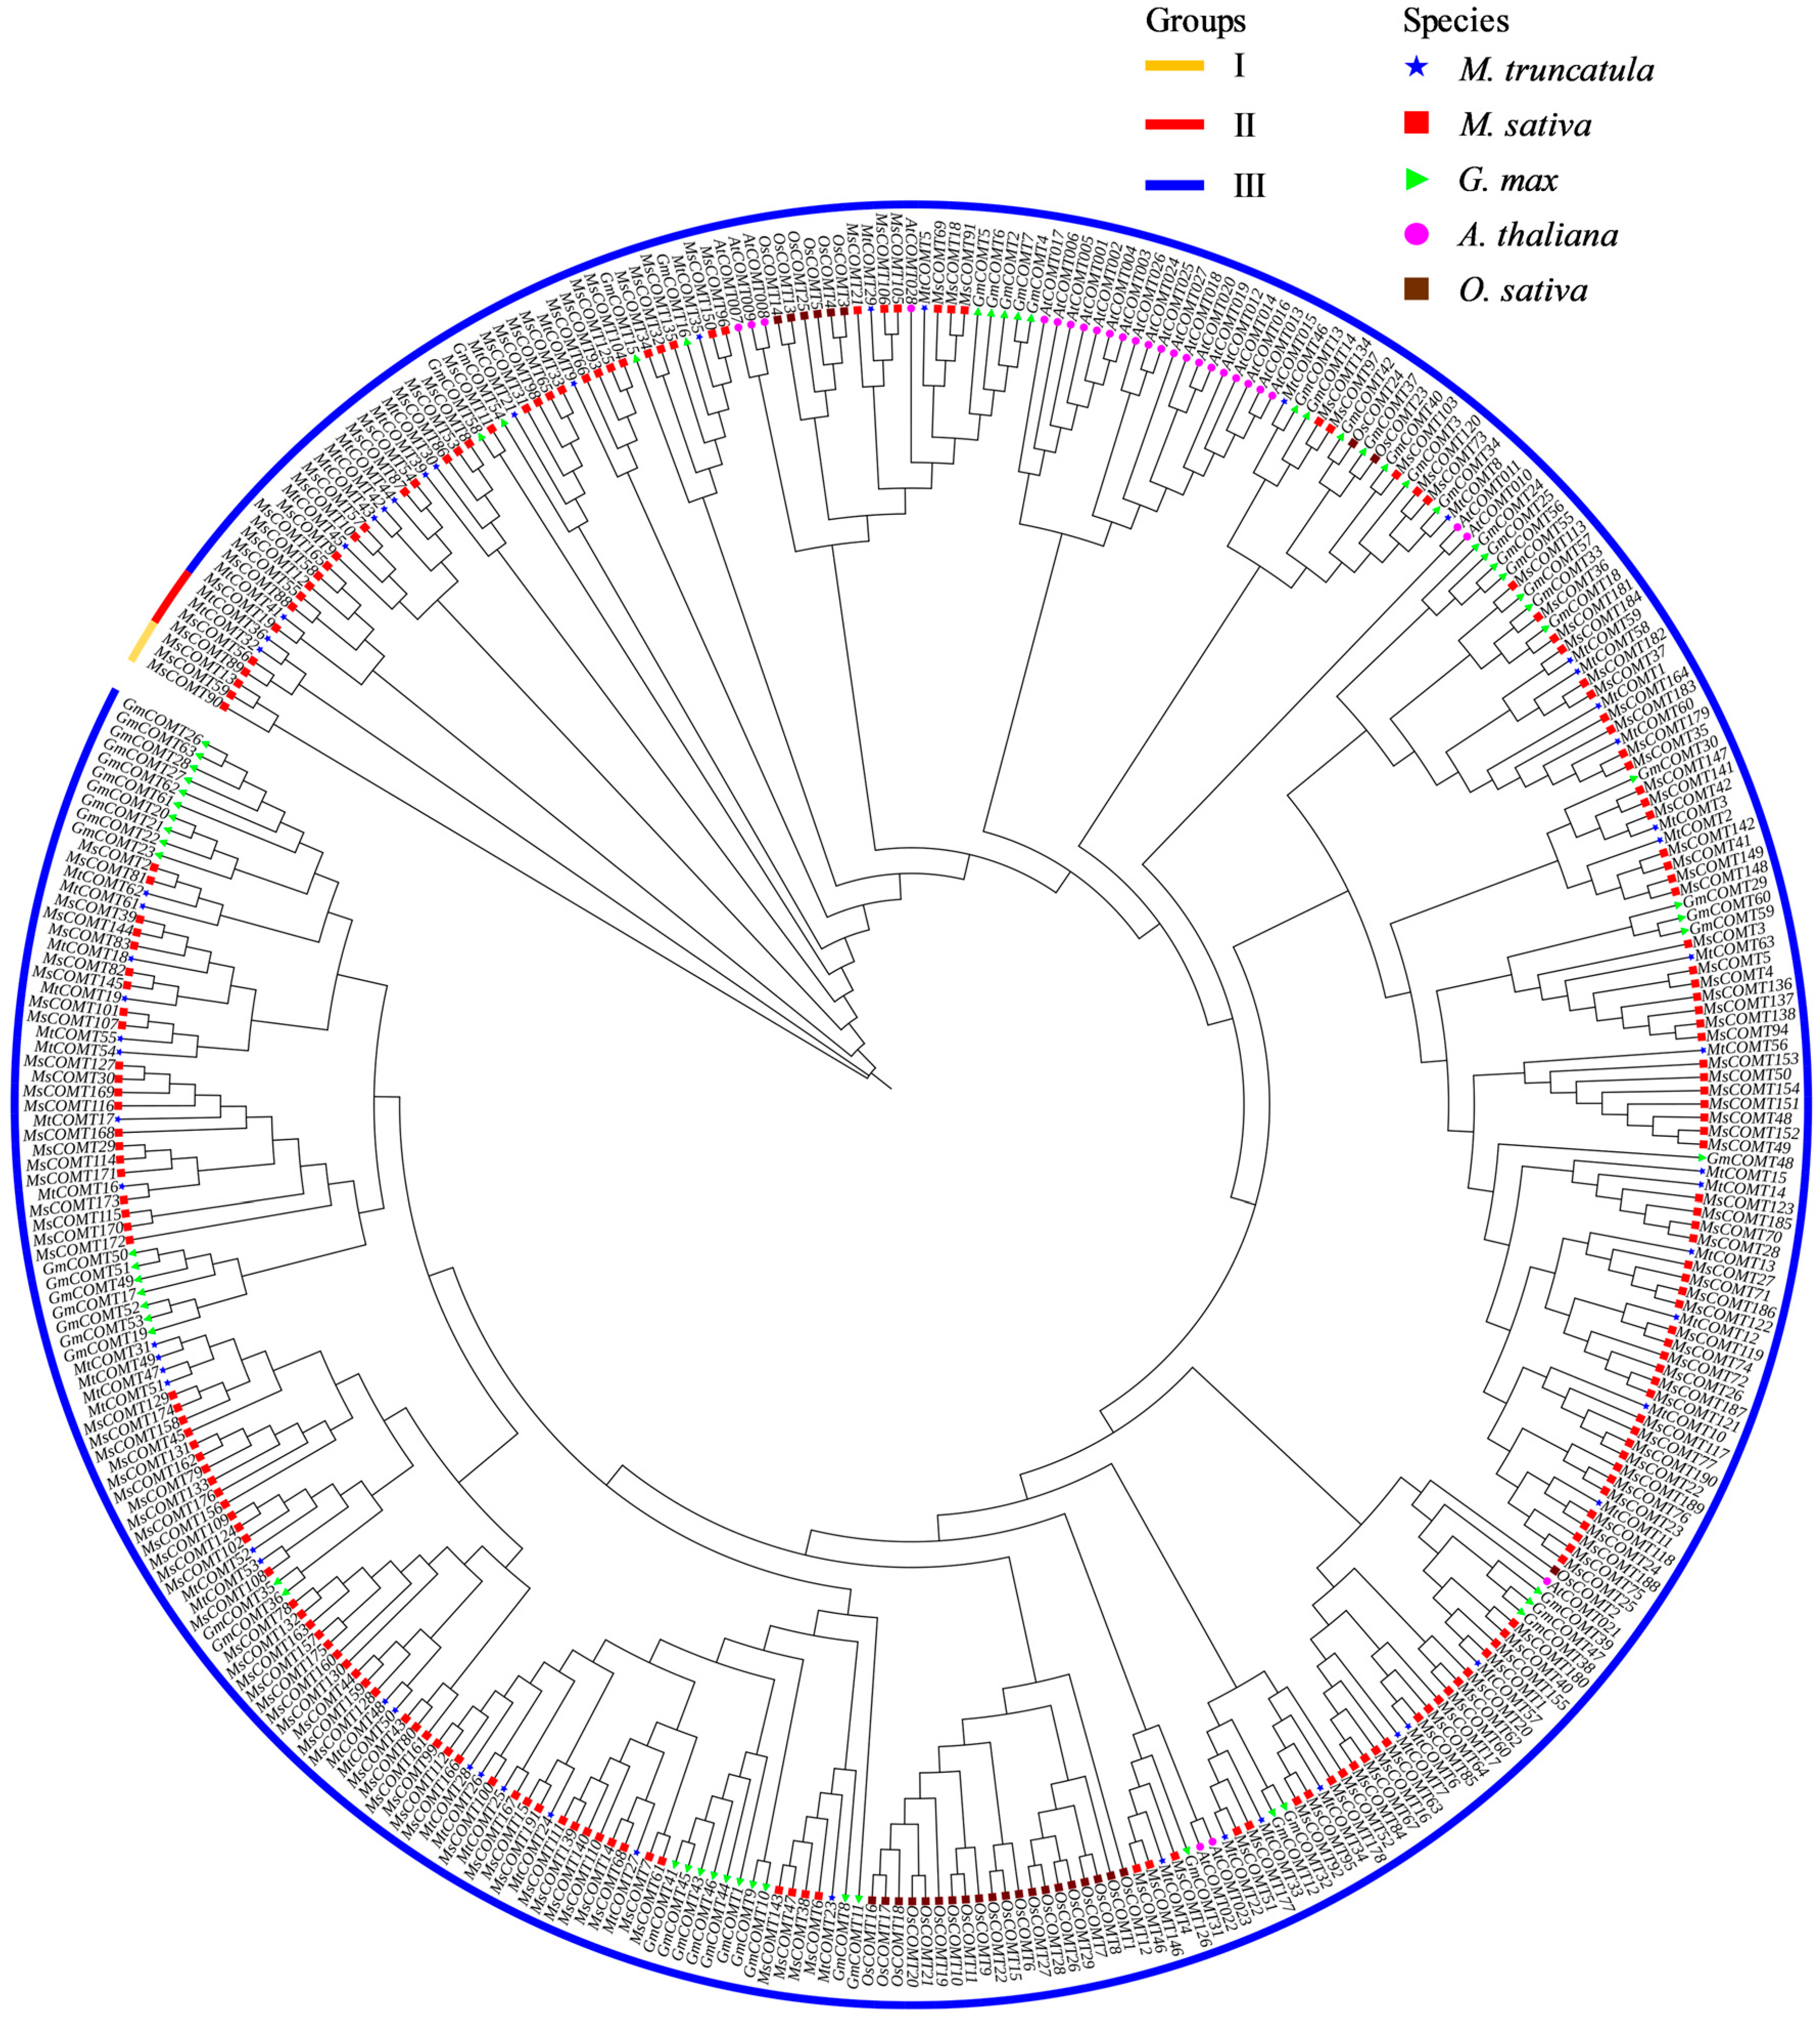
3.2. Phylogenetic Analysis of COMT Genes in M. truncatula

To elucidate the orthologous relationship of COMTs among M. truncatula, M. sativa, G. max, A. thaliana, and O. sativa, a phylogenetic tree was constructed using full-length protein sequences of 63 MtCOMTs, 191 MsCOMTs, 63 GmCOMTs, 28 AtCOMTs, and 29 OsCOMTs (Figure 1). Phylogenetic results revealed that the COMT proteins of these five species were categorized into three groups, namely I, II, and III. Group I had three MsCOMTs, group II contained two MtCOMTs and two MsCOMTs, and group III included 61 MtCOMTs, 186 MsCOMTs, 63 GmCOMTs, 28 AtCOMTs, and 29 OsCOMTs. M. sativa COMTs were present in all the three groups, M. truncatula COMTs were distributed in groups II and III, and those of G. max, A. thaliana, and O. sativa were only specific to group III.

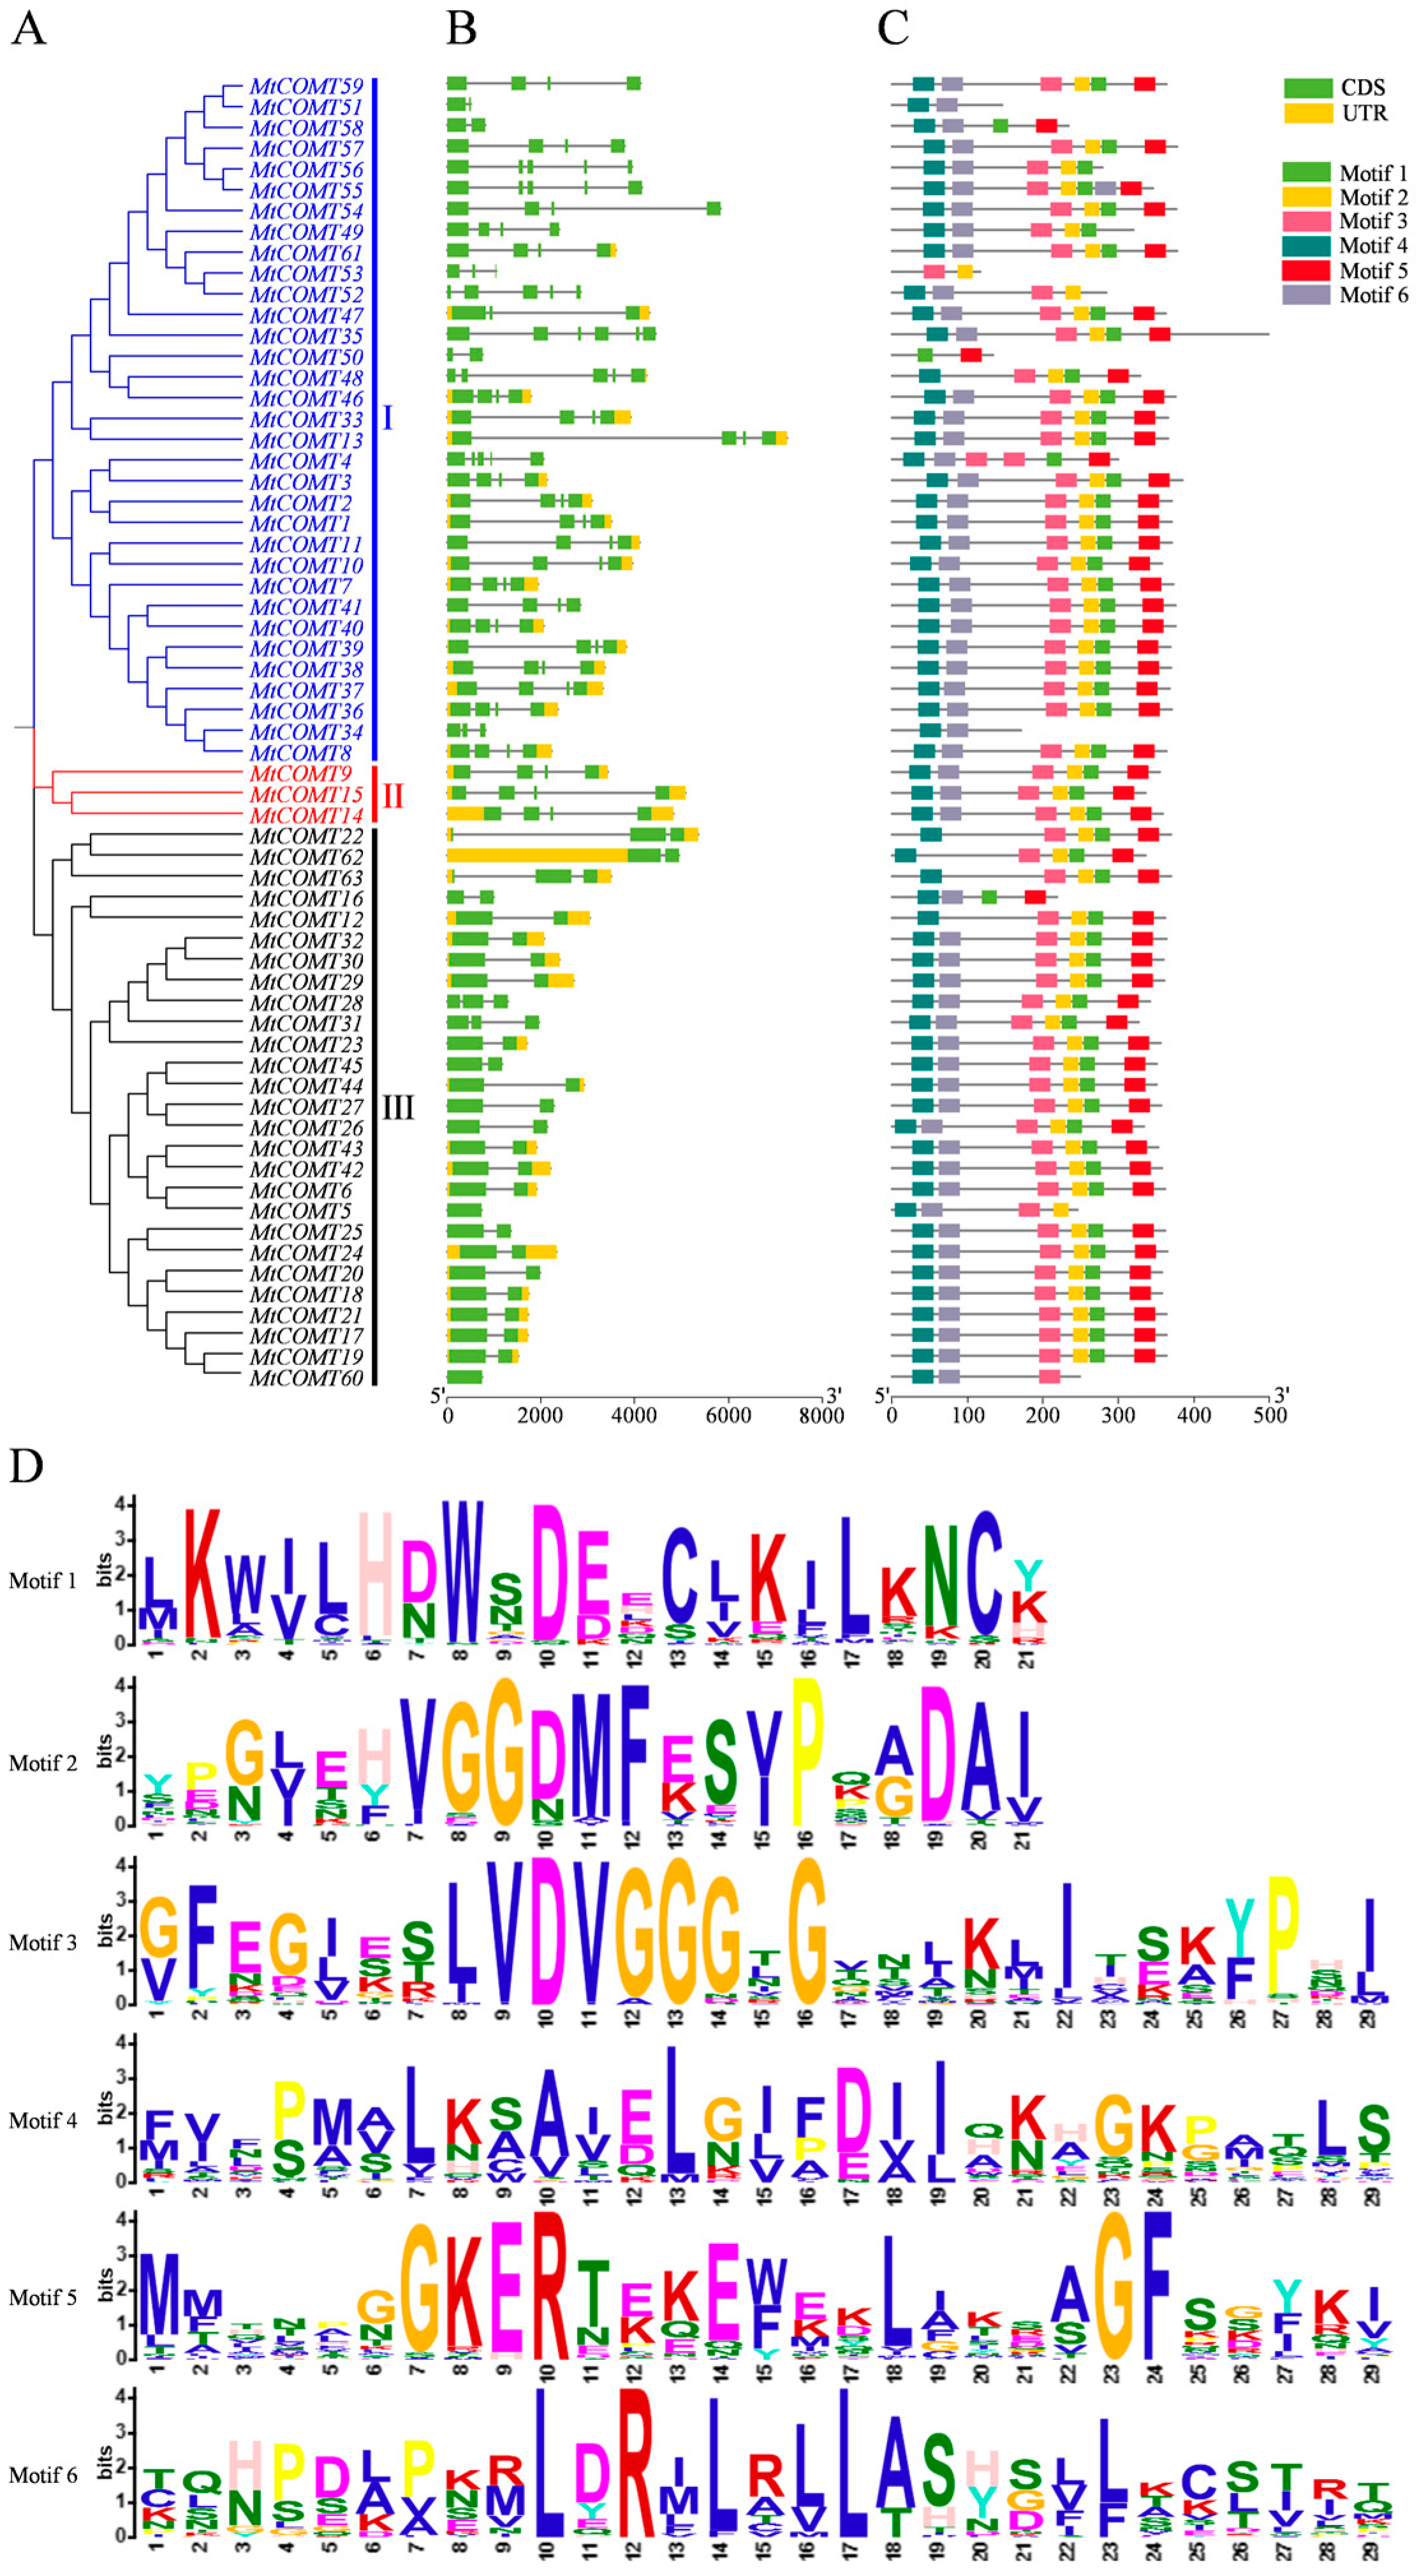
3.3. Gene Structure and Protein Conserved Motif Analysis of COMTs in M. truncatula

The phylogenetic analysis of COMT protein sequences in M. truncatula showed that 63 MtCOMTs could be classified into three groups (Figure 2A). In detail, 33 MtCOMTs were contained in group I, three MtCOMTs belonged to group II, and the remaining 27 MtCOMTs were attributed to group III, respectively. Moreover, the gene structure analysis of MtCOMTs was conducive to further investigating the evolutionary relationships. The obtained exon/intron structures revealed that there were significant variations in 63 MtCOMT gene structures (Figure 2B). Among the MtCOMTs, most members contained 2–5 exons and 1–4 introns. However, there was only one exon and no intron in MtCOMT5 and MtCOMT60, while there were six exons and five introns in MtCOMT35. Furthermore, 30 MtCOMT gene members did not have a complete UTR region. Overall, the MtCOMT13 gene was the longest, while the MtCOMT51 gene was the shortest.
Moreover, MtCOMTs’ conserved motifs were predicted to further analyze the motif architecture (Figure 2C,D). In total, there were six conserved motifs identified in MtCOMT proteins, each exhibiting different characteristics (motif 1-motif 6). Parameters of the MtCOMTs’ conserved motifs, including width, sites, and E-value, were shown in Table S3. In the phylogenetic tree, three groups of MtCOMT proteins exhibited different conserved patterns, although almost all MtCOMT members contained the motif 4, except for its absence in MtCOMT53 and MtCOMT50 in group I. Twenty-three of the thirty-three members in group I had six motifs. In group II, all three members contained six motifs. Twenty of the twenty-seven MtCOMTs had six motifs in group III, in which one (MtCOMT60), two (MtCOMT5 and MtCOMT16), and four (MtCOMT12, MtCOMT22, MtCOMT62, and MtCOMT63) members had three, four, and five motifs, respectively.
In brief, similarities in gene structures and conserved motifs in the same group suggest similar biological functions.

3.4. Chromosomal Localization and Collinearity Analysis of COMT Genes in M. truncatula

Locations of 63 MtCOMT (MtCOMT1-MtCOMT63) genes on eight chromosomes were displayed using TBtools software, according to their physical position information in the M. truncatula genome (Table S2). Fifty-nine MtCOMTs were located on chromosomes 1–8. However, four genes (MtCOMT60, MtCOMT61, MtCOMT62, and MtCOMT63) were located on scaffold0794, scaffold0591, scaffold0079, and scaffold0017, respectively. Moreover, there were obvious differences in the number of MtCOMT genes on each chromosome, with chromosomes 4, 7, and 8 having the maximum number of 12 genes, while chromosomes 2 and 6 only contained two genes. These findings revealed that MtCOMT genes were unevenly and irregularly distributed on the chromosomes. It was worth noting that several MtCOMTs located on the same chromosome were also grouped into the same categories in the phylogenetic tree. For instance, on the phylogenetic tree, 12 genes on chromosome 4 (MtCOMT16-MtCOMT27) and 5 genes on chromosome 5 (MtCOMT28-MtCOMT32) belonged to group III, while 11 genes on chromosome 8 (MtCOMT49-MtCOMT59) belonged to group I.
Analysis of gene duplication events of COMT within species showed that segmental duplication events occurred in M. truncatula chromosomes and two segmental duplication events containing three MtCOMTs (MtCOMT13/MtCOMT47 and MtCOMT47/MtCOMT48) were found on three chromosomes (Chr 3, Chr 7, and Chr 8) (Figure 3A). In addition, to investigate potential evolutionary relationships of COMT genes across different species, the collinearity was further compared between MtCOMT proteins and homologues from M. sativa, G. max, A. thaliana, and O. sativa (Figure 3B). There were, respectively, 37 (58.73%), 17 (26.98%), 1 (1.59%), and 1 (1.59%) MtCOMT proteins that showed high homology with those from the other four species (Table S4). Interestingly, MtCOMT13 was present in collinear gene pairs in M. sativa, G. max, and A. thaliana, indicating that MtCOMT13 was a homologous gene and relatively conserved during COMT gene family evolution across different species. In summary, the COMT gene family in M. truncatula had a stronger collinearity with leguminous plants (M. sativa and G. max), while it had a small amount of collinearity relationships with cruciferous (A. thaliana) and gramineous (O. sativa) plants.

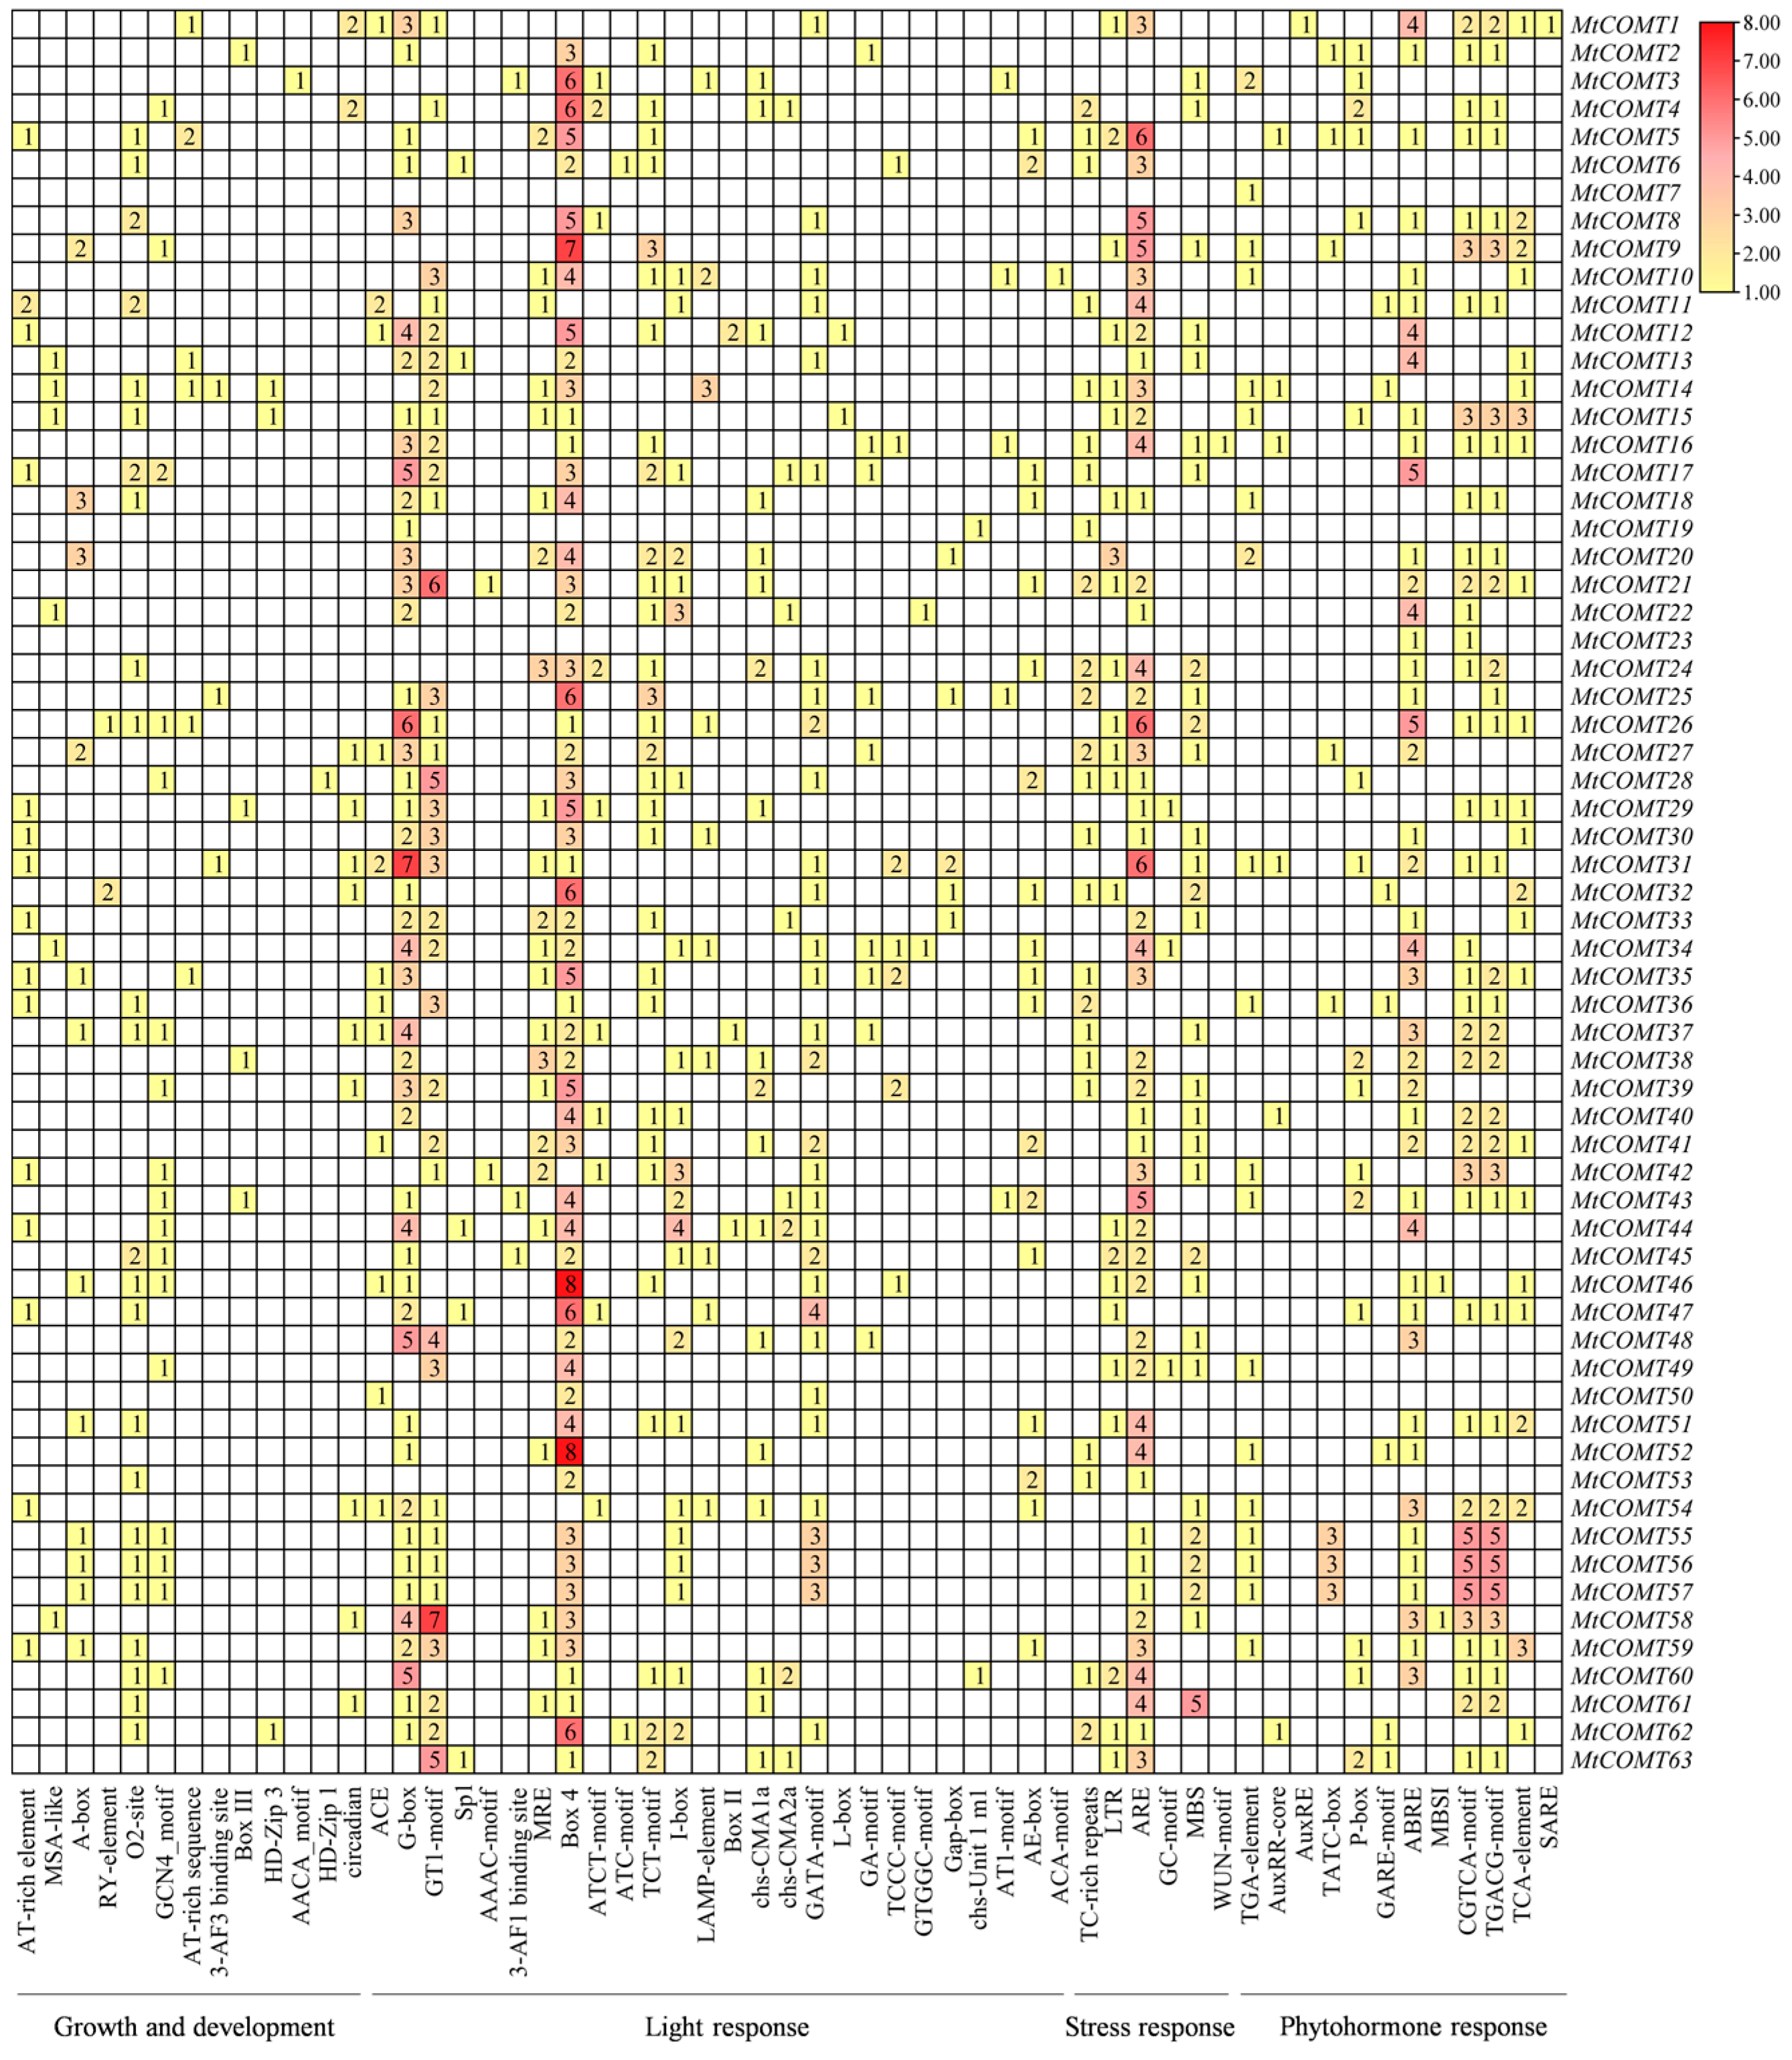
3.5. Cis-Acting Element Analysis in MtCOMT Promoters in M. truncatula

A nucleic acid sequence 2000 bp upstream of MtCOMT translation initiation codon was extracted from M. truncatula genome and analyzed using PlantCARE website to explore the potential regulatory function of the cis-acting element in the COMT gene family. In total, 1360 predicted cis-acting elements were identified in MtCOMT promoter regions (Figure 4). These cis-acting elements responded to various basic life activity events and abiotic stresses, and thus might regulate downstream gene expression. Based on regulatory function and involvement in biological processes, all these identified cis-acting elements from MtCOMT genes were divided into four categories, namely, growth and development, light response, stress response, and hormone response, with each containing different amounts of various cis-acting elements.
Box 4 was the most predicted cis-element, with 192 ones being found in almost all the MtCOMT genes. Compared to the other three categories, light response was found to be represented by 26 cis-acting elements (accounting for 45.6%) at a very high frequency in the COMT gene family in M. truncatula, suggesting that the gene expression and function of MtCOMTs were likely to be controlled by light. A total of 13 cis-acting elements associated with growth and development were predicted in almost all the MtCOMT genes, accounting for 22.8% of all cis-acting elements. Additionally, cis-acting elements of ABRE (87), CGTCA-motif (66), TGACG-motif (66), TCA-element (32), TGA-element (21), P-box (20), TATC-box (14), GARE-motif (7), AuxRR-core (6), MBSI (2), AuxRE (1), and SARE (1) were related to hormone response, such as auxin (28), gibberellin (GA) (41), abscisic acid (ABA) (87), flavonoid (2), methyl jasmonate (MeJA) (132), and salicylic acid (SA) (33). Moreover, six stress-response-related cis-acting elements were identified in MtCOMT genes, including defense and stress response (31), low-temperature response (28), anaerobic induction (131), anoxic specific inducibility (3), drought stress (41), and wound induction (1). These comprehensive findings suggested that multiple cis-acting elements might regulate MtCOMT gene expression during plant growth and development, as well as under stressors or external stimuli.

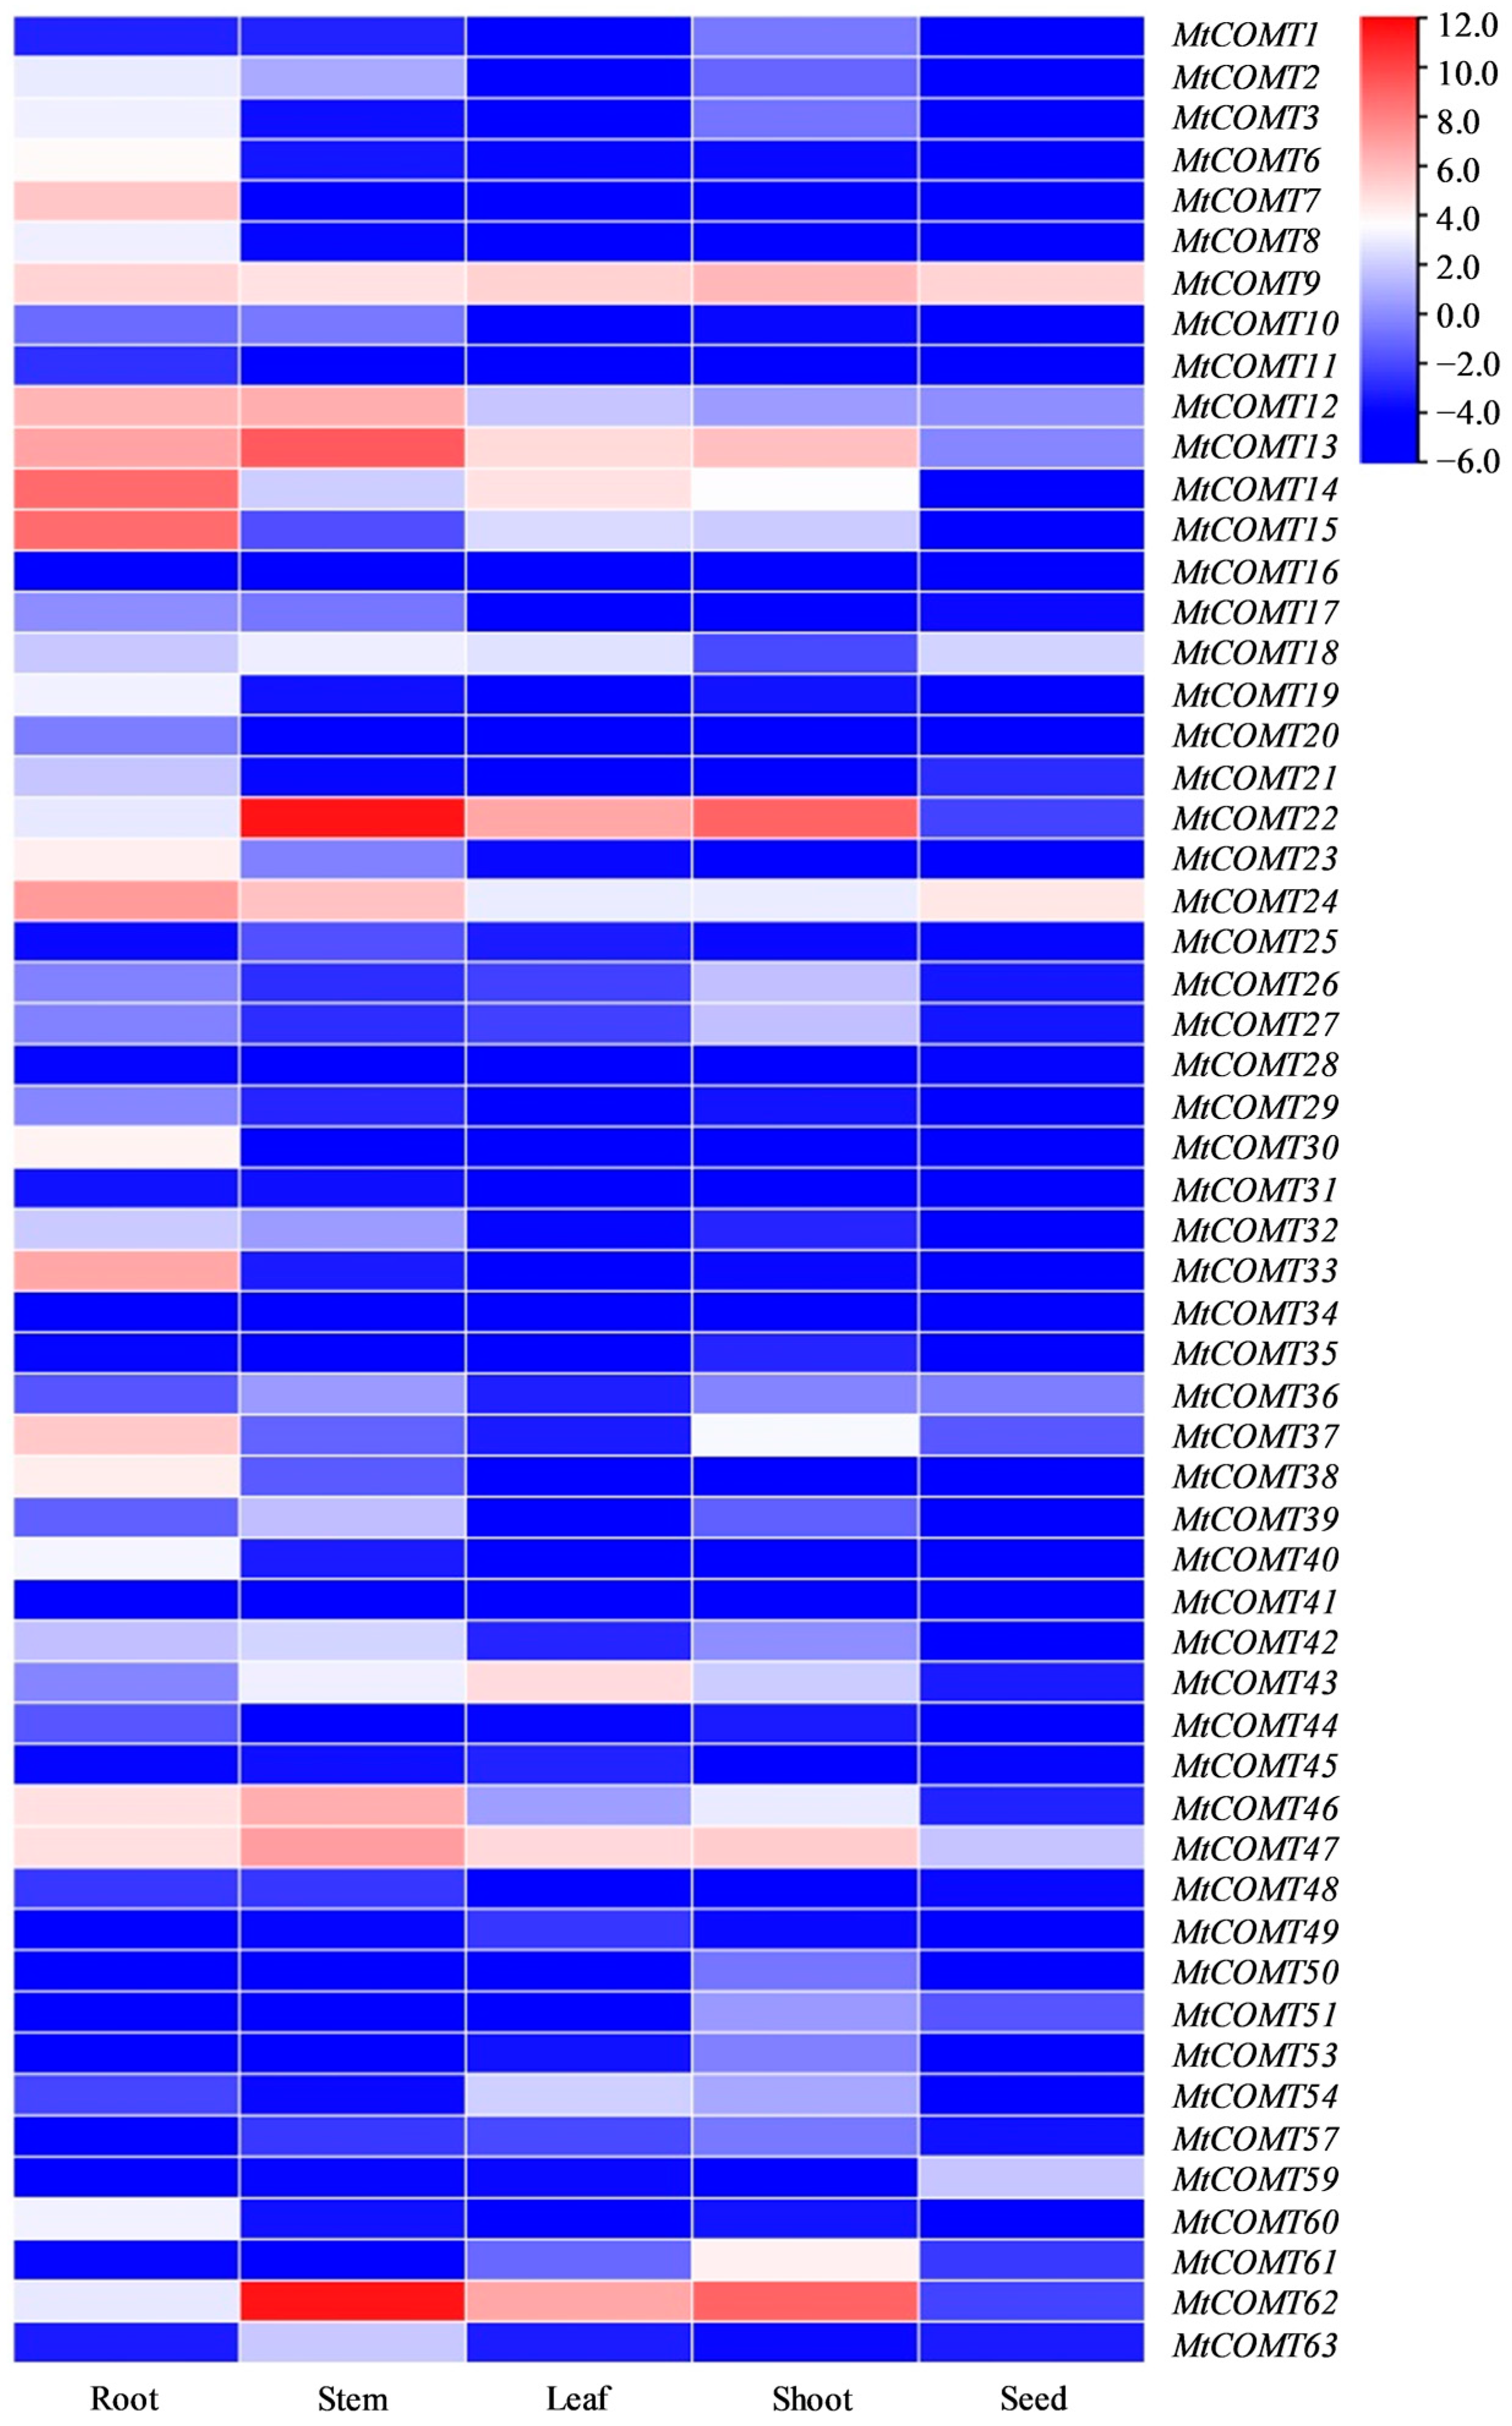
3.6. Tissue-Specific Expression Pattern Analysis of MtCOMT Genes

The analysis of expression patterns of MtCOMT genes retrieved from the Gene Expression Atlas dataset (MtExpress V3) revealed that 28, 17, 13, 18, and 6 MtCOMT genes were strongly expressed in root, stem, leaf, shoot, and mature seed, respectively, indicating that MtCOMTs were mainly expressed in the root (Figure 5). MtCOMT9 and MtCOMT24 were highly expressed in all tissues; MtCOMT13, MtCOMT14, MtCOMT22, MtCOMT46, and MtCOMT62 were highly enriched in tissues other than mature seed. In addition, MtCOMT3, MtCOMT6, MtCOMT7, MtCOMT8, MtCOMT19, MtCOMT23, MtCOMT30, MtCOMT33, MtCOMT38, MtCOMT40, and MtCOMT60 were highly expressed in the root. These results suggested that gene expression levels differed amongst tissues, namely, tissue expression specificity, thus affecting the specific physiological functions.

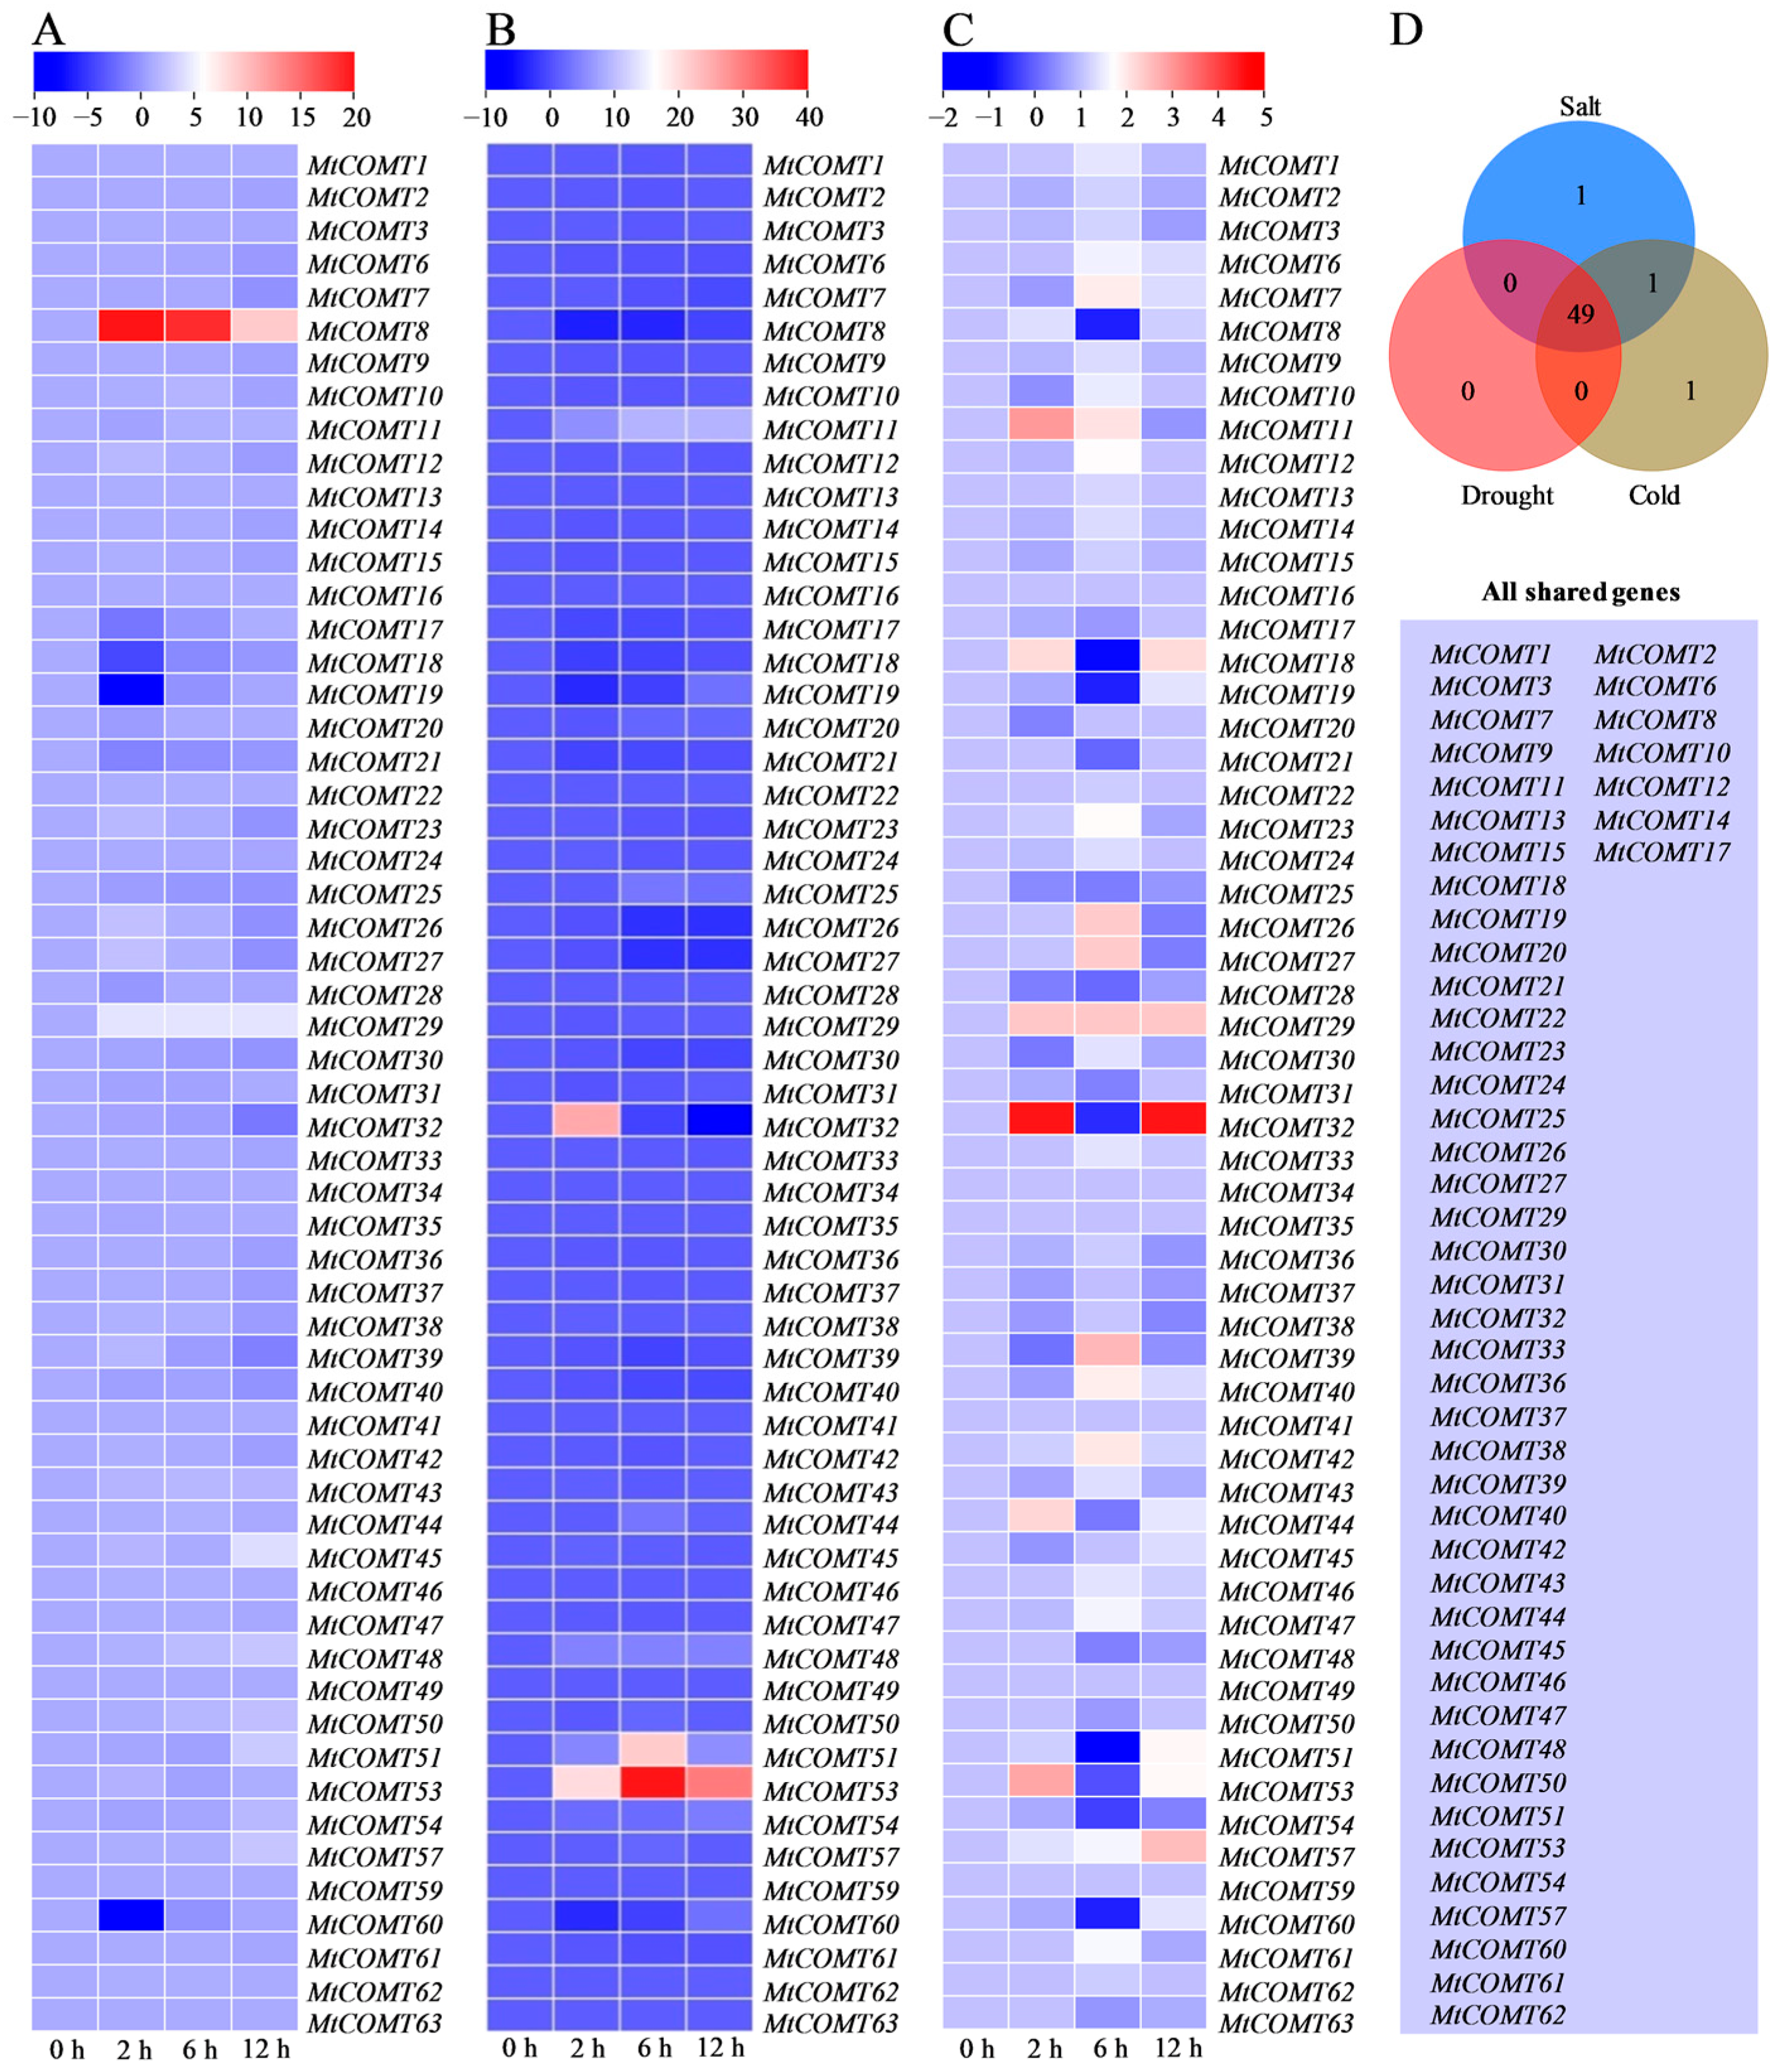
3.7. MtCOMT Expression Patterns under Abiotic Stresses

Expression patterns analysis of MtCOMTs showed that 51, 49, and 51 genes responded to salt, drought, and cold stress, respectively (Figure 6). Compared with control, the expression of 29 MtCOMTs increased after 2 h of salt stress. For example, MtCOMT8 expression increased considerably at 2 h, while they continuously decreased after the subsequent 6 and 12 h of salt stress (Figure 6A). Most MtCOMTs showed reduced expression in response to drought stress, and only 15 MtCOMTs were increased after 2 h of drought stress. MtCOMT11 expression was continuously increased after drought stress, but the expression of MtCOMT51 and MtCOMT53 first increased and then decreased, with the highest level observed at 6 h of drought (Figure 6B). Thirty-one MtCOMTs were up-regulated after 6 h of cold stress. MtCOMT57 expression was continuously increased under cold stress, while MtCOMT11, MtCOMT26, MtCOMT27, MtCOMT39, MtCOMT42, and MtCOMT44 first increased, reached to a higher level, and then decreased (Figure 6C). However, interestingly, 49 MtCOMT genes simultaneously responded to salt, drought, and cold stress (Figure 6D).

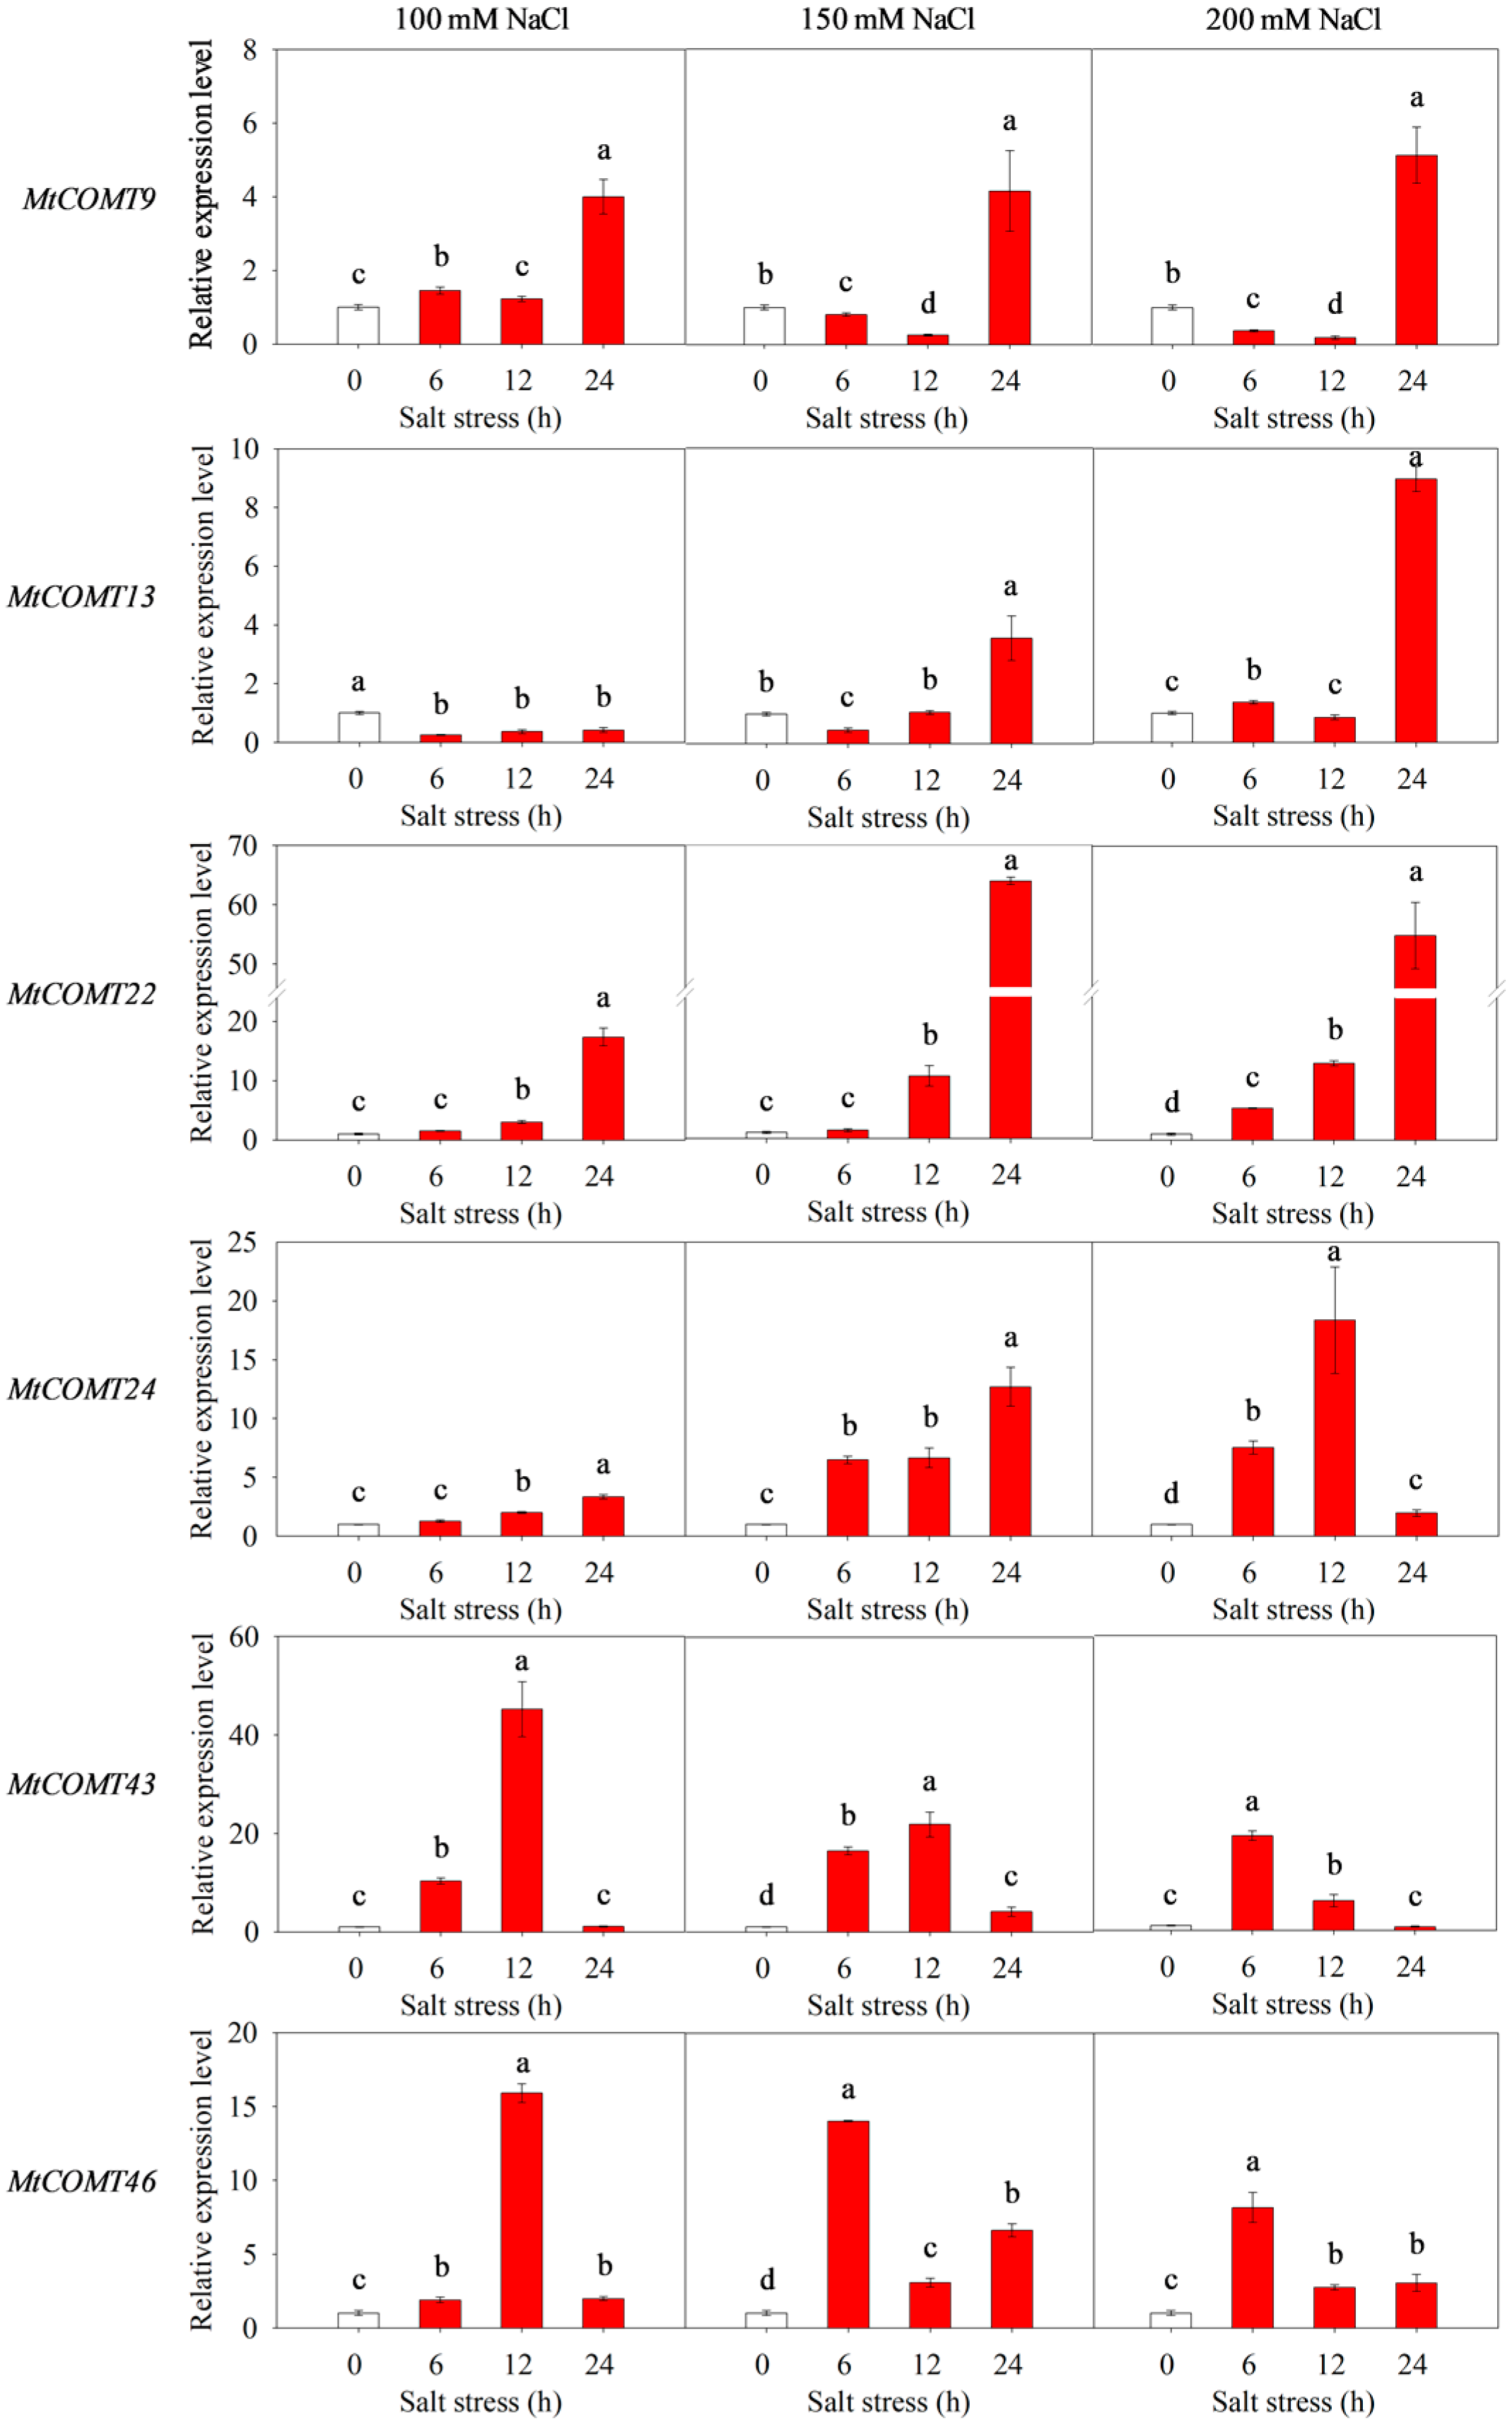
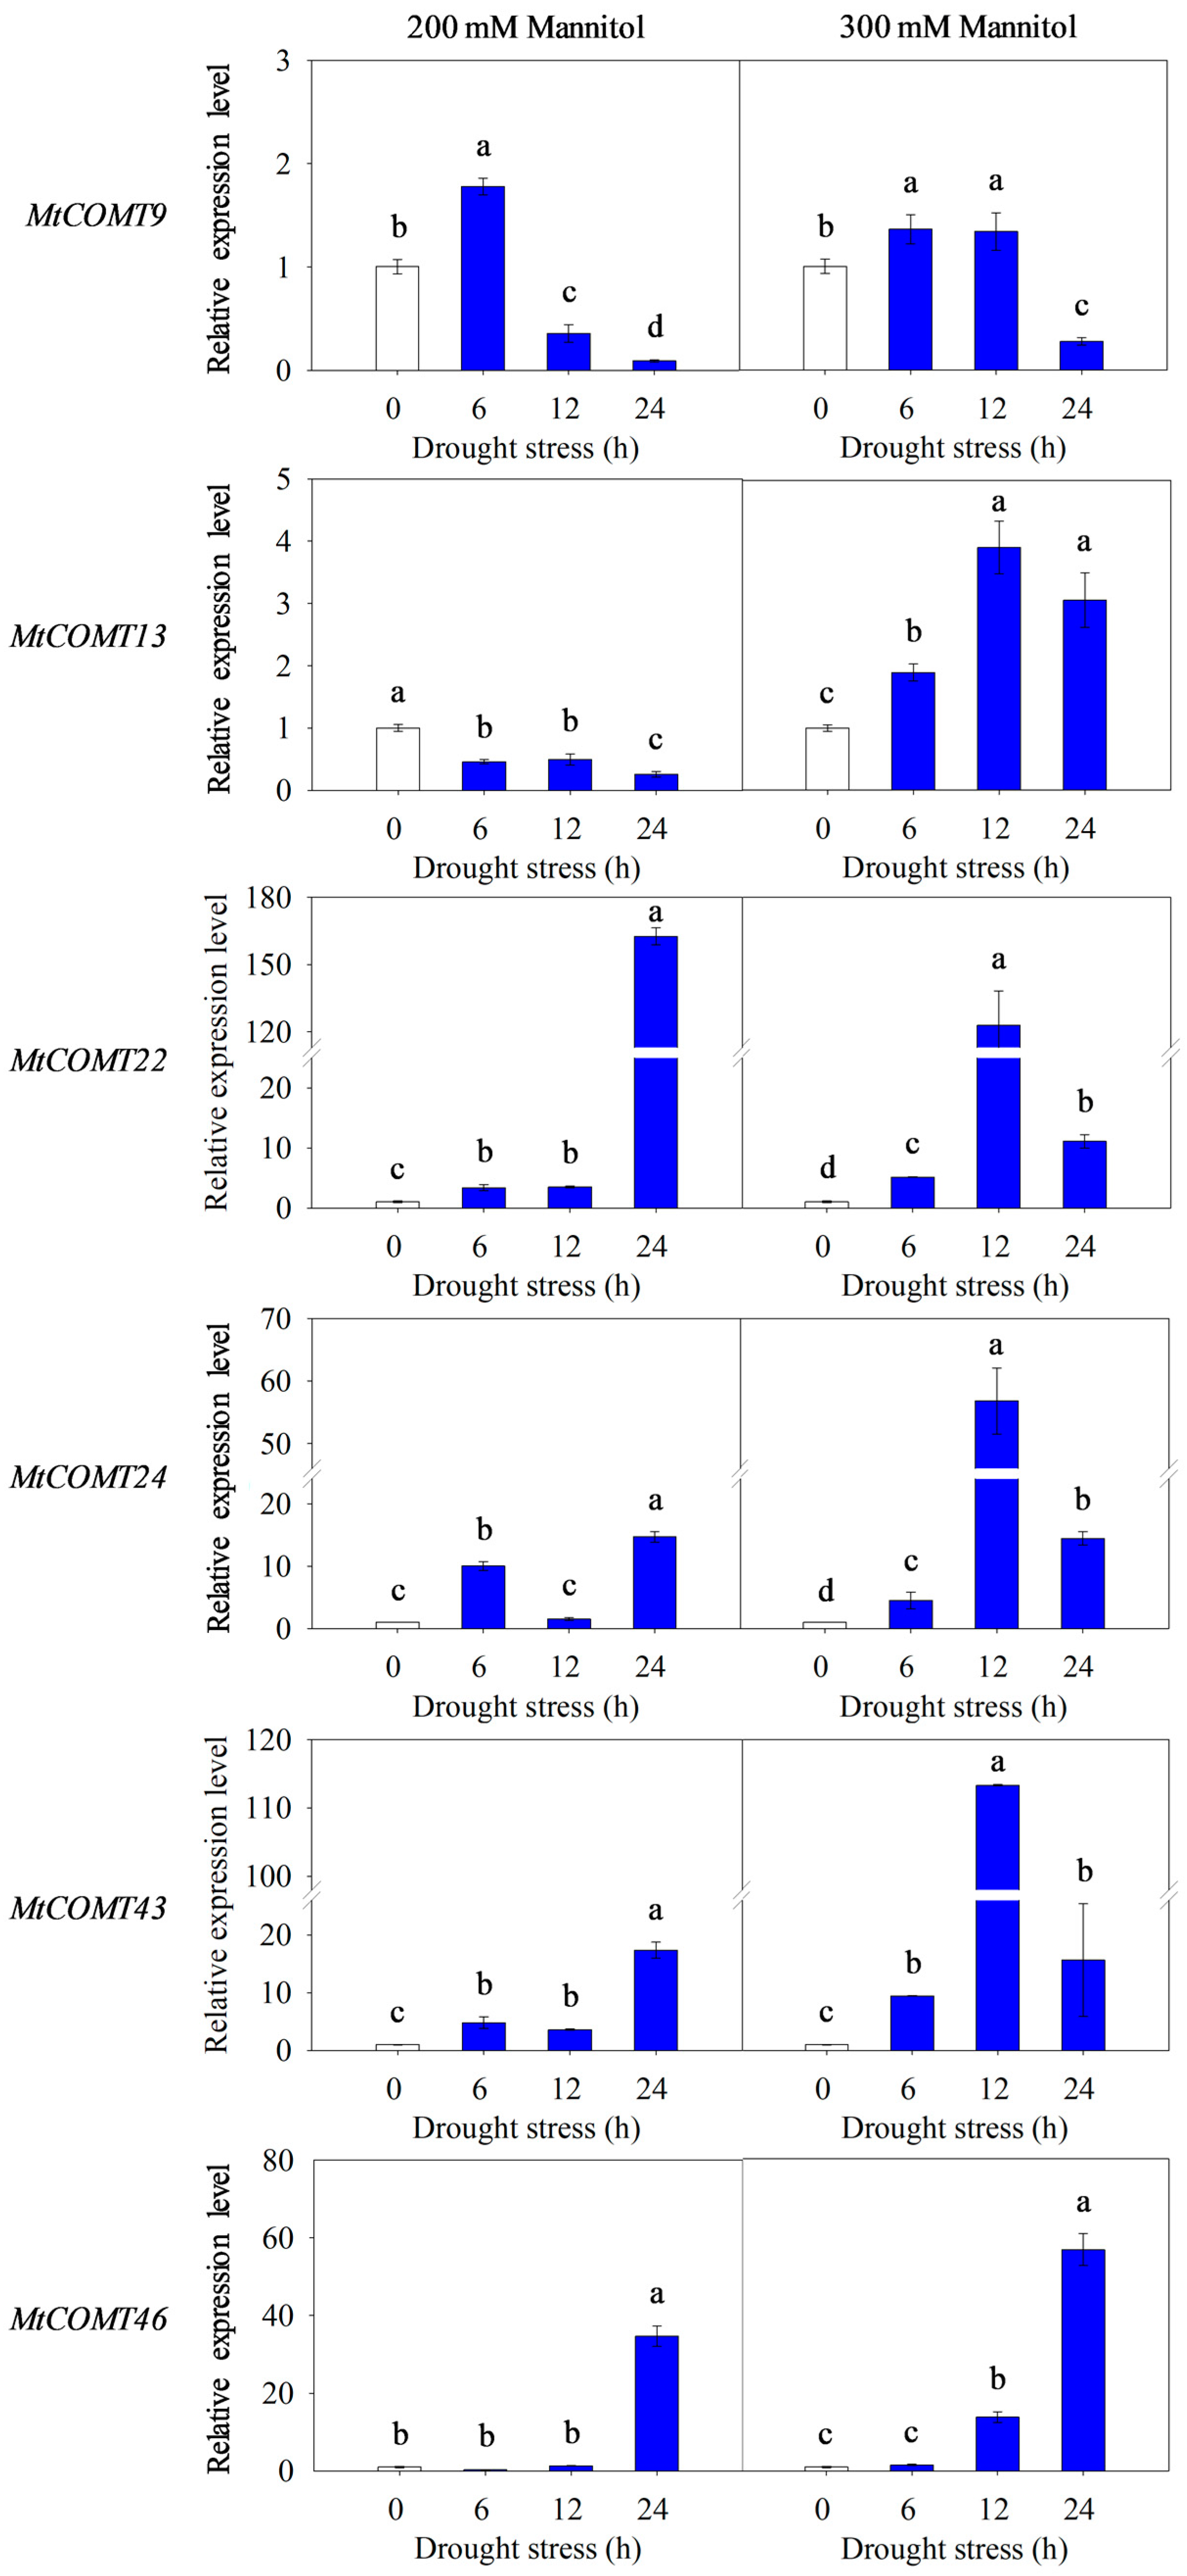
3.8. Validation of MtCOMT Expression by RT-qPCR

To further determine the expression profiles of MtCOMTs, transcript levels of six shared genes under salt and drought stress (MtCOMT9, MtCOMT13, MtCOMT22, MtCOMT24, MtCOMT43, and MtCOMT46) were analyzed by RT-qPCR. The results revealed that, except for downregulated MtCOMT13 under 100 mM NaCl stress, the expression abundance of MtCOMT9, MtCOMT13, and MtCOMT22 enhanced with the increase in salt concentration and reached their peak after 24 h of salt treatment. However, the expression abundance of MtCOMT43 and MtCOMT46 decreased as salt concentration increased and reached its maximum value after 12 h of 100 mM NaCl and 6 h of 200 mM NaCl, respectively (Figure 7). In addition, under drought stress, 300 mM mannitol strongly induced the expression levels of MtCOMT13, MtCOMT24, MtCOMT43, and MtCOMT46, compared with 200 mM mannitol (Figure 8). Meanwhile, most gene expressions reached their maximum values after 12 h treatment under this condition.

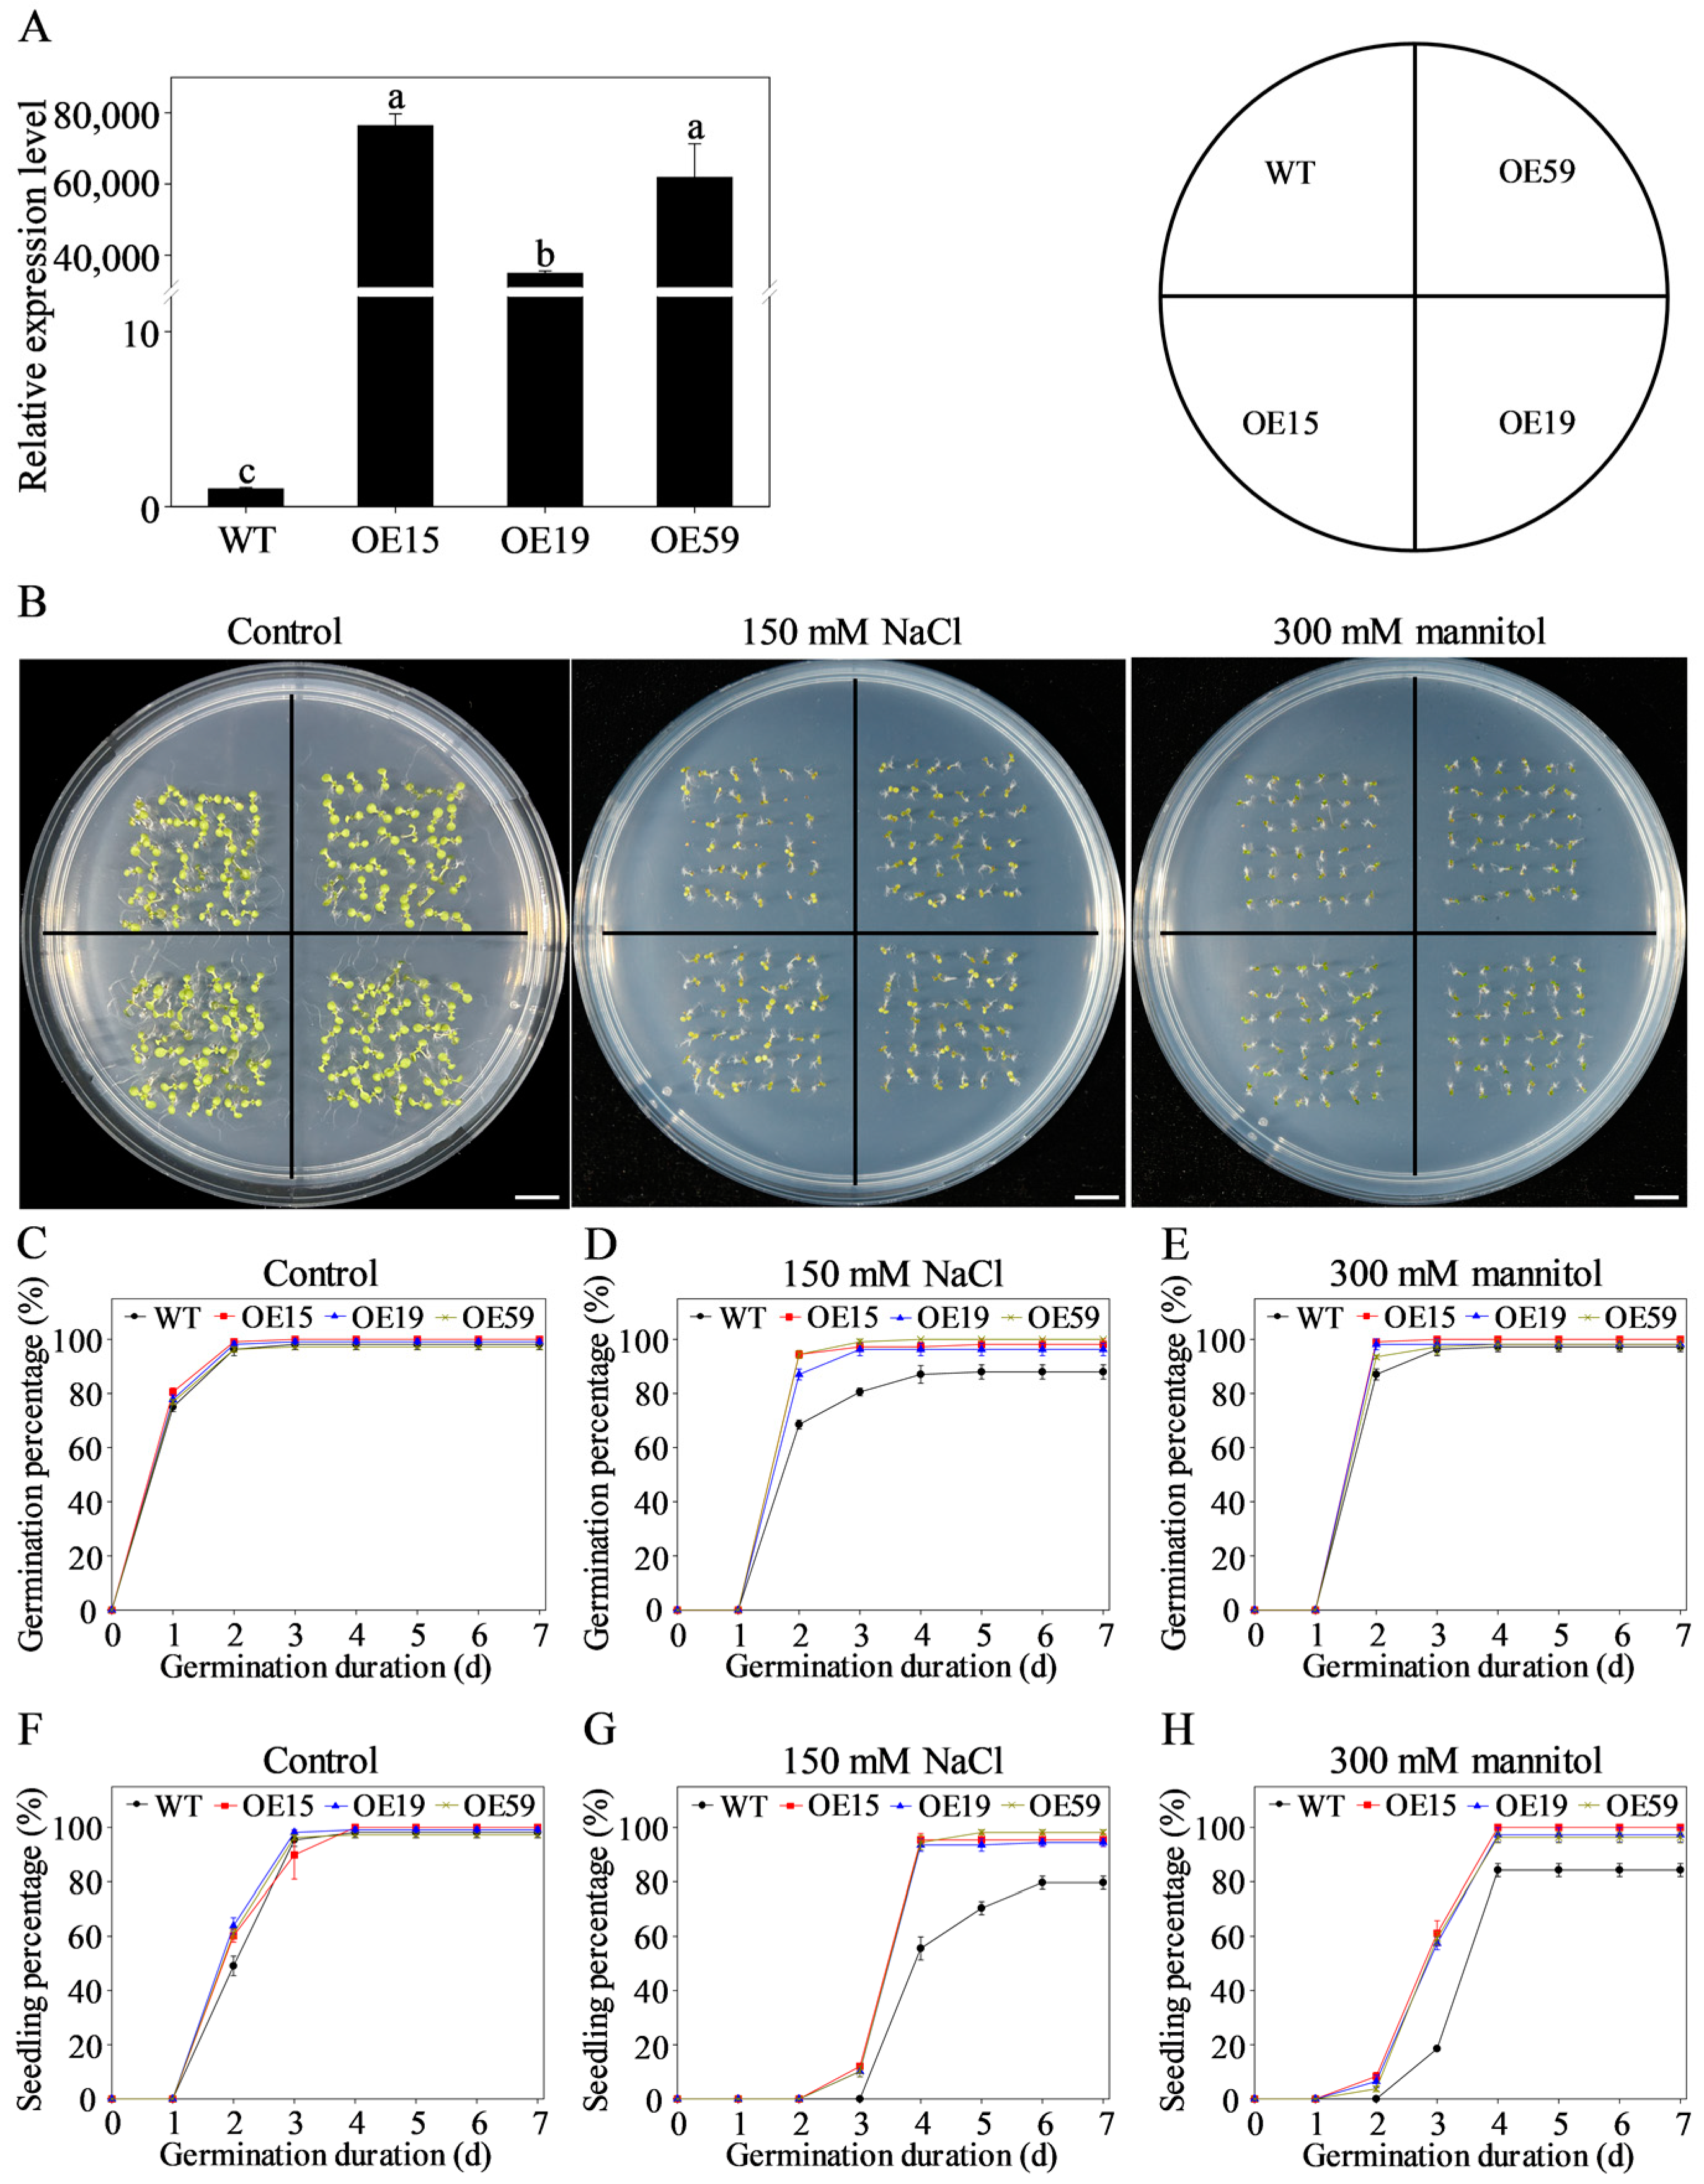
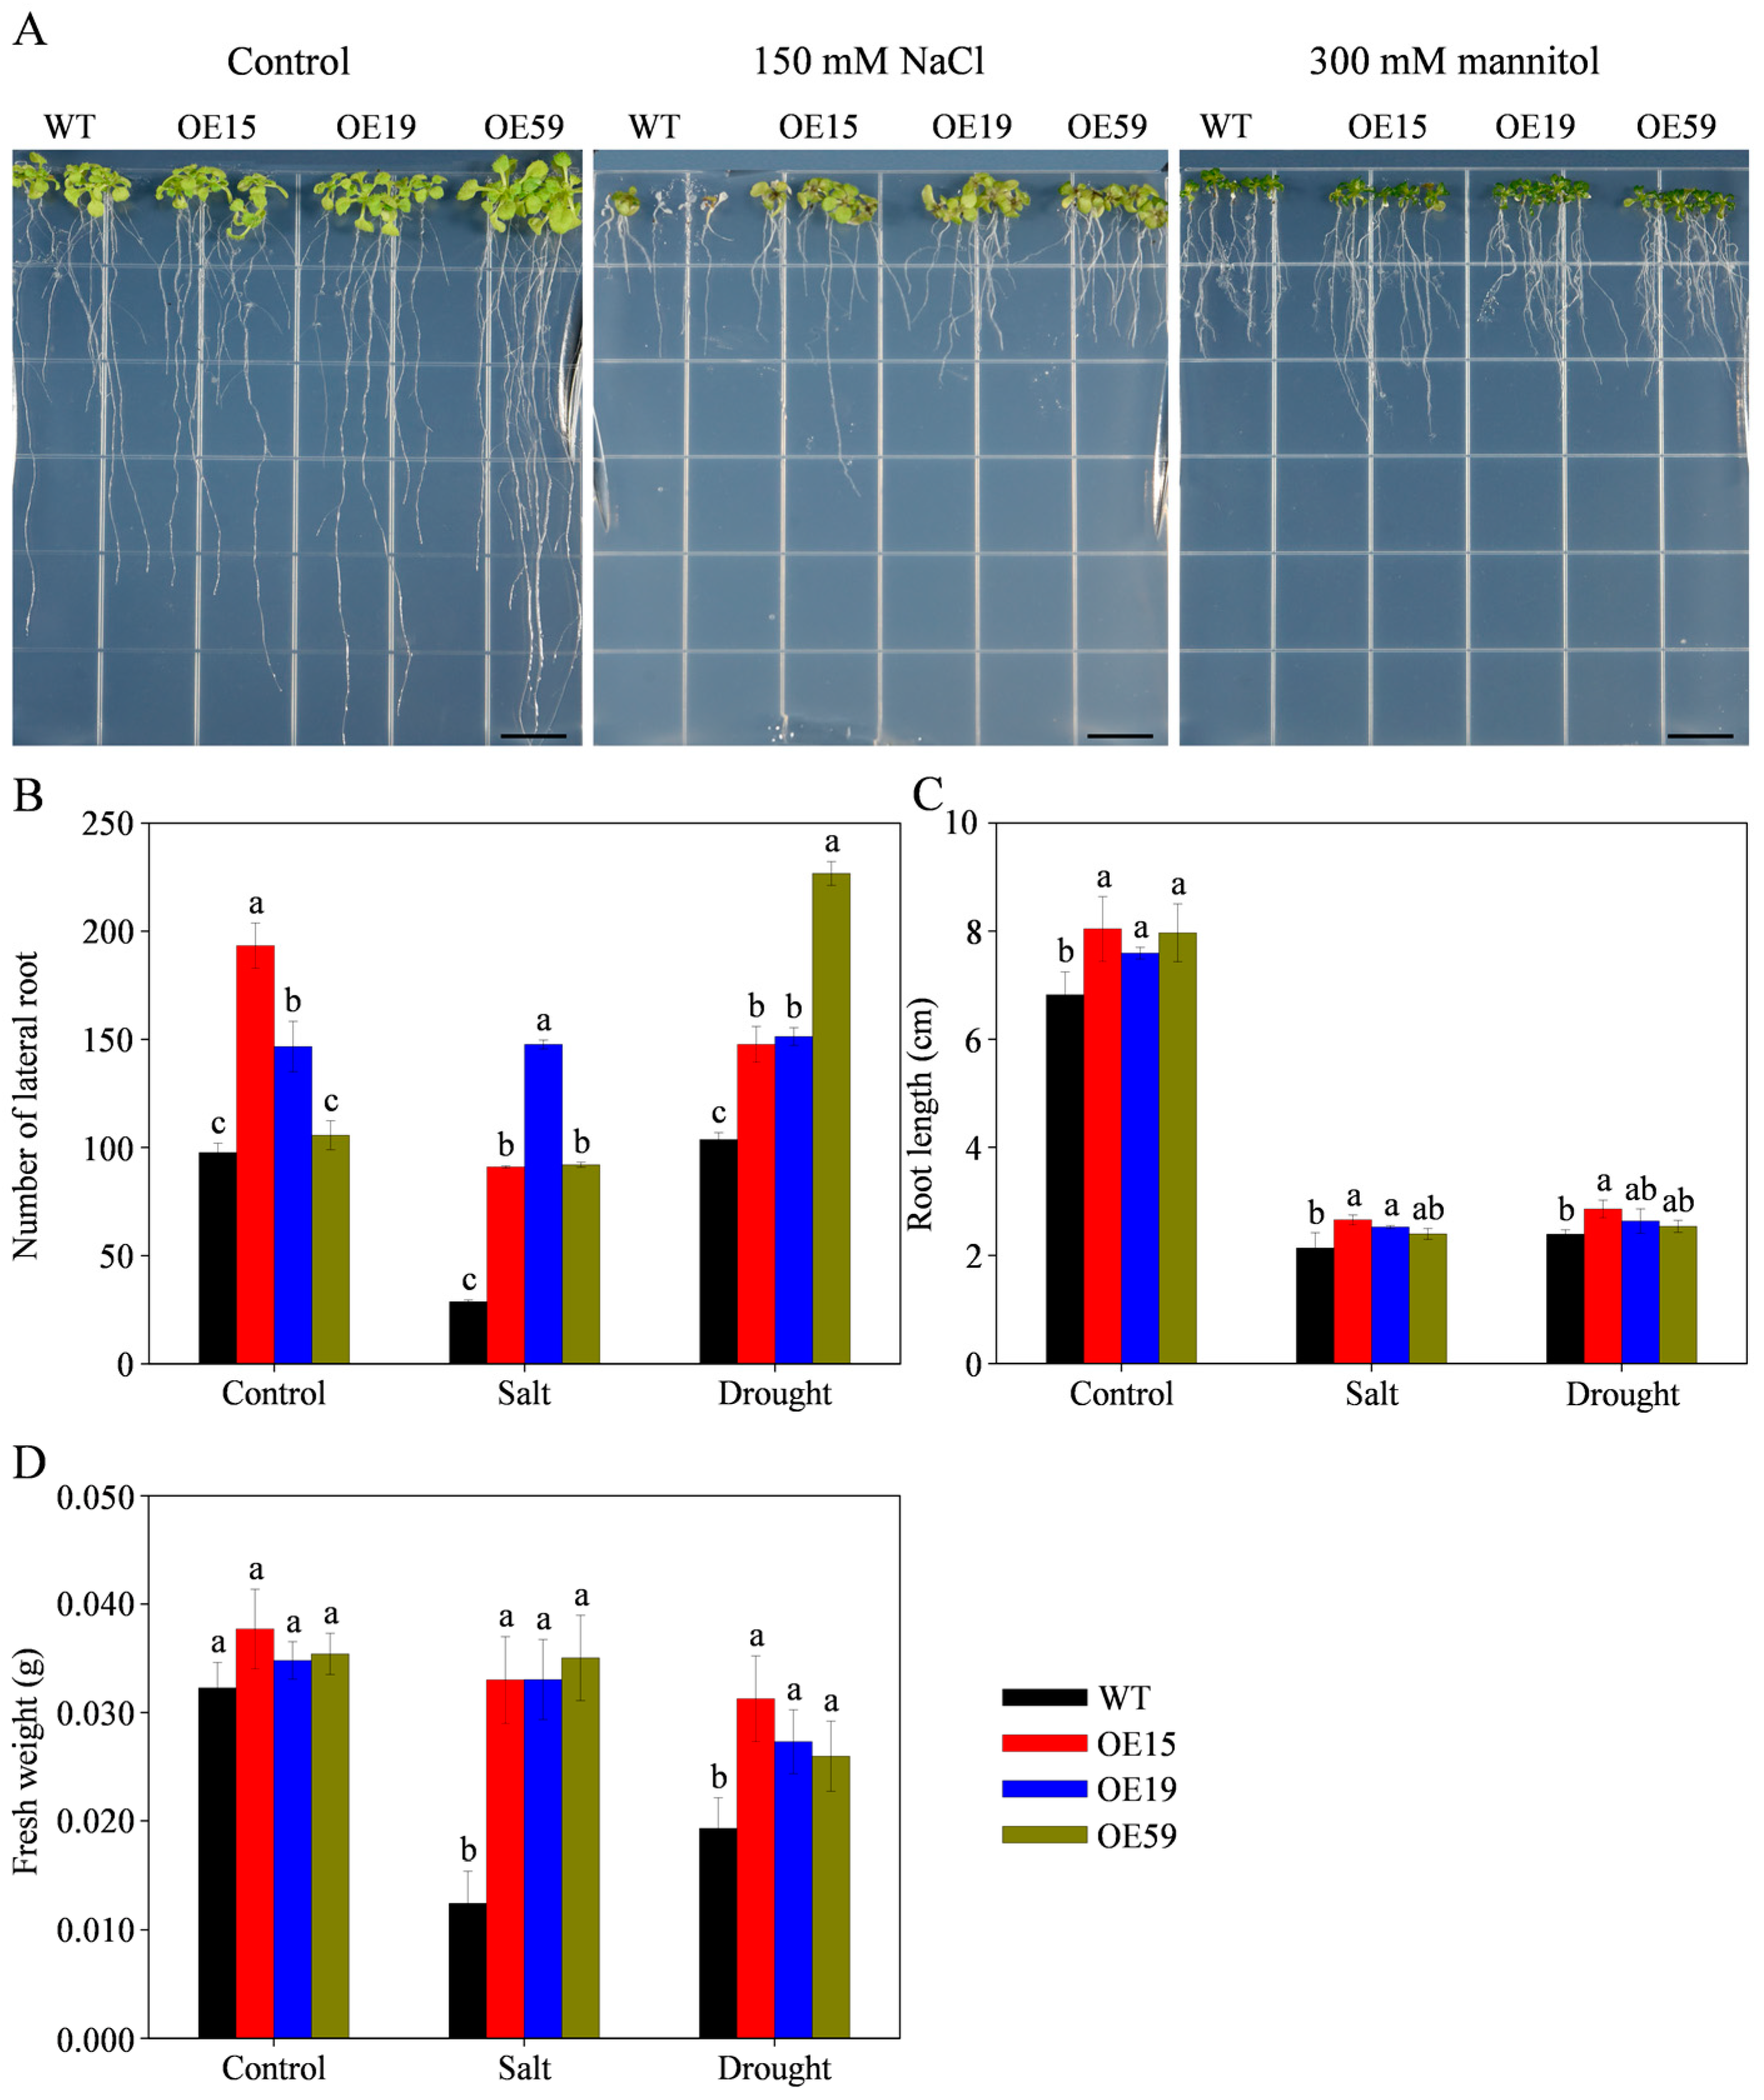
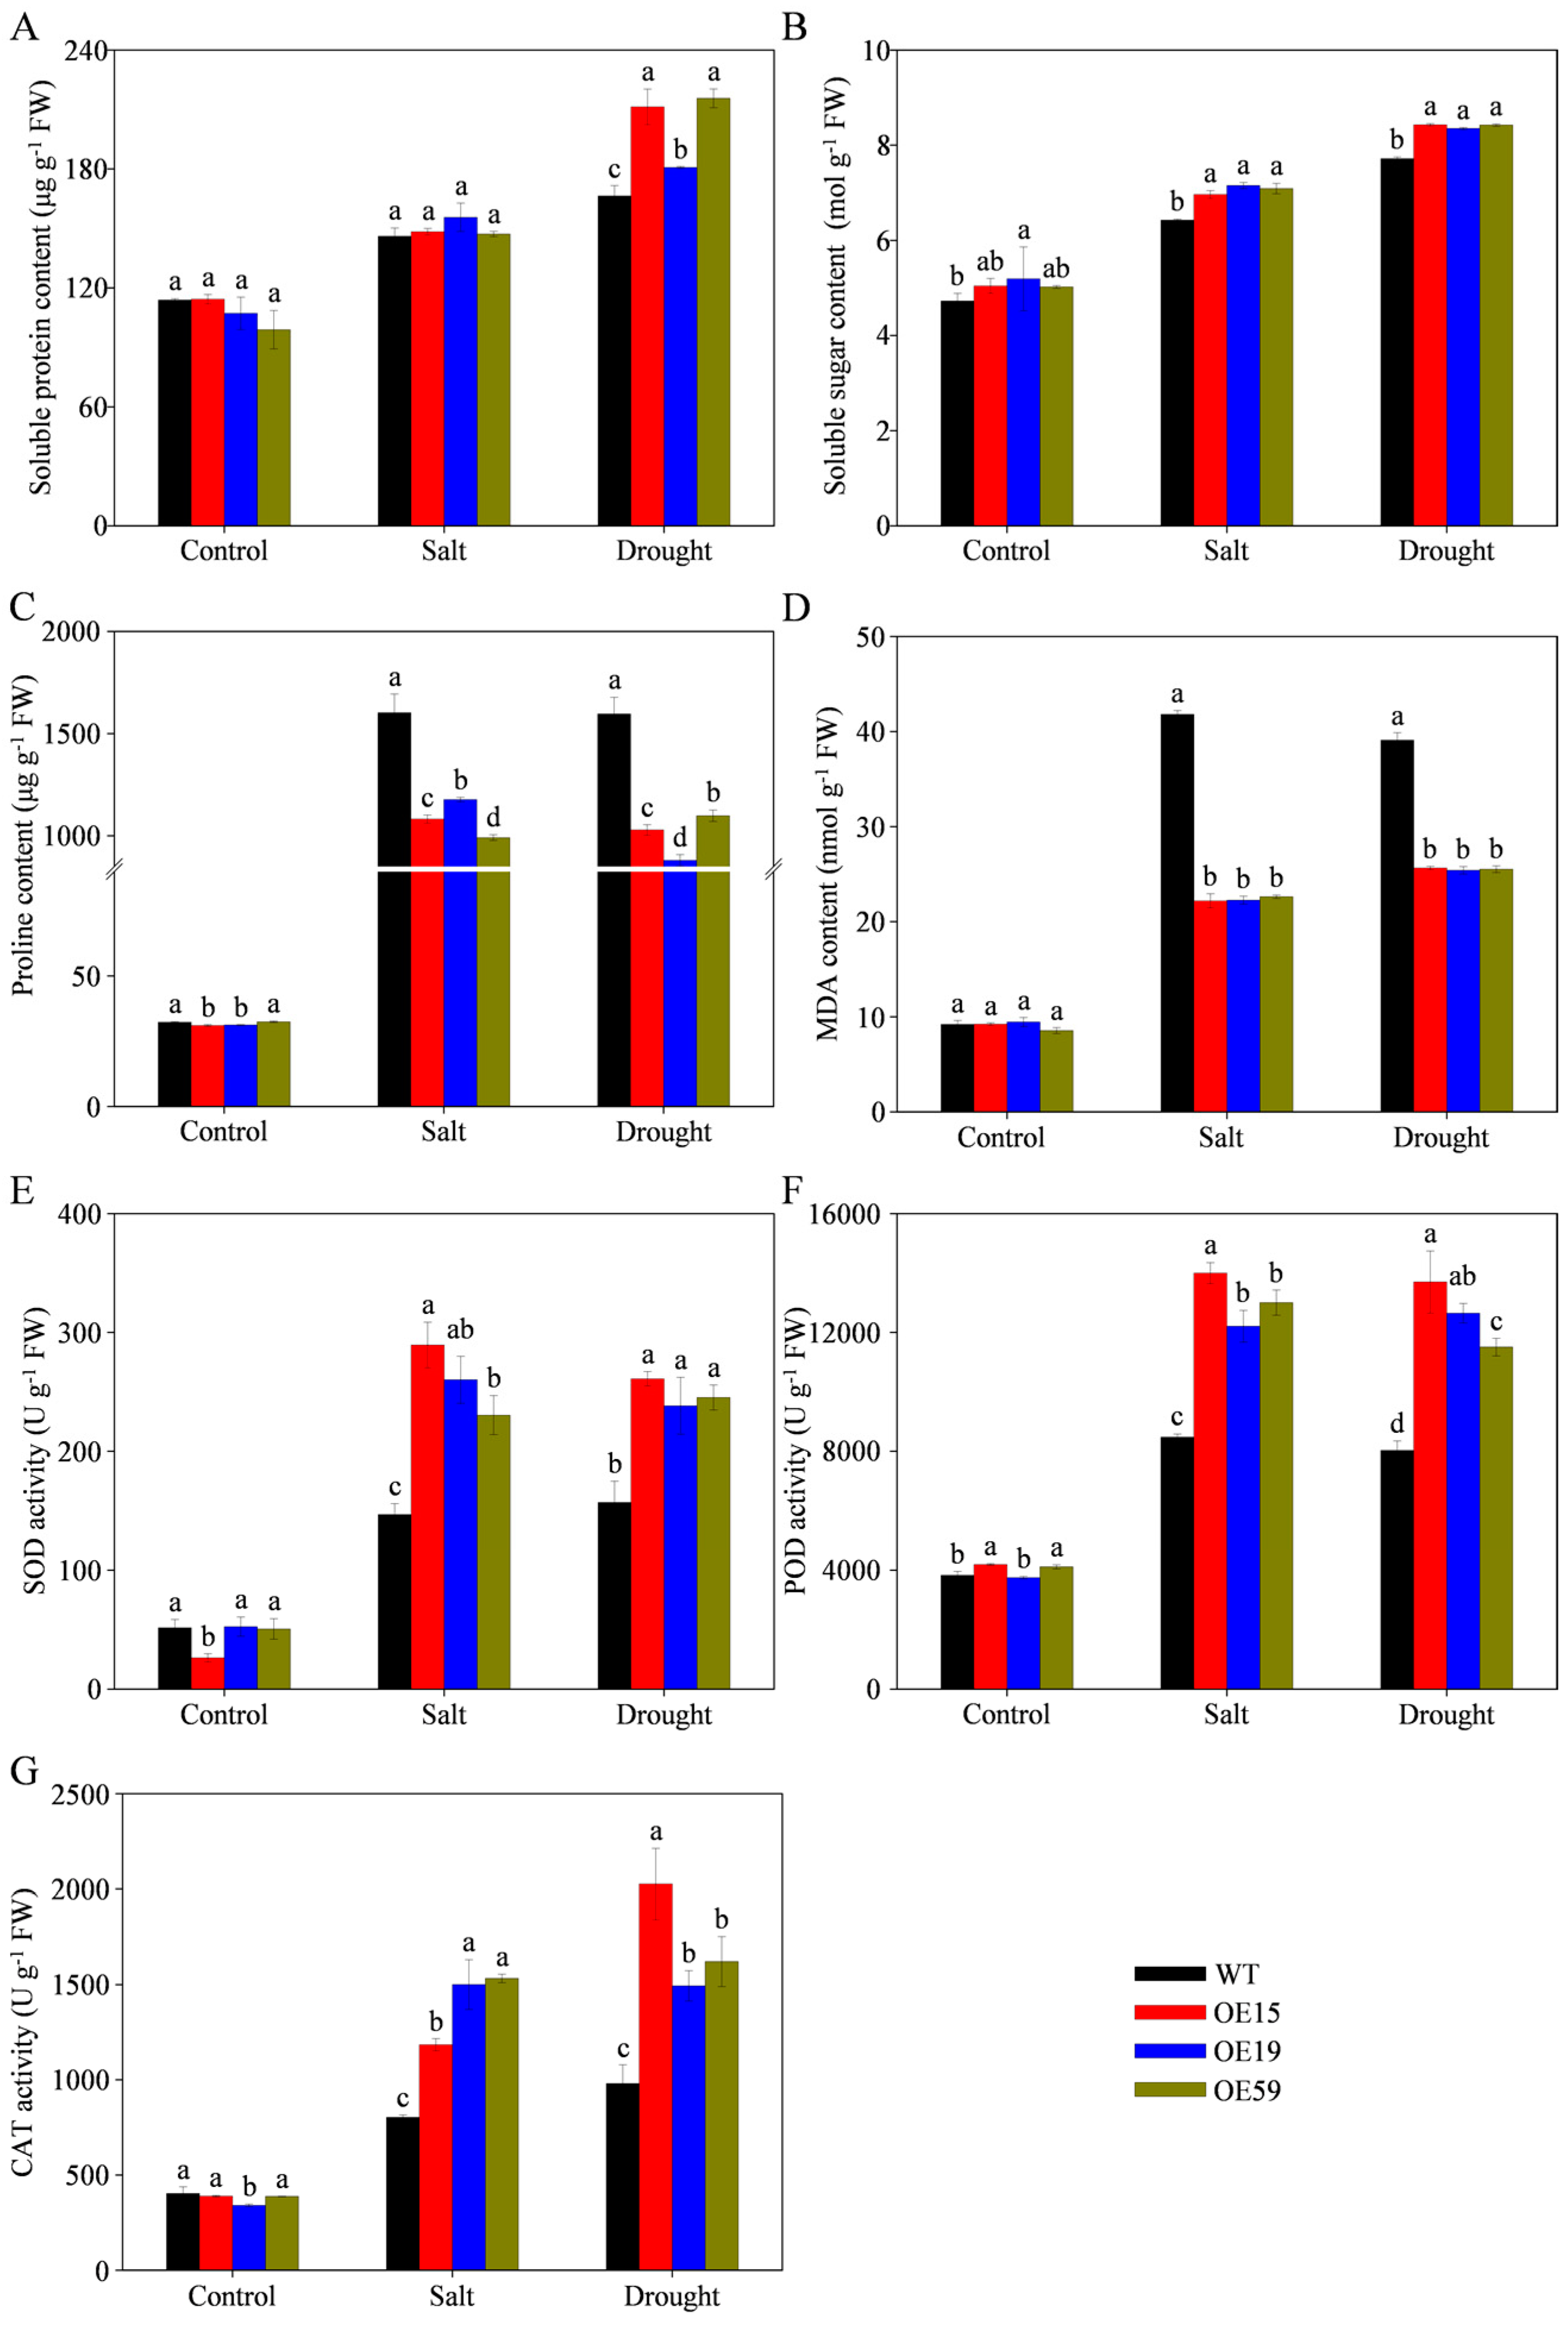
3.9. Overexpression of MtCOMT13 Enhanced Salt and Drought Tolerance in Transgenic Arabidopsis

Seventy-two MtCOMT13-overexpressed Arabidopsis lines were obtained by an Agrobacterium-mediated genetic transformation method. Three overexpressed (OE) lines (OE15, OE19, and OE59) were randomly selected, and the expression level of MtCOMT13 was measured (Figure 9A). Under control condition or 300 mM mannitol stress, no significant differences were found in germination percentage between WT seeds and MtCOMT13-OE seeds, while, under 150 mM NaCl stress, MtCOMT13-OE seeds had significantly higher germination percentage than WT seeds (Figure 9C–E). Moreover, after 7 days of germination, MtCOMT13-OE lines exhibited significantly higher seedling percentage than WT under 150 mM NaCl or 300 mM mannitol stress, while no significant differences were observed on the 0.5 × MS medium without salt or drought stress. In particular, these differences were the largest, respectively, on the 4th or 3rd day of germination under 150 mM NaCl stress or 300 mM mannitol stress (Figure 9F–H).
After 7-day-old seedlings grew continuously in vertical Petri dishes under 150 mM NaCl or 300 mM mannitol for 15 days, MtCOMT13-OE seedlings showed superior growth phenotypes with lower root growth inhibition. Especially under 150 mM NaCl stress, the leaves of most MtCOMT13-OE seedlings still remained green, while those of WT seedlings became almost white (Figure 10A). Whether under control, 150 mM NaCl, or 300 mM mannitol stress, MtCOMT13-OE seedlings had more lateral roots, with 1.08–1.98, 3.17–5.15, or 1.42–2.19 times as many as WT seedlings, respectively (Figure 10B). Compared to WT Arabidopsis, MtCOMT13-OE lines had significantly longer root length under salt stress (OE15 and OE19) and 300 mM mannitol stress (OE15) (Figure 10C). Additionally, MtCOMT13-OE seedlings had significantly higher fresh weight under 150 mM NaCl stress, with 2.65–2.82-fold weight as WT seedlings. Meanwhile, seedling fresh weight was also significantly higher in MtCOMT13-OE than WT under drought stress, at 1.35–1.62-fold (Figure 10D).
To further verify salt and drought tolerance of MtCOMT13-OE Arabidopsis, the three-week-old plants were cultivated in soil, irrigated with 300 mM NaCl for salt stress, or withheld water for drought stress, respectively, for another period of 21 days. No significant differences in leaf color and size between WT and MtCOMT13-OE plants were observed under the control condition. However, compared to the serious wilting and partial chlorosis of rosette leaves of WT plants under salt stress, MtCOMT13-OE plants still maintained dark green leaves. After natural drought stress, the leaves of WT plants completely withered, while those of MtCOMT13-OE plants still remained light green (Figure 11A). In addition, photosynthesis-related indicators were measured in WT and MtCOMT13-OE transgenic plants. Under the control condition, except for the MtCOMT13-OE59 line, there was almost no difference in chlorophyll content between MtCOMT13-OE and WT leaves, while MtCOMT13-OE leaves showed significantly higher chlorophyll content under drought stress, compared to WT plants (Figure 11B). Both stomatal conductance and intercellular CO2 concentration affected photosynthetic intensity, and they showed an opposite trend between MtCOMT13-OE and WT leaves under both salt and drought stress. Stomatal conductance in MtCOMT13-OE leaves was significantly higher than that in WT leaves, while intercellular CO2 concentration was significantly lower in MtCOMT13-OE leaves under salt or drought stress (Figure 11C,D). Moreover, either under control or under salt or drought stress, MtCOMT13-OE leaves had a significantly higher transpiration rate and net photosynthetic rate than WT leaves (Figure 11E,F). These findings suggest that the overexpression of MtCOMT13 improved photosynthesis in transgenic Arabidopsis.
Under control and salt conditions, there was no significant difference in soluble protein content between MtCOMT13-OE and WT plants, while it was significantly higher in MtCOMT13-OE than WT under drought stress (Figure 12A). Compared to WT plants, MtCOMT13-OE lines had significantly higher soluble sugar level and lower proline content under salt or drought stress (Figure 12B,C). Additionally, it was found that MDA content in MtCOMT13-OE plants was significantly lower than that in WT plants under salt or drought stress, although it showed no difference under control condition (Figure 12D). The activity of SOD, POD, and CAT enzymes exhibited similar response trends under stress treatments. Compared to WT plants, these indexes in MtCOMT13-OE lines were significantly higher under salt or drought stress (Figure 12E–G). Therefore, according to the above findings, it was concluded that MtCOMT13 overexpression improved salt and drought tolerance in Arabidopsis.

3.10. Subcellular Localization of MtCOMT13 Protein

Based on protein sequence analysis, it was predicted that MtCOMT13 was located in the cytoplasm. Thus, to confirm this prediction, the CaMV 35S::MtCOMT13-GFP recombinant vector was constructed. The fused pAN580-MtCOMT13-GFP plasmids were transferred into tobacco protoplasts, which were observed by confocal laser microscope after 18–24 h of expression. The results revealed that MtCOMT13 fusion protein was expressed and localized in the cytoplasm (Figure 13).

4. Discussion

As a model legume plant, M. truncatula is commonly used as a model system to study genetic and molecular biology. Melatonin is an important small molecule compound with hydrophilicity, lipophilicity, and many biological functions [48]. A decrease in melatonin content would lead to plants being sensitive to various biotic and abiotic stresses, reducing antioxidant capacity, photosynthesis, and material transport, further hindering plant growth and development [49]. For M. truncatula, the application of exogenous melatonin enhanced Rhizophagus irregularis symbiosis, induced antioxidant responses, and improved photosynthetic efficiency and nitro-oxidative homeostasis under heat and cold stresses [50,51]. Melatonin is a derivative of tryptophan, and COMT is the key rate-limiting enzyme needed to regulate its biosynthesis [52]. However, the available information of the COMT gene family in M. truncatula is still limited. Therefore, a genome-wide analysis of MtCOMTs was conducted to better understand their potential functions, through bioinformatics methods. In total, 63 MtCOMT genes were successfully determined from M. truncatula genome, and they were classified into three categories together with COMT members in M. sativa, G. max, A. thaliana, and O. sativa (Figure 1). The MtCOMT number in M. truncatula was higher than that in the model plant Arabidopsis (28 genes), the same in soybean (63 genes), and lower than that in autotetraploid (2n = 4x = 32) M. sativa (191), which could be due to M. truncatula containing a diploid genome (2n = 2x = 16).
The diversity of gene structure and conserved motif has influenced the evolution of many gene families [53]. In Arabidopsis, the presence of multiple introns played a crucial role for ERECTA gene expression [54]. In this study, MtCOMT genes within the same group exhibited very similar exon/intron structure, and the intron number of MtCOMT genes in groups I and II was obviously higher than that in group III (Figure 2A,B). These findings suggested that MtCOMT genes with more introns might have better selective advantages during the evolutionary process. Additionally, motif analysis showed that Motif 4 exhibited the highest conservation among the three groups, except for its deletion in MtCOMT50 and MtCOMT53 in group I (Figure 2C). Meanwhile, it was interesting to note that Motif 1–Motif 6, in group II, were completely conserved among the three MtCOMTs (MtCOMT9, MtCOMT14, and MtCOMT15), which also had the similar gene structures. In other species such as soybean [24], cotton [31], and blueberry [30], similar gene structure types and evolutionary relationships between COMTs have also been reported. Therefore, conserved sequence characterization analysis and evolutionary tree classification analysis were consistent. In M. truncatula, conserved sequences might play a crucial role in maintaining the gene structure and function of MtCOMTs.
In plants, gene duplication events play a key role in the evolution of gene families. Herein, two segmental duplication events were identified in the M. truncatula genome using MCScanx, without tandem duplication gene pairs (Figure 3A). Meanwhile, the duplicated MtCOMT gene pairs were mainly distributed on three chromosomes (Chr 3, Chr 7, and Chr 8), which indicated that segmental duplication events occurred on 3 of 8 chromosomes in M. truncatula. Therefore, segmental duplication phenomena played a more important role in MtCOMT gene duplication. Additionally, COMT collinearity across different species from leguminous, cruciferous, and gramineous species was investigated, and 56 pairs of collinear genes were identified (Figure 3B and Table S4). Interestingly, MtCOMT13 was identified in collinear gene pairs in M. sativa, G. max, and A. thaliana, indicating that MtCOMT13 was relatively conserved during COMT gene family evolution in dicotyledonous plants. In the model plant Arabidopsis, the AT5G54160.1 (O-methyltransferase) gene had been reported to be very essential in melatonin production and catalyzed N-acetyl-5-serotonin methylation [27]. Thus, it was speculated that the AT5G54160.1 gene might have the function of regulating melatonin synthesis. In this study, the homology analysis of COMT genes across species revealed that Arabidopsis AT5G54160.1 was closely related to MtCOMT13 in group I (Figure 3B), suggesting that they might have similar functions. Generally, it is believed that the COMT gene primarily participates in the final step of the melatonin synthesis pathway, catalyzing the conversion of N-acetyl-5-serotonin to melatonin. For instance, in watermelon (Citrullus lanatus), COMT had been proven to be involved in the last step of melatonin synthesis [55,56,57]. However, there were also studies demonstrating that COMT could catalyze serotonin to generate 5-methoxytryptamine, which was then converted to melatonin [21]. Therefore, the functions of different members in the plant COMT gene family might have been differentiated.
To further investigate MtCOMT function, the cis-acting elements binding transcription factors to regulate genes were analyzed. Cis-acting elements in MtCOMT promoters were divided into four types, and the light response type occupied the largest proportion (Figure 4), indicating that they were important in light-mediated events and likely to affect the function of MtCOMT genes. These findings were consistent with cis-acting element analysis of soybean GmCOMT genes, of which light responsive elements also accounted for the majority [24]. Meanwhile, numerous cis-acting elements associated with the stress response were also discovered, such as defense and stress response, low-temperature response, anaerobic induction, anoxic-specific inducibility, drought stress, and wound induction, indicating that MtCOMTs might be induced by multiple stressors. Indeed, it had previously been reported that salt [58,59], drought [60,61,62], and cold stress [63] induced COMT expression. The transgenic Arabidopsis overexpressing CrCOMT [64] and TaCOMT [65] genes showed higher melatonin production, better physiological performance, and stronger salt and drought tolerance than wild-type plants.
Studies on soybean [24] and rice [34] have revealed that the COMT gene family plays a crucial role in abiotic stress responses. In this study, most MtCOMTs were highly expressed in roots, while a small amount of genes were highly expressed in seeds (Figure 5), suggesting that MtCOMT expression pattern differences among tissues might lead to their functional differences. In soybean Jack and Williams 82, COMT genes also had the highest expression in roots [24], which were similar to the findings in this study. Moreover, MtCOMT genes might respond to salt and drought stress, and the expression profiles based on RNA-seq data from a public database showed that most MtCOMTs were induced by salt stress, and only a few ones were induced by drought stress (Figure 6A,B). Thereafter, gene expression characteristics under salt and drought stresses were further verified by RT-qPCR, using root tissues with the higher expression specificity of MtCOMTs. It revealed that some MtCOMTs were strongly induced by higher concentrations of salt or drought. Meanwhile, the expression levels reached the maximum value after 12 or 24 h of salt or drought stress (Figure 7 and Figure 8), demonstrating that MtCOMT expressions were closely related to the stress degree of salt or drought, such as concentrations and durations. However, regarding the mechanism behind this phenomenon, further study is needed.
Plant growth and yield will be drastically affected when they are subjected to various abiotic stress, including salt, drought, heat, and others disturbing the physiological and biochemical processes [66]. Generally, indicators such as plant height, fresh weight, root length, and lateral root number reflect plant growth status [67]. Studies have uncovered that COMT genes, in Arabidopsis, soybean [24], and rice [34], participate in multiple abiotic stress responses. In Arabidopsis, the AT5G54160.1 gene had been reported to catalyze N-acetyl-5-serotonin methylation and be essential in melatonin production [27]. In this study, MtCOMT13, the homolog of Arabidopsis AT5G54160.1, was isolated, cloned, and functionally characterized. Under salt or drought stress, transgenic Arabidopsis lines overexpressing MtCOMT13 showed more superior seedling morphogenesis than WT, including higher seedling percentage, lateral root number, root length, and fresh weight (Figure 9F,G and Figure 10). These results indicated that MtCOMT13 overexpression improved seedling morphogenesis to some extent under stress conditions. Moreover, under salt or drought stress, MtCOMT13-overexpressed transgenic Arabidopsis plants showed less leaf wilt than WT plants, suggesting that overexpressed plants were more tolerant to stresses (Figure 11A). Plant photosynthesis plays an important role in the synthesis and accumulation of organic compounds, which in turn directly affect plant production. Compared to WT plants, MtCOMT13-overexpressed plants had significantly lower intercellular CO2 concentration and significantly higher stomatal conductance, transpiration rate, and net photosynthetic rate under salt or drought stress (Figure 11C,D). These findings indicated that MtCOMT13 overexpression improved the photosynthesis of transgenic Arabidopsis. Previously, it had been proven that there were crosstalk pathways associated with abiotic stress [68]. Osmotic regulation and antioxidant defense functions are also involved in plants’ responses to abiotic stress. Soluble protein, soluble sugar, and proline are stress response factors that do not always accumulate as plants are subjected to adverse conditions. In this study, compared with WT plants, MtCOMT13-overexpressed plants showed significantly increased levels of soluble protein and soluble sugar under salt or drought stress, but lower proline content (Figure 12A–C), which might be due to the fact that proline, at this point, acted as a responsor to injury instead of an alleviator [67]. MDA is known as an important indicator of reflecting lipid peroxidation, which is closely related to oxidative stress [69]. Under salt or drought stress, MDA content in MtCOMT13-overexpressed lines was significantly lower than that in WT plants (Figure 12D), suggesting that MtCOMT13 overexpression resulted in less damage to the plasma membrane. In addition, antioxidant defense functions mediated by SOD, POD, and CAT in plants are extremely important for reactive oxygen species’ clearance to respond to abiotic stress. These three enzymes had significantly higher activity in MtCOMT13-overexpressed lines under salt or drought stress (Figure 12E–G), which indicated that MtCOMT13 played a positive role in antioxidant defense regulation and further contributed to the improvement of plant salt and drought tolerance. In brief, MtCOMT13 played a very important role in the salt tolerance and drought resistance of plants. However, the downstream pathways regulated by the MtCOMT13 gene under abiotic stress still need further exploration. Therefore, more in-depth studies should be conducted in the future to investigate the molecular mechanisms underlying salt and drought tolerance regulated by the MtCOMT13 gene, such as the regulatory relationships between proteins or between proteins and nucleic acids, so as to systematically analyze the molecular pathways through which the MtCOMT13 gene regulates plant phenotypes.

5. Conclusions

In summary, a total of 63 MtCOMT members were identified in the M. truncatula genome, which were classified into three groups in the phylogenetic tree. The MtCOMTs had significant variations in gene structure but were relatively conserved in evolution. Additionally, cis-acting elements in MtCOMT promoters were predicted, which involved four categories of growth and development, light, stress, and hormone responsive elements. The expression patterns of MtCOMTs in different tissues were systematically studied, and it was found that they were tissue-specific, with the highest level in roots. Meanwhile, MtCOMT expressions under abiotic stresses showed that they were induced by salt and drought. Furthermore, MtCOMT13 overexpression enhanced the resistance of transgenic A. thaliana to salt and drought through improving photosynthesis, osmotic regulation, and antioxidant defense capabilities. Overall, the systematic exploration and findings of the COMT gene family in M. truncatula help us further study MtCOMT-specific functions, which lay a foundation for improving stress resistance and molecular breeding in leguminous plants.

Supplementary Materials

The following supporting information can be downloaded at https://www.mdpi.com/article/10.3390/agriculture14081305/s1, Table S1: Primers used in this study. Table S2: The identified MtCOMT genes in the M. truncatula genome. Table S3: Width, sites, and E-value of the conserved motifs of MtCOMT proteins. Table S4: Homology analysis of COMT genes between M. truncatula and M. sativa, G. max, A. thaliana, and O. sativa.

Author Contributions

Conceptualization, K.C. and H.Y.; methodology, K.C., Y.L., Z.Z., Q.S. and X.Y.; data curation, K.C.; writing—original draft preparation, K.C. and H.Y.; writing—review and editing, H.Y.; Supervision, H.Y.; Funding acquisition, H.Y. All authors have read and agreed to the published version of the manuscript.

Funding

This research was funded by the National Natural Science Foundation of China (32301480), National Center of Pratacultural Technology Innovation (under preparation) (CCPTZX2023B01), and Natural Science Foundation of Shandong Province (ZR2020QC187).

Institutional Review Board Statement

Not applicable.

Data Availability Statement

Data are contained within the article and in the Supplementary Materials.

Acknowledgments

We would like to thank Feng Yuan, Yaling Liu, and Maofeng Chai for assistance in paper revision.

Conflicts of Interest

The authors declare no conflicts of interest.

References

  1. Qin, H.; Li, Y.; Huang, R. Advances and challenges in the breeding of salt-tolerant rice. Int. J. Mol. Sci. 2020, 21, 8385. [Google Scholar] [CrossRef] [PubMed]
  2. Rhaman, M.S.; Imran, S.; Karim, M.M.; Chakrobortty, J.; Mahamud, M.A.; Sarker, P.; Tahjib-Ul-Arif, M.; Robin, A.H.K.; Ye, W.; Murata, Y.; et al. 5-aminolevulinic acid-mediated plant adaptive responses to abiotic stress. Plant Cell Rep. 2021, 40, 1451–1469. [Google Scholar] [CrossRef] [PubMed]
  3. Farooq, M.S.; Uzair, M.; Raza, A.; Habib, M.; Xu, Y.; Yousuf, M.; Yang, S.H.; Ramzan Khan, M. Uncovering the research gaps to alleviate the negative impacts of climate change on food security: A review. Front. Plant Sci. 2022, 13, 927535. [Google Scholar] [CrossRef]
  4. Ashraf, M.; Foolad, M.R. Crop breeding for salt tolerance in the era of molecular markers and marker-assisted selection. Plant Breed. 2013, 132, 10–20. [Google Scholar] [CrossRef]
  5. Ashraf, M.; Munns, R. Evolution of approaches to increase the salt tolerance of crops. Crit. Rev. Plant Sci. 2022, 41, 128–160. [Google Scholar] [CrossRef]
  6. Zulfiqar, F.; Ashraf, M. Nanoparticles potentially mediate salt stress tolerance in plants. Plant Physiol. Biochem. 2021, 160, 257–268. [Google Scholar] [CrossRef]
  7. Naeem, M.; Iqbal, M.; Shakeel, A.; Ul-Allah, S.; Hussain, M.; Rehman, A.; Zafar, Z.U.; Athar, H.-U.-R.; Ashraf, M. Genetic basis of ion exclusion in salinity stressed wheat: Implications in improving crop yield. Plant Growth Regul. 2020, 92, 479–496. [Google Scholar] [CrossRef]
  8. Pieri, C.; Marra, M.; Moroni, F.; Recchioni, R.; Marcheselli, F. Melatonin: A peroxyl radical scavenger more effective than vitamin E. Life Sci. 1994, 55, PL271–PL276. [Google Scholar] [CrossRef] [PubMed]
  9. Rodriguez, C.; Mayo, J.C.; Sainz, R.M.; Antolín, I.; Herrera, F.; Martín, V.; Reiter, R.J. Regulation of antioxidant enzymes: A significant role for melatonin. J. Pineal Res. 2004, 36, 1–9. [Google Scholar] [CrossRef]
  10. Bajwa, V.S.; Shukla, M.R.; Sherif, S.M.; Murch, S.J.; Saxena, P.K. Role of melatonin in alleviating cold stress in Arabidopsis thaliana. J. Pineal Res. 2014, 56, 238–245. [Google Scholar] [CrossRef]
  11. Li, C.; Wang, P.; Wei, Z.; Liang, D.; Liu, C.; Yin, L.; Jia, D.; Fu, M.; Ma, F. The mitigation effects of exogenous melatonin on salinity-induced stress in Malus hupehensis. J. Pineal Res. 2012, 53, 298–306. [Google Scholar] [CrossRef]
  12. Wang, L.; Feng, C.; Zheng, X.; Guo, Y.; Zhou, F.; Shan, D.; Liu, X.; Kong, J. Plant mitochondria synthesize melatonin and enhance the tolerance of plants to drought stress. J. Pineal Res. 2017, 63, e12429. [Google Scholar] [CrossRef] [PubMed]
  13. Martinez, V.; Nieves-Cordones, M.; Lopez-Delacalle, M.; Rodenas, R.; Mestre, T.C.; Garcia-Sanchez, F.; Rubio, F.; Nortes, P.A.; Mittler, R.; Rivero, R.M. Tolerance to stress combination in tomato plants: New insights in the protective role of melatonin. Molecules 2018, 23, 535. [Google Scholar] [CrossRef] [PubMed]
  14. Kobylińska, A.; Borek, S.; Posmyk, M.M. Melatonin redirects carbohydrates metabolism during sugar starvation in plant cells. J. Pineal Res. 2018, 64, e12466. [Google Scholar] [CrossRef] [PubMed]
  15. Fan, J.; Xie, Y.; Zhang, Z.; Chen, L. Melatonin: A multifunctional factor in plants. Int. J. Mol. Sci. 2018, 19, 1528. [Google Scholar] [CrossRef]
  16. Murch, S.J.; Campbell, S.S.B.; Saxena, P.K. The role of serotonin and melatonin in plant morphogenesis: Regulation of auxin-induced root organogenesis in in vitro-cultured explants of st. John’s Wort (Hypericum perforatum L.). Vitr. Cell. Dev.-Plant 2001, 37, 786–793. [Google Scholar] [CrossRef]
  17. Hernández-Ruiz, J.; Cano, A.; Arnao, M.B. Melatonin: A growth-stimulating compound present in lupin tissues. Planta 2004, 220, 140–144. [Google Scholar] [CrossRef] [PubMed]
  18. Kolář, J.; Johnson, C.H.; Macháčková, I. Exogenously applied melatonin (N-acetyl-5-methoxytryptamine) affects flowering of the short-day plant Chenopodium rubrum. Physiol. Plant. 2003, 118, 605–612. [Google Scholar] [CrossRef]
  19. Wang, P.; Yin, L.; Liang, D.; Li, C.; Ma, F.; Yue, Z. Delayed senescence of apple leaves by exogenous melatonin treatment: Toward regulating the ascorbate-glutathione cycle. J. Pineal Res. 2012, 53, 11–20. [Google Scholar] [CrossRef]
  20. Arnao, M.B.; Hernández-Ruiz, J. Protective effect of melatonin against chlorophyll degradation during the senescence of barley leaves. J. Pineal Res. 2009, 46, 58–63. [Google Scholar] [CrossRef]
  21. Back, K.; Tan, D.X.; Reiter, R.J. Melatonin biosynthesis in plants: Multiple pathways catalyze tryptophan to melatonin in the cytoplasm or chloroplasts. J. Pineal Res. 2016, 61, 426–437. [Google Scholar] [CrossRef] [PubMed]
  22. Kang, K.; Lee, K.; Park, S.; Byeon, Y.; Back, K. Molecular cloning of rice serotonin N-acetyltransferase, the penultimate gene in plant melatonin biosynthesis. J. Pineal Res. 2013, 55, 7–13. [Google Scholar] [CrossRef] [PubMed]
  23. Wang, M.; Wang, P.; Lin, M.; Ye, Z.; Li, G.; Tu, L.; Shen, C.; Li, J.; Yang, Q.; Zhang, X. Evolutionary dynamics of 3D genome architecture following polyploidization in cotton. Nat. Plants 2018, 4, 90–97. [Google Scholar] [CrossRef] [PubMed]
  24. Zhang, X.; Chen, B.; Wang, L.; Ali, S.; Guo, Y.; Liu, J.; Wang, J.; Xie, L.; Zhang, Q. Genome-wide identification and characterization of Caffeic Acid O-Methyltransferase gene family in soybean. Plants 2021, 10, 2816. [Google Scholar] [CrossRef] [PubMed]
  25. Guo, D.; Chen, F.; Inoue, K.; Blount, J.W.; Dixon, R.A. Downregulation of caffeic acid 3-O-methyltransferase and caffeoyl CoA 3-O-methyltransferase in transgenic alfalfa impacts on lignin structure and implications for the biosynthesis of G and S lignin. Plant Cell 2001, 13, 73–88. [Google Scholar] [CrossRef] [PubMed]
  26. Liu, S.; Fu, C.; Gou, J.; Sun, L.; Huhman, D.; Zhang, Y.; Wang, Z.Y. Simultaneous downregulation of MTHFR and COMT in switchgrass affects plant performance and induces lesion-mimic cell death. Front. Plant Sci. 2017, 8, 982. [Google Scholar] [CrossRef] [PubMed]
  27. Byeon, Y.; Lee, H.Y.; Lee, K.; Back, K. Caffeic acid O-methyltransferase is involved in the synthesis of melatonin by methylating N-acetylserotonin in Arabidopsis. J. Pineal Res. 2014, 57, 219–227. [Google Scholar] [CrossRef] [PubMed]
  28. Chang, J.; Guo, Y.; Yan, J.; Zhang, Z.; Yuan, L.; Wei, C.; Zhang, Y.; Ma, J.; Yang, J.; Zhang, X.; et al. The role of watermelon caffeic acid O-methyltransferase (ClCOMT1) in melatonin biosynthesis and abiotic stress tolerance. Hortic. Res. 2021, 8, 210. [Google Scholar] [CrossRef] [PubMed]
  29. Li, W.; Lu, J.; Lu, K.; Yuan, J.; Huang, J.; Du, H.; Li, J. Cloning and phylogenetic analysis of Brassica napus L. Caffeic Acid O-Methyltransferase 1 gene family and its expression pattern under drought stress. PLoS ONE 2016, 11, e0165975. [Google Scholar]
  30. Liu, Y.; Wang, Y.; Pei, J.; Li, Y.; Sun, H. Genome-wide identification and characterization of COMT gene family during the development of blueberry fruit. BMC Plant Biol. 2021, 21, 5. [Google Scholar] [CrossRef]
  31. Wu, C.; Zuo, D.; Xiao, S.; Wang, Q.; Cheng, H.; Lv, L.; Zhang, Y.; Li, P.; Song, G. Genome-wide identification and characterization of GhCOMT gene family during fiber development and verticillium wilt resistance in cotton. Plants 2021, 10, 2756. [Google Scholar] [CrossRef] [PubMed]
  32. Chen, S.; Zhao, Y.; Zhao, X.; Chen, S. Identification of putative lignin biosynthesis genes in Betula pendula. Trees 2020, 34, 1255–1265. [Google Scholar] [CrossRef]
  33. Chun, H.J.; Baek, D.; Cho, H.M.; Lee, S.H.; Jin, B.J.; Yun, D.J.; Hong, Y.S.; Kim, M.C. Lignin biosynthesis genes play critical roles in the adaptation of Arabidopsis plants to high-salt stress. Plant Signal. Behav. 2019, 14, 1625697. [Google Scholar] [CrossRef] [PubMed]
  34. Liang, S.; Xu, S.; Qu, D.; Yang, L.; Wang, J.; Liu, H.; Xin, W.; Zou, D.; Zheng, H. Identification and functional analysis of the Caffeic Acid O-Methyltransferase (COMT) gene family in rice (Oryza sativa L.). Int. J. Mol. Sci. 2022, 23, 8491. [Google Scholar] [CrossRef] [PubMed]
  35. Shu, Y.; Liu, Y.; Zhang, J.; Song, L.; Guo, C. Genome-wide analysis of the AP2/ERF superfamily genes and their responses to abiotic stress in Medicago truncatula. Front. Plant Sci. 2016, 6, 1247. [Google Scholar] [CrossRef] [PubMed]
  36. Zhao, D.; Yao, Z.; Zhang, J.; Zhang, R.; Mou, Z.; Zhang, X.; Li, Z.; Feng, X.; Chen, S.; Reiter, R.J. Melatonin synthesis genes N-acetylserotonin methyltransferases evolved into caffeic acid O-methyltransferases and both assisted in plant terrestrialization. J. Pineal Res. 2021, 71, e12737. [Google Scholar] [CrossRef] [PubMed]
  37. Bhowal, B.; Bhattacharjee, A.; Goswami, K.; Sanan-Mishra, N.; Singla-Pareek, S.L.; Kaur, C.; Sopory, S. Serotonin and melatonin biosynthesis in plants: Genome-wide identification of the genes and their expression reveal a conserved role in stress and development. Int. J. Mol. Sci. 2021, 22, 11034. [Google Scholar] [CrossRef] [PubMed]
  38. Marchler-Bauer, A.; Bo, Y.; Han, L.; He, J.; Lanczycki, C.J.; Lu, S.; Chitsaz, F.; Derbyshire, M.K.; Geer, R.C.; Gonzales, N.R.; et al. CDD/SPARCLE: Functional classification of proteins via subfamily domain architectures. Nucleic Acids Res. 2017, 45, D200–D203. [Google Scholar] [CrossRef]
  39. Cantelli, G.; Bateman, A.; Brooksbank, C.; Petrov, A.I.; Malik-Sheriff, R.S.; Ide-Smith, M.; Hermjakob, H.; Flicek, P.; Apweiler, R.; Birney, E.; et al. The European Bioinformatics Institute (EMBL-EBI) in 2021. Nucleic Acids Res. 2022, 50, D11–D19. [Google Scholar] [CrossRef]
  40. Kumar, S.; Stecher, G.; Li, M.; Knyaz, C.; Tamura, K. MEGA X: Molecular evolutionary genetics analysis across computing platforms. Mol. Biol. Evol. 2018, 35, 1547–1549. [Google Scholar] [CrossRef]
  41. Letunic, I.; Bork, P. Interactive Tree of Life (iTOL) v4: Recent updates and new developments. Nucleic Acids Res. 2019, 47, W256–W259. [Google Scholar] [CrossRef]
  42. Chen, C.; Chen, H.; Zhang, Y.; Thomas, H.R.; Frank, M.H.; He, Y.; Xia, R. TBtools: An integrative toolkit developed for interactive analyses of big biological data. Mol. Plant. 2020, 13, 1194–1202. [Google Scholar] [CrossRef]
  43. Finn, R.D.; Clements, J.; Eddy, S.R. HMMER web server: Interactive sequence similarity searching. Nucleic Acids Res. 2011, 39, W29–W37. [Google Scholar] [CrossRef] [PubMed]
  44. Lescot, M.; Déhais, P.; Thijs, G.; Marchal, K.; Moreau, Y.; Van de Peer, Y.; Rouzé, P.; Rombauts, S. PlantCARE, a database of plant cis-acting regulatory elements and a portal to tools for in silico analysis of promoter sequences. Nucleic Acids Res. 2002, 30, 325–327. [Google Scholar] [CrossRef]
  45. Carrere, S.; Verdier, J.; Gamas, P. MtExpress, a comprehensive and curated RNAseq-based Gene Expression Atlas for the model legume Medicago truncatula. Plant Cell Physiol. 2021, 62, 1494–1500. [Google Scholar] [CrossRef] [PubMed]
  46. Livak, K.J.; Schmittgen, T.D. Analysis of relative gene expression data using real-time quantitative PCR and the 2−ΔΔCT method. Methods 2001, 25, 402–408. [Google Scholar] [CrossRef] [PubMed]
  47. Clough, S.J.; Bent, A.F. Floral dip: A simplified method for Agrobacterium-mediated transformation of Arabidopsis thaliana. Plant J. 1998, 16, 735–743. [Google Scholar] [CrossRef]
  48. Yang, Y.; Cao, Y.; Li, Z.; Zhukova, A.; Yang, S.; Wang, J.; Tang, Z.; Cao, Y.; Zhang, Y.; Wang, D. Interactive effects of exogenous melatonin and Rhizophagus intraradices on saline-alkaline stress tolerance in Leymus chinensis. Mycorrhiza 2020, 30, 357–371. [Google Scholar] [CrossRef]
  49. Tousi, S.; Zoufan, P.; Ghahfarrokhie, A.R. Alleviation of cadmium-induced phytotoxicity and growth improvement by exogenous melatonin pretreatment in mallow (Malva parviflora) plants. Ecotoxicol. Environ. Saf. 2020, 206, 111403. [Google Scholar] [CrossRef]
  50. Irshad, A.; Rehman, R.N.U.; Dubey, S.; Khan, M.A.; Yang, P.; Hu, T. Rhizobium inoculation and exogenous melatonin synergistically increased thermotolerance by improving antioxidant defense, photosynthetic efficiency, and nitro-oxidative homeostasis in Medicago truncatula. Front. Ecol. Evol. 2022, 10, 945695. [Google Scholar] [CrossRef]
  51. Irshad, A.; Rehman, R.N.U.; Kareem, H.A.; Yang, P.; Hu, T. Addressing the challenge of cold stress resilience with the synergistic effect of Rhizobium inoculation and exogenous melatonin application in Medicago truncatula. Ecotoxicol. Environ. Saf. 2021, 226, 112816. [Google Scholar] [CrossRef] [PubMed]
  52. Tan, D.X.; Hardeland, R.; Manchester, L.C.; Paredes, S.D.; Korkmaz, A.; Sainz, R.M.; Mayo, J.C.; Fuentes-Broto, L.; Reiter, R.J. The changing biological roles of melatonin during evolution: From an antioxidant to signals of darkness, sexual selection and fitness. Biol. Rev. 2010, 85, 607–623. [Google Scholar] [CrossRef] [PubMed]
  53. Xu, G.; Guo, C.; Shan, H.; Kong, H. Divergence of duplicate genes in exon-intron structure. Proc. Natl. Acad. Sci. USA 2012, 109, 1187–1192. [Google Scholar] [CrossRef] [PubMed]
  54. Karve, R.; Liu, W.; Willet, S.G.; Torii, K.U.; Shpak, E.D. The presence of multiple introns is essential for ERECTA expression in Arabidopsis. RNA 2011, 17, 1907–1921. [Google Scholar] [CrossRef] [PubMed]
  55. Li, H.; Chang, J.; Chen, H.; Wang, Z.; Gu, X.; Wei, C.; Zhang, Y.; Ma, J.; Yang, J.; Zhang, X. Exogenous melatonin confers salt stress tolerance to watermelon by improving photosynthesis and redox homeostasis. Front. Plant Sci. 2017, 8, 295. [Google Scholar] [CrossRef]
  56. Chang, J.; Guo, Y.; Zhang, Z.; Wei, C.; Zhang, Y.; Ma, J.; Yang, J.; Zhang, X.; Li, H. CBF-responsive pathway and phytohormones are involved in melatonin-improved photosynthesis and redox homeostasis under aerial cold stress in watermelon. Acta Physiol. Plant. 2020, 42, 159. [Google Scholar] [CrossRef]
  57. Nawaz, M.A.; Jiao, Y.; Chen, C.; Shireen, F.; Zheng, Z.; Imtiaz, M.; Bie, Z.; Huang, Y. Melatonin pretreatment improves vanadium stress tolerance of watermelon seedlings by reducing vanadium concentration in the leaves and regulating melatonin biosynthesis and antioxidant-related gene expression. J. Plant Physiol. 2018, 220, 115–127. [Google Scholar] [CrossRef]
  58. Li, J.; Liu, J.; Zhu, T.; Zhao, C.; Li, L.; Chen, M. The role of melatonin in salt stress responses. Int. J. Mol. Sci. 2019, 20, 1735. [Google Scholar] [CrossRef] [PubMed]
  59. Michard, E.; Simon, A.A. Melatonin’s antioxidant properties protect plants under salt stress. Plant Cell Environ. 2020, 43, 2587–2590. [Google Scholar] [CrossRef]
  60. Cui, G.; Zhao, X.; Liu, S.; Sun, F.; Zhang, C.; Xi, Y. Beneficial effects of melatonin in overcoming drought stress in wheat seedlings. Plant Physiol. Biochem. 2017, 118, 138–149. [Google Scholar] [CrossRef]
  61. Sharma, A.; Zheng, B. Melatonin mediated regulation of drought stress: Physiological and molecular aspects. Plants 2019, 8, 190. [Google Scholar] [CrossRef] [PubMed]
  62. Khattak, W.A.; Sun, J.; Abbas, A.; Hameed, R.; Jalal, A.; Niaz, N.; Anwar, S.; Liu, Y.; Wang, Y. Melatonin alleviating drought stress in plants: A review. S. Afr. J. Bot. 2023, 161, 192–201. [Google Scholar] [CrossRef]
  63. Ryu, J.; Kwon, S.-J.; Sung, S.Y.; Kim, W.-J.; Kim, D.S.; Ahn, J.-W.; Kim, J.-B.; Kim, S.H.; Ha, B.-K.; Kang, S.-Y. Molecular cloning, characterization, and expression analysis of lignin biosynthesis genes from kenaf (Hibiscus cannabinus L.). Genes Genom. 2015, 38, 59–67. [Google Scholar] [CrossRef]
  64. Zhang, K.; Cui, H.; Cao, S.; Yan, L.; Li, M.; Sun, Y. Overexpression of CrCOMT from Carex rigescens increases salt stress and modulates melatonin synthesis in Arabidopsis thaliana. Plant Cell Rep. 2019, 38, 1501–1514. [Google Scholar] [CrossRef] [PubMed]
  65. Yang, W.J.; Du, Y.T.; Zhou, Y.B.; Chen, J.; Xu, Z.S.; Ma, Y.Z.; Chen, M.; Min, D.H. Overexpression of TaCOMT improves melatonin production and enhances drought tolerance in transgenic Arabidopsis. Int. J. Mol. Sci. 2019, 20, 652. [Google Scholar] [CrossRef] [PubMed]
  66. Izadi, M.H.; Rabbani, J.; Emam, Y.; Pessarakli, M.; Tahmasebi, A. Effects of salinity stress on physiological performance of various wheat and barley cultivars. J. Plant Nutr. 2014, 37, 520–531. [Google Scholar] [CrossRef]
  67. Xu, L.; Zhang, L.; Liu, Y.; Sod, B.; Li, M.; Yang, T.; Gao, T.; Yang, Q.; Long, R. Overexpression of the elongation factor MtEF1A1 promotes salt stress tolerance in Arabidopsis thaliana and Medicago truncatula. BMC Plant Biol. 2023, 23, 138. [Google Scholar] [CrossRef] [PubMed]
  68. Cha, J.Y.; Kim, J.; Kim, T.S.; Zeng, Q.; Wang, L.; Lee, S.Y.; Kim, W.Y.; Somers, D.E. GIGANTEA is a co-chaperone which facilitates maturation of ZEITLUPE in the Arabidopsis circadian clock. Nat. Commun. 2017, 8, 3. [Google Scholar] [CrossRef]
  69. Heidari, P.; Reza Amerian, M.; Barcaccia, G. Hormone profiles and antioxidant activity of cultivated and wild tomato seedlings under low-temperature stress. Agronomy 2021, 11, 1146. [Google Scholar] [CrossRef]
Figure 1. Phylogenetic tree of COMTs from M. truncatula, M. sativa, G. max, A. thaliana, and O. sativa constructed by the Neighbor-Joining (NJ) method using Poisson model in EMBL-EBI software with 1000 bootstrap value. The yellow, red, and blue rectangles on the outside of the circle represent groups I, II, and III, respectively. The blue stars, red squares, green triangles, pink circles, and brown squares indicate M. truncatula, M. sativa, G. max, A. thaliana, and O. sativa, respectively.
Agriculture 14 01305 g001
Figure 2. Phylogenetic relationship, exon/intron structure, and conserved motif analyses of putative COMTs in M. truncatula. (A) Phylogenetic relationship of COMT genes. The phylogenetic tree was constructed using full-length sequences of 63 COMT proteins in M. truncatula, through MEGA-X software 7.0 and the Neighbor-Joining method. (B) Exon/intron structure of MtCOMT genes. Exon, intron, and UTR are, respectively, represented by the green box, gray line, and yellow box. Exon or intron size can be calculated using the scale at the bottom. (C) Distribution of the six most conserved motifs in COMT proteins represented by different colors. (D) Sequence of the six most conserved motifs in MtCOMTs.
Agriculture 14 01305 g002
Figure 3. Collinearity analysis of the COMT gene family in M. truncatula. (A) Collinearity analysis of COMT genes in M. truncatula. Eight colored rectangular boxes located at the outer edge of the circle represent the eight chromosomes of M. truncatula. In the middle of the collinear circle, gray lines represent the collinearity module of M. truncatula genome, and red lines represent the collinearity relationship of some COMT genes. (B) Collinearity analysis of COMT genes between M. truncatula and M. sativa, G. max, A. thaliana, and O. sativa. Gray lines represent collinear blocks in genomes of M. truncatula and the other four representative plants, and red lines show collinear COMT gene pairs.
Agriculture 14 01305 g003
Figure 4. Cis-acting element prediction in MtCOMTs promoters. The cis-acting element number in COMT genes is shown, and the colors in the heatmap indicate the frequency of the elements.
Agriculture 14 01305 g004
Figure 5. Tissue expression profiles of MtCOMTs in M. truncatula. MtCOMT expression levels in different tissues are retrieved from the RNAseq-based Gene Expression Atlas dataset of M. truncatula (MtExpress V3). A clustering heatmap, based on the log2 scale, is drawn through using TBtools software (version 2.008). Colors spanning from blue to red represent the increased gene expression level.
Agriculture 14 01305 g005
Figure 6. Expression patterns of MtCOMTs in response to abiotic stress in M. truncatula. (A) Salt stress. (B) Drought stress. (C) Cold stress. Gene expression levels are retrieved from the RNAseq-based Gene Expression Atlas dataset of M. truncatula (MtExpress V3). Relative expression levels of genes were calculated. A clustering heatmap, based on the log2 scale, is drawn through using TBtools software (version 2.008). Colors spanning from blue to red represent the increased gene expression level. (D) Venn diagram of MtCOMTs genes expressed under the three abiotic stresses.
Agriculture 14 01305 g006
Figure 7. The RT-qPCR analysis of MtCOMT expression under salt stress. Results are indicated as the ratio of MtCOMT expression to reference gene expression. Data represent means ± SE (n = 3, p ≤ 0.05, one-way ANOVA). Different lowercase letters among treatment durations represent significant differences at p < 0.05 level.
Agriculture 14 01305 g007
Figure 8. The RT-qPCR analysis of MtCOMT expression under drought stress. Results are indicated as the ratio of MtCOMT expression to reference gene expression. Data represent means ± SE (n = 3, p ≤ 0.05, one-way ANOVA). Different lowercase letters among treatment durations represent significant differences at p < 0.05 level.
Agriculture 14 01305 g008
Figure 9. Seed germination differences between wild-type (WT) and MtCOMT13-overexpressed (OE) Arabidopsis lines under salt and drought stress. (A) The relative expression level of MtCOMT13 in WT and overexpressed Arabidopsis. Different lowercase letters represent significant differences at p < 0.05 level. (B) Germination phenotypes of WT and MtCOMT13-OE seeds cultivated under control, 150 mM NaCl, or 300 mM mannitol stress for 7 days. Scale bar = 1 cm. (CE) Germination percentage of WT and MtCOMT13-OE seeds under control, 150 mM NaCl, or 300 mM mannitol stress. (FH) Seedling percentage of WT and MtCOMT13-OE Arabidopsis under control, 150 mM NaCl, or 300 mM mannitol stress. Values are expressed as means ± SE (n = 3).
Agriculture 14 01305 g009
Figure 10. Salt and drought responses of wild-type (WT) and MtCOMT13-overexpressed (OE) Arabidopsis seedlings. (A) Phenotypes of WT and MtCOMT13-OE seedlings under control condition, 150 mM NaCl, or 300 mM mannitol. Scale bar = 1 cm. (B) Lateral root number, (C) root length, and (D) fresh weight of WT and MtCOMT13-OE seedlings under salt and drought stress. Values are expressed as means ± SE (n = 3). Different lowercase letters among WT and MtCOMT13-OE lines represent significant differences at p < 0.05 level.
Agriculture 14 01305 g010
Figure 11. Salt and drought tolerance analyses of wild-type (WT) and MtCOMT13-overexpressed (OE) Arabidopsis plants. (A) Plant phenotypes after 300 mM NaCl stress or natural drought stress for 21 days. (B) Chlorophyll content, (C) stomatal conductance, (D) intercellular CO2 concentration, (E) transpiration rate, and (F) net photosynthetic rate of WT and MtCOMT13-OE plants under salt and drought stress. Values are expressed as means ± SE (n = 3). Different lowercase letters among WT and MtCOMT13-OE lines represent significant differences at p < 0.05 level.
Agriculture 14 01305 g011
Figure 12. Physiological and biochemical analyses of wild-type (WT) and MtCOMT13-overexpressed (OE) Arabidopsis plants after 300 mM NaCl and natural drought stress for 21 days. (A) Soluble protein content. (B) Soluble sugar content. (C) Proline content. (D) MDA content. (E) SOD activity. (F) POD activity. (G) CAT activity. Values are expressed as means ± SE (n = 3). Different lowercase letters among WT and MtCOMT13-OE lines represent significant differences at p < 0.05 level.
Agriculture 14 01305 g012
Figure 13. Subcellular localization of MtCOMT13 in tobacco protoplasts. Confocal laser scanning microscope images of tobacco protoplasts expressing MtCOMT13 fused to GFP proteins. Scale bar = 10 µm.
Agriculture 14 01305 g013
Disclaimer/Publisher’s Note: The statements, opinions and data contained in all publications are solely those of the individual author(s) and contributor(s) and not of MDPI and/or the editor(s). MDPI and/or the editor(s) disclaim responsibility for any injury to people or property resulting from any ideas, methods, instructions or products referred to in the content.

