Article

Oilseed Rape Yield Prediction from UAVs Using Vegetation Index and Machine Learning: A Case Study in East China

1
Institute of Digital Agriculture, Zhejiang Academy of Agricultural Sciences, Hangzhou 310021, China
2
Key Laboratory of Information Traceability for Agricultural Products, Ministry of Agriculture of China, Hangzhou 310021, China
3
Huzhou Agricultural Science and Technology Development Center, Huzhou 313000, China
4
Institute of Crops and Nuclear Technology Utilization, Zhejiang Academy of Agricultural Sciences, Hangzhou 310021, China
5
Zhejiang Institute of Hydraulics and Estuary, Hangzhou 310020, China
*
Author to whom correspondence should be addressed.
Agriculture 2024, 14(8), 1317; https://doi.org/10.3390/agriculture14081317
Submission received: 22 May 2024 / Revised: 26 July 2024 / Accepted: 6 August 2024 / Published: 8 August 2024

Abstract

:
Yield prediction is an important agriculture management for crop policy making. In recent years, unmanned aerial vehicles (UAVs) and spectral sensor technology have been widely used in crop production. This study aims to evaluate the ability of UAVs equipped with spectral sensors to predict oilseed rape yield. In an experiment, RGB and hyperspectral images were captured using a UAV at the seedling (S1), budding (S2), flowering (S3), and pod (S4) stages in oilseed rape plants. Canopy reflectance and spectral indices of oilseed rape were extracted and calculated from the hyperspectral images. After correlation analysis and principal component analysis (PCA), input spectral indices were screened to build yield prediction models using random forest regression (RF), multiple linear regression (MLR), and support vector machine regression (SVM). The results showed that UAVs equipped with spectral sensors have great potential in predicting crop yield at a large scale. Machine learning approaches such as RF can improve the accuracy of yield models in comparison with traditional methods (e.g., MLR). The RF-based training model had the highest determination coefficient (R2) (0.925) and lowest relative root mean square error (RRMSE) (5.91%). In testing, the MLR-based model had the highest R2 (0.732) and lowest RRMSE (11.26%). Moreover, we found that S2 was the best stage for predicting oilseed rape yield compared with the other growth stages. This study demonstrates a relatively accurate prediction for crop yield and provides valuable insight for field crop management.

1. Introduction

Reliable prediction of crop yield is important for farmers to determine agricultural management. An accurate crop yield prediction model can help farmers decide on what to plant, when to grow, and when to harvest. Different approaches have been developed to predict the yields of various crops [1,2,3,4,5]. Many of these studies have used traditional methods to estimate crop yield by collecting soil and climate parameters [6]. However, these methods are time-consuming and do not fully describe the spatial variability of yield [7]. In contrast to traditional methods, remote sensing techniques are relatively economical and can provide quick and convenient solutions to predicting crop yields. Recently, vegetation indices (VIs) calculated from spectral reflectance in remote sensing have been developed to predict crop yields; their use requires less labor and avoids crop destruction [8,9].
Generally, near-infrared reflectance (NIR) and the visible spectrum are considered to be related to crop yield. VIs are calculated mainly by a combination of the above reflectance in two or more different bands. The reliability and potential of many indices have been investigated in various studies to estimate the crop yield of different crops. Several VIs, such as water index (WI), soil-adjusted vegetation index (SAVI), green index (GI), and green vegetation index (GVI), have been proposed [10,11,12]. The normalized difference vegetation index (NDVI) is widely used to estimate crop yield due to the significant correlation between crop growth conditions and productivity [13].
Usually, a single index alone may not provide excellent prediction all the time and everywhere. Combining multiple indices may lead to better predictive performance. However, a large number of VIs may also make data analysis and model building complex and difficult [14]. Therefore, many researchers have investigated the optimal combination of VIs for the most accurate yield estimation. In 2022, Kayad et al. [15] used normalized difference red-edge (NDRE) and NDVI to predict maize yield, and the NDRE- and NDVI-based model’s determination coefficient (R2) was 0.85 and 0.92, respectively. VIs may contain a large amount of information, and they usually have a nonlinear relationship with crop yield. Feature filtering, such as correlation analysis, importance ranking, and principal component analysis (PCA), can be applied to help us select model input variables.
Machine learning has big advantages in processing large amounts of nonlinear data and is capable of analyzing spectral big data. Many machine learning algorithms, such as artificial neural networks (ANNs) [16], support vector machines (SVM) [17], random forests (RFs) [18], and AdaBoost [19], have successfully predicted the yields of various crops. They each have different advantages. Rajković et al. [20] found that ANNs have a high ability to model nonlinear complex relationships between dependent and independent variables. Meanwhile, support vector machines (SVMs) have the potential to solve the overfitting problem when using high-dimensional data such as spectral data [14]. Spectral indices have been used in machine learning methods for the yield estimation of rice [21], potatoes [22,23], wheat [4,24], and cotton [25]. Marques Ramos et al. [18] employed five different machine learning methods with vegetation indices to predict maize yield, and they found that RF predicted maize yield more accurately than other models.
UAVs can be equipped with many portable devices and have been widely used in various agricultural tasks. A UAV can accomplish seeding, fertilization, spraying, and crop monitoring for a low cost and taking little time [26]. UAVs mounted with spectral sensors can collect crop canopy spectral reflectance and then obtain vegetation indices through spectral analysis. Crop yields have been predicted using such VIs by many researchers [12,27]. However, there are limited studies on predicting oilseed rape yield at different growth stages using spectral VIs obtained by UAVs and machine learning methods.
Considering all the above, the aims of the present work are (1) to investigate the effect of the growth stage on oilseed rape yield model performance, (2) to compare the oilseed rape yield model performances of four different machine learning methods and reveal the best solution, and (3) to investigate the effects of different input strategies on oilseed rape model performance. Our study improves the relationships between oilseed rape yield and predictive VI variables obtained by UAV proximal sensing.

2. Materials and Methods

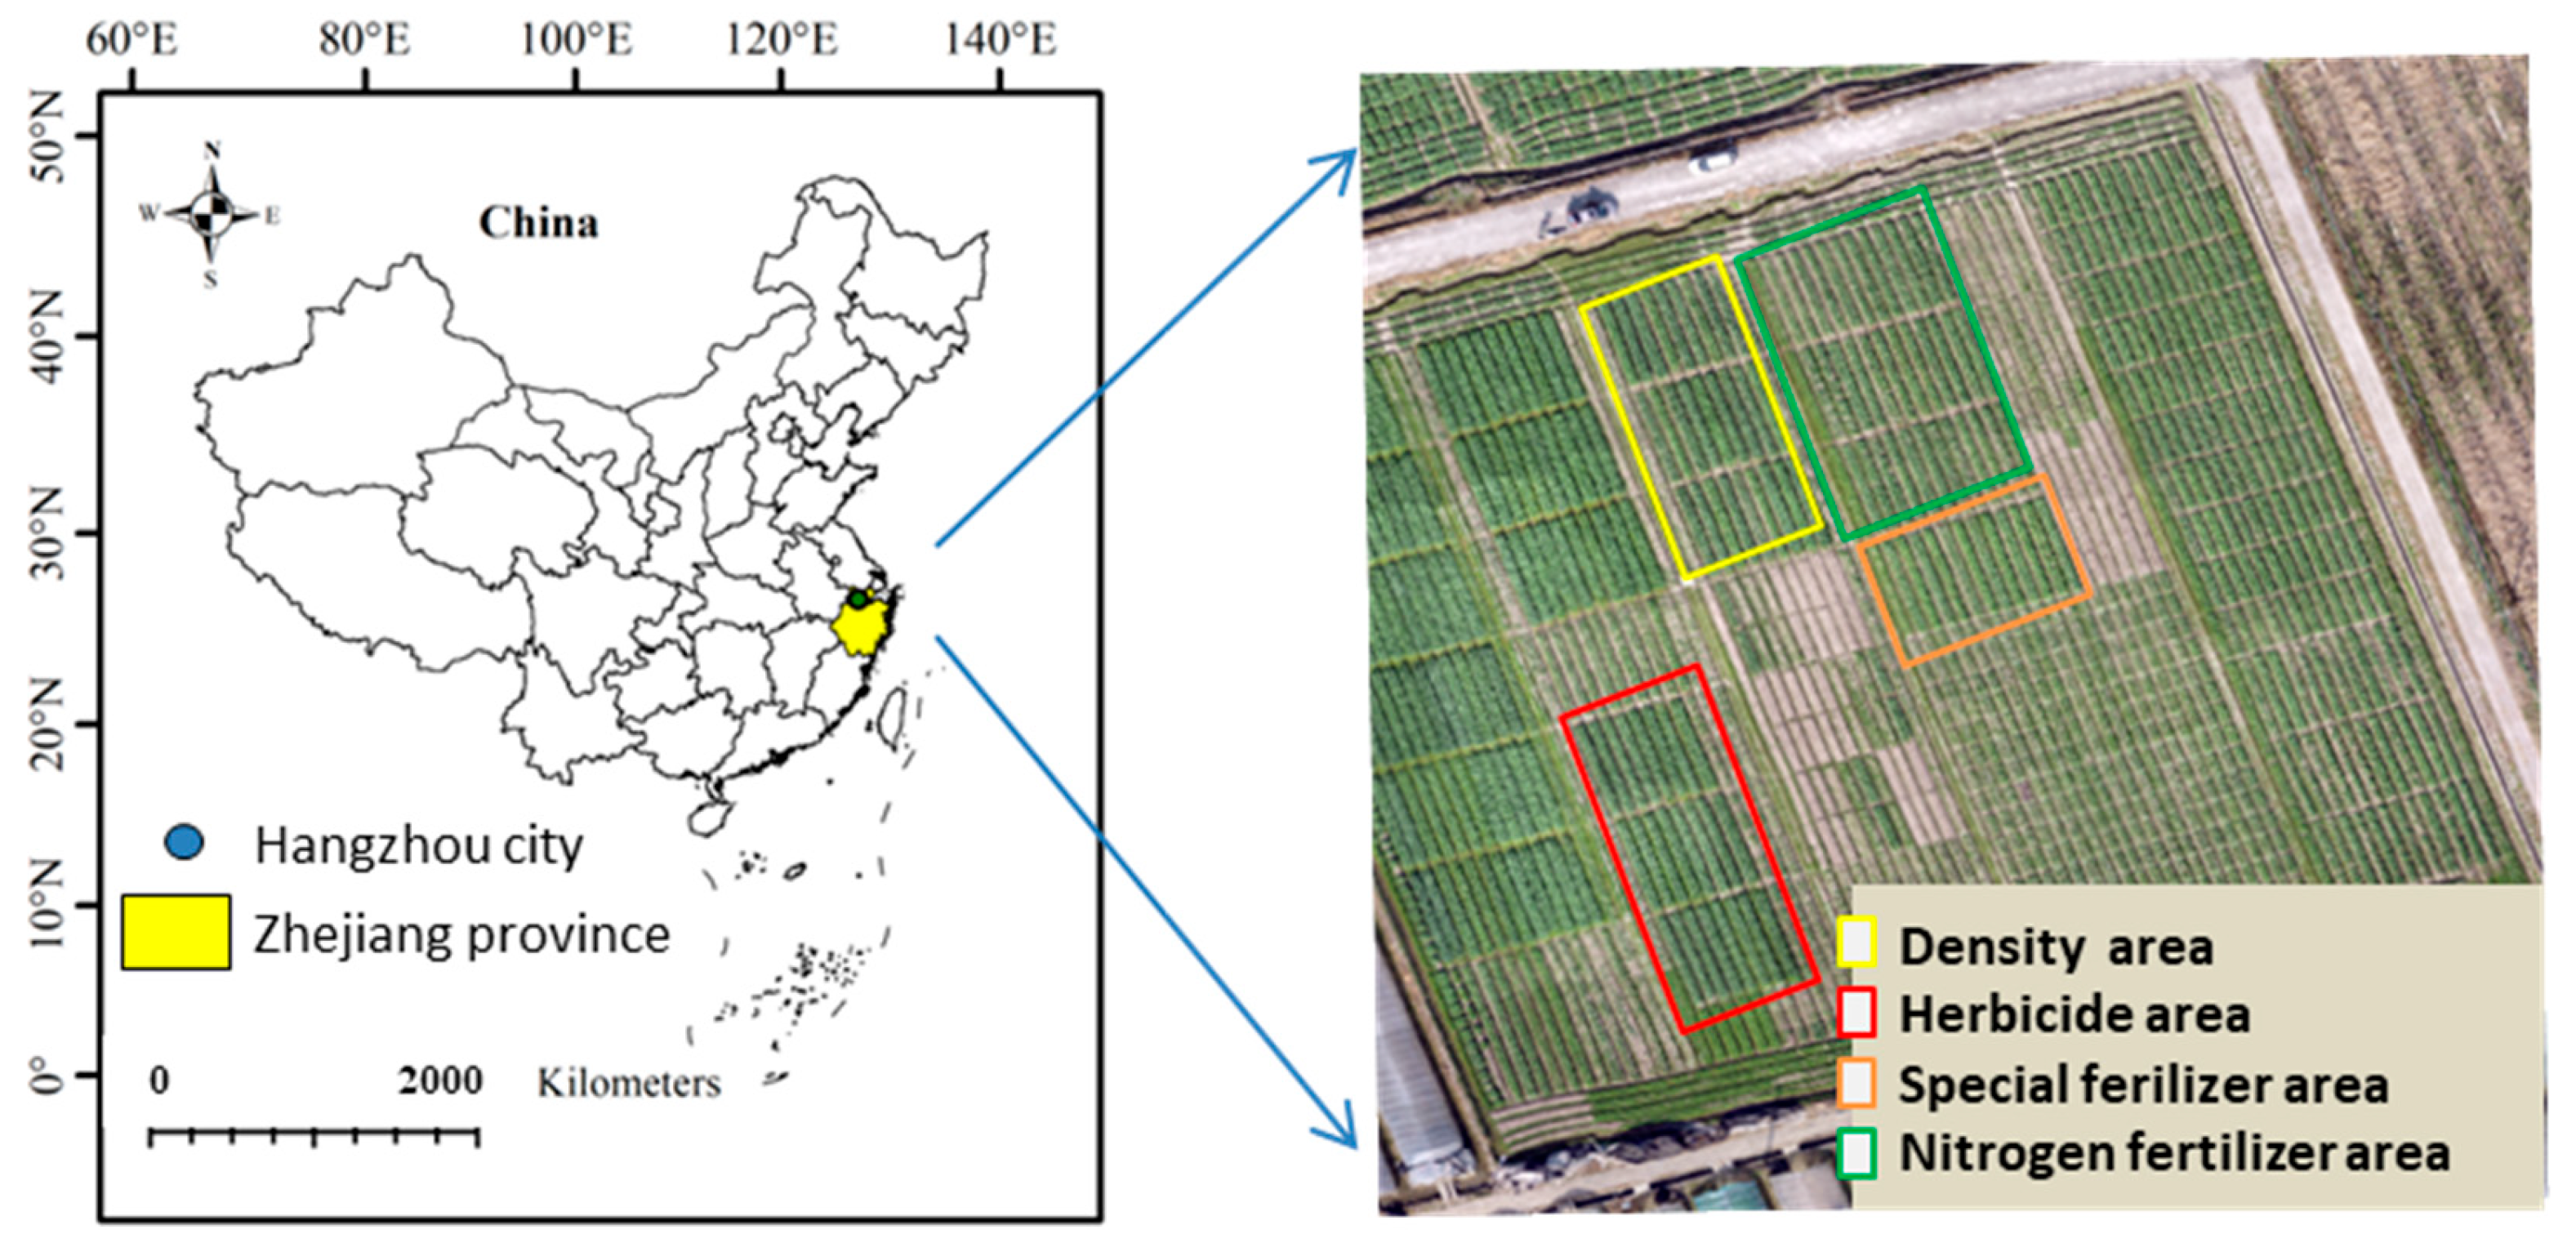
2.1. Study Area and Experimental Design

The test site was located at the experiment field base of the Zhejiang Academy of Agricultural Sciences, Liangzhu town, Hangzhou city, Zhejiang province, China (Figure 1). It has a monsoon climate and is on the southern edge of the northern subtropical zone. Its winter and summer are long, while spring and autumn are short, warm, and humid; the region experiences abundant sunlight and rainfall. The annual average temperature ranges from 15.3 °C to 16.2 °C, and the annual average rainfall ranges from 1150 to 1550 mm (https://upimg.baike.so.com/doc/5366320-5602031.html. In Chinese, accessed on 1 July 2024).
Details on the experimental design are shown in Table 1. In order to obtain gradient yield data, we investigated nitrogen fertilizer application (F1, F2, and F3), herbicide (NHB and HB), planting density (D1, D2, and D3), and oilseed rape special fertilizer application (CF and SF). The field experiment area could be seen in Figure 1. The study (the above four experiment treatments) involved a total of 84 field plots. Each field plot was 10.0 m long and 2.0 m wide. Oilseed rape seedlings with three leaves were transplanted on October 1 in 2021 at a depth of 10–15 cm. Except where otherwise stated, oilseed rape was planted with a density of 4.5 × 10⁵ seedlings/ha, compound fertilizer (N:P2O5:K2O = 16:16:16) at 750 kg/ha was applied, and pre-emergence herbicide (S)-Metolachlor (1.5 L/ha) was sprayed. Oilseed rape was manually harvested and dry-weighed plot by plot on 20 May 2022. Yield was expressed as kg/ha.

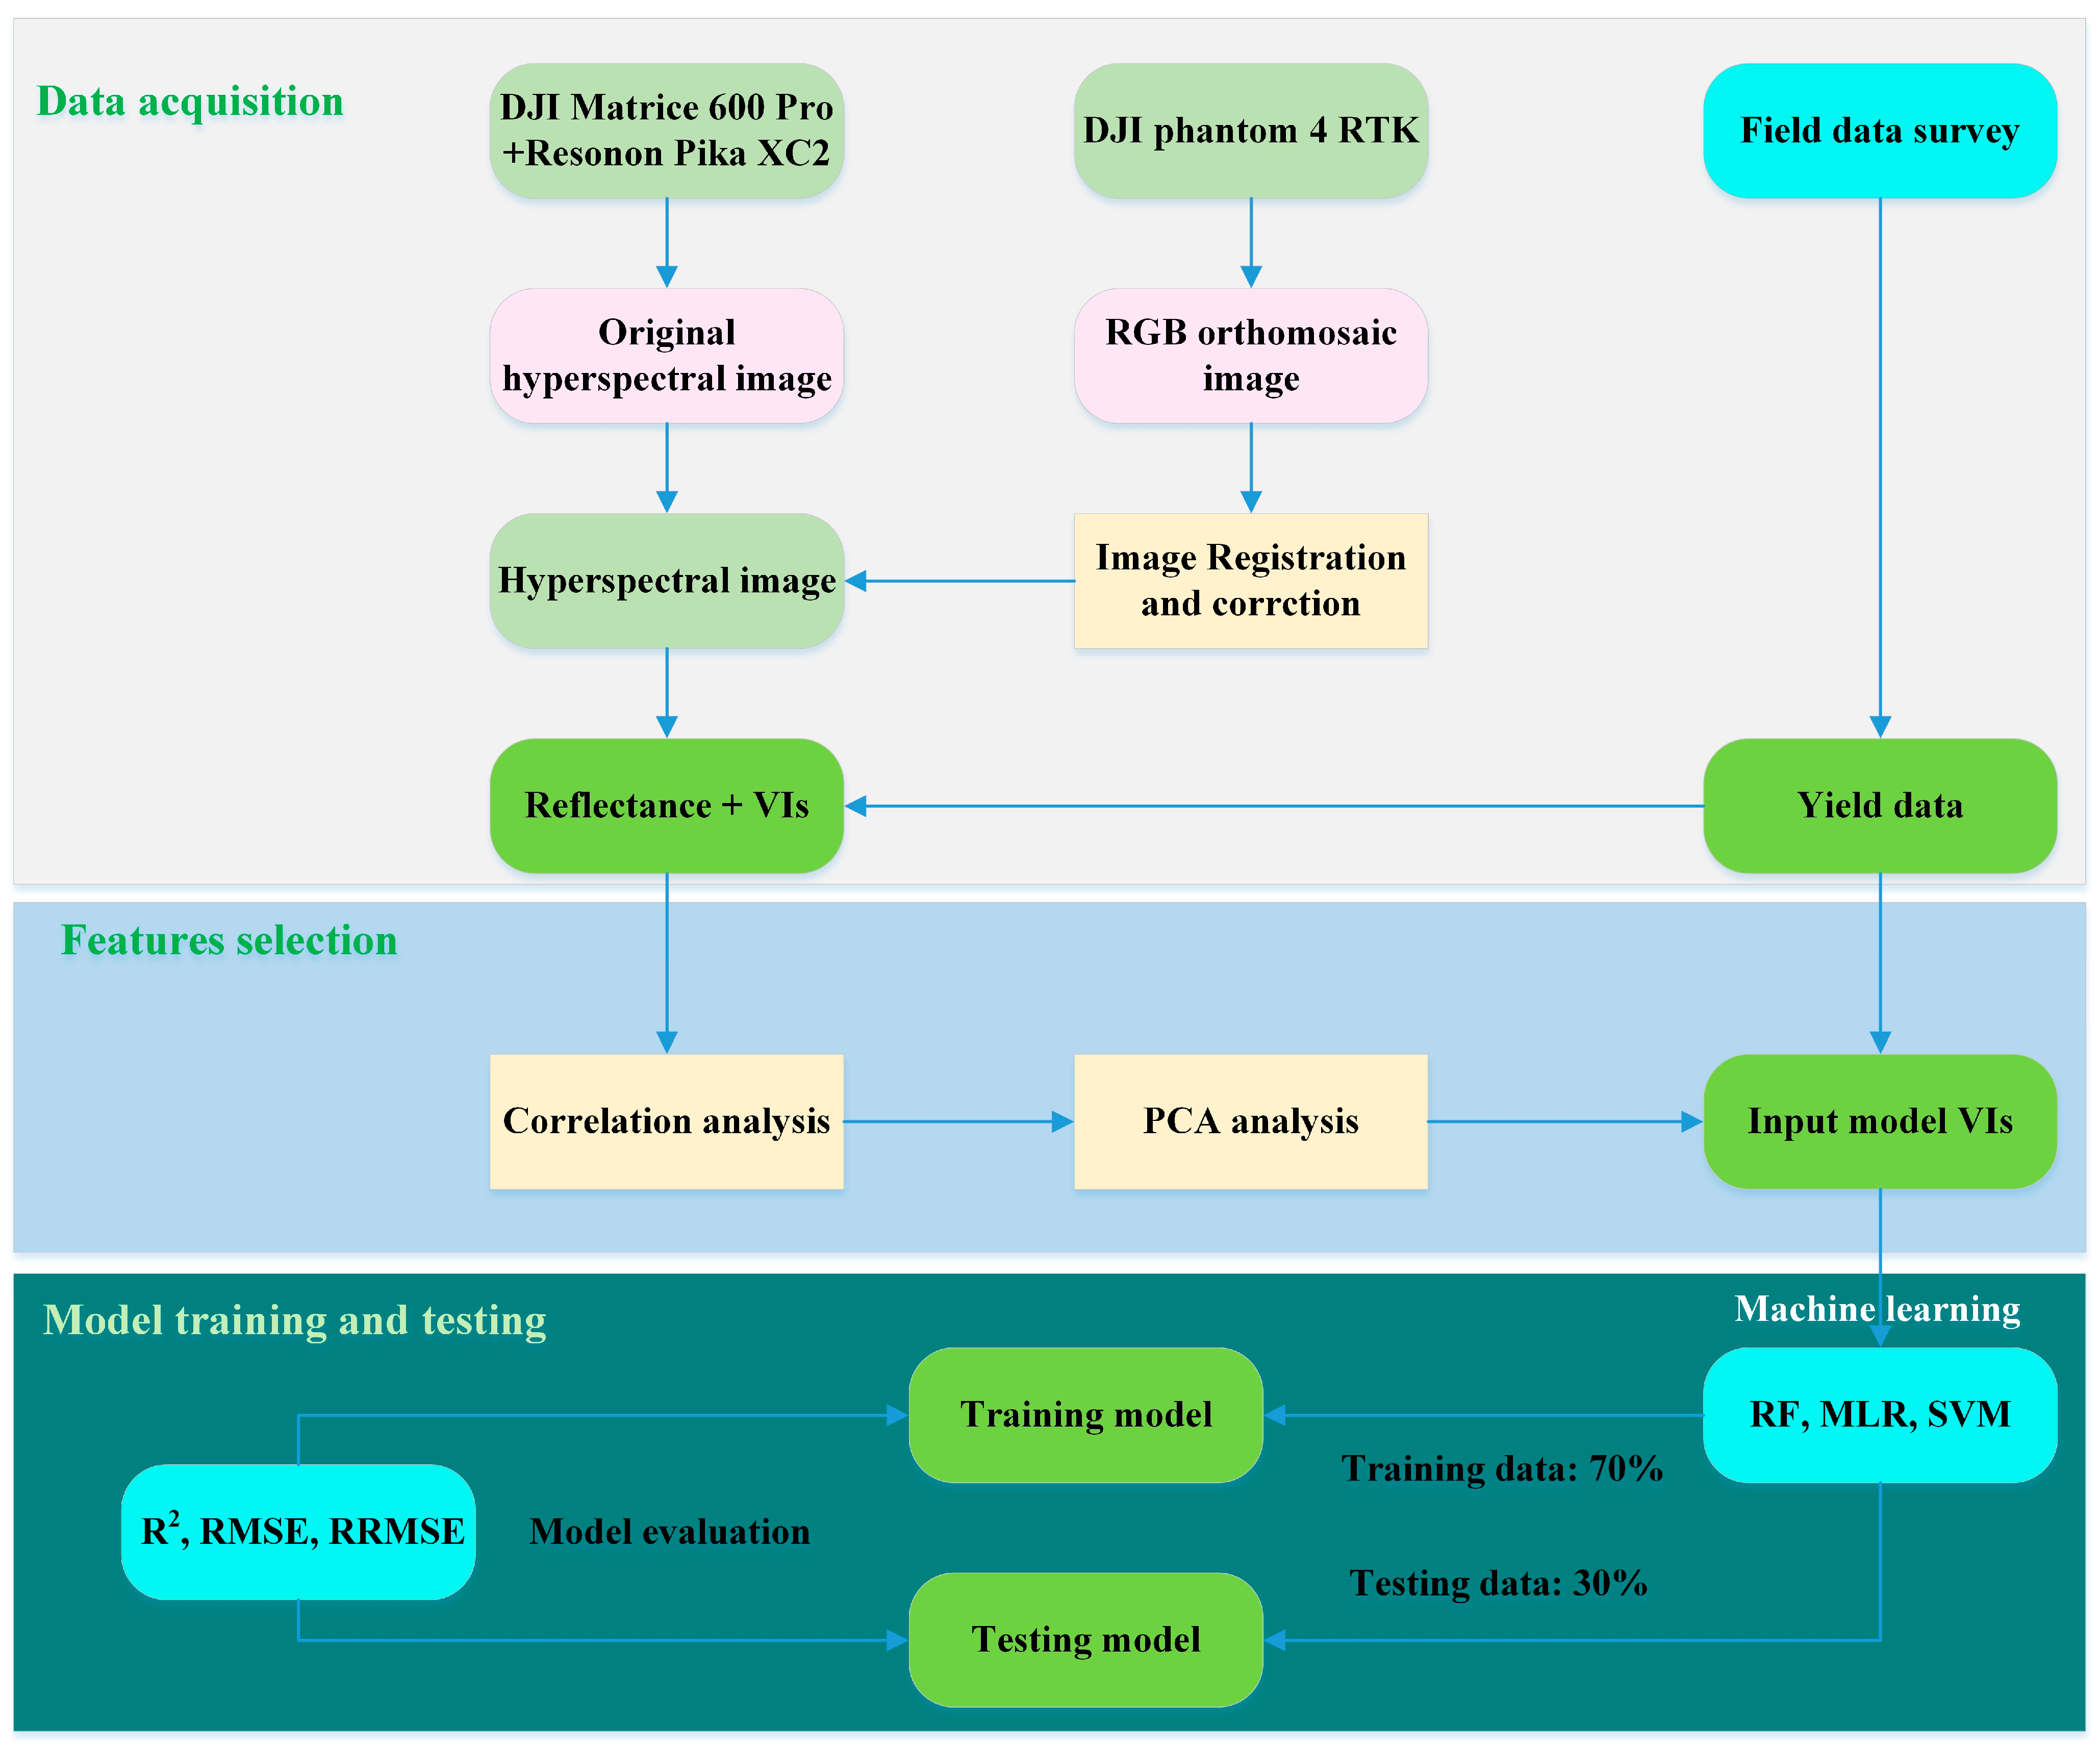
2.2. Data Acquisition

We chose two UAVs as platforms to obtain the RGB and hyperspectral image collection: a DJ Phantom-4-RTK and a DJ M600 Pro (DJI Technology Co., Shenzhen, China). An aerial survey was conducted under conditions of a low wind speed and clear skies from 11:00 AM to 2:00 PM local time on February 4 (seedling, (S1), March 11 (budding, S2), April 3 (flowering, S3), and April 25 (pod, S4), 2022. The mission was planned at a flight height of 60 m and with a flight speed of 6 m/s, with a front overlap of 80% and a side overlap of 70%.
A visible and near-infrared hyperspectral imaging system, the Pika XC2 camera (Resnon Inc., Bozeman, MT, USA), with a spectral range of 400–1100 nm, a spectral resolution of 1.3 nm, 447 spectral channels, and 1600 spatial channels with a 12-bit depth, was mounted and fixed on the DJ Matrice 600 Pro (DJI, Shenzhen, China) to capture the spectral images of oilseed rape plants. The maximum payload of the UAV was 6.0 kg and that of the Pika XC2 camera was 2.51 kg. Captured images were stored in memory cards. Reflectance of the oilseed rape was extracted using the software Spectronon Pro 1.0 (Resonon Inc., Bozeman, MT, USA), and spectral VIs were calculated as shown in Table 2.

2.3. Data Reduction

Hyperspectral images containing huge amounts of data may make data analysis complex and difficult. Thus, it is necessary to reduce the data and select the appropriate spectral VIs to construct the yield prediction model. We applied correlation analysis and PCA to reduce the dimension and amount of large spectral data. A two-tailed test with p < 0.05 (*) was used in the correlation analysis between reflectance, VIs, and oilseed rape yield. After correlation analysis, PCA with two principal components was conducted. The resulting scores allowed us to screen VIs with a close relationship with oilseed rape yield; these VIs were then used as model input variables.

2.4. Data Modeling

For modeling, two-thirds of the data (56 data points) were used for training, while the remaining third (28 data points) were used independently for testing. To build the oilseed rape yield prediction model, we used four machine learning regression methods: RF, multiple linear regression (MLR), and SVM. RF is a commonly used machine learning algorithm. It can combine the output of multiple decision trees to reach a single result. In the RF, the number of decision trees was set to 500, and other parameters were set to the algorithm’s default values. For MLR, “input” is the model construction method. SVM is commonly used for regression analysis due to its powerful supervised learning algorithms. The employed SVM used default parameters.

2.5. Model Performance

The flowchart of the entire process, starting from image collection to data analysis and modeling, is shown in Figure 2. Before modeling, data of all the input variables were normalized using Equation (1):
x n = x i x min x max x min
Here, x i is an original value, x n is a normalized value, and x max and x min are the maximum and minimum values, respectively.
Figure 2. Development workflow for the yield prediction model.
Agriculture 14 01317 g002
The R2, root mean square error (RMSE), and relative root mean squared error (RRMSE) were used to evaluate training and testing performance (Equations (2)–(4)):
R 2 = i = 1 n ( x i x ¯ ) 2 ( y i y ¯ ) 2 i = 1 n ( x i x ¯ ) 2 i = 1 n ( y i y ¯ ) 2
R M S E = 1 N i = 1 N ( y i y ^ ) 2
R R M S E = 1 N i = 1 N ( y i y ^ ) 2 i = 1 N ( y i ) 2 × 100 %
where x and y are the measured and predicted values, respectively; and x ¯ and y ¯ are the average values of measured and predicted yield, respectively. N is the number of observations.
We conducted a Pearson correlation analysis and PCA using IBM SPSS Statistics 25.0 (SPSS Inc., New York, NY, USA, 2017). The correlation, scatter, fitted line, and PCA plot were drawn by Origin 2022 (Origin Lab Corporation, Northampton, MA, USA, 2022). The machine learning algorithms were run in MATLAB R2022a (The MathWorks, Inc., Natick, MA, USA, 2022).

3. Results

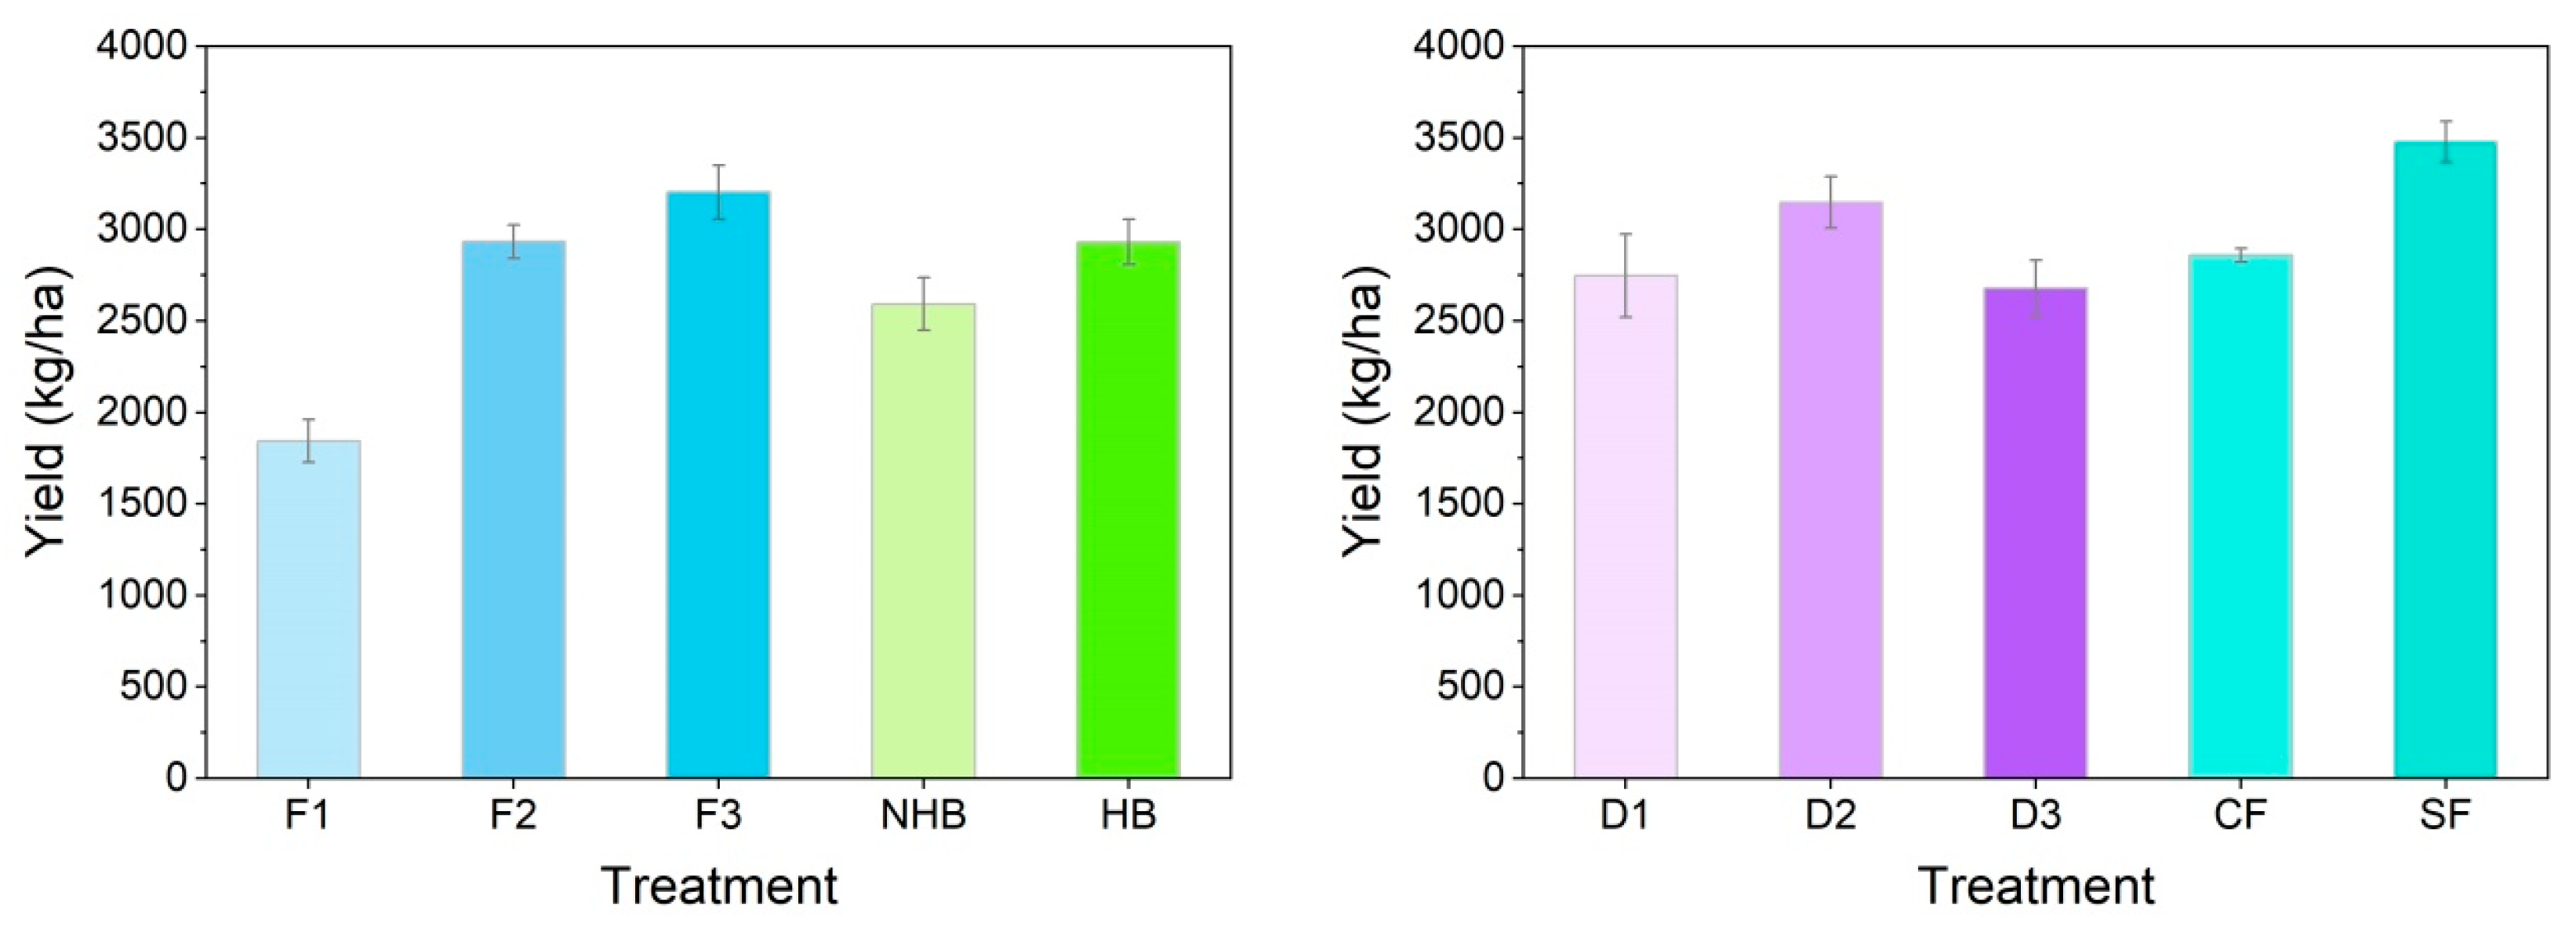
3.1. Oilseed Rape Yield

The yield of oilseed rape plants following various treatments is shown in Figure 3. It can be seen that oilseed rape yield increased from F1 to F3, and the yield with F3 was the highest (3302.5 kg/ha). Regarding herbicide treatments, the yield with HB was 2930.04 kg/ha; this was higher than that seen with NHB treatment. The yield for the density of 4.5 × 10⁵ seedlings/ha (D2) was the highest among the density treatments. The average yield across all treatments was 2757.2 kg/ha; the minimum and maximum yields were 1071.96 and 4152.08 kg/ha, respectively.

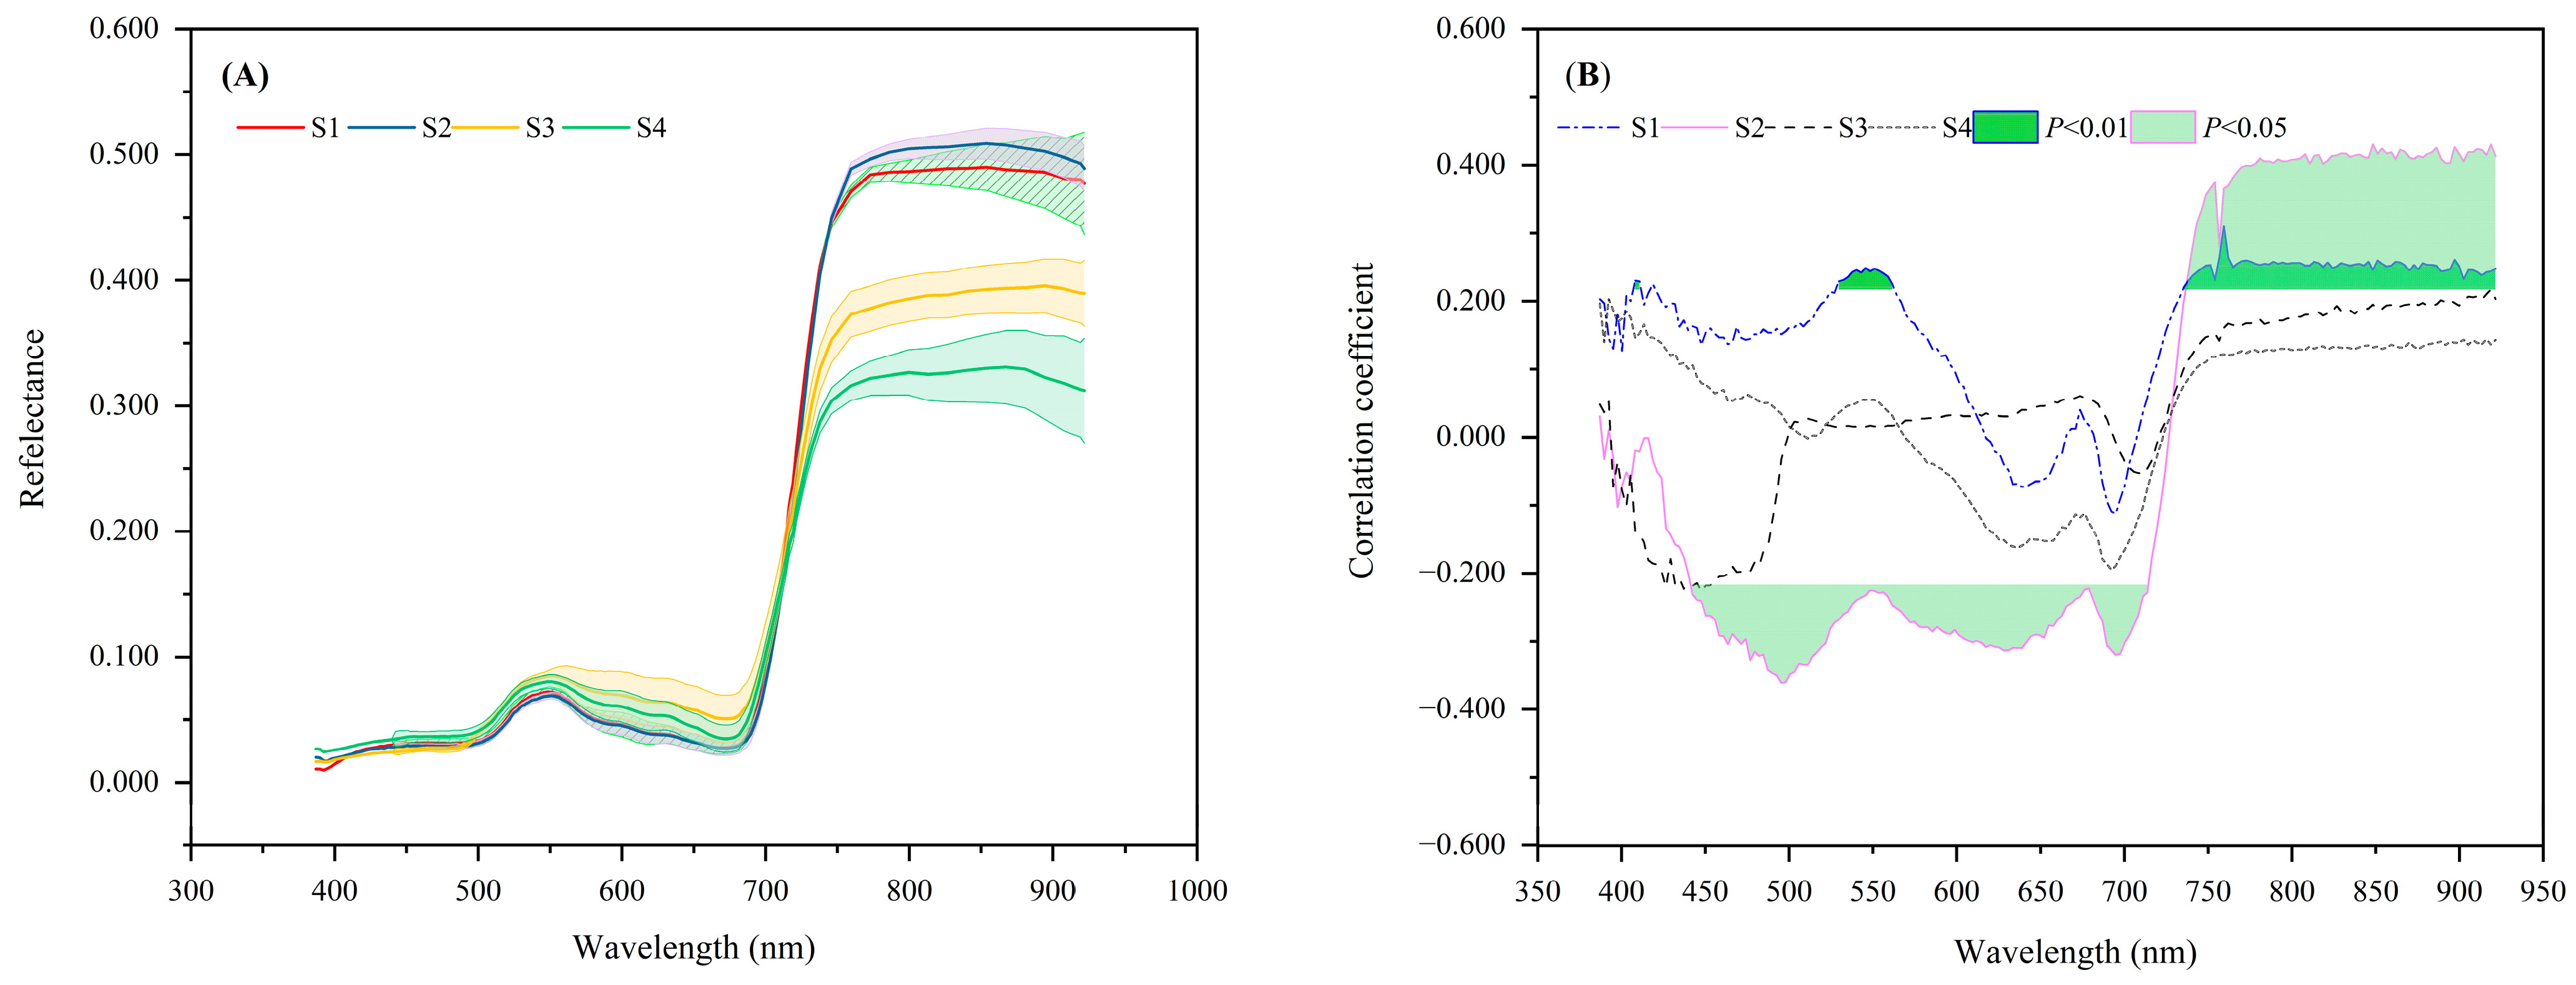
3.2. Reflectance of Oilseed Rape Plants

The reflectance of oilseed rape plants at various growth stages is shown in Figure 4. There are obvious reflectance differences in visible and near-infrared wavelength across the S1, S2, S3, and S4 stages (Figure 4A). We note that the reflectance in the NIR wavelength was the highest in the S2 stage and the lowest in the S4 stage. Hence, reflectance in the NIR wavelength may be used to differentiate the growth stages of oilseed rape.
The relation between reflectance and oilseed rape yield is shown in Figure 4B. The reflectance from 442 to 713 nm at the S2 stage and from 737 to 921 nm at the S1 stage had a significant relationship (p < 0.05) with oilseed rape yield. Meanwhile, reflectance from 529 to 561 nm in the S1 stage and from 529 to 561 nm in the S2 stage had a greatly significant relationship (p < 0.01) with oilseed rape yield. This indicates that S2 has a greater effect on oilseed rape in comparison with the S1, S3, and S4 stages. Compared with the visible region, the NIR region was more sensitive, and NIR reflectance had a closer relationship with the yield. Therefore, R860 in NIR region was selected as another input variable for yield modeling.

3.3. VIs of Oilseed Rape Plants
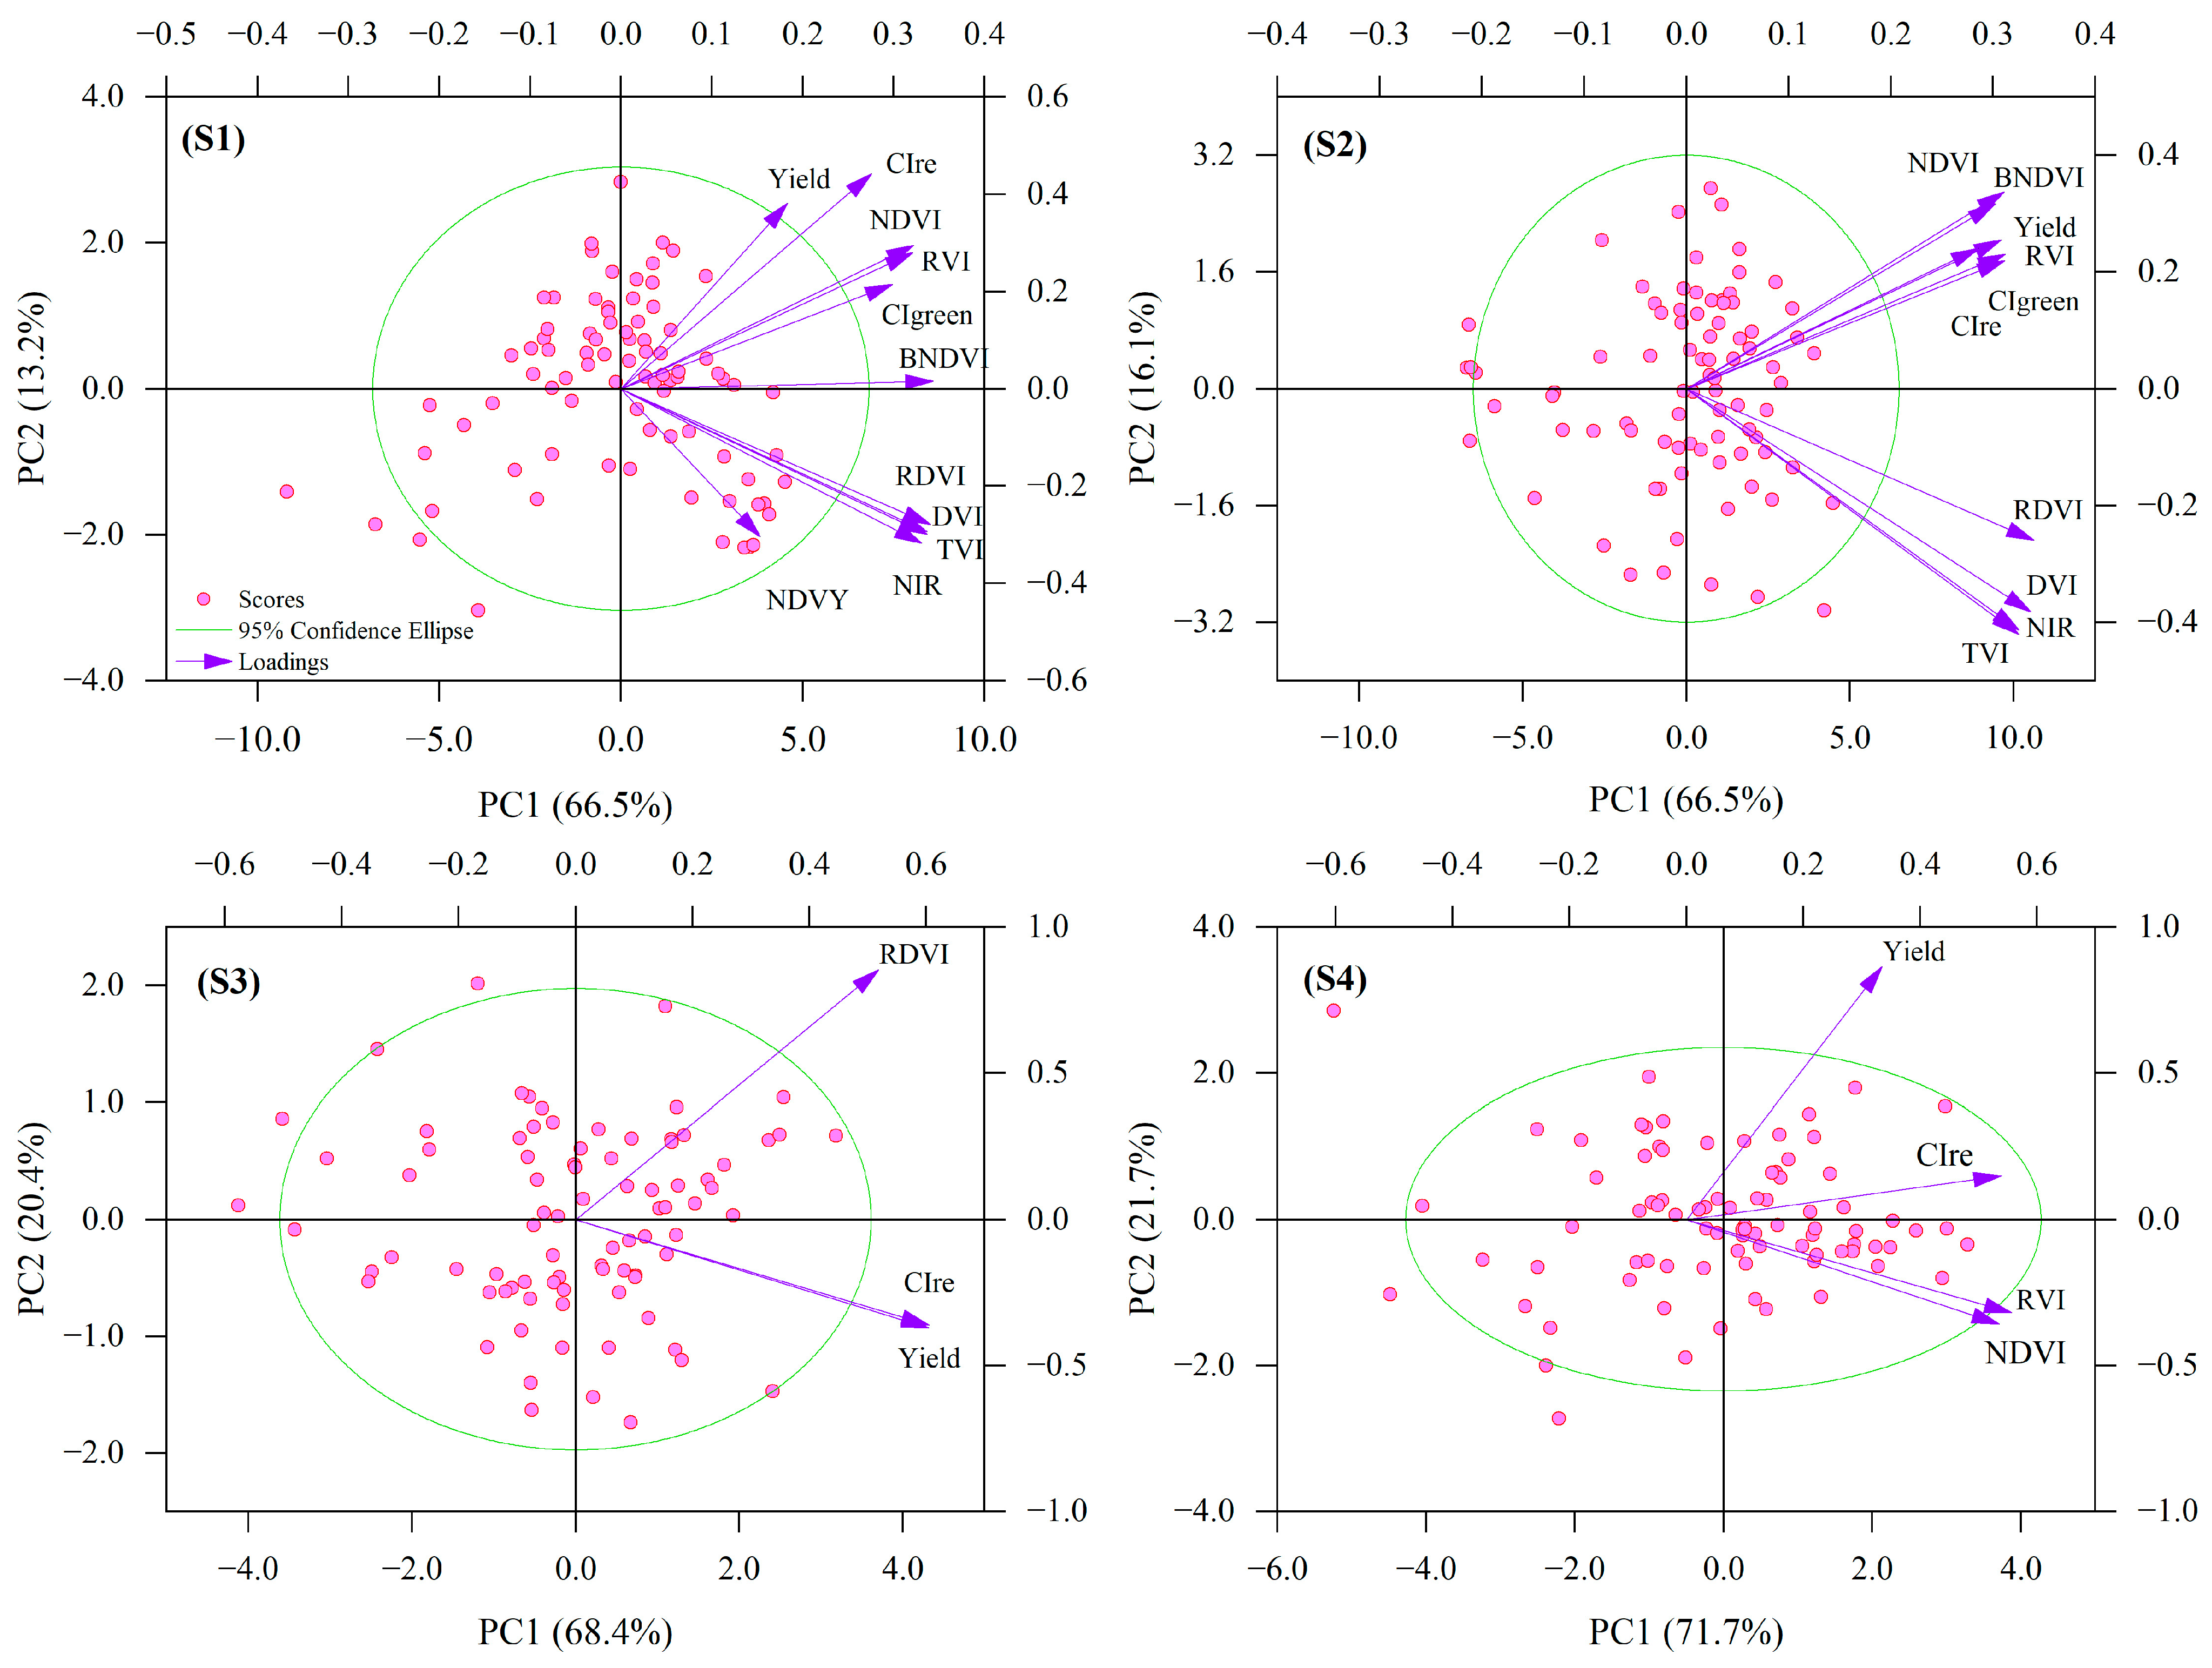
We performed a correlation analysis to evaluate the relationships between VIs and oilseed rape yield. This analysis may be helpful to ultimately determine the variables that should be used as the inputs in yield prediction models. The results are shown in Figure 5. It can be seen that all VIs at S1; all VIs except NDVY at S2; CIre and RDVI at S3; and NDVI, CIre, and RVI at S4 had significant relationships with oilseed rape yield. NDVI and BNDVI at S2 had the highest correlation coefficients: 0.896 and 0.856, respectively. S1 and S2 had more VIs with a closer relationship to oilseed rape yield than other growth stages.

3.4. PCA of VIs

As seen from Figure 5, a large number of VIs had a significant relationship with oilseed rape yield. VIs also had significant correlations among themselves (Figure 5). The use of highly correlated variables as inputs in prediction models may cause multicollinearity problems. Meanwhile, too many data make the analysis difficult. To overcome these problems, we can reduce the number of VIs. PCA of VIs which had a very significant relationship with yield was performed. The PCA result is shown in Figure 6. VIs which were in the same quadrant with yield and the first two most closely related to yield were selected and considered as the oilseed rape yield model input variables. So, we can see that NDVI and CIre at S1, RVI and CIgreen at S2, CIre at S3, and CIre at S4 were ultimately selected.

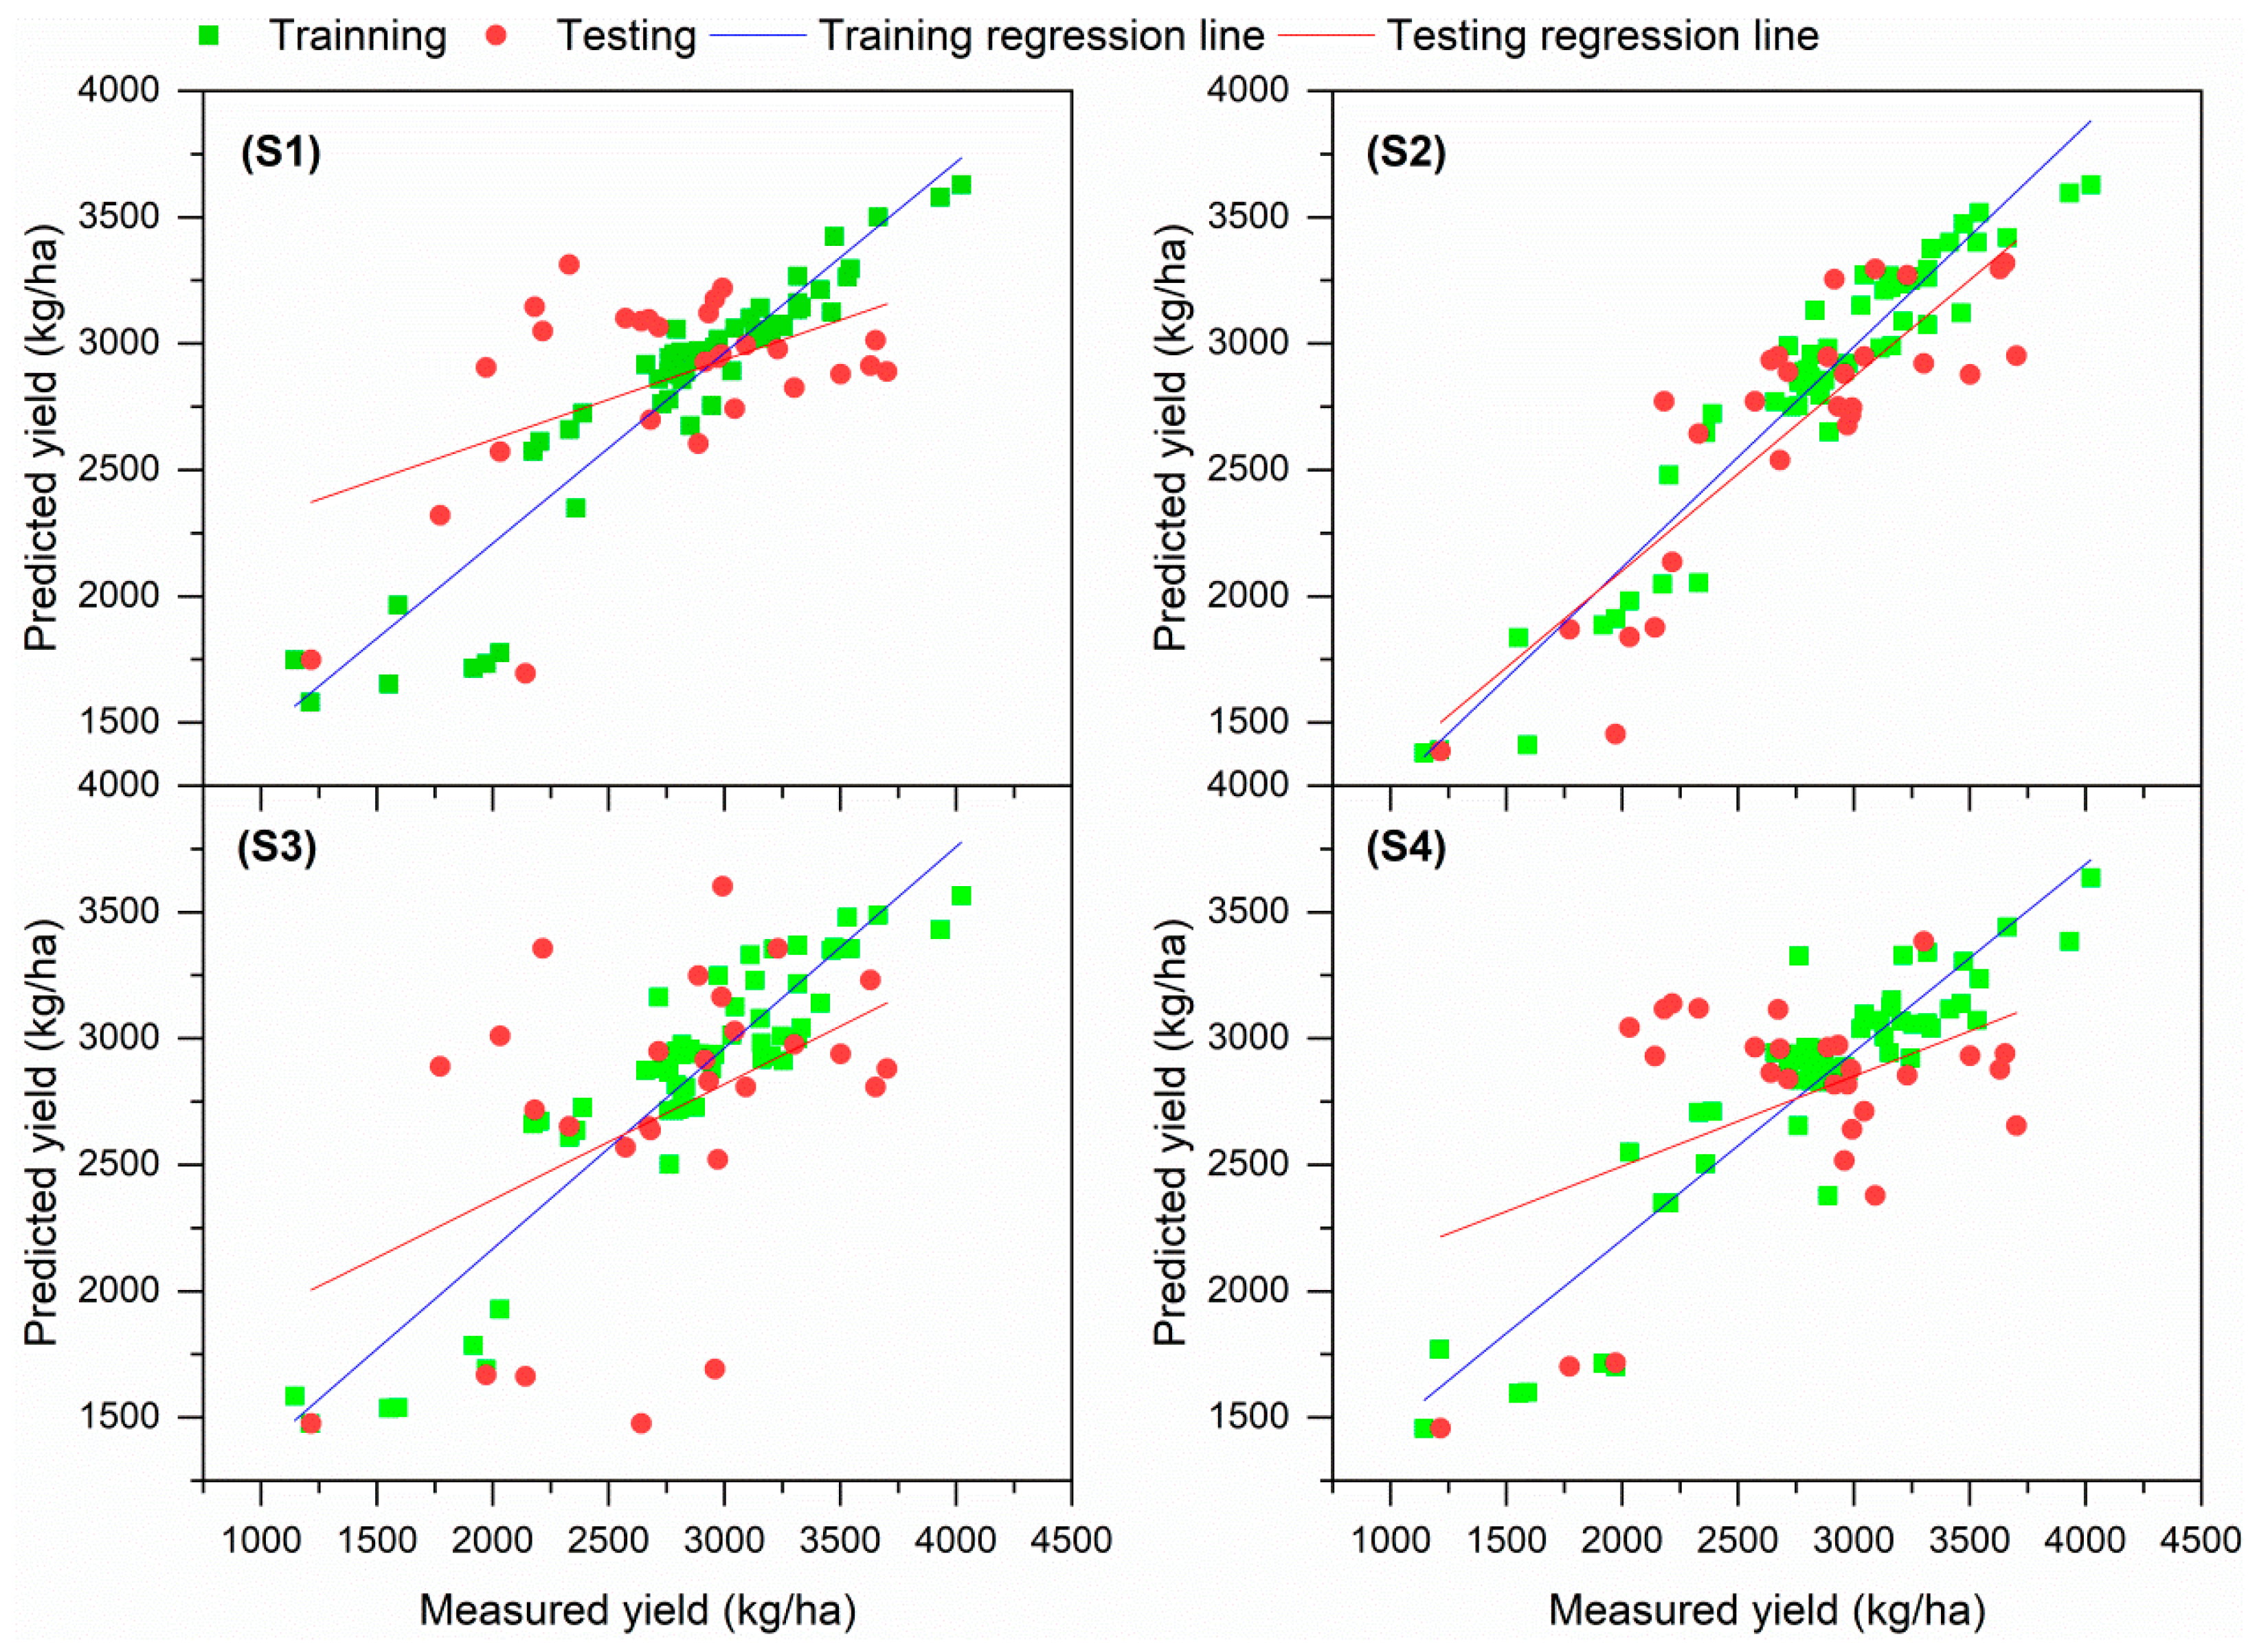
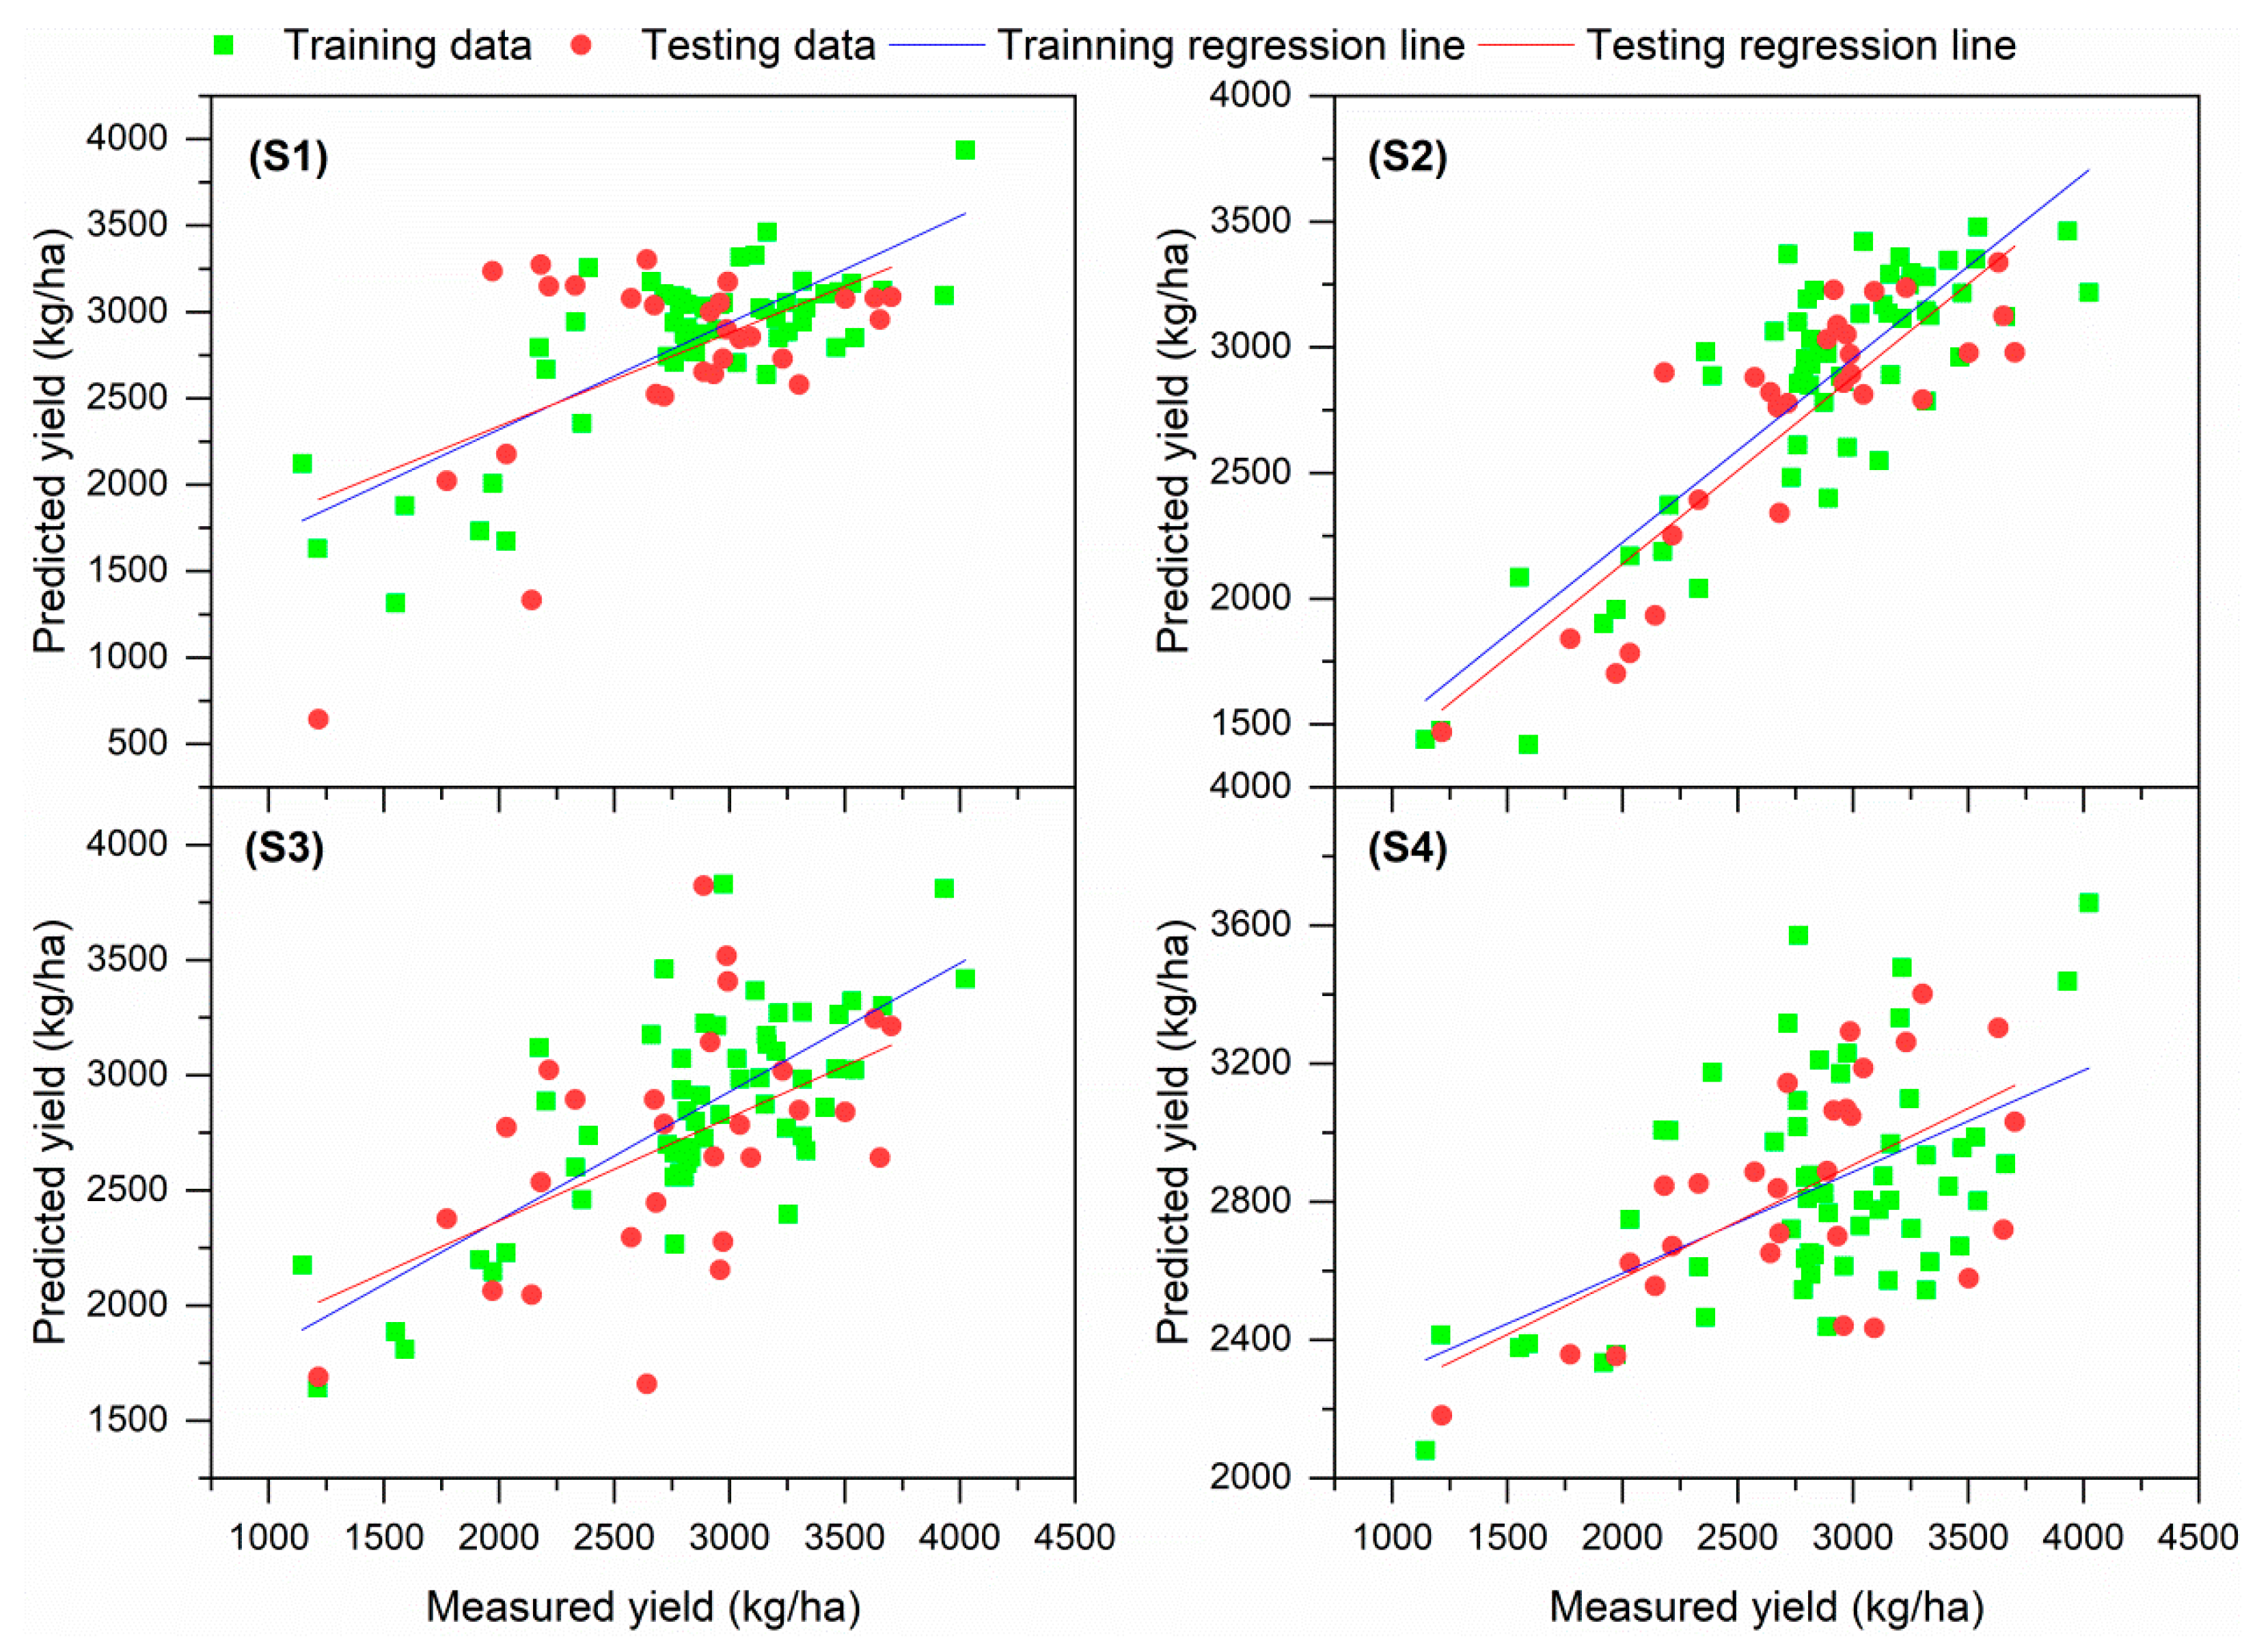
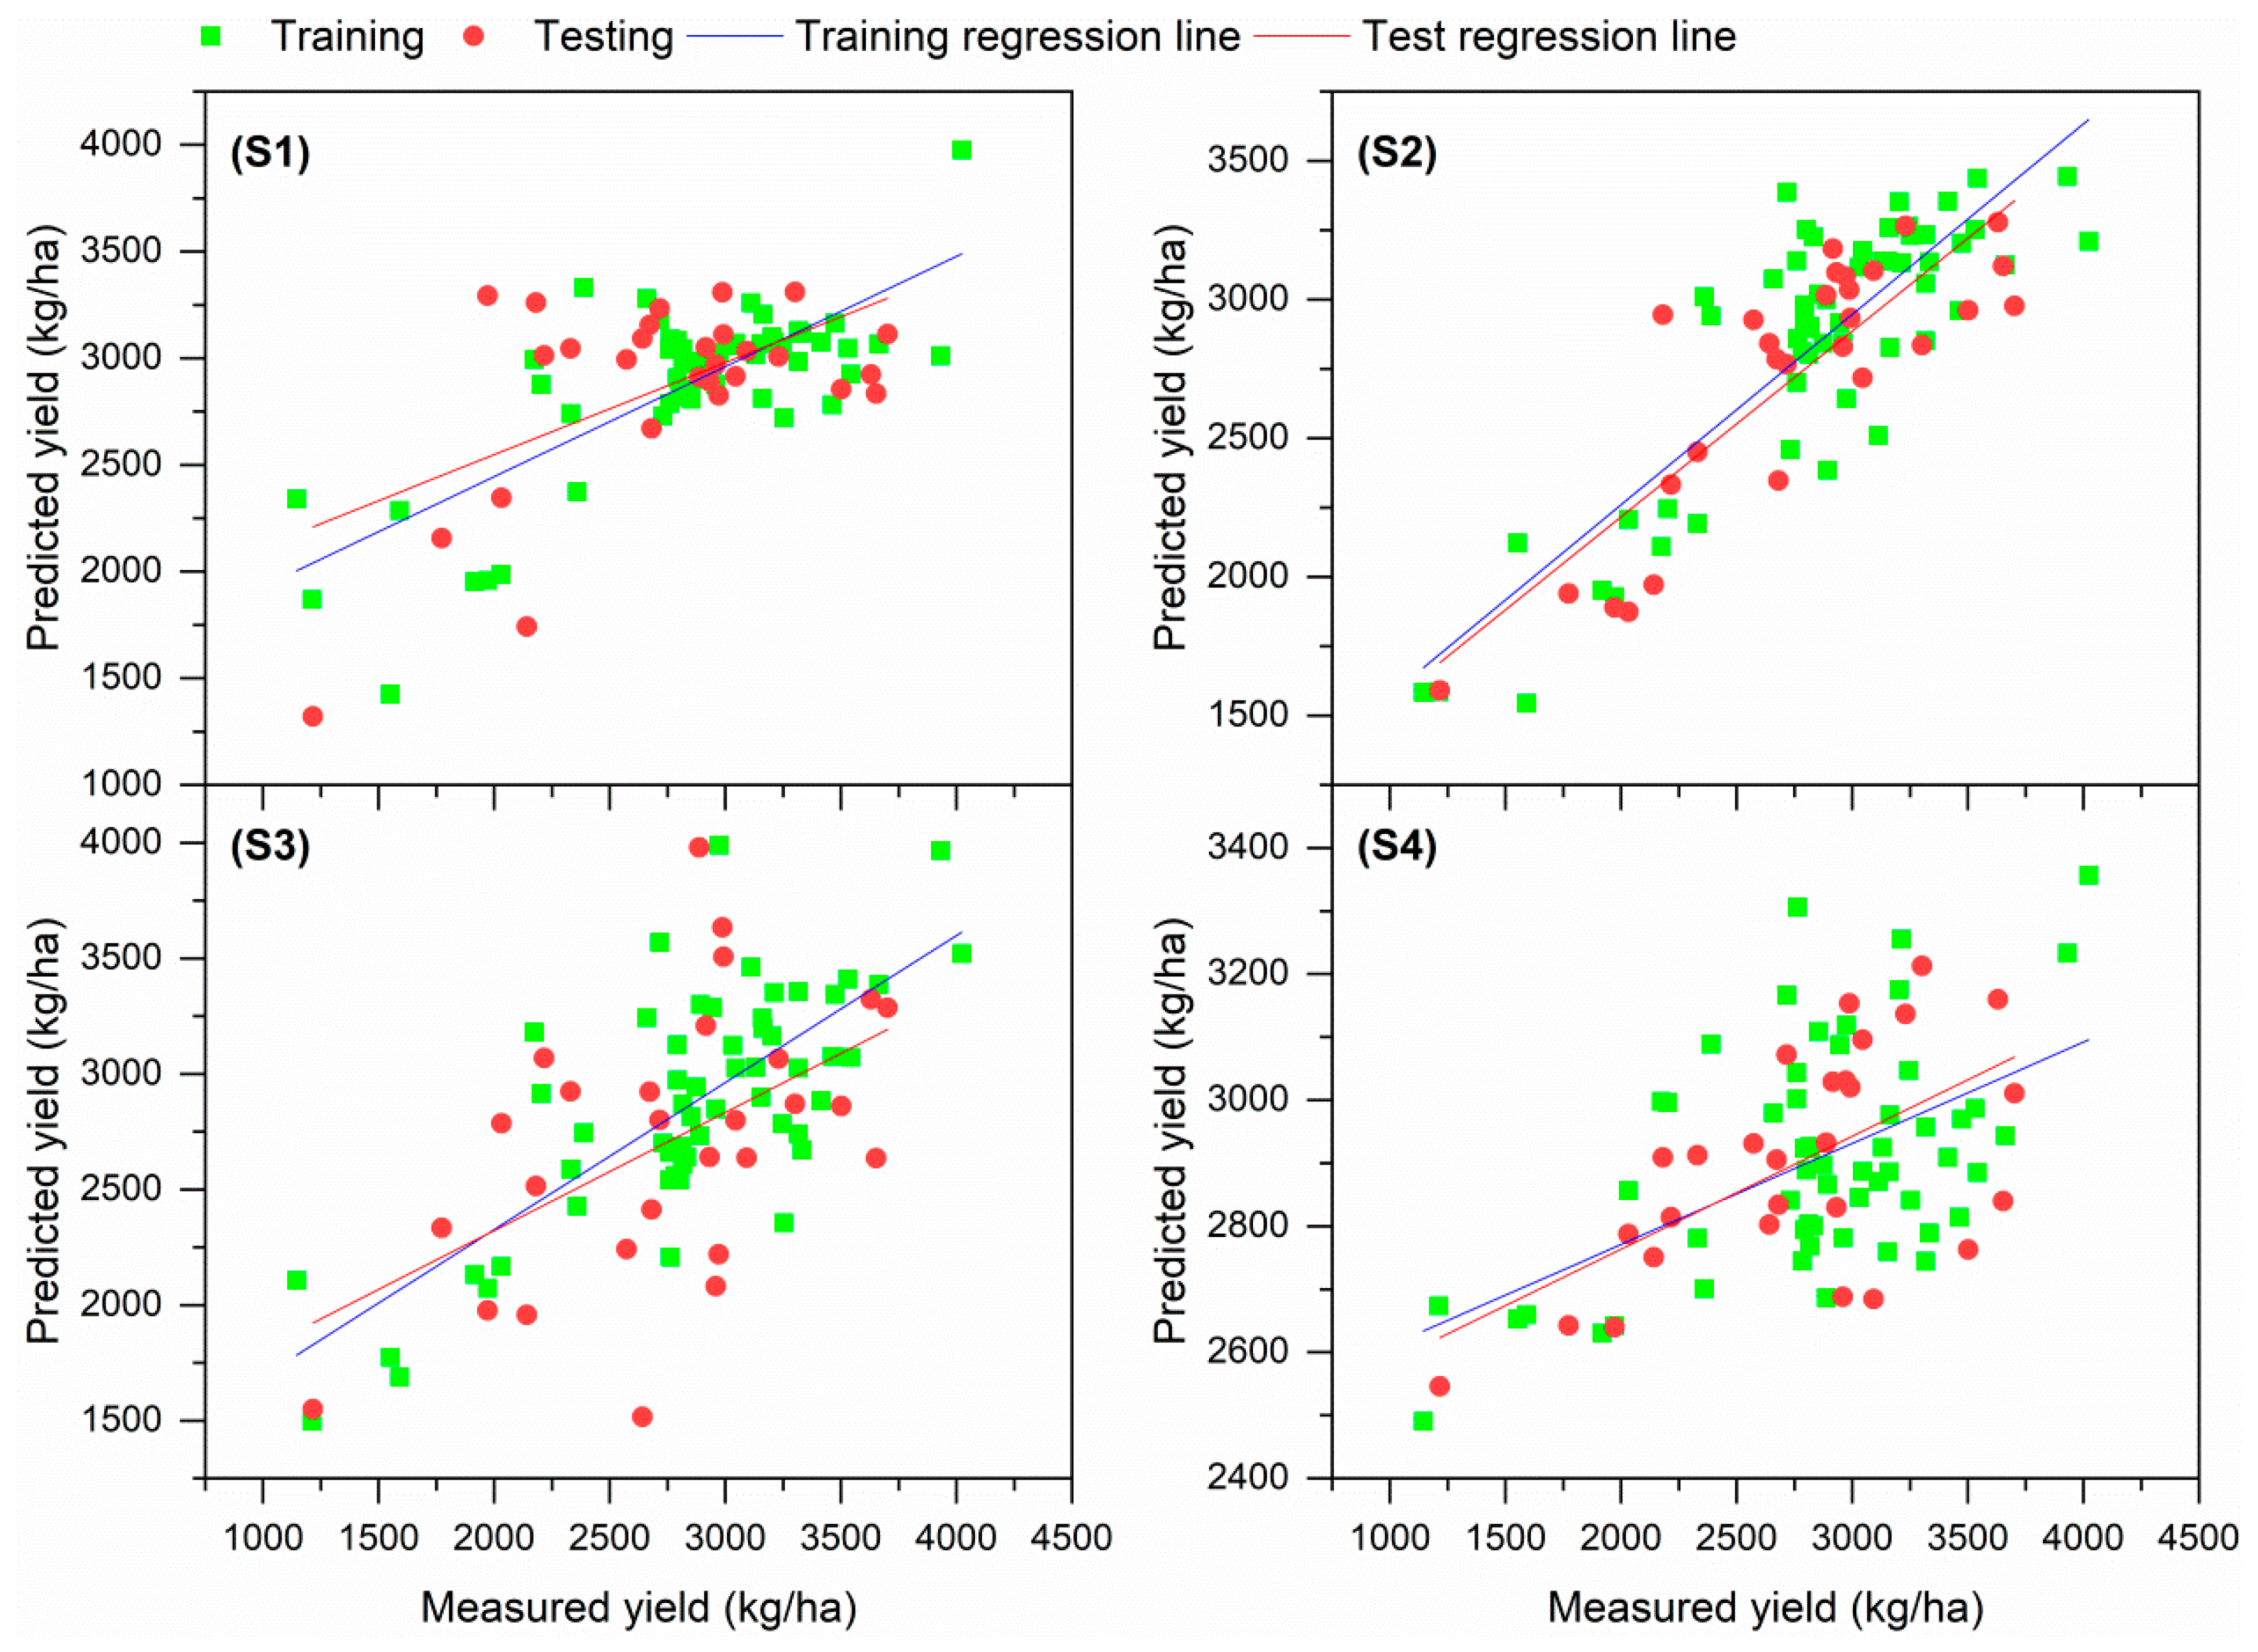
3.5. Performance of Oilseed Rape Yield Prediction Model

The aforementioned selected VIs were used as the input variables to build oilseed rape yield models based on the RF, MLR, and SVM. For one stage, more than one model may be established because there may be more than one input variable and combinations. Hence, the models with the best R2 were selected (see Figure 7, Figure 8 and Figure 9 and Table 3). During model training, the RF model had the highest R2 (0.925) and lowest RMSE and RRMSE (167.8 kg/ha and 5.91%, respectively) across growth stages. For testing, the MLR model had the highest R2 (0.732) and lowest RMSE and RRMSE (309.5 kg/ha and 11.26%, respectively). The RF models performed second and third best. Regarding the various oilseed rape growth stages, S2 had the highest R2 and lowest RMSE and RRMSE across both model training and testing.
Table 3. Performance of models utilizing various machine learning methods.
StageModelTraining PerformanceTesting Performance
RMSE (kg/ha)RRMSE (%)R2RMSE (kg/ha)RRMSE (%)R2
S1RF214.97.570.893531.319.340.243
MLR370.713.050.618559.620.370.297
SVM398.214.020.568518.518.870.314
S2RF167.85.910.925319.711.640.723
MLR309.710.900.733309.511.260.732
SVM316.911.150.722318.211.580.714
S3RF227.78.020.861601.321.880.220
MLR398.614.030.558546.619.890.268
SVM404.0.14.220.558577.021.000.268
S4RF247.48.710.842543.019.760.227
MLR503.817.740.293477.017.360.367
SVM529.018.620.293525.419.120.367

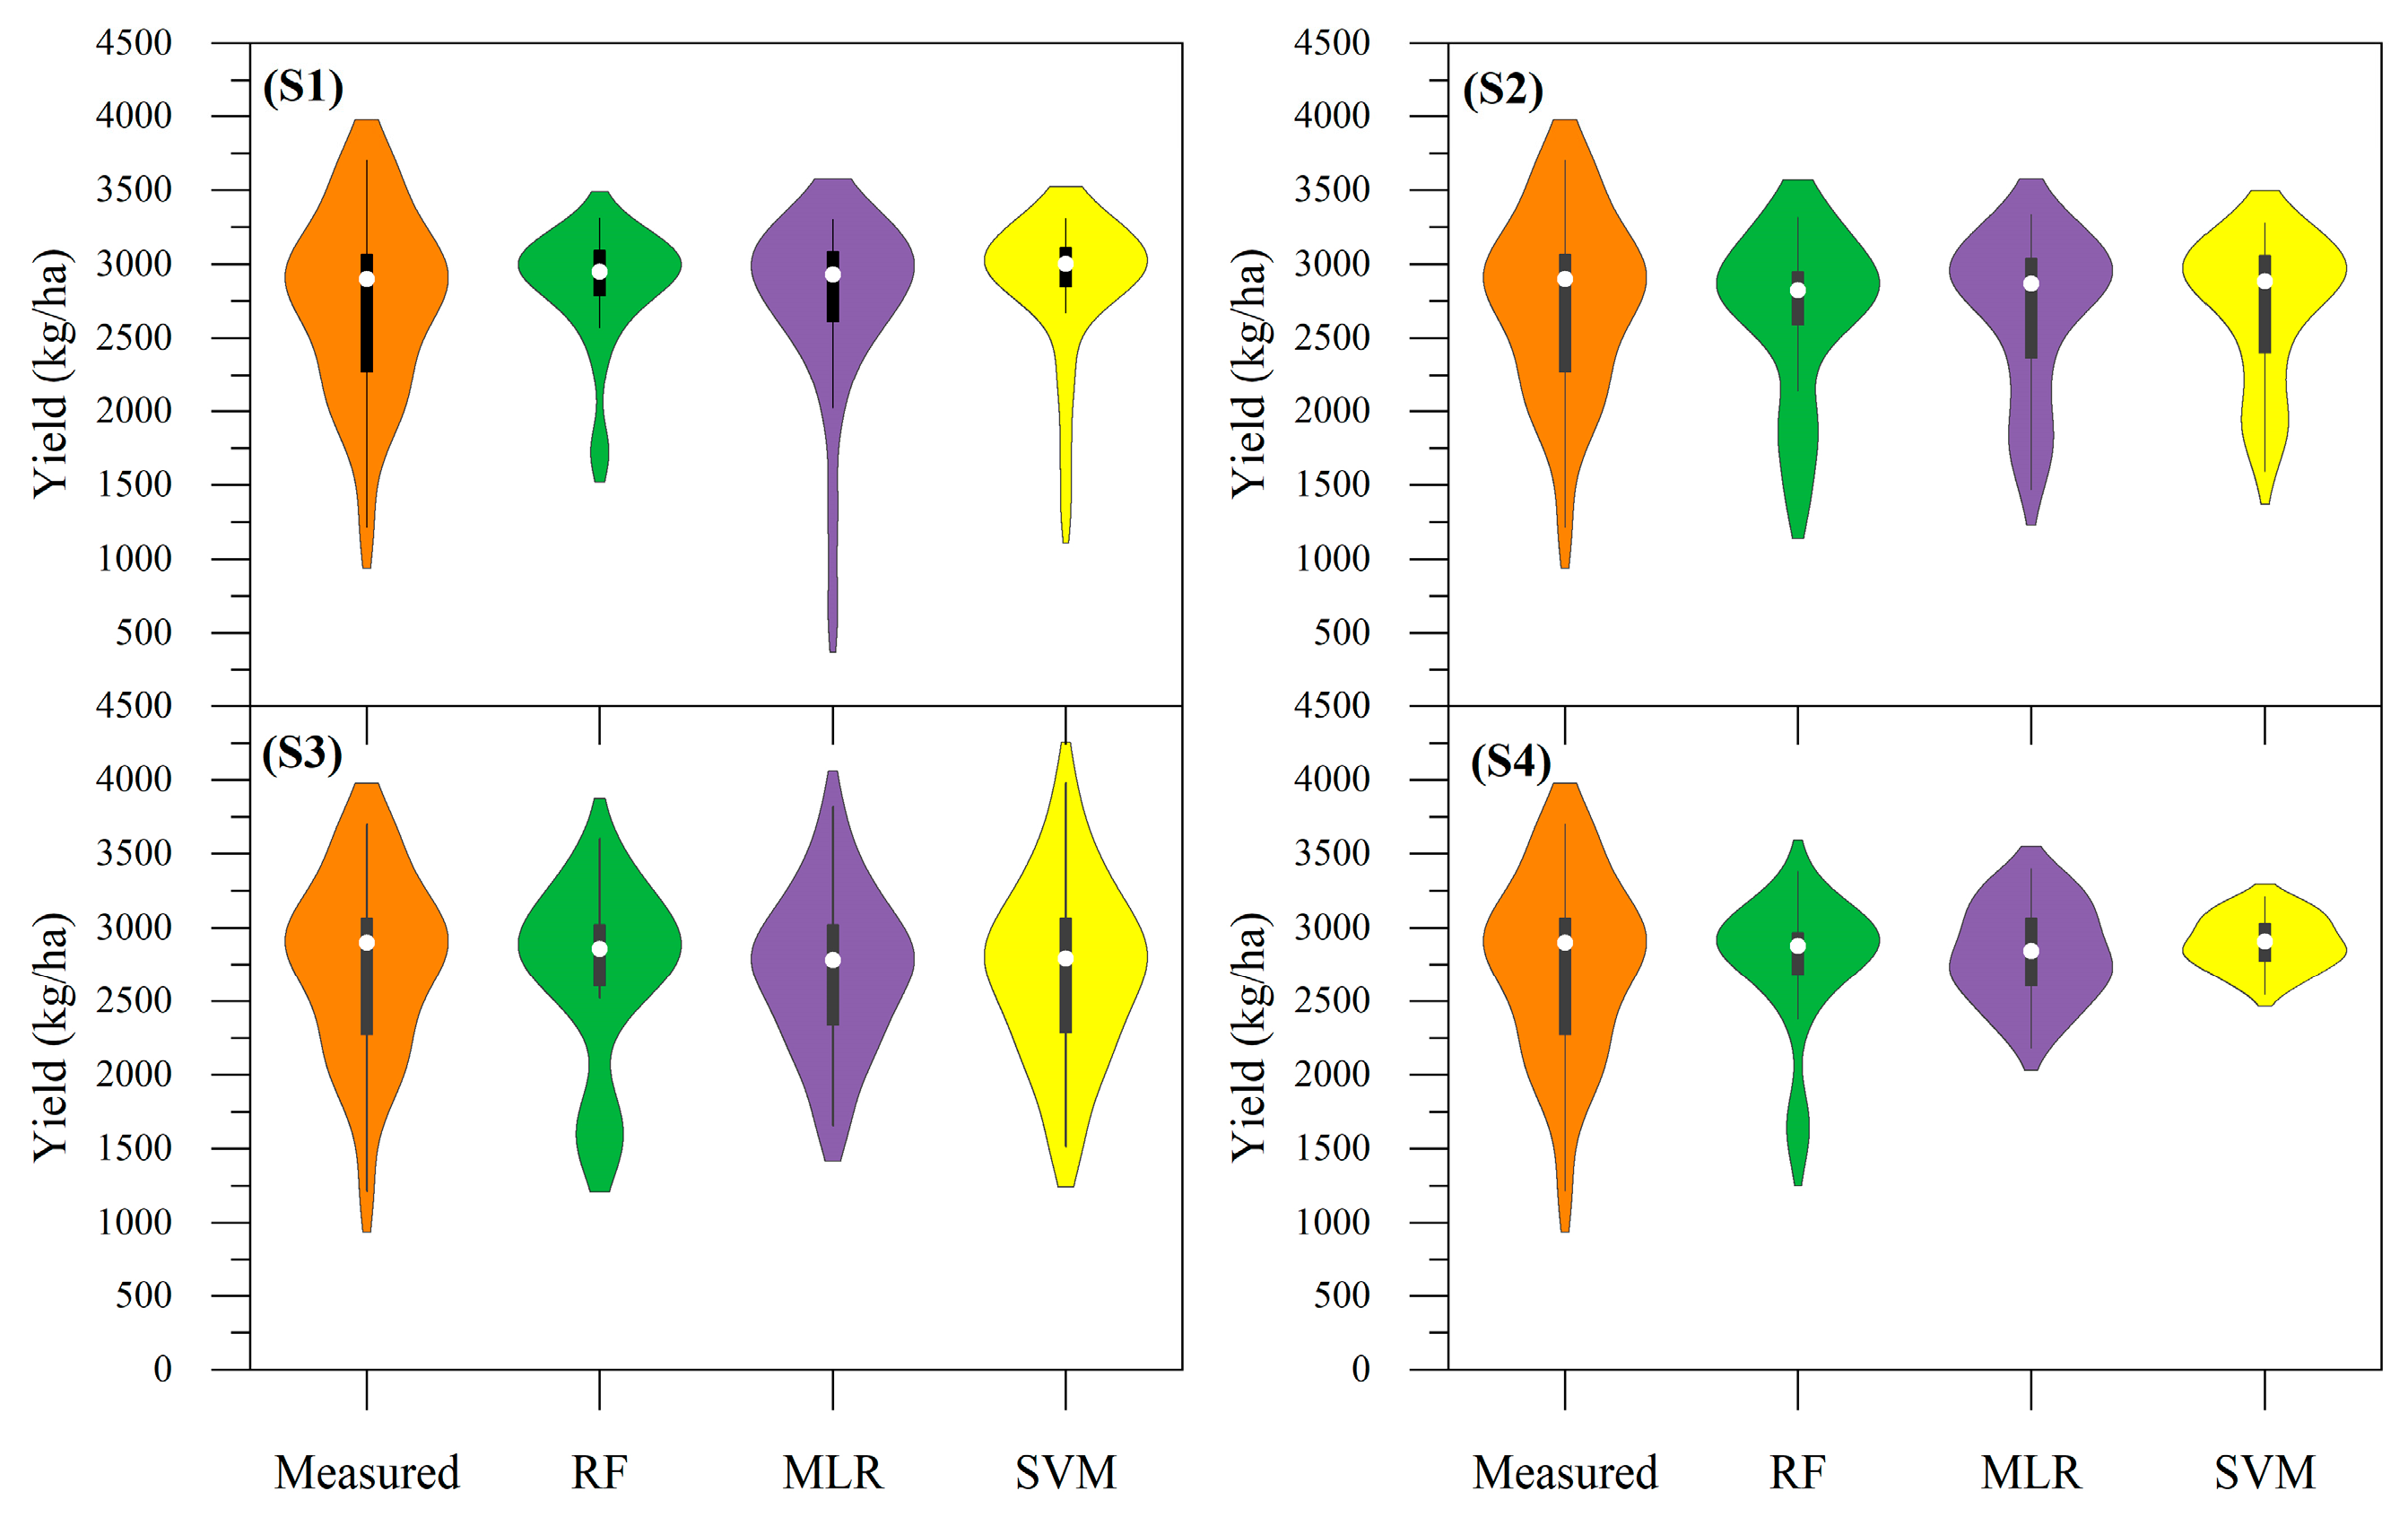
3.6. Comparisons of Predicted and Measured Yield

We compared the yield predicted through machine learning and the measured values, and the results are shown in Figure 10 and Table 4. The violin plots show that the median value of the predicted yield was near the measured value across all four stages. Except for MLR and SVM for S3, the maximum yield predicted across stages was smaller than the measured yield. Moreover, except for MLR for S1, all minimum yield values predicted through machine learning were higher than the measured values across all stages. In addition, except for MLR for S1, the yield range of values predicted through machine learning were smaller than the manually measured treatment. Finally, the skewness and kurtosis (i.e., absolute value) of values predicted through machine learning were higher than those of the measured values.

4. Discussion

In recent years, UAVs, as a near-ground-based platform to collect crop data, have been widely used in agriculture management. UAV-derived imagery data are geometrically registered, and they may have multiple sensors such as those used to collect spectral, thermal, radar, and fluorescence information. Previous studies proved that crop yield can be well predicted with UAV-collected data [36,37]. In this study, a hyperspectral imagery system was mounted on a UAV, and VIs were used to predict oilseed rape yield. R2 of model training and testing reached 0.925 and 0.768, respectively. This suggests that UAVs may have a great ability to predict crop yield on a large scale.
VIs, including NDVI, are often used for predicting crop yield. Some studies indicated that NDVI had a significant relationship with yield and that crop yield could be predicted using NDVI [13,38,39]. A similar result was seen in our study. In our experiment, the correlation coefficient between NDVI and oilseed rape yield was 0.896 at S2. However, Lukas et al. [40] reported that the R2 of NDVI-based oilseed rape yield was very low (only up to 0.40). In our study, NDVI was not selected as a model input variable because it had a lower correlation with oilseed rape yield than RVI and CIgreen in PCA. Other VIs may be better than NDVI in oilseed rape yield prediction models. In 2022, Lukas et al. found that R2 of BNDVI and NDYI for oilseed rape yield reached 0.95 and 0.90, respectively. In our study, R2 of RVI+CIgreen with an RF-based oilseed rape yield model reached 0.925. This suggests that RVI+CIgreen has great potential for predicting crop yield.
We selected RVI, CIgreen, CIre, and their combinations as model input variables. The models during training had good performance (i.e., high R2 and low RMSE and RRMSE). However, the testing performance was not excellent. The reason for this may be that VI data in actual field conditions are often disturbed by background noise, image shadows, and other factors. Some researchers reported that VIs combined with crop height, leaf area index, and morphological and physiological data can improve the yield model accuracy [41,42,43,44]. Which VIs and what combinations with other data should be used to help build a better yield model need to be further investigated.
Generally, hyperspectral imagery with rich spatial and spectral information can comprise hundreds of VIs or more. These VIs may have auto-collinearity problems. This makes subsequent data analysis complex and difficult. Feature screening to reduce the number of data and increase data quality is necessary for building models. To accomplish this, we employed Pearson correlations and PCA, and we obtained three features (VIs) to keep in our models. Feature screening methods have also been used by Taşan et al. [27] for predicting eggplant yield. Other data dimensionality reduction methods have been employed by many authors [44,45,46]. Appropriate feature selection methods for predicting crop yield models require future research.
Machine learning has been widely employed in agriculture management in recent years. The RF, MLR, and SVM are the main bases for model construction. Their suitability in predicting oilseed rape yield was demonstrated in the present work. We found that, during training, the RF-based model had the highest R2 and lowest RMSE and RRMSE across all four stages: 0.925, 167.8 kg/ha, and 5.91%, respectively. A similar result was obtained in a study estimating pasture aboveground biomass by Freitas et al. [46]. During testing, the MLR-based model had the best performance, with its R2, RMSE, and RRMSE at 0.732, 309.5 kg/ha, and 11.26%, respectively. The RF-based models were more successful than other models in analyzing the complex relationships between oilseed rape yield and spectral indices. We also note that the SVR model had the lowest performance among the four investigated models.
We investigated oilseed rape growth from S1 to S4 for yield prediction. The S2 stage was determined as the best growth stage to predict yield. The earlier (S1) and latter stages (S3 and S4) may be unhelpful for predicting yield. However, we note that S2 is a growth stage and not a specific time point. Obtaining the best date for predicting yield with the best accuracy needs further study.
The data collection and model application need to follow certain standards. Our data include UAV-based imagery and ground-based measurements alongside various modeling approaches. Our data may thus encounter errors from uncontrollable factors. Therefore, standardized, unified, clear, and controlled procedures must be carefully developed and integrated into an intelligent and automated system. Uncertainty, transferability, and further application of the developed models should be assessed in future work.
There are some limitations to our research. First, we hypothesized that oilseed rape yield was determined only by spectral information. Crop yield prediction can be explained in part by spectral information. This may be the reason that our testing model had relatively weak performance. Second, in our study, spectral reflectance was extracted by averaging all the pixel reflectance of the sampling area without considering each pixel in the spectral image. Calculating the reflectance pixel by pixel may be a better approach [47]. Finally, our research result was based on a one-year field experiment. Two or more years of experiments may help in building a stable and universal yield prediction model.

5. Conclusions

In recent years, studies on the prediction of crop yield at various growth stages using spectral VIs captured by UAVs and machine learning methods have been scarce. Therefore, the current research investigated the impact of growth stage on the performance of oilseed rape yield models, compared the efficacy of four distinct machine learning techniques, and analyzed the influence of different input strategies on model performance.
The key findings of this investigation are as follows: (1) oilseed rape yield can be accurately predicted using spectral VIs obtained from UAVs and machine learning methods, achieving an excellent model performance, with an R2 value of 0.925 and an RRMSE of 5.91%. (2) Among the four studied growth stages, the budding stage (S2) is the most optimal stage for predicting oilseed rape yield. (3) Among the four machine learning algorithms, random forest emerged as the most effective method for predicting oilseed rape yield. (4) The combination of RVI and CIgreen served as the optimal input VIs for the oilseed rape yield model.
Looking ahead to the practical application of this yield model, several critical challenges remain to be addressed. Notably, the accurate identification of specific days and time points, rather than a broad growth stage, for accurate yield prediction demands further investigation. Additionally, rigorous evaluations of the uncertainty, transferability, and wider applicability of the developed yield models are imperative. In summary, the integration of spectral sensors with UAVs presents immense potential for large-scale crop yield forecasting. Moreover, machine learning approaches, particularly RF, significantly enhance the accuracy of yield models, surpassing traditional methods such as MLR. This study contributes a relatively precise prediction model for crop yield, offering profound insights that can drive advancements in field crop management practices.

Author Contributions

Writing—original draft, validation, methodology, formal analysis, data curation, H.H.; validation, methodology, formal analysis, Y.R.; validation, formal analysis, H.Z.; data curation, W.L.; methodology, P.H.; validation, methodology, B.L. and Q.G.; formal analysis, G.Z.; data curation, writing—review and editing, supervision, software, resources, project administration, funding acquisition, conceptualization, S.H. All authors have read and agreed to the published version of the manuscript.

Funding

This work was financially supported by China Agriculture Research System (CARS12) and the Three Agriculture and Nine Unit Projects of Zhejiang Province, China (2023SNJF005).

Institutional Review Board Statement

Not applicable.

Data Availability Statement

The original contributions presented in the study are included in the article; further inquiries can be addressed to the corresponding author.

Acknowledgments

We would like to thank the editors and reviewers for their professional advice on this manuscript.

Conflicts of Interest

The authors declare no conflicts of interest.

References

  1. Clark, R.; Dahlhaus, P.; Robinson, N.; Larkins, J.-A.; Morse-McNabb, E. Matching the model to the available data to predict wheat, barley, or canola yield: A review of recently published models and data. Agric. Sys. 2023, 211, 103749. [Google Scholar] [CrossRef]
  2. Habibi, L.N.; Matsui, T.; Tanaka, T.S.T. Critical evaluation of the effects of a cross-validation strategy and machine learning optimization on the prediction accuracy and transferability of a soybean yield prediction model using UAV-based remote sensing. J. Agric. Food Res. 2024, 16, 101096. [Google Scholar] [CrossRef]
  3. Luo, L.; Sun, S.; Xue, J.; Gao, Z.; Zhao, J.; Yin, Y.; Gao, F.; Luan, X. Crop yield estimation based on assimilation of crop models and remote sensing data: A systematic evaluation. Agric. Sys. 2023, 210, 103711. [Google Scholar] [CrossRef]
  4. Pantazi, X.E.; Moshou, D.; Alexandridis, T.; Whetton, R.L.; Mouazen, A.M. Wheat yield prediction using machine learning and advanced sensing techniques. Comput. Electron. Agric. 2016, 121, 57–65. [Google Scholar] [CrossRef]
  5. Ren, S.; Chen, H.; Hou, J.; Zhao, P.; Dong, Q.G.; Feng, H. Based on historical weather data to predict summer field-scale maize yield: Assimilation of remote sensing data to WOFOST model by ensemble Kalman filter algorithm. Comput. Electron. Agric. 2024, 219, 108822. [Google Scholar] [CrossRef]
  6. Cheema, M.J.M.; Bakhsh, A.; Mahmood, T.; Liaqat, M.U. Assessment of water allocations using remote sensing and GIS modeling for Indus Basin, Pakistan. In Proceedings of the PSSP Working Paper, Washington, DC, USA, 19 February 2016; pp. 1–42. [Google Scholar]
  7. Rhebergen, T.; Yeates, S.J. Climate and soil-based constraints to rainfed cotton yield in the Northern Territory, Australia—A modelling approach using APSIM-OZCOT. Eur. J. Agron. 2023, 151, 126998. [Google Scholar] [CrossRef]
  8. Nakano, H.; Tanaka, R.; Guan, S.; Ohdan, H. Predicting rice grain yield using normalized difference vegetation index from UAV and GreenSeeker. Crop Environ. 2023, 2, 59–65. [Google Scholar] [CrossRef]
  9. Xiong, X.; Zhong, R.; Tian, Q.; Huang, J.; Zhu, L.; Yang, Y.; Lin, T. Daily DeepCropNet: A hierarchical deep learning approach with daily time series of vegetation indices and climatic variables for corn yield estimation. ISPRS J. Photogramm. Remote Sens. 2024, 209, 249–264. [Google Scholar] [CrossRef]
  10. Fernandes, J.L.; Ebecken, N.F.F.; Esquerdo, J.C.D.M. Sugarcane yield prediction in Brazil using NDVI time series and neural networks ensemble. Int. J. Remote Sens. 2017, 38, 4631–4644. [Google Scholar] [CrossRef]
  11. Sulik, J.J.; Long, D.S. Spectral considerations for modeling yield of canola. Remote Sens. Environ. 2016, 184, 161–174. [Google Scholar] [CrossRef]
  12. Wang, Z.; Chen, J.; Zhang, J.; Fan, Y.; Cheng, Y.; Wang, B.; Wu, X.; Tan, X.; Tan, T.; Li, S.; et al. Predicting grain yield and protein content using canopy reflectance in maize grown under different water and nitrogen levels. Field Crops Res. 2021, 260, 107988. [Google Scholar] [CrossRef]
  13. Panek, E.; Gozdowski, D. Analysis of relationship between cereal yield and NDVI for selected regions of Central Europe based on MODIS satellite data. Remote Sens. Appl. Soc. Environ. 2020, 17, 100286. [Google Scholar] [CrossRef]
  14. Chlingaryan, A.; Sukkarieh, S.; Whelan, B. Machine learning approaches for crop yield prediction and nitrogen status estimation in precision agriculture: A review. Comput. Electron. Agric. 2018, 151, 61–69. [Google Scholar] [CrossRef]
  15. Kayad, A.; Rodrigues, F.A., Jr.; Naranjo, S.; Sozzi, M.; Pirotti, F.; Marinello, F.; Schulthess, U.; Defourny, P.; Gerard, B.; Weiss, M. Radiative transfer model inversion using high-resolution hyperspectral airborne imagery—Retrieving maize LAI to access biomass and grain yield. Field Crops Res. 2022, 282, 108449. [Google Scholar] [CrossRef] [PubMed]
  16. Kaul, M.; Hill, R.L.; Walthall, C. Artificial neural networks for corn and soybean yield prediction. Agric. Sys. 2005, 85, 1–18. [Google Scholar] [CrossRef]
  17. Kamir, E.; Waldner, F.; Hochman, Z. Estimating wheat yields in Australia using climate records, satellite image time series and machine learning methods. ISPRS J. Photogramm. Remote Sens. 2020, 160, 124–135. [Google Scholar] [CrossRef]
  18. Marques Ramos, A.P.; Prado Osco, L.; Elis Garcia Furuya, D.; Nunes Gonçalves, W.; Cordeiro Santana, D.; Pereira Ribeiro Teodoro, L.; Antonio da Silva Junior, C.; Fernando Capristo-Silva, G.; Li, J.; Henrique Rojo Baio, F.; et al. A random forest ranking approach to predict yield in maize with uav-based vegetation spectral indices. Comput. Electron. Agric. 2020, 178, 105791. [Google Scholar] [CrossRef]
  19. Jeevaganesh, R.; Harish, D.; Priya, B. A machine learning-based approach for crop yield prediction and fertilizer recommendation. In Proceedings of the 6th International Conference on Trends in Electronics and Informatics (ICOEI), Tirunelveli, India, 28–30 April 2022; pp. 1330–1334. [Google Scholar]
  20. Rajković, D.; Marjanović Jeromela, A.; Pezo, L.; Lončar, B.; Zanetti, F.; Monti, A.; Kondić Špika, A. Yield and quality prediction of winter rapeseed—Artificial neural network and random forest models. Agronomy 2021, 12, 58. [Google Scholar] [CrossRef]
  21. Liu, Z.; Ju, H.; Ma, Q.; Sun, C.; Lv, Y.; Liu, K.; Wu, T.; Cheng, M. Rice yield estimation using multi-temporal remote sensing data and machine learning: A case study of Jiangsu, China. Agriculture 2024, 14, 14040638. [Google Scholar] [CrossRef]
  22. Gómez, D.; Salvador, P.; Sanz, J.; Casanova, J.L. Potato yield prediction using machine learning techniques and sentinel 2 Data. Remote Sens. 2019, 11, 1745. [Google Scholar] [CrossRef]
  23. Sun, C.; Feng, L.; Zhang, Z.; Ma, Y.; Crosby, T.; Naber, M.; Wang, Y. Prediction of end-of-season tuber yield and tuber set in potatoes using in-season UAV-based hyperspectral imagery and machine learning. Sensors 2020, 20, 5293. [Google Scholar] [CrossRef] [PubMed]
  24. Johnson, M.D.; Hsieh, W.W.; Cannon, A.J.; Davidson, A.; Bédard, F. Crop yield forecasting on the Canadian Prairies by remotely sensed vegetation indices and machine learning methods. Agric. For. Meteorol. 2016, 218–219, 74–84. [Google Scholar] [CrossRef]
  25. Prasad, N.R.; Patel, N.R.; Danodia, A. Crop yield prediction in cotton for regional level using random forest approach. Spat. Inf. Res. 2020, 29, 195–206. [Google Scholar] [CrossRef]
  26. Matese, A.; Toscano, P.; Di Gennaro, S.; Genesio, L.; Vaccari, F.; Primicerio, J.; Belli, C.; Zaldei, A.; Bianconi, R.; Gioli, B. Intercomparison of UAV, aircraft and satellite remote sensing platforms for precision viticulture. Remote Sens. 2015, 7, 2971–2990. [Google Scholar] [CrossRef]
  27. Taşan, S.; Cemek, B.; Taşan, M.; Cantürk, A. Estimation of eggplant yield with machine learning methods using spectral vegetation indices. Comput. Electron. Agric. 2022, 202, 107367. [Google Scholar] [CrossRef]
  28. Rouse, J.W.; Haas, R.H.; Schell, J.A.; Deering, D.W. Monitoring vegetation systems in the Great Plains with ETRS. In Proceedings of the Third Earth Resources Technology Satellite-1 Symposium, Washington, DC, USA, 10–14 December 1973; pp. 309–317. [Google Scholar]
  29. Sulik, J.J.; Long, D.S. Spectral indices for yellow canola flowers. Int. J. Remote Sens. 2015, 36, 2751–2765. [Google Scholar] [CrossRef]
  30. Gitelson, A.A.; Viña, A.; Ciganda, V.; Rundquist, D.C.; Arkebauer, T.J. Remote estimation of canopy chlorophyll content in crops. Geophys. Res. Lett. 2005, 32, L08403. [Google Scholar] [CrossRef]
  31. Jordan, C.F. Derivation of Leaf-Area Index from Quality of Light on the Forest Floor. Ecology 1969, 50, 663–666. [Google Scholar] [CrossRef]
  32. Broge, N.H.; Leblanc, E. Comparing prediction power and stability of broadband and hyperspectral vegetation indices for estimation of green leaf area index and canopy chlorophyll density. Remote Sens. Environ. 2001, 76, 156–172. [Google Scholar] [CrossRef]
  33. Hancock, D.W.; Dougherty, C.T. Relationships between blue-and red-based vegetation indices and leaf area and yield of alfalfa. Crop Sci. 2007, 47, 2547–2556. [Google Scholar] [CrossRef]
  34. Hadjimitsis, D.G.; Papadavid, G.; Agapiou, A.; Themistocleous, K.; Hadjimitsis, M.G.; Retalis, A.; Michaelides, S.; Chrysoulakis, N.; Toulios, L.; Clayton, C.R.I. Atmospheric correction for satellite remotely sensed data intended for agricultural applications: Impact on vegetation indices. Nat. Hazards Earth Syst. Sci. 2010, 10, 89–95. [Google Scholar] [CrossRef]
  35. Haboudane, D.; Miller, J.R.; Tremblay, N.; Zarco-Tejada, P.J.; Dextraze, L. Integrated narrow-band vegetation indices for prediction of crop chlorophyll content for application to precision agriculture. Remote Sens. Environ. 2002, 81, 416–426. [Google Scholar] [CrossRef]
  36. Alabi, T.R.; Abebe, A.T.; Chigeza, G.; Fowobaje, K.R. Estimation of soybean grain yield from multispectral high-resolution UAV data with machine learning models in West Africa. Remote Sens. Appl. Soc. Environ. 2022, 27, 100782. [Google Scholar] [CrossRef]
  37. Ge, H.; Ma, F.; Li, Z.; Du, C. Estimating rice yield by assimilating UAV-derived plant nitrogen concentration into the DSSAT model: Evaluation at different assimilation time windows. Field Crops Res. 2022, 288, 108705. [Google Scholar] [CrossRef]
  38. Barriguinha, A.; Jardim, B.; de Castro Neto, M.; Gil, A. Using NDVI, climate data and machine learning to estimate yield in the Douro wine region. Int. J. Appl. Earth Obs. Geoinf. 2022, 114, 103069. [Google Scholar] [CrossRef]
  39. Zsebő, S.; Bede, L.; Kukorelli, G.; Kulmány, I.M.; Milics, G.; Stencinger, D.; Teschner, G.; Varga, Z.; Vona, V.; Kovács, A.J. Yield Prediction Using NDVI Values from GreenSeeker and MicaSense Cameras at Different Stages of Winter Wheat Phenology. Drones 2024, 8, 88. [Google Scholar] [CrossRef]
  40. Lukas, V.; Huňady, I.; Kintl, A.; Mezera, J.; Hammerschmiedt, T.; Sobotková, J.; Brtnický, M.; Elbl, J. Using UAV to Identify the optimal vegetation index for yield prediction ofoil seed rape (Brassica napus L.) at the flowering stage. Remote Sens. 2022, 14, 4953. [Google Scholar] [CrossRef]
  41. Huang, J.; Tian, L.; Liang, S.; Ma, H.; Becker-Reshef, I.; Huang, Y.; Su, W.; Zhang, X.; Zhu, D.; Wu, W. Improving winter wheat yield estimation by assimilation of the leaf area index from Landsat TM and MODIS data into the WOFOST model. Agric. For. Meteorol. 2015, 204, 106–121. [Google Scholar] [CrossRef]
  42. Sadenova, M.; Beisekenov, N.; Varbanov, P.S.; Pan, T. Application of machine learning and neural networks to predict the yield of cereals, legumes, oilseeds and forage crops in Kazakhstan. Agriculture 2023, 13, 1195. [Google Scholar] [CrossRef]
  43. Xie, Y.; Wang, P.; Bai, X.; Khan, J.; Zhang, S.; Li, L.; Wang, L. Assimilation of the leaf area index and vegetation temperature condition index for winter wheat yield estimation using Landsat imagery and the CERES-Wheat model. Agric. For. Meteorol. 2017, 246, 194–206. [Google Scholar] [CrossRef]
  44. Zhou, H.; Yang, J.; Lou, W.; Sheng, L.; Li, D.; Hu, H. Improving grain yield prediction through fusion of multi-temporal spectral features and agronomic trait parameters derived from UAV imagery. Front. Plant Sci. 2023, 14, 1217448. [Google Scholar] [CrossRef] [PubMed]
  45. Adnan, R.M.; Liang, Z.; Heddam, S.; Zounemat-Kermani, M.; Kisi, O.; Li, B. Least square support vector machine and multivariate adaptive regression splines for streamflow prediction in mountainous basin using hydro-meteorological data as inputs. J. Hydrol. 2020, 586, 124371. [Google Scholar] [CrossRef]
  46. Freitas, R.G.; Pereira, F.R.S.; Dos Reis, A.A.; Magalhães, P.S.G.; Figueiredo, G.K.D.A.; do Amaral, L.R. Estimating pasture aboveground biomass under an integrated crop-livestock system based on spectral and texture measures derived from UAV images. Comput. Electron. Agric. 2022, 198, 107122. [Google Scholar] [CrossRef]
  47. He, D.; Zamora, M.; Oto, A.; Karczmar, G.S.; Fan, X. Comparison of region-of-interest-averaged and pixel-averaged analysis of DCE-MRI data based on simulations and pre-clinical experiments. Phys. Med. Biol. 2017, 62, N445–N459. [Google Scholar] [CrossRef] [PubMed]
Figure 1. Location of study area and experiment field.
Agriculture 14 01317 g001
Figure 3. Oilseed rape yield with N fertilizer (F1, F2, and F3), herbicide (NHB and HB), density (D1, D2, and D3), and special fertilizer (CF and SF) treatments.
Agriculture 14 01317 g003
Figure 4. Reflectance of various growth stages in oilseed rape plants (A) and correlation between reflectance and yield at various growth stages (B).
Agriculture 14 01317 g004
Figure 5. Relationship between VIs and oilseed rape yield at (S1), (S2), (S3), and (S4) growth stages. * indicates a significant correlation at p < 0.05.
Agriculture 14 01317 g005
Figure 6. PCA plot of VIs and oilseed rape yield at (S1), (S2), (S3), and (S4) stages.
Agriculture 14 01317 g006
Figure 7. Measured and predicted oilseed rape yield obtained by the RF model at (S1), (S2), (S3), and (S4) stages.
Agriculture 14 01317 g007
Figure 8. Measured and predicted oilseed rape yield obtained by the MLR model at (S1), (S2), (S3), and (S4) stages.
Agriculture 14 01317 g008
Figure 9. Measured and predicted oilseed rape yield obtained by the SVM model at (S1), (S2), (S3), and (S4) stages.
Agriculture 14 01317 g009
Figure 10. Measured and predicted yields at (S1), (S2), (S3), and (S4) stages.
Agriculture 14 01317 g010
Table 1. Experimental design details.
NotationTreatmentNote
F1N fertilizer 125 kg/haRepeated 12 times
F2N fertilizer 500 kg/ha
F3N fertilizer 750 kg/ha
NHBHerbicide (S)-Metolachlor sprayed with 1.5 L/haRepeated 12 times
HBWithout herbicide (S)-Metolachlor sprayed
D1Density of 1.5 × 10⁵ seedlings/haRepeated 6 times
D2Density of 4.5 × 10⁵ seedlings/ha
D3Density of 7.5 × 10⁵ seedlings/ha
CFCompound fertilizer (N:P2O5:K2O = 16:16:16)Repeated 3 times
SFSpecial fertilizer for oilseed rape plant
Table 2. Summary of the spectral reflectance indices used in this study.
IndexEquationReference
NDVI(R800 − R670)/(R800 + R670)[28]
NDVY(R560 − R450)/(R560 + R450)[29]
CIreR800/R720-1[30]
CIgreenR800/R550-1[30]
RVIR800/R670[31]
TVI0.5 × (120 × (R750 − R550) − 200 × (R670 − R550)[32]
BNDVI(R860 − R450)/(R860 + R450)[33]
DVIR800-R670[34]
RDVI[NDVI × (R800 + R670) ^ 2] ^ 0.5[35]
NIRR860/
Rx refers to the leaf reflectance at a wavelength x in nanometers; NDVI is normalized difference vegetation index; NDVY is the normalized yellow difference vegetation index; CIre is the red-edge chlorophyll index; CIgreen is the green chlorophyll index; RVI is the ratio vegetation index; TVI is triangular vegetation index; BNDVI is the blue normalized difference vegetation index; DVI is the difference vegetation index; RDVI is the ratio difference vegetation index; NIR is the near-infrared reflectance.
Table 4. Data characteristics of the predicted and measured yield.
Stage Median (kg/ha)Average (kg/ha)Max (kg/ha)Min (kg/ha)RangeSkewnessKurtosis
Measured2901.32747.73701.91215.02486.8−0.530.20
S1RF2950.92856.93313.81695.91617.9−2.004.11
MLR2928.42744.03304.4643.62660.8−2.235.59
SVM3001.72871.53310.41322.21988.2−2.124.67
S2RF2825.22676.13318.41388.71929.8−2.004.11
MLR2870.22695.43338.11470.11868.0−2.235.59
SVM2885.12718.43279.01591.51687.5−2.124.67
S3RF2856.42704.83603.41477.42125.9−2.004.11
MLR2779.72703.33822.51658.92163.6−2.235.59
SVM2792.82705.83980.71516.02464.8−2.124.67
S4RF2877.92761.63384.01458.51925.5−2.004.11
MLR2842.72825.13401.82182.31219.5−2.235.59
SVM2907.42897.83213.32546.2667.1−2.124.67
Disclaimer/Publisher’s Note: The statements, opinions and data contained in all publications are solely those of the individual author(s) and contributor(s) and not of MDPI and/or the editor(s). MDPI and/or the editor(s) disclaim responsibility for any injury to people or property resulting from any ideas, methods, instructions or products referred to in the content.

