Article

Winter Wheat Maturity Prediction via Sentinel-2 MSI Images

1
College of Information and Management Science, Henan Agricultural University, Zhengzhou 450002, China
2
Key Lab of Smart Agriculture System, Ministry of Education, China Agricultural University, Beijing 100083, China
3
College of Agriculture, Nanjing Agricultural University, Nanjing 210095, China
4
Key Laboratory of Quantitative Remote Sensing in Agriculture, Ministry of Agriculture and Rural Affairs, Information Technology Research Center, Beijing Academy of Agriculture and Forestry Sciences, Beijing 100097, China
5
Institute of Quantitative Remote Sensing and Smart Agriculture, Henan Polytechnic University, Jiaozuo 454000, China
*
Authors to whom correspondence should be addressed.
Agriculture 2024, 14(8), 1368; https://doi.org/10.3390/agriculture14081368
Submission received: 12 July 2024 / Revised: 31 July 2024 / Accepted: 14 August 2024 / Published: 15 August 2024
(This article belongs to the Special Issue Model-Assisted and Computational Plant Phenotyping)

Abstract

:
A timely and comprehensive understanding of winter wheat maturity is crucial for deploying large-scale harvesters within a region, ensuring timely winter wheat harvesting, and maintaining grain quality. Winter wheat maturity prediction is limited by two key issues: accurate extraction of wheat planting areas and effective maturity prediction methods. The primary aim of this study is to propose a method for predicting winter wheat maturity. The method comprises three parts: (i) winter wheat planting area extraction via phenological characteristics across multiple growth stages; (ii) extraction of winter wheat maturity features via vegetation indices (VIs, such as NDVI, NDRE, NDII1, and NDII2) and box plot analysis; and (iii) winter wheat maturity data prediction via the selected VIs. The key findings of this work are as follows: (i) Combining multispectral remote sensing data from the winter wheat jointing-filling and maturity-harvest stages can provide high-precision extraction of winter wheat planting areas (OA = 95.67%, PA = 91.67%, UA = 99.64%, and Kappa = 0.9133). (ii) The proposed method can offer the highest accuracy in predicting maturity at the winter wheat flowering stage (R2 = 0.802, RMSE = 1.56 days), aiding in a timely and comprehensive understanding of winter wheat maturity and in deploying large-scale harvesters within the region. (iii) The study’s validation was only conducted for winter wheat maturity prediction in the North China Plain wheat production area, and the accuracy of harvesting progress information extraction for other regions’ wheat still requires further testing. The method proposed in this study can provide accurate predictions of winter wheat maturity, helping agricultural management departments adopt information-based measures to improve the efficiency of monitoring winter wheat maturation and harvesting, thus promoting the efficiency of precision agricultural operations and informatization efforts.

1. Introduction

Wheat is one of the world’s most important food crops [1,2]. The North China Plain, which includes Henan, Hebei, Shandong, Jiangsu, and northern Anhui provinces, is China’s largest winter wheat production area [3]. Henan province contributes approximately one quarter of China’s total wheat production. The harvest data for winter wheat vary by region and climate. In the North China Plain, the maturity and harvest of wheat are mainly between late May and mid-June each year, with specific timings depending on the variety and local climate conditions [4,5]. A timely and comprehensive understanding of winter wheat maturity is crucial for deploying large-scale harvesters within a region, ensuring timely harvesting of winter wheat, and maintaining grain quality [6,7,8].
In China, agricultural survey teams from the National Bureau of Statistics or local agricultural technology stations typically conduct wheat maturity period predictions. However, different investigators may exhibit biases in their wheat maturity assessments. More importantly, current methods hinder the rapid completion of regional wheat maturity surveys, limiting their applicability to large areas [9,10,11]. Since the 1970s, satellite multispectral remote sensing technology has been widely used in agricultural monitoring, including crop classification, growth monitoring, and yield estimation [12,13,14,15]. However, the accuracy of winter wheat maturity prediction based on satellite multispectral imagery is limited by two key issues: accurate extraction of wheat planting areas and effective maturity prediction methods [16,17,18].
The main method for extracting winter wheat planting areas is supervised classification via machine learning [19,20,21,22,23]. Supervised classification methods employ machine learning or deep learning techniques to classify various land cover types in remote sensing images to extract winter wheat planting areas [24]. For example, Chang et al. [25] proposed an improved DeepLabV3+ model and constructed prediction models using data from Gaofen-2 to extract crop planting areas. Dong et al. [26] used Landsat 7, Landsat 8, and Sentinel 2 images via a time-weighted dynamic time warping method to improve the accuracy of winter wheat extraction. Ayhan et al. [27] used the DeepLabV3+ model to classify vegetation in open remote sensing datasets. Supervised classification methods can achieve high-precision classification through training on large, annotated datasets and learning the characteristics of wheat planting areas. However, the effectiveness of supervised classification relies heavily on the quality and quantity of the training data [28]. Furthermore, distinguishing winter wheat from other green vegetation remains challenging, and more effective methods are needed to extract winter wheat planting areas.
Maturation is the final phenological stage of crops and is accompanied by phenomena such as germination, leaf unfolding, flowering, and leaf fall, with changes and transfers in crop pigments, moisture, nutrients, and nitrogen [29]. These changes lead to periodic variations in crop canopy spectral reflectance and vegetation indices (VIs). Traditional crop maturity monitoring techniques based on remote sensing mainly utilize multitemporal VIs combined with threshold methods [30,31,32,33]. Current remote sensing phenology extraction research relies primarily on time series VI analysis [30,31,32,33]. The time series-VI method uses VIs to extract crop phenological information, such as the NDVI, and then extracts winter wheat planting areas on the basis of phenological characteristics [9,32,34]. The method involves three main aspects: (i) acquiring high spatiotemporal resolution multispectral remote sensing images, (ii) reconstructing time series VIs, and (iii) establishing the relationship between crop phenological stages and characteristic points of the VI curve. However, during the maturation stage, winter wheat loses its green vegetation characteristics, resulting in low NDVI values in images, making it difficult to determine an NDVI threshold for distinguishing mature wheat from soil [21,34]. Furthermore, many studies suggest that the maturity period extracted from time series vegetation indices may differ from the actual crop maturity [35,36]. Finally, time series VIs often overlook the spatial structural information of the land cover, making it challenging to obtain ideal extraction results in fragmented and complex winter wheat planting areas [30,37,38].
Agricultural production and management departments need real-time or near-real-time remote sensing information on crop maturity [21,39]. However, existing methods for extracting crop maturity information via remote sensing time series VIs often experience delays. Additionally, crop phenological stages are influenced by uncertain weather conditions, cultivation practices, and field management, leading to systematic deviations between the mathematically predicted phenological maturity and the actual agronomic maturity [29]. Currently, there is limited research on accurately determining wheat maturity, and existing remote sensing methods for extracting wheat maturity information suffer from delayed timeliness, low accuracy, and difficulties in supporting agricultural production decisions [21,32,40,41,42].
The primary aim of this study is to propose a method for predicting the maturity of winter wheat on the basis of multitemporal remote sensing data. This study focuses on the North China Plain wheat production area, utilizing phenological information combined with threshold methods to extract winter wheat planting areas and develop a winter wheat maturity data prediction model.

2. Study Area and Dataset
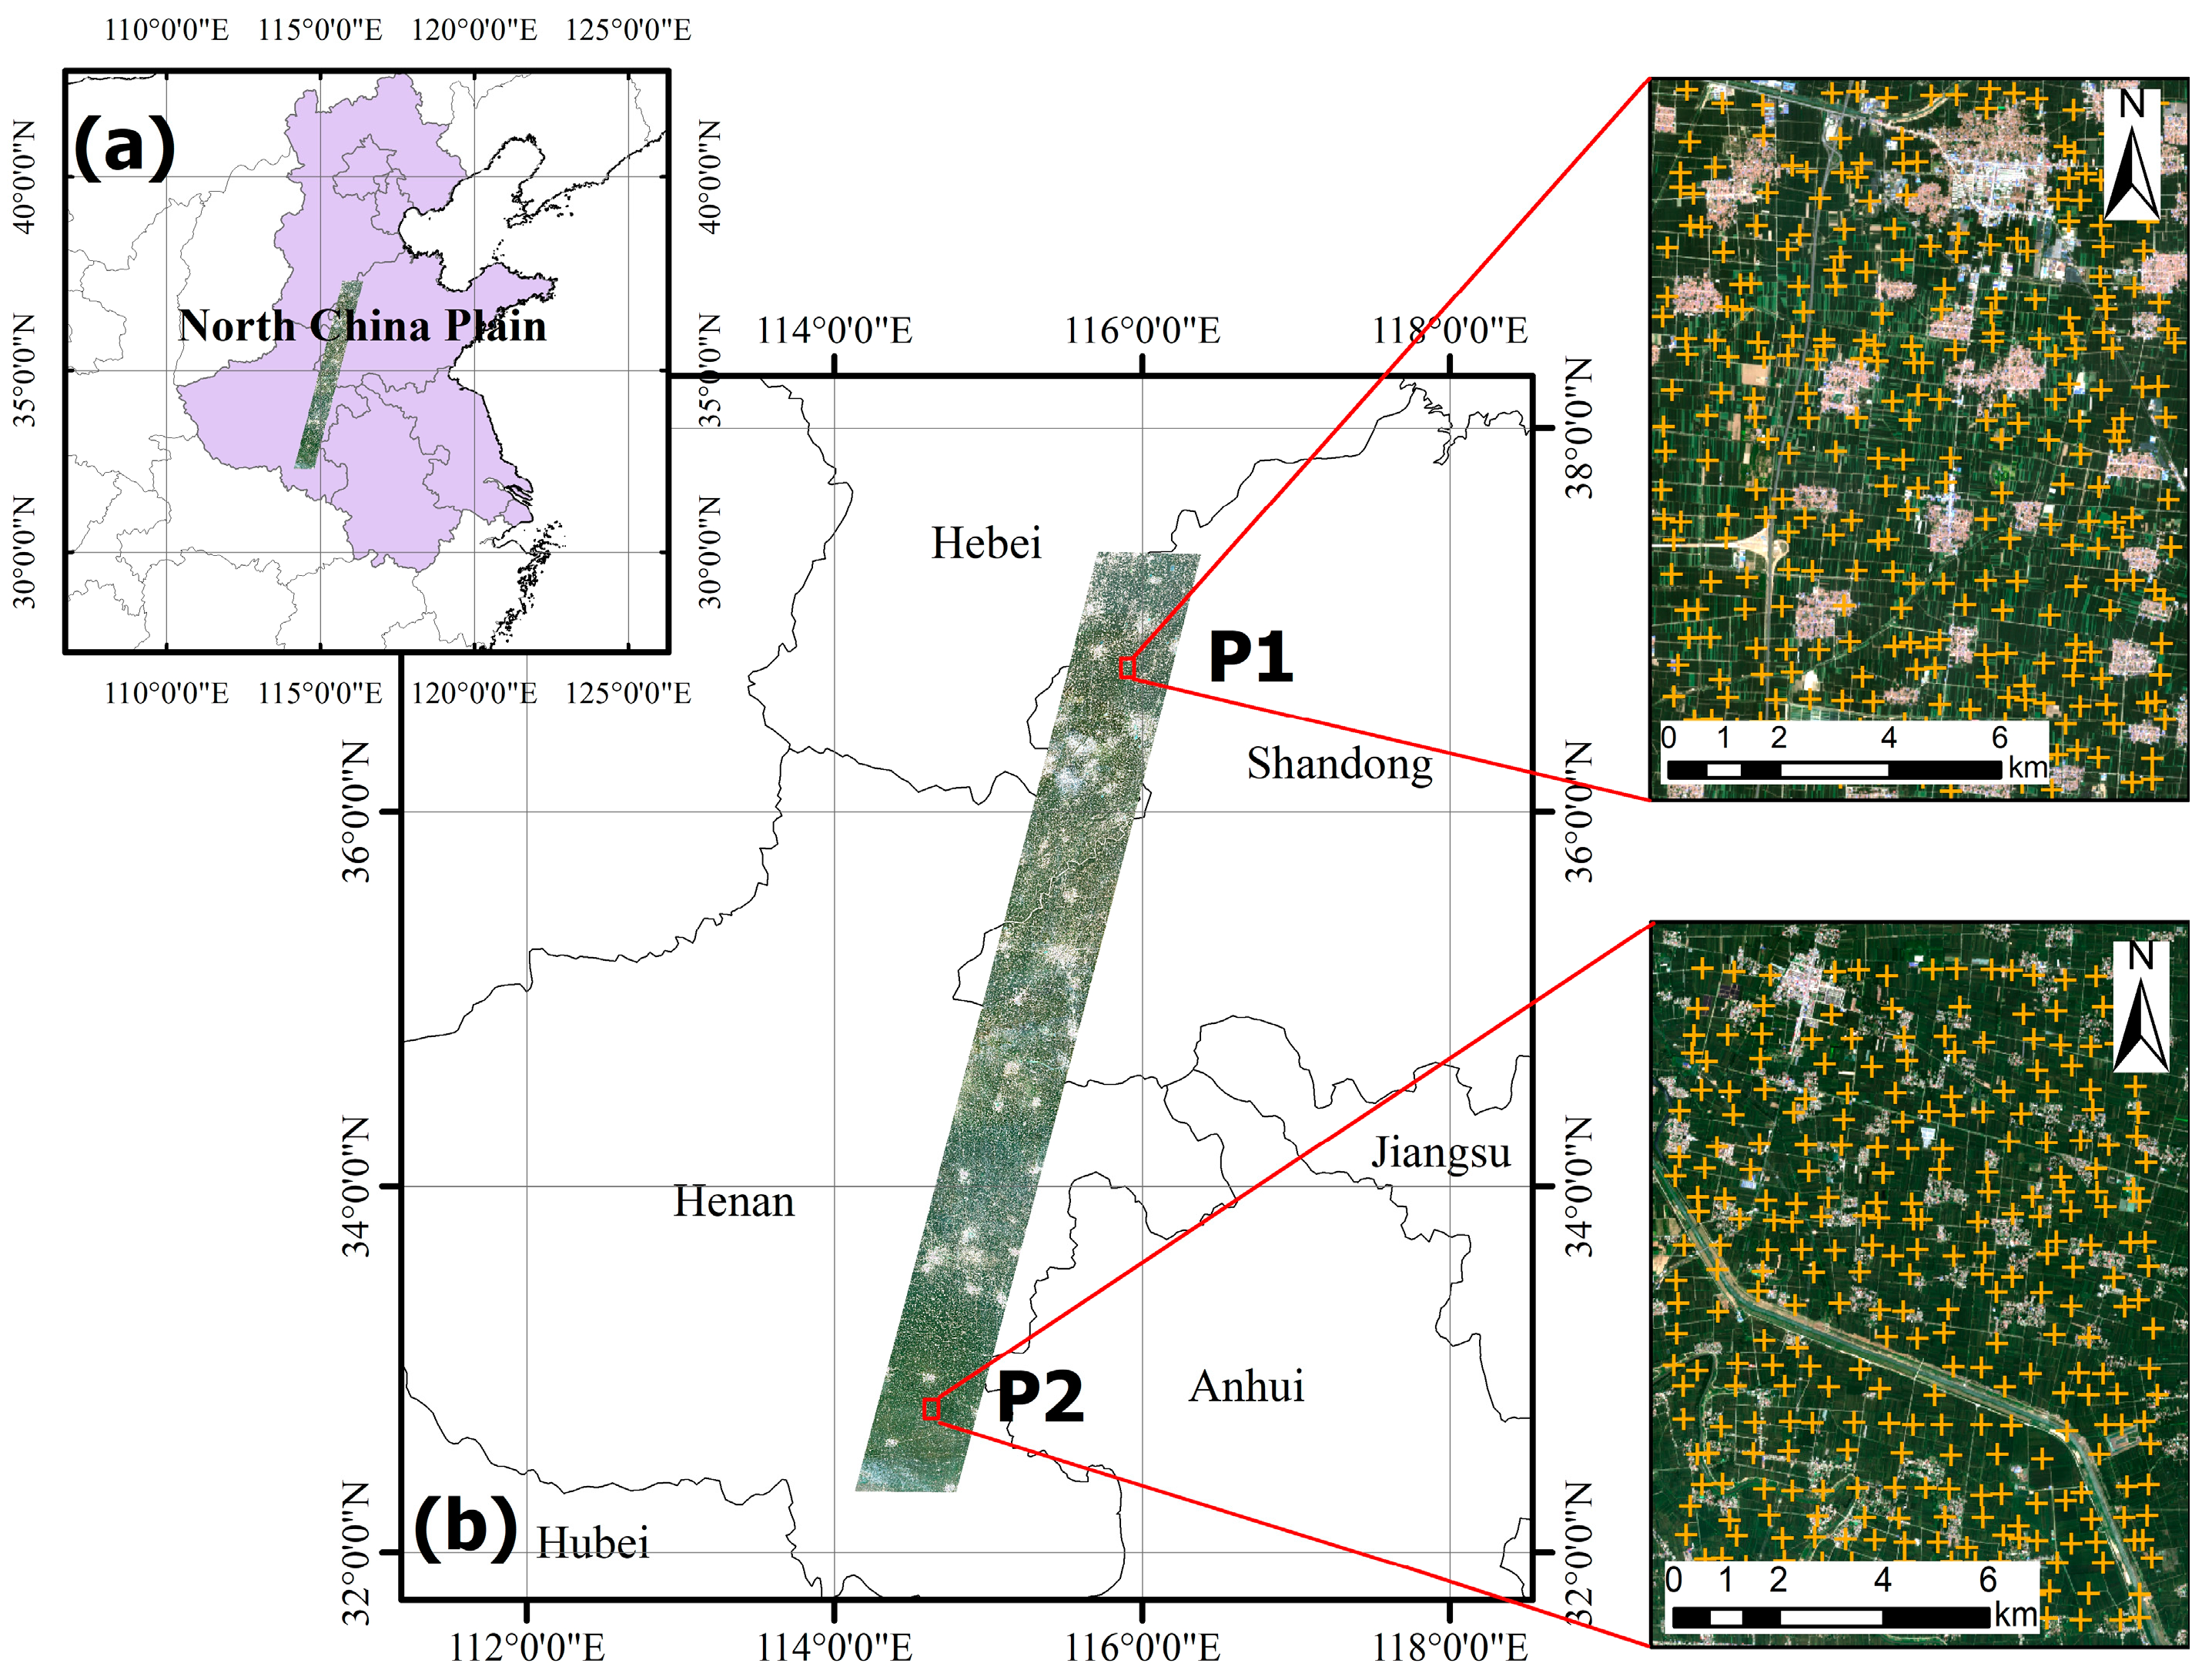
2.1. Study Area

2.1.1. North China Plain

The study area is located in China’s main wheat production region, the North China Plain (Figure 1a). The ground study area (Figure 1b) extends from the eastern part of Henan province to the western part of Shandong province. The North China Plain is mainly formed by the sedimentation of rivers such as the Yellow River, and its terrain is low and flat. In the western and southern foothills of the North China Plain, elevations are primarily around 80 m. By contrast, in the central plain, elevations range mostly between 35 to 80 m, and in the eastern coastal areas, elevations are only 2 to 3 m. The North China Plain features a semi-humid monsoon climate with distinct seasons. The characteristics of this climate are cold and dry winters and hot and rainy summers. The North China Plain is suitable for growing wheat, corn, and soybeans. Local agricultural practices typically involve a winter wheat–summer corn rotation system, with winter wheat being sown in mid-to-late October and harvested in early June of the following year.

2.1.2. Winter Wheat Planting Area Labels

This study labeled 600 wheat sample points and 600 non-winter wheat field points. These ground truth data were used to analyze the spectral and VI characteristics of green wheat, mature wheat, and harvested fields and evaluate the accuracy of the extraction of winter wheat planting areas. The samples were marked in two regions: one in the northern part (P1, 96.4 km2) and one in the southern part (P2, 83.2 km2) of the study area (Figure 1b). This is because the maturity time difference between the southern and northern parts of the study area can reach up to 10 days, while the difference between the eastern and western parts is minimal. A total of 1200 samples were selected from both wheat planting areas (n = 600) and non-wheat planting areas (n = 600). The pixels of non-wheat planting areas are water bodies, roads, urban areas, and non-wheat green vegetation. Therefore, 150 sample sizes were assigned to each category. The labeling method is described in Table 1.
The specific categories of the labeled points were as follows:
  • Six hundred wheat cropland sample points, with 300 points in each P1 and P2 study area (Figure 1b);
  • One hundred and fifty waterbody sample points;
  • One hundred and fifty road sample points;
  • One hundred and fifty urban area sample points;
  • One hundred and fifty green vegetation-covered sample points.

2.2. Remote Sensing Images

2.2.1. Sentinel-2 MSI

The Sentinel-2 satellite, operated by the European Space Agency (ESA), is an Earth observation project that provides high spatial resolution and multispectral observation data globally. The Sentinel-2 constellation includes two satellites, Sentinel-2A and Sentinel-2B, which achieve a five-day revisit cycle for most global regions. The Sentinel-2 MSI is a multispectral sensor onboard the Sentinel-2 constellation that captures surface reflectance information in multiple bands, including the visible, infrared, and near-infrared bands, with spatial resolutions ranging from 10 m to 60 m. Sentinel-2 MSI Level 2A images are surface reflectance products that have undergone atmospheric and geometric corrections by the ESA.
This study selected two overlapping Sentinel-2 transit zones (Figure 1), allowing for a revisit cycle of 2–3 days due to the overlap of the adjacent transit zones (Table 2). Sentinel-2 MSI images were obtained through the Google Earth Engine (GEE) platform [43]; cloud pixels with a probability greater than 65% were removed via GEE’s cloud detection results. Due to wheat’s long individual growth periods, satellites revisit the same area multiple times during a specific growth stage. Additionally, some pixels in Sentinel-2 images were missing after removing pixels affected by cloud cover. Therefore, the averaged values of valid pixels (those not affected by cloud cover or other disturbances) within the same growth stage were used to obtain the spectral values of wheat fields at that stage.
Given the multiple remote sensing images acquired for various wheat growth stages and the multiple images within the same phenological stage (e.g., overwintering), this study used the abbreviations (Abbr) S1 (emergence stage) to S11 (filling stage) to represent each phenological stage. Table 2 presents the correlations between the phenological stages and collection times of the Sentinel-2 multispectral images. Ten winter wheat growth stages were selected because wheat organs, canopy structure, and leaf physiological characteristics undergo significant changes during these critical growth stages (Table 2). In this study, Sentinel-2 multispectral images were used primarily to calculate VIs and construct a winter wheat maturity prediction model.

2.2.2. GF-1 WFV and HJ-2 CCD

The Gaofen-1 (GF-1) satellite, developed by China, is a remote sensing satellite that is primarily tasked with Earth resource surveys, environmental monitoring, and urban planning [44]. The satellite is equipped with various sensors, including a wide field of view (WFV) sensor. The WFV sensor, the main imaging device of the GF-1 satellite, stands out for its wide field of view and rapid acquisition of large-scale ground images. Its high resolution and fast imaging capability, with a ground resolution of 16 m, make it a valuable tool for remote sensing applications.
The HJ-2A/B satellites, managed by China’s Ministry of Emergency Management and Ministry of Ecology and Environment, are used for large-scale, all-weather dynamic monitoring of ecological environments and disasters [45]. They reflect the development of ecological environments and the occurrence of disasters in a timely manner, and they can help to predict changes and provide a scientific basis for emergency rescue, post-disaster relief, and reconstruction. The HJ-2A/B satellites operate in a network, achieving global coverage every two days. The HJ-2A/B satellites have four types of optical payloads: CCD cameras, hyperspectral imagers, infrared cameras, and atmospheric correction instruments. The CCD camera payload consists of four visible light CCD cameras, providing a 16 m ground resolution and a swath width of 800 km through field-of-view stitching.
The preprocessing steps for GF-1 WFV and HJ-2A/B CCD multispectral images are similar and involve two processes: (1) orthorectification, where raw multispectral images are converted from rational polynomial coefficient (RPC) projection to world geodetic system 1984 (WGS-84) projection via ENVI (Exelis Visual Information Solutions, Boulder, CO, USA) orthorectification tools [46]; and (2) image registration, which uses Sentinel-2 MSI multispectral images downloaded from GEE as a reference to register Sentinel-2 MSI, GF-1 WFV, and HJ-2A/B CCD multispectral images.
This study mainly used GF-1 WFV and HJ-2A/B CCD multispectral images to determine the maturity and harvest of winter wheat. GF-1 WFV and HJ-2A/B CCD multispectral images were not used to predict wheat maturity.

2.3. Winter Wheat Maturity Data Collection

Determining the harvest data of winter wheat on a large scale is challenging. Generally, grain moisture content is the primary indicator of agricultural maturity. During grain formation, 29–40% of the nitrogen in wheat comes from the leaves, with canopy leaves aging synchronously with the filling and maturation process [47]. At full maturity, wheat leaves turn yellow, grains harden, and the moisture content decreases below 20% [47]. After wheat maturation, the moisture and chlorophyll content change minimally. Winter wheat should be harvested promptly upon maturation, as photosynthesis ceases while respiration continues, potentially causing yield losses. Family farms dominate the North China Plain, and farmers harvest wheat as soon as it matures. Therefore, the day before a harvest was recorded as maturity in this study. This work determined the maturity of 398 winter wheat fields.

2.3.1. Harvester Work Record

The winter wheat harvest data were obtained via BeiDou global navigation satellite system (GNSS) receiver work logs from ground-based harvester teams. Harvesting typically progresses from south to north. Winter wheat harvesting in the study area began on 1 June and was mostly completed by 13 June. When harvesting begins, operators manually activate the BeiDou GNSS receiver and deactivate it upon finishing a plot. The GNSS receiver uploads the harvester’s real-time location data to the owner. Based on these two locations, we determined the location of the wheat field. Each set of harvest records includes a comprehensive set of latitude and longitude coordinates and a time stamp. A total of 115 sets of harvester records were collected, and the maturity for 115 winter wheat fields was determined.

2.3.2. Manual Labeling of Harvest on the Basis of Remote Sensing Images

In addition to harvester records, this study annotated harvested wheat fields in the study area via multitemporal satellite remote sensing images, with the day before harvest recorded as maturity (Table 3). After harvest, wheat stubble covers the soil surface, increasing soil brightness as compared to the soil in the unharvested areas. For example, if a winter wheat field was identified as unharvested on 12 June 2023 based on the HJ-2A CCD and GF1-WFV images (Table 3) but was identified as harvested on 13 June 2023 based on the HJ-2B CCD and Sentinel-2 MSI images (Table 3), then it was recorded as matured on 12 June 2023. Owing to the distinct characteristics of harvested and unharvested wheat fields, 283 winter wheat fields and maturity were annotated on the basis of the Sentinel-2 MSI, GF-1 WFV, and HJ-2A/B multispectral images during maturity (Table 3).

3. Methods

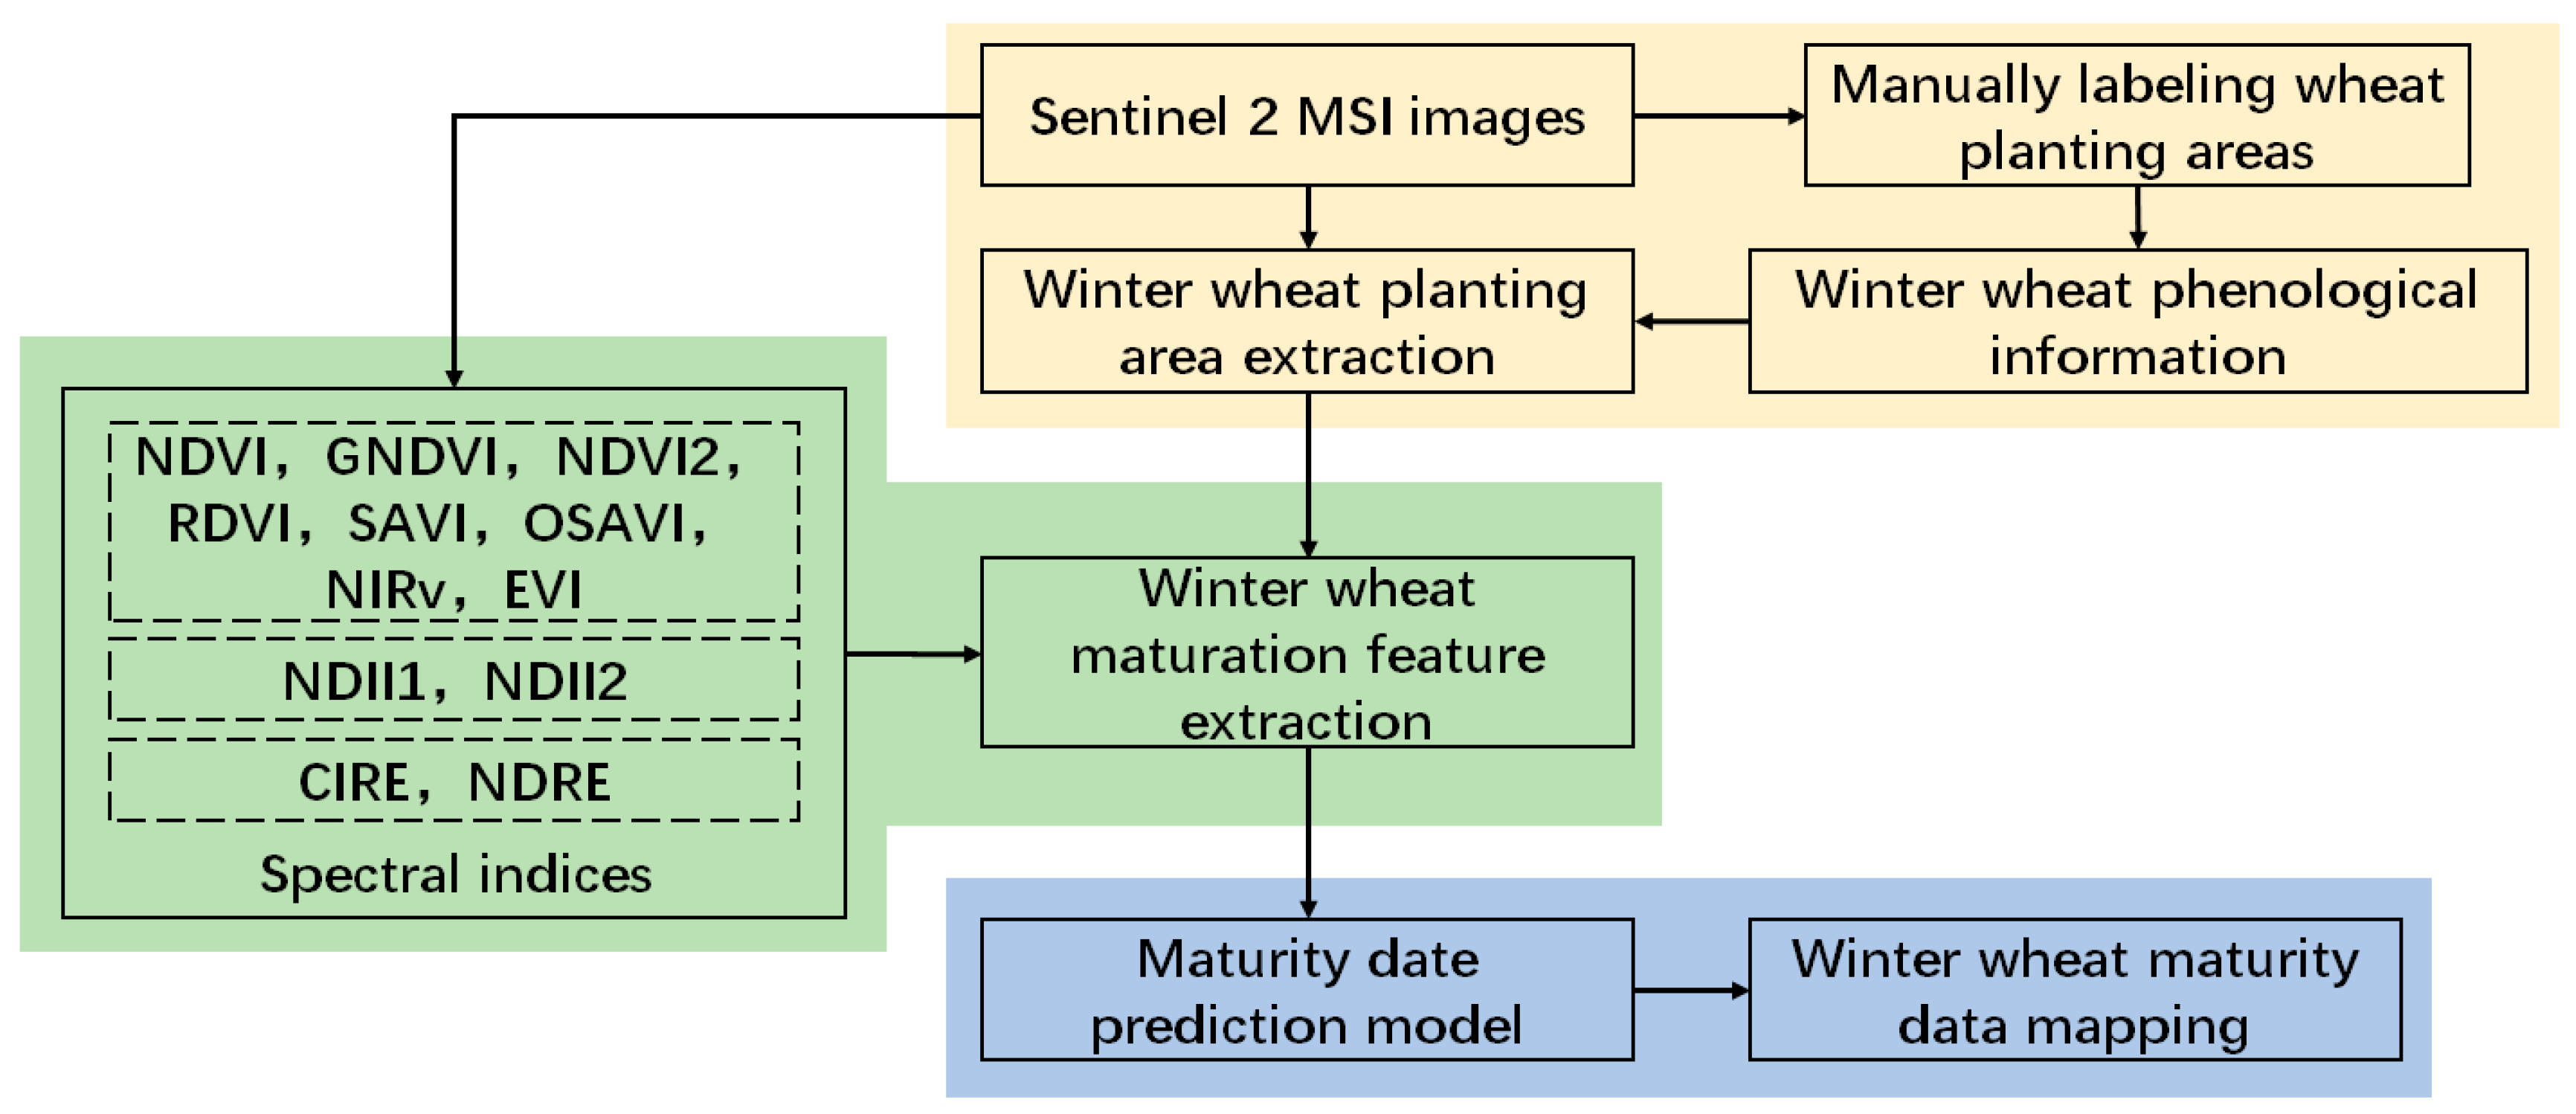
3.1. Methodological Framework

The technical route for monitoring the harvest of winter wheat in this study (Figure 2) mainly included three steps:
(i)
Winter wheat planting area classification. In this study, winter wheat planting areas were extracted via a multigrowth-stage NDVI combined with threshold methods.
(ii)
Winter wheat maturity characteristic analysis. We conducted a comprehensive analysis, selecting VIs (such as NDVI, NDRE, NDII1, and NDII2) and thoroughly examine the winter wheat maturity characteristics and field harvest characteristics via boxplot analysis methods.
(iii)
Winter wheat maturity data prediction. On the basis of the selected valuable harvest VIs, a threshold method was used to determine maturity, which was combined with the information extracted from the winter wheat planting area to assess the harvest progress.

3.2. Vegetation Indices

This study selected several VIs sensitive to crop chlorophyll content, growth status, and leaf water content (Table 4) to determine winter wheat planting areas and maturity characteristics. Choosing the proper vegetative indices involved considering the spectral bands available from the remote sensing sensors, the studied vegetation types, and the specific environmental conditions affecting crop growth. Three VIs were selected for extracting the wheat planting areas and determining harvest timing. Table 4 presents the selected VIs.
Multifunctional VIs, such as the normalized difference vegetation index (NDVI), enhanced vegetation index (EVI), and soil-adjusted vegetation index (SAVI), are designed to capture multiple aspects of vegetation health and physiology. These indices, which are versatile and widely used in monitoring vegetation cover, biomass, and stress, provide a comprehensive understanding of plant health. Chlorophyll VIs, specifically sensitive to chlorophyll content, and leaf water VIs, which focus on changes in leaf water content, provide unique insights into vegetation physiology.
The NDVI time series has been widely used to determine crop phenological information and extract crop planting area information. In this study, the NDVI was used to extract wheat planting areas, while multiple chlorophyll indices and canopy water VIs, such as the NDRE, were used to determine wheat harvest information.

3.3. Winter Wheat Spectral Feature Analysis and Extraction Techniques

3.3.1. Time Series Vegetation Index Feature Analysis

Currently, most widely used crop planting area extraction techniques are based on multigrowth-stage assessments. This method focuses on analyzing and extracting the phenological characteristics of different crops and plants, improving the extraction of winter wheat planting areas on the basis of these characteristics. Multitemporal remote sensing allows for capturing vegetation dynamics throughout the growing season of winter wheat. By acquiring satellite imagery at multigrowth stages (e.g., emergence and heading stages), researchers can observe variations in the NDVI and other vegetation indices [26]. This helps to distinguish between different growth stages of winter wheat and reduces the impact of single-stage classification errors caused by high NDVI values.
As shown in Figure 3, the NDVI time series curves of major land cover types in agricultural areas exhibited the following features:
(i)
Roads, water bodies, and urban areas had NDVI values below 0.3, with minimal interannual variation.
(ii)
Cropland pixels were influenced by the natural environment, seasonal changes, and human cultivation. Wheat emerged at the end of October of the previous year, with the NDVI peaking at the end of April of the following year and decreasing to its lowest value by the end of May.
(iii)
In non-crop vegetation-covered areas, the NDVI values were influenced by the natural environment and seasonal changes. The NDVI values began to rise in March, peaked in June, decreased in November, and reached their lowest values by the end of December.
This study used phenological characteristics to improve the accuracy of winter wheat planting area extractions (Figure 3). Considering the focus on extracting winter wheat harvest progress rather than planting area information, the study used only four temporal satellite datasets for classification: 10 March 2023 (S6, jointing stage), 7 May 2023 (S10, filling stage), and 13 June 2023 (S11, post-harvest). The threshold method was used to extract planting areas:
Green   vegetation :   N D V I j o i n t i n g > 0.5   or   N D V I f i l l i n g > 0.6
Non- green   vegetation : N D V I p o s t h a r v e s t 1 < 0.3   or   N D V I p o s t h a r v e s t 2 < 0.3
Condition (1) extracted green vegetation areas during the winter wheat jointing (NDVI > 0.5) and filling (NDVI > 0.5) stages, including green wheat, forestland, shrubs, and urban lawns. Condition (2) extracted non-vegetation areas (NDVI < 0.3), including water bodies, harvested winter wheat fields, concrete ground, roads, and field ridges. Winter wheat information could be extracted when an area met both conditions simultaneously. The extraction process for the wheat planting areas was implemented via ENVI band math.

3.3.2. Boxplot

A boxplot is a statistical chart that shows the data variability distribution [58]. It is widely used to describe the distribution characteristics of raw data and compare the distribution characteristics of multiple datasets. Boxplots display various key summary statistics of a dataset, such as the maximum, minimum, median, and quartiles. Therefore, they can help to analyze the multigrowth-stage changes in pigments and water during winter wheat maturation.

3.4. Maturity Prediction Model

This work determined the maturity of 398 winter wheat fields. Two hundred and sixty-five fields were used to construct the maturity prediction models, while the remaining 133 fields were reserved for model validation. For each validation unit used for maturity prediction, the average spectral values (B2, B3, B4, B5, B6, B7, B8, B11, and B12) for each growth stage within a 20 m centered unit were extracted using GEE. The corresponding 12 VIs were subsequently calculated, resulting in each validation unit corresponding to 12 VIs per growth stage. The study designed two wheat maturity validation strategies:
  • Strategy (1) used VIs from the emergence stage to the flowering stage (S1–S9, nine growth periods) for maturity prediction. Strategy (1) enabled the prediction of wheat maturity at the flowering stage (29 April 2023, Table 2). For maturity prediction via Strategy 1, each validation unit corresponded to 12 × 9 = 108 modeling values.
  • Strategy (2) used VIs from the emergence stage to the filling stage (S1–S10, ten growth periods) for maturity prediction. Strategy (2) enabled the prediction of wheat maturity at the filling stage (14 May 2023, Table 2). For Strategy 2, each validation unit corresponded to 12 × 10 = 120 modeling values.
The study employed three commonly used statistical regression models for accuracy comparison: random forest (RF) [59], partial least squares regression (PLSR) [60], and multiple stepwise regression (MSR) [28]. These methods have been widely applied in agricultural crop parameter prediction research.
The RF regression technique is based on ensemble learning [59]. Multiple decision trees are constructed through random sampling and feature selection, and the results are determined on the basis of the voting results of multiple decision trees. Each decision tree is constructed using different random samples and features, ensuring diversity among the trees. By integrating numerous individual decision trees, RF reduces the risk of overfitting a single model and enhances the model’s generalization ability. When using RF for data regression, it is necessary to set two parameters specifically for the RF model: mtry and ntree. Here, mtry represents the number of variables considered for the best split at each node during tree growth, typically set to the square root of the number of input variables (mtry = √108 = 10). The parameter ntree denotes the number of decision trees in the forest, commonly set to the default value of 500.
The PLSR is a statistical method that, while related to principal component regression, stands out for its adaptability [60]. It seeks to find a hyperplane in the new space through a projection that maximizes the variance between the response and predictor variables. PLSR models the covariance structure between two matrices (X and Y) by projecting them into a new space. It is particularly suitable when there are more predictor variables than observations, and when multicollinearity exists in X values, making it a reassuring choice in complex scenarios.
The basic idea of MSR is to automatically select the most important variables from many available options to establish a predictive or explanatory regression model [28]. The process involves introducing variables individually, with the condition that their partial regression sum of squares is significant. After introducing a new variable, the existing variables are tested, and the nonsignificant variables are removed. This process continues until no new variables are introduced, or the existing variables are removed, resulting in an “optimal” multiple linear regression equation.

3.5. Performance Evaluation

3.5.1. Performance Evaluation of Winter Wheat Planting Areas Extraction

A confusion matrix, also known as error matrix, is a specific table layout that allows for visualization of the performance of an algorithm [61]. The confusion matrix organizes the acquired sample data in a way that summarizes key results and quantifies accuracy and area. The main diagonal of the confusion matrix highlights correct classifications, while the off-diagonal elements show omission and commission errors. The confusion matrix’s cell entries and marginal values are fundamental to accuracy assessment and area estimation. Table 5 illustrates the confusion matrix used in this study.
The study used four metrics derived from the confusion matrix to measure monitoring accuracy: overall accuracy (OA), producer accuracy (PA), user accuracy (UA), and Cohen’s Kappa index.
O A = j = 1 q p j j
P A = p j j p · j
U A = p j j p j ·
The Cohen’s Kappa index could be calculated based on the confusion matrix:
K a p p a = p o p e 1 p e
where p o represents the overall accuracy, and p e is the hypothetical probability of chance agreement.
p e = 1 N 2 k n k 1 n k 2
where k represents the categories, N represents the number of observations, nk1 represents the number of category k, and nk2 represents the number of predicted category k. This work calculated the OA, PA, UA, and Kappa index using sklearn in Python.

3.5.2. Performance Evaluation of Winter Wheat Maturity Prediction

For maturity prediction, the coefficient of determination (R2), mean absolute error (MAE), mean absolute percentage error (MAPE), and root mean square error (RMSE) were used to evaluate the accuracy of the models and methods.
R 2 = 1 i = 1 n ( y i x i ) 2 i = 1 n ( y i y ¯ ) 2
M A E = i = 1 n a b s ( x i y i ) n
M A P E = i = 1 n a b s ( x i y i y i ) n × 100
R M S E = i = 1 n ( x i y i ) 2 n
where xi and yi represent the estimated and measured sample values, y ¯ represents the estimated average value, and n is the number of samples. In mathematical terms, a model with a higher coefficient of determination and a lower RMSE for the same sample data is generally considered more accurate, demonstrating the complementary nature of the two evaluation metrics.

4. Results

4.1. Analysis of Winter Wheat Maturation Features

We analyzed the spectral reflectance characteristics and VI features of different phenological stages. Figure 4a shows the spectral differences among green winter wheat, mature winter wheat, and post-harvest winter wheat fields. Our results indicate that immature wheat exhibits green vegetation spectral characteristics. However, after wheat enters the mature stage, these green vegetation spectral characteristics weaken, with a noticeable decrease in red band spectral reflectance due to reduced chlorophyll, and a significant increase in shortwave infrared band reflectance due to decreased water content. Our results show that green wheat has the lowest visible band reflectance, mature wheat has relatively high visible band reflectance, and post-harvest wheat fields have the highest pixel spectral reflectance because straw covers the soil surface.
Figure 4b–h show the differences in VI characteristics among green winter wheat, mature winter wheat, and post-harvest winter wheat fields. Our results indicate that different VIs have varying abilities to distinguish crop maturity characteristics. Indices such as the NDVI, NDRE, NIRv, SAVI, and RDVI rapidly decrease with increasing crop maturity, indicating significant numerical differences. However, the NDII1 and NDII2 of green winter wheat, mature winter wheat, and post-harvest winter wheat fields have considerable overlap ranges, implying that using only the NDII1 and NDII2 to distinguish crop maturity characteristics may not be as effective as the use of the NDVI and NDRE indices. This is not surprising since the NDII1 and NDII2 indices were initially designed to distinguish crop canopy moisture but are also sensitive to soil moisture.
This study further analyzed the changes in VI characteristics over time for mature winter wheat via the NDVI. Figure 3 shows the NDVI change curve over time. Soil, urban areas, and water bodies have low NDVI values with slight interannual variations. Vegetation-covered green spaces are influenced mainly by natural environments, and seasonal changes increase the amount of green starting in March, reach the maximum NDVI in June, decrease in November, and reach the lowest value at the end of December. After winter wheat emerges, the NDVI increases rapidly; during the overwintering period, the NDVI slightly decreases; after the regreening period, the NDVI increases rapidly, reaching its maximum value in mid-April; and after mid-May, the wheat NDVI rapidly decreases, reaching its lowest value post-harvest. The time series changes in VIs represented by the NDVI suggest that time series characteristics can effectively distinguish winter wheat from urban green spaces and other ground targets.

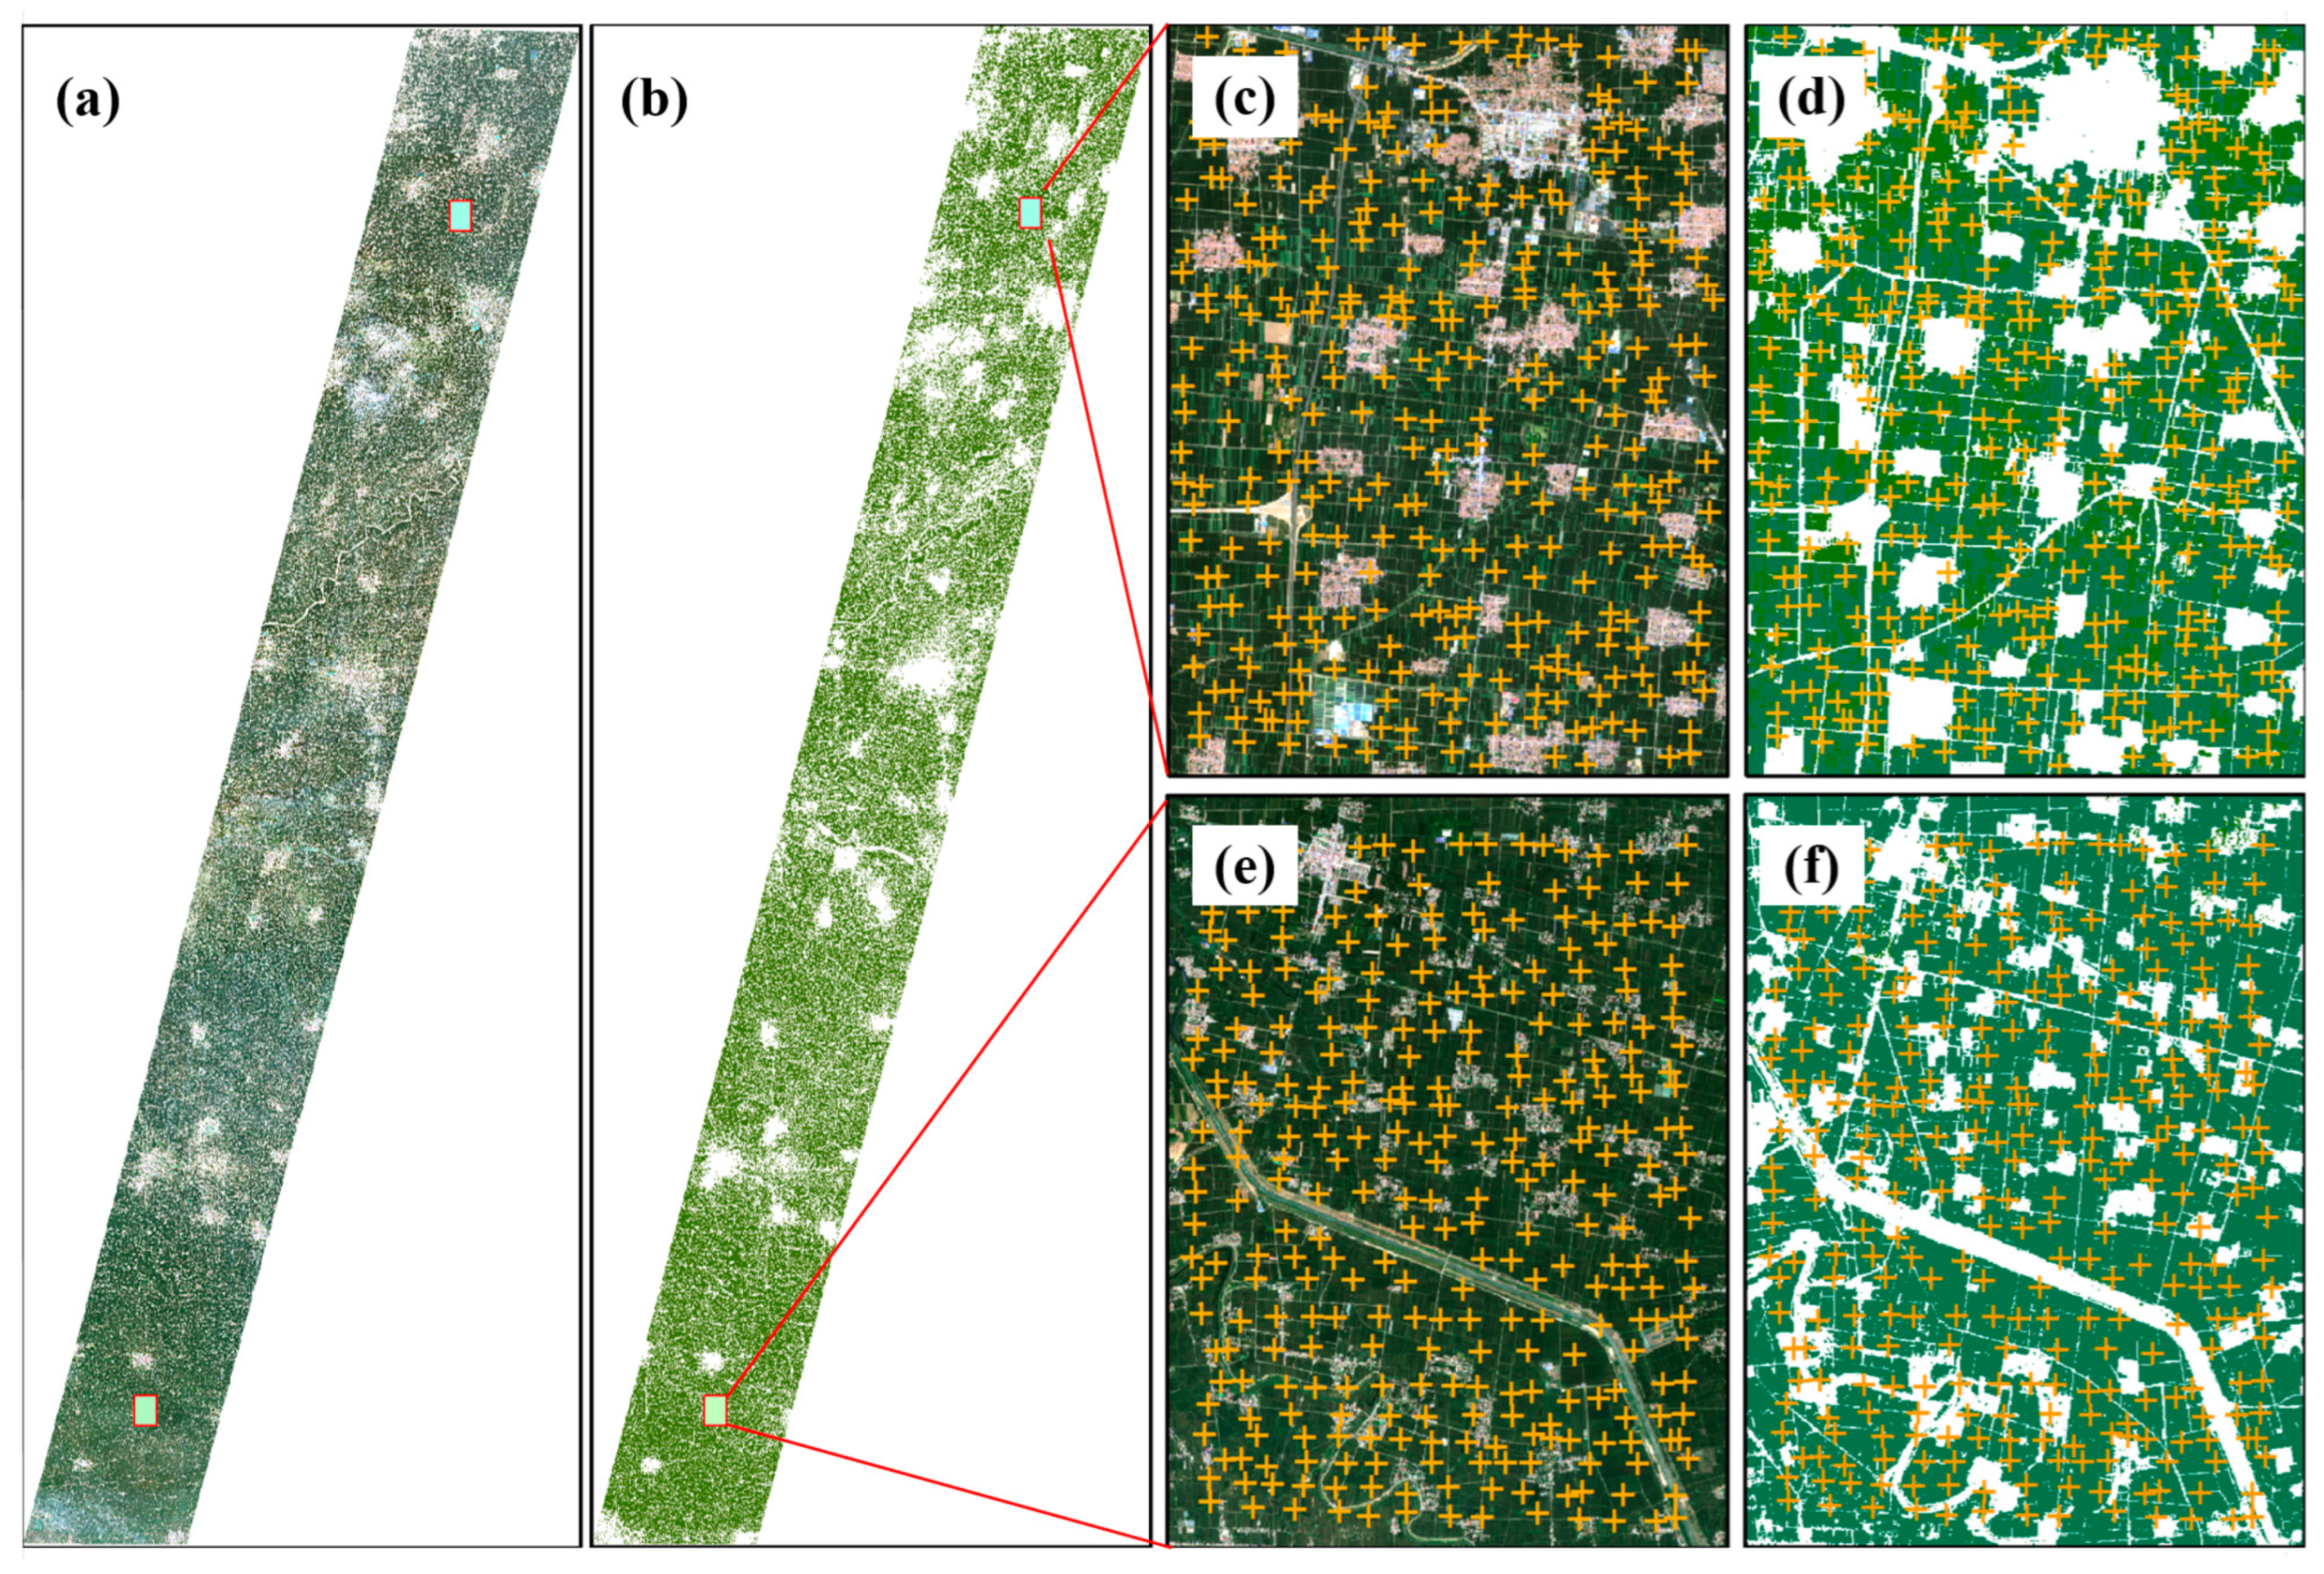
4.2. Extraction of Winter Wheat Planting Areas

On the basis of the proposed discrimination rules (NDVIjointing > 0.5 or NDVIfilling > 0.6) and (NDVIpost-harvest-1 < 0.3 or NDVIpost-harvest-2 < 0.3), this study analyzed the winter wheat farmland areas in the study area, with the results shown in Figure 5 and the confusion matrix presented in Table 6. The results (Table 6) indicated that 50 winter wheat pixels were misidentified as non-farmland, and two non-farmland pixels were misidentified as winter wheat fields, with OA = 95.67%, PA = 91.67%, UA = 99.64%, and Kappa = 0.9133. Our results demonstrate that the proposed method has high user accuracy, which is unsurprising since it relies on the unique phenological characteristics of winter wheat for area extraction, making it difficult for the other features in the study area to exhibit these characteristics. However, the producer accuracy was lower than the mapping accuracy, likely because the NDVI thresholds set in this study may be high (Figure 3), causing poorly growing winter wheat areas to not reach such high NDVI values. Some wheat fields may have exhibited lower NDVI than normal due to factors such as water deficiency, nitrogen deficiency, or pest and disease infestations. This is unsurprising, considering that only about 60% of farmland in the North China Plain receives irrigation, leaving it vulnerable to drought and secondary impacts [62].
Notably, this study’s winter wheat planting area extraction was conducted in the North China Plain wheat region, where the terrain is flat and field boundaries are often difficult to distinguish in 10 m resolution remote sensing images. Therefore, more winter wheat field annotation points are located within the field blocks, leading to insufficient consideration of the mixed pixels in the validation, resulting in a slightly higher statistical accuracy. Considering that (1) the study focused on extracting the spectral and VI characteristics of mature winter wheat and that (2) the study could not visually determine the ownership of the mixed pixels, the accuracy was not comprehensively compared.

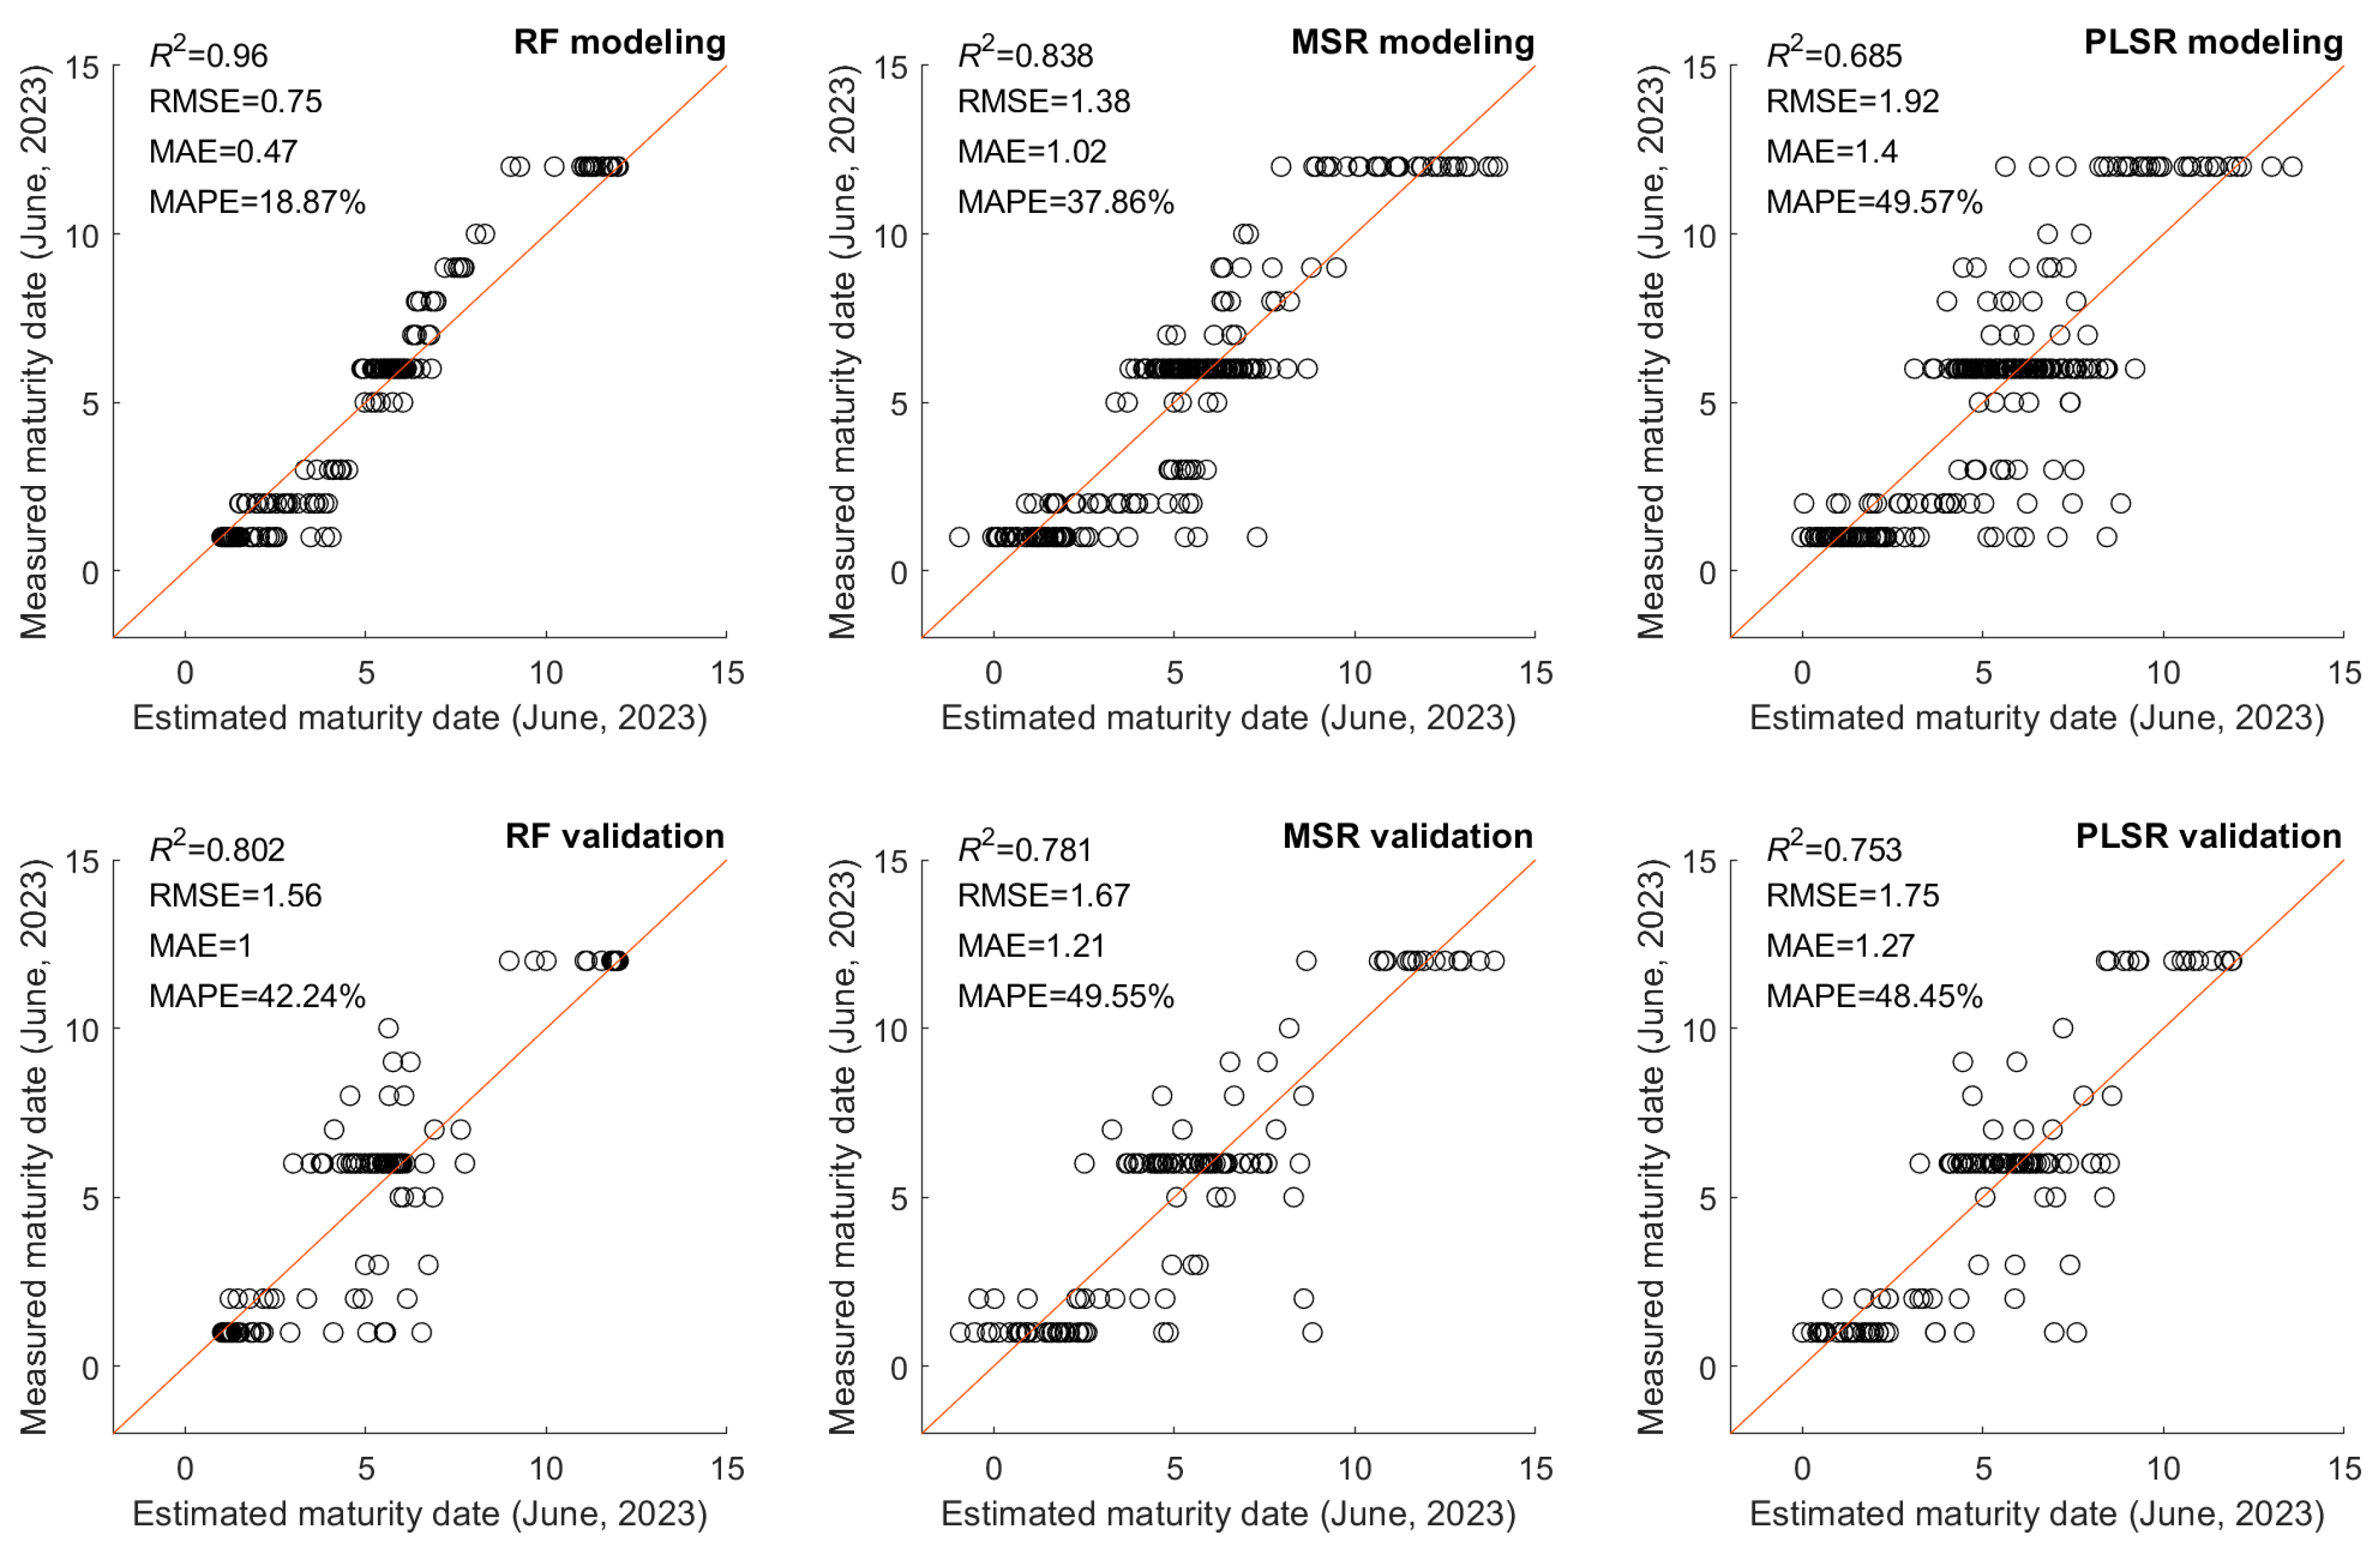
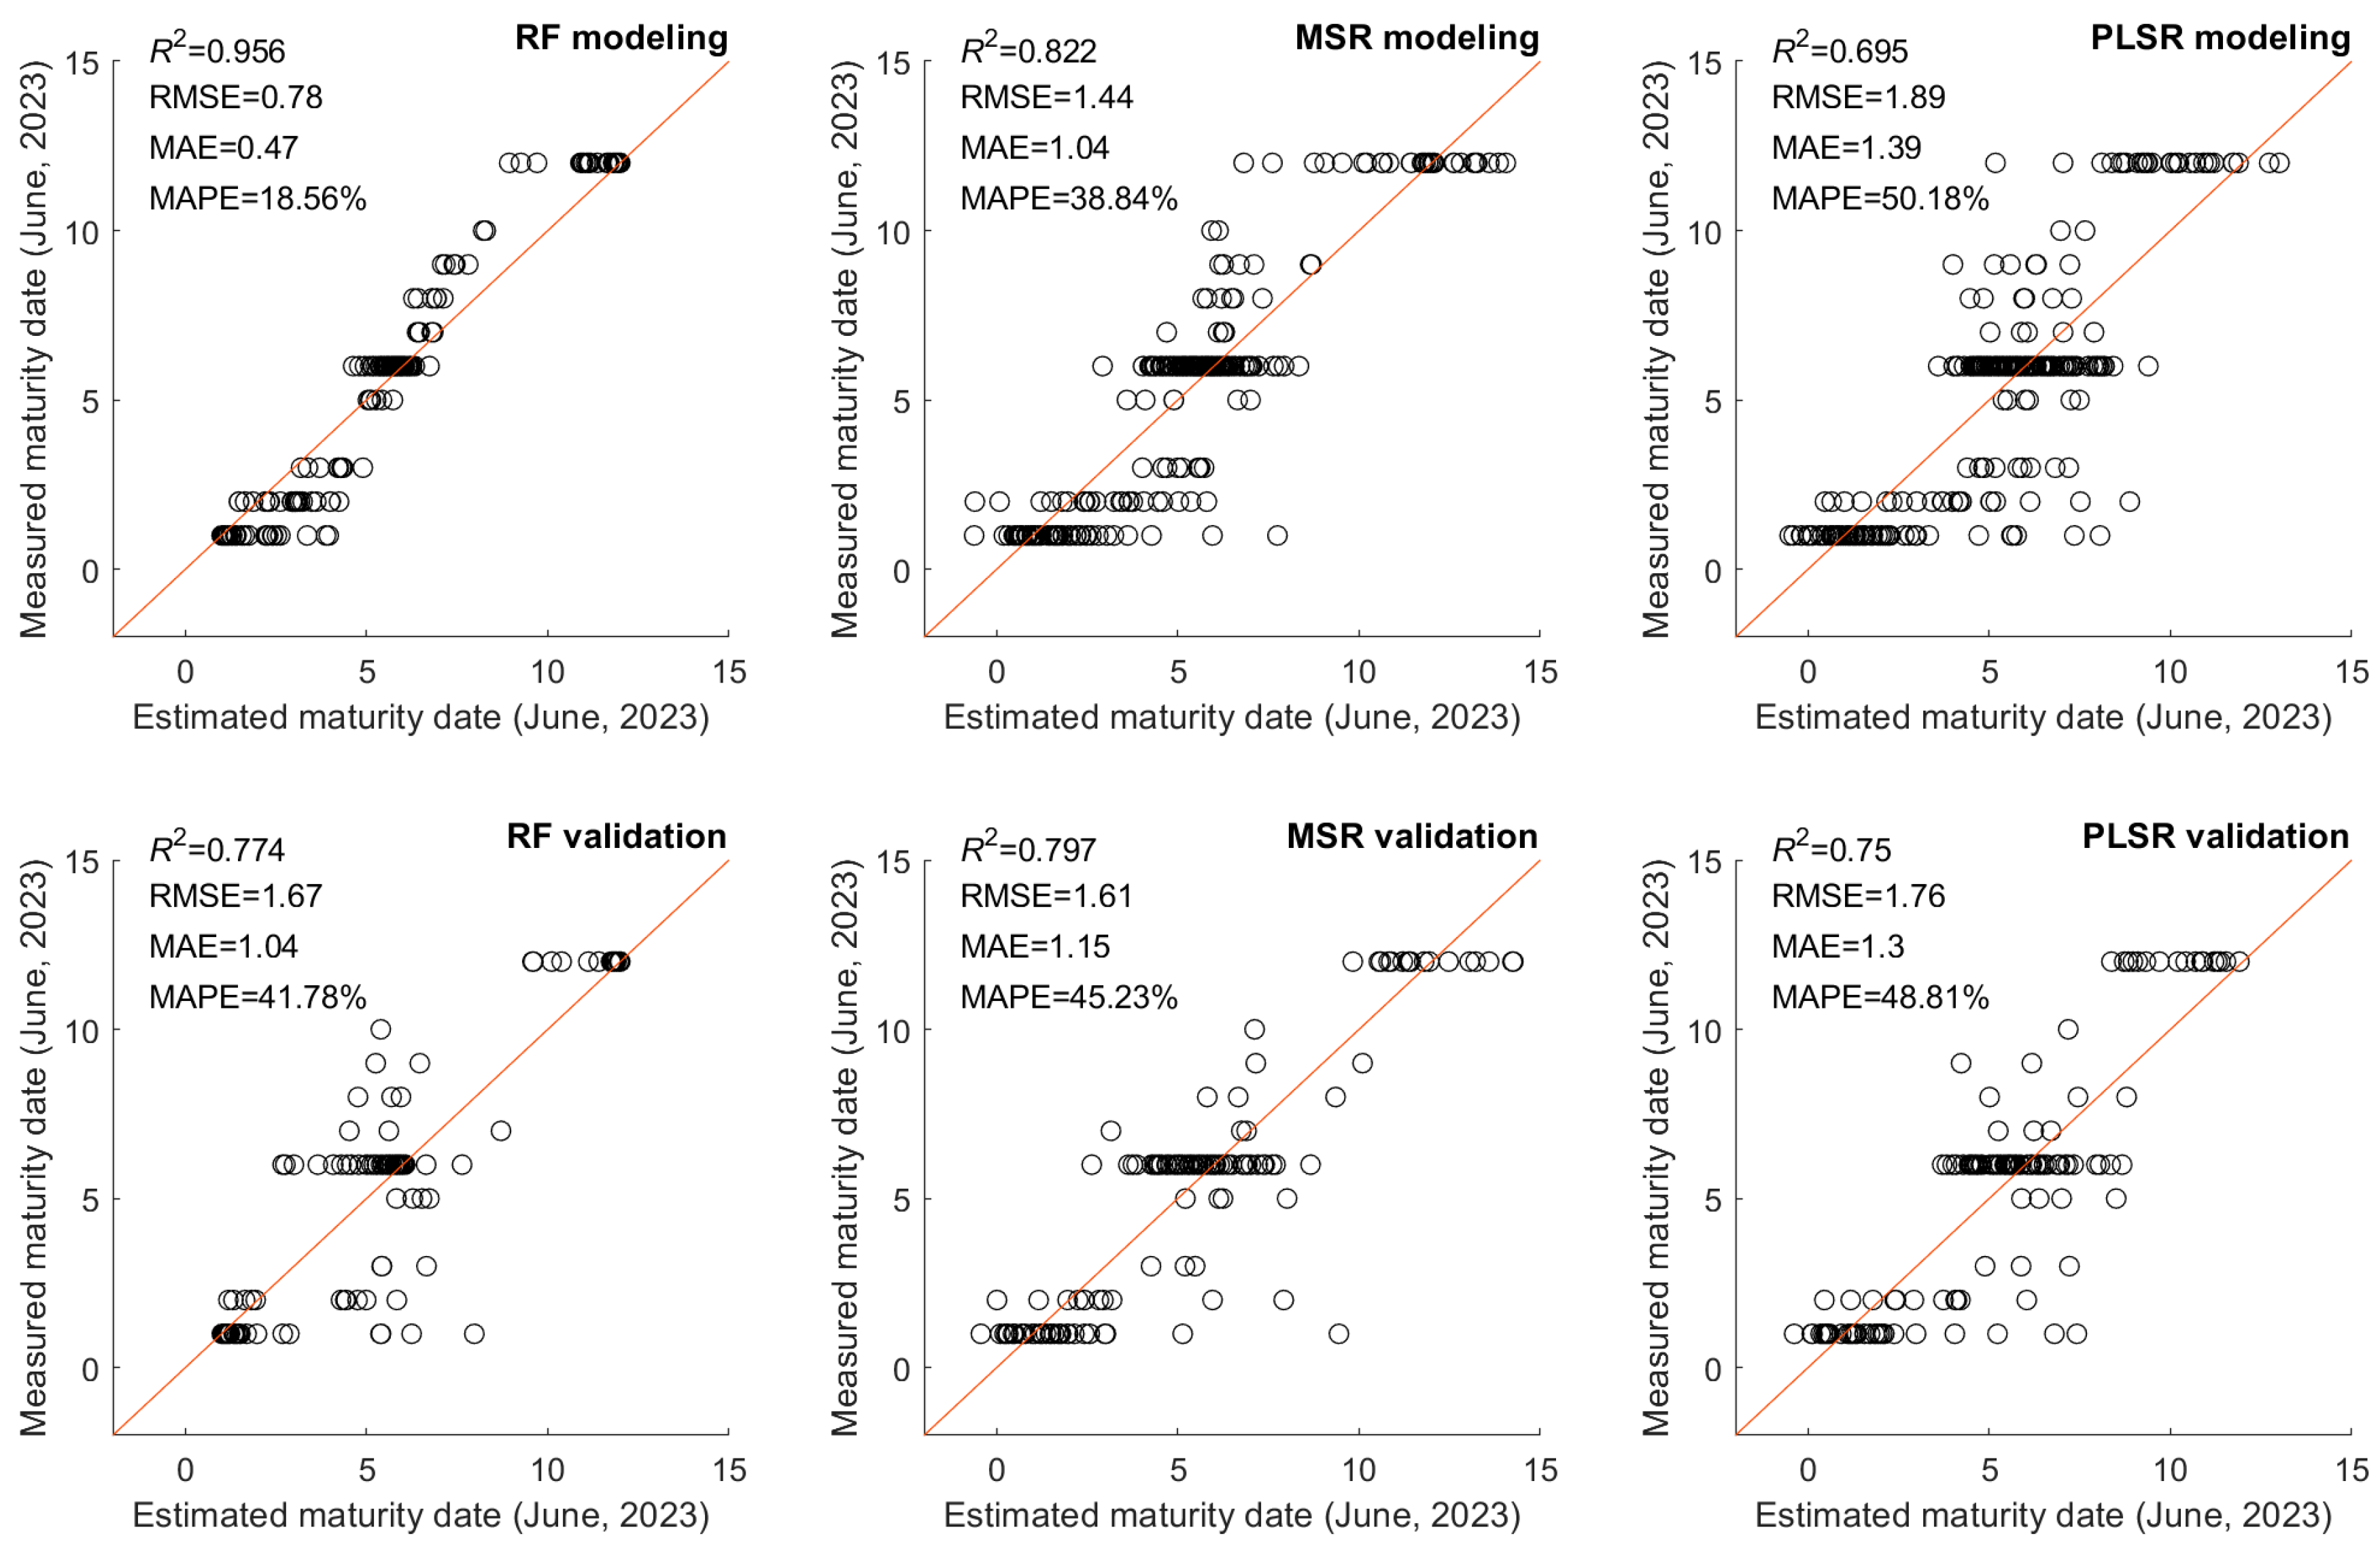
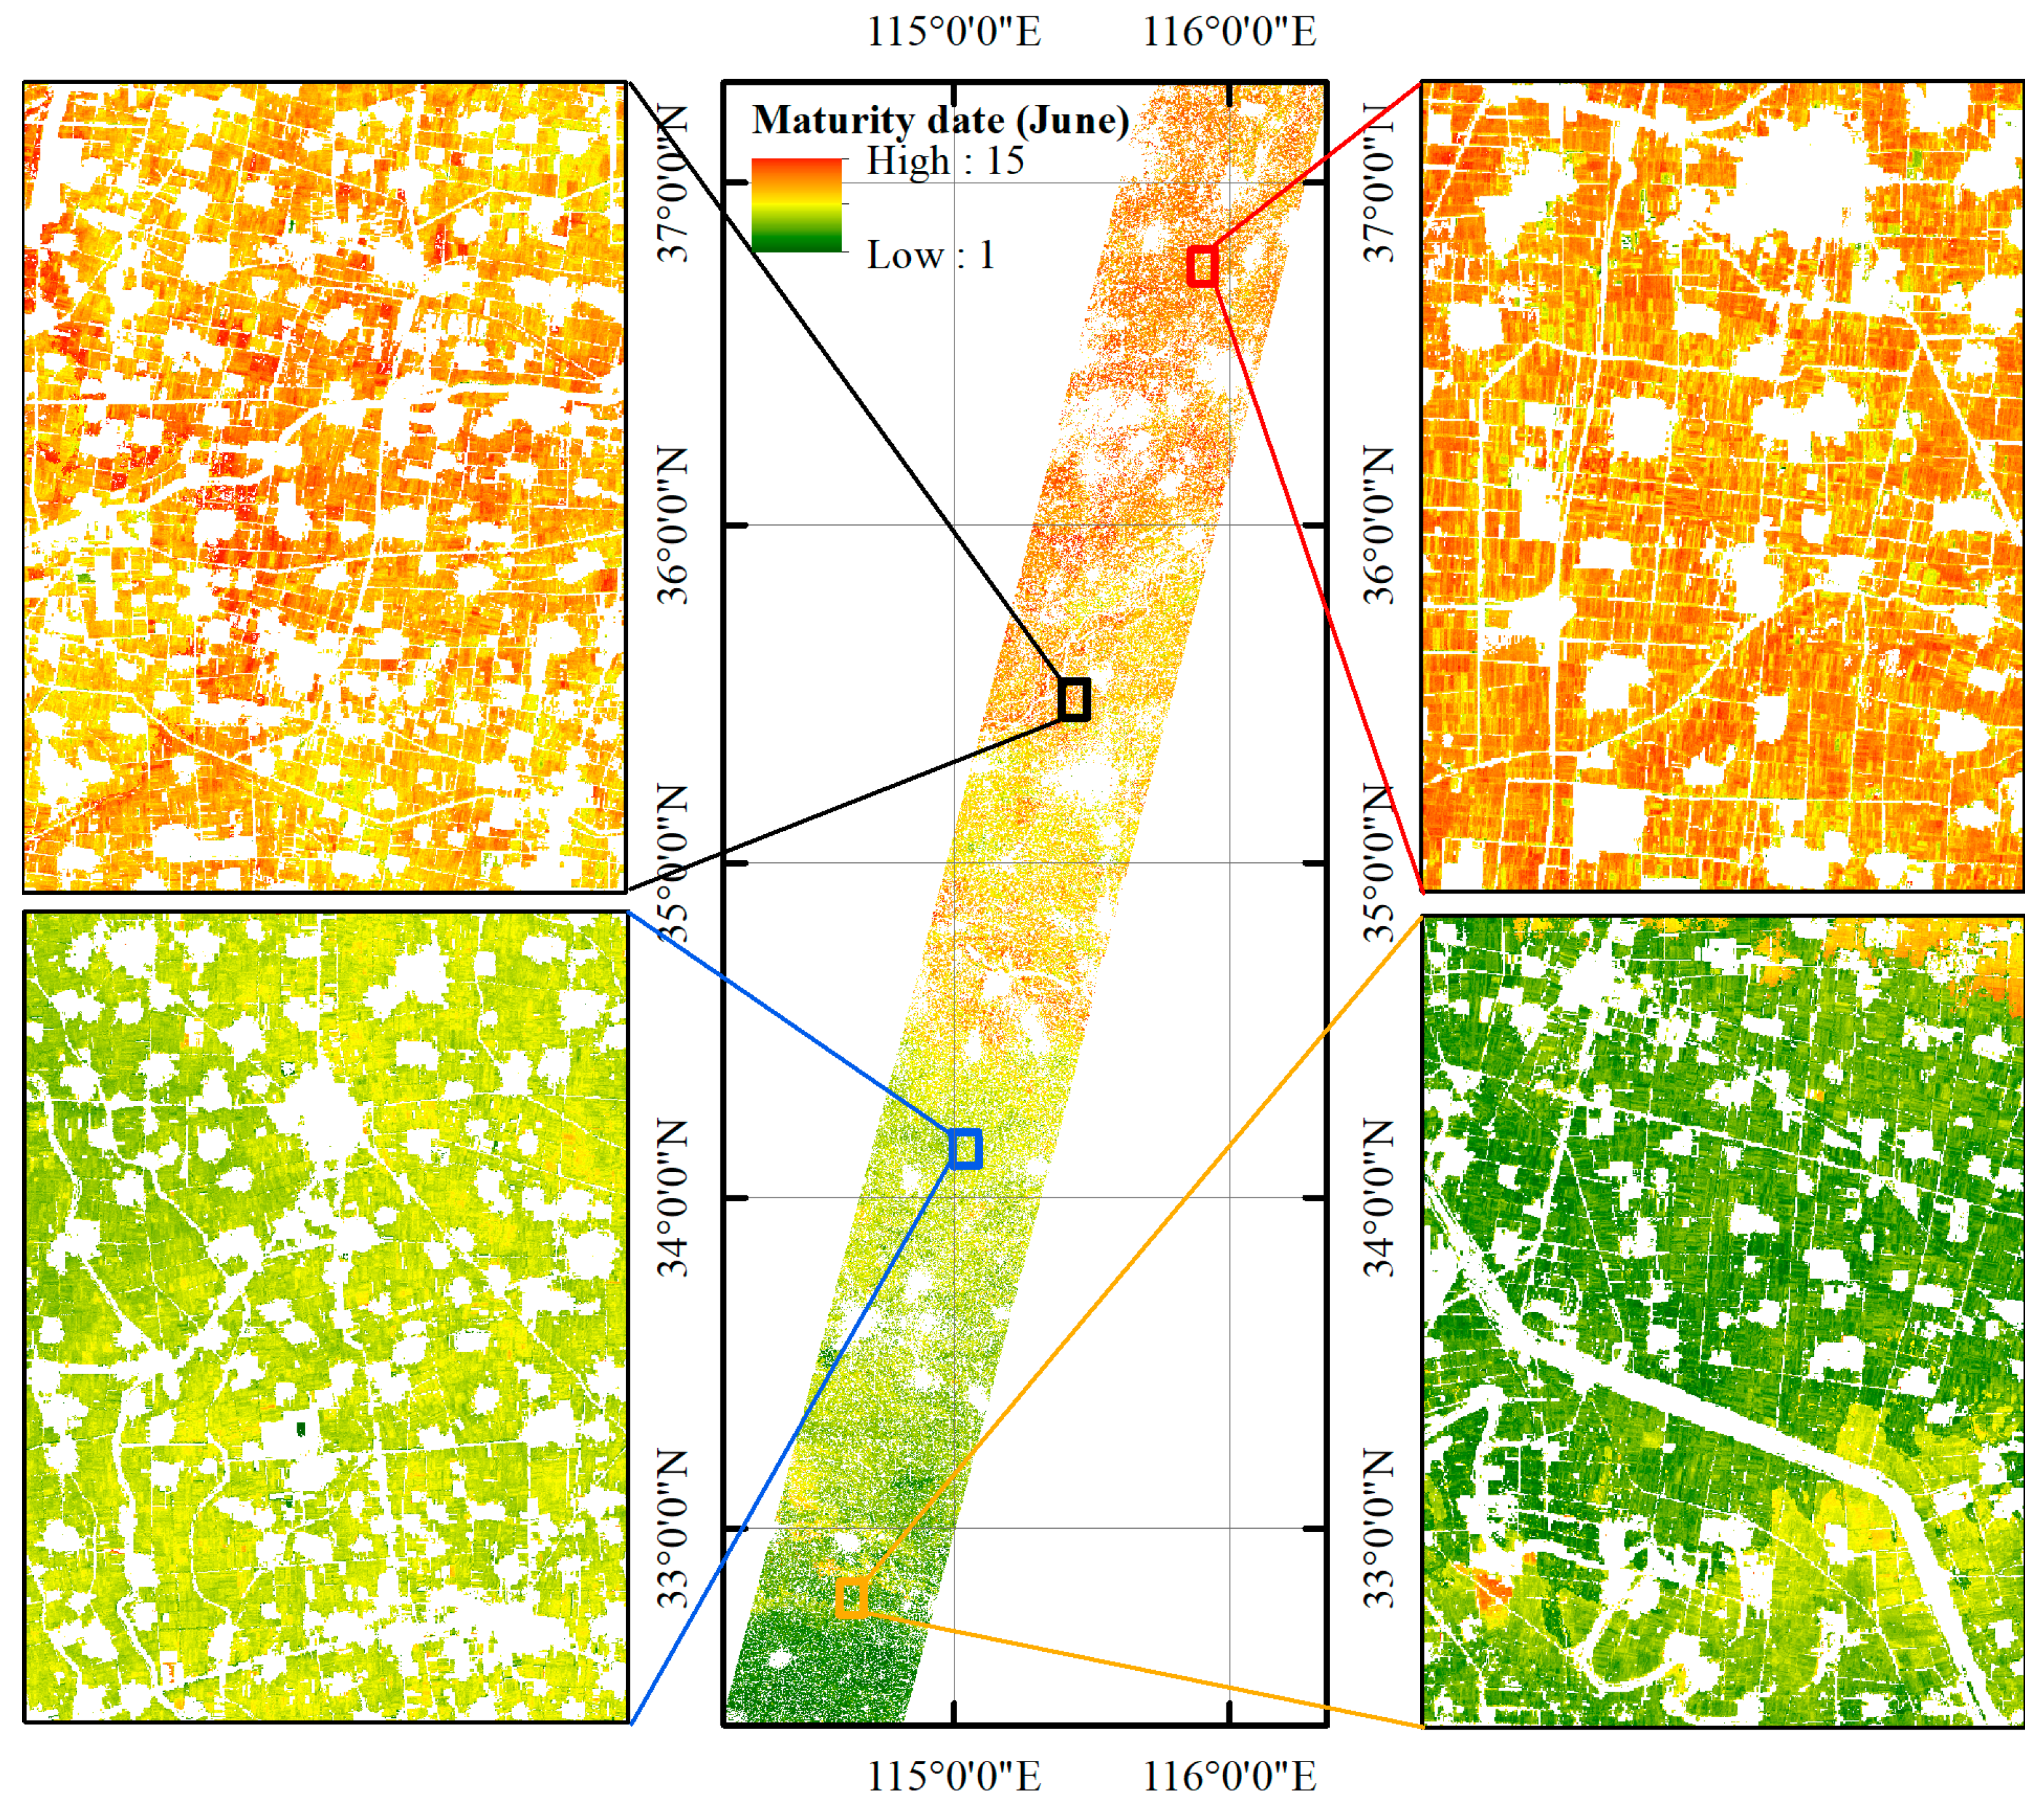
4.3. Winter Wheat Maturity Prediction

Figure 6 and Figure 7 show the accuracy of predicting winter wheat maturity via different models on the basis of remote sensing observations from the emergence to flowering and emergence to filling periods. The validation dataset indicated similar accuracies across the three maturity prediction models. Our results showed that (i) using the RF model combined with remote sensing observations from emergence to flowering can achieve the highest R2 (R2 = 0.802, RMSE = 1.56 days, MAE = 1.0 days, MAPE = 42.24%) and that (ii) the MSR model combined with remote sensing observations from emergence to filling can achieve the highest R2 (R2 = 0.797, RMSE = 1.61 days, MAE = 1.15 days, MAPE = 45.23%).
Considering that the MSR model could be implemented on the basis of simple band math and it helped to analyze which VI contributes to the maturity data, we used the MSR model to map winter wheat maturity. Figure 8 shows the predicted winter wheat maturity map in the study area based on Sentinel-2 MSI images from 5 November 2022 (emergence), to 24 May 2023 (filling). Specifically, winter wheat in the southern part of the study area matures first, whereas in the northern part, it matures the latest. This difference is expected due to the lower latitude of approximately 32° in the region’s south compared to around 37° in the north (Figure 8 and Figure 9). Southern winter wheat accumulates the necessary growing degree days for maturity sooner, leading to phenological stages occurring one to two weeks earlier than those in the north.
Using MPAE as the metric, the RF model (41.78%) combined with the emergence-flowering strategy (1) achieved the highest accuracy in predicting wheat maturity. Using RMSE as the metric, the RF model (1.56 days) combined with the emergence-filling strategy (2) also achieved the highest accuracy in predicting wheat maturity. This suggested that the RF model can provide superior maturity predictions compared to the MSR and PLSR models. However, the RF model is known for its black box nature, which complicates understanding why it outperforms MSR and PLSR in prediction accuracy.
The MSR and PLSR models offered explicit mathematical formulas that aid in agricultural decision making (Appendix A Table A1). For instance, the MSR formula excluded NDVI but included leaf water indices (such as NDII1 and NDII2), the chlorophyll index (such as NDRE), and enhanced vegetation indices (such as EVI and NDVI2). This underscores the sensitivity of wheat leaf pigment and canopy water content to maturity events. Our findings contribute to a better understanding and prediction of winter wheat maturity. The study results indicated that the MSR model can accurately extract winter wheat harvest information. Figure 9 shows the predicted winter wheat maturity in different latitudinal areas. Winter wheat in the study area starts maturing on 1 June 2023 and is almost fully mature by 11 June 2023. Areas further south mature earlier, whereas areas further north mature later. This is not surprising, as areas further south in the North China Plain typically have higher temperatures, simultaneously favoring the growth and development of winter wheat, leading to earlier phenological stages than in the northern areas.

5. Analysis and Discussion

5.1. Winter Wheat Planting Area Extraction Model

The extraction of winter wheat planting areas on the basis of multitemporal normalized difference vegetation index (NDVI) data involves the use of remote sensing technology to analyze the phenological characteristics of the ground objects, thereby determining crop growth regions [30,31,32,33]. Since the NDVI values vary significantly at different stages of the wheat growth cycle, analyzing multitemporal NDVI data can capture the dynamic changes during the wheat growth process and reflect the corresponding phenological characteristics [50]. By setting combination thresholds on the basis of prior knowledge and the NDVI characteristics of wheat at different growth stages, one can simply and intuitively identify wheat planting areas without extensive ground survey samples. Therefore, extracting the time series characteristics of wheat from multitemporal NDVI index data is crucial for accurately identifying winter wheat planting areas [30,37,38].
Winter wheat on the North China Plain has a distinct growth cycle; it is typically sown in the autumn, overwinters in the winter, regreens in the spring, and matures and is harvested in the summer [4,5]. The NDVI values at different growth stages change significantly; for example, the NDVI values are relatively high during the jointing to filling stages and decrease rapidly after harvest. These significant changes make monitoring the winter wheat growth process through multitemporal NDVI data straightforward and effective (Figure 3). In the North China Plain, other major crops, such as corn and soybeans, have different growth cycles than winter wheat; for example, corn and soybeans are usually sown in the spring and harvested in the autumn (Figure 3). Consequently, during winter and early spring, the NDVI values for corn and soybean fields are low, whereas winter wheat is in its peak growth period with high NDVI values. This seasonal difference clearly distinguishes winter wheat in terms of NDVI time series characteristics.
By integrating prior knowledge, such as the growth stages of winter wheat and corresponding NDVI characteristics, reasonable thresholds can be set to distinguish different crops and ground objects (Figure 3 and Figure 5). This approach does not require complex classification algorithms but rather simple threshold judgments to achieve high-accuracy extraction results for winter wheat planting areas. The findings of this study (Figure 3 and Figure 5) suggest that (i) the jointing to filling stages and (ii) post-harvest NDVI combinations are effective characteristics for distinguishing winter wheat, non-wheat vegetation, and other non-farmland areas, contributing to highly accurate extraction results for winter wheat planting areas. Notably, this study differs from traditional remote sensing image classification methods, such as supervised classification via machine learning and the time series-VI methods. Owing to local planting practices, the proposed strategy is specifically suitable for winter wheat crops in the North China Plain. The results indicate that 50 winter wheat pixels were misidentified as non-farmland, and two non-farmland pixels were misidentified as winter wheat fields, with OA = 95.67%, PA = 91.67%, UA = 99.64%, and Kappa = 0.9133. This implies that the study may still miss detecting winter wheat pixels, and future improvements in the model should be pursued in conjunction with other studies. Since the NDVI thresholds in this study may be high, winter wheat areas with poorer growth may not reach such high NDVI values. A possible solution is to lower the NDVI threshold for identifying winter wheat fields.

5.2. Winter Wheat Maturity Prediction Model

This study developed a calculation formula to predict the maturity of winter wheat by combining multiple periods of different remote sensing indices with the MSR model (Figure 7 and Figure 8). These indices include leaf water VIs (NDII1, NDII2), multifunctional VIs (NDVI, EVI, GNDVI, and NIRv), and chlorophyll red-edge indices (CIRE and NDRE). These combinations provide comprehensive crop growth information via different remote sensing indices at critical growth stages (Figure 8). For example, these combinations can effectively reflect the crop’s moisture status, health, and nutrient content at different growth stages, especially during key periods such as regreening and jointing, thereby providing accurate maturity predictions by monitoring rapid growth phases. Our study also revealed that different VIs contribute differently to predicting winter wheat maturity. For example, red-edge VIs (S2-NDRE, S4-CIRE, S6-CIRE, S6-NDRE, and S10-CIRE) and moisture indices (S1-NDII1, S3-NDII2, S5-NDII2, and S6-NDII1) are more critical for maturity prediction. The NDVI is not in the optimal MSR model. This is not surprising, as the NDVI is very prone to saturation. The enhancement index of NDVI, NDVI2, is in the optimal MSR model. This is unsurprising, as pigments and water are essential catalysts and raw materials for crop photosynthesis, and they are crucial for analyzing various phenological and physiological phenomena of winter wheat [50,51]. Additionally, the contributions of different growth periods to crop maturity predictions vary. Specifically, the MSR model uses jointing stage indices such as the NDVI2, EVI, CIRE, NDRE, and NDII1 to assess winter wheat maturity, indicating that crop vigor, nutrient status, and the moisture conditions during the jointing stage are vital for determining winter wheat maturity.
The phenological stages of crops are influenced by uncertain meteorological conditions, cultivation practices, and field management. A systematic bias typically exists between the maturity period based on mathematical feature point extraction and the agronomic maturity period. Therefore, current methods for extracting remote sensing information on wheat maturity have low accuracy and make supporting agricultural production decisions challenging. For example, Sakamoto et al. [36] and Zhao et al. [35] reported that the accuracy of satellite-based extraction of wheat maturity was RMSE = 15.7 days and MAE = 11.2 days, respectively. The proposed method can offer the highest accuracy in predicting the maturity at the winter wheat flowering stage (R2 = 0.802, RMSE = 1.56 days), aiding in a timely and comprehensive understanding of winter wheat maturity and in deploying large-scale harvesters within the region.

5.3. Limitations and Uncertainty of This Work

This study provides a scientific basis for predicting winter wheat maturity. However, practical applications have limitations because of insufficient consideration of the remote sensing data resolution, crop diversity, and regional differences. First, the study did not account for mixed pixel effects, which present limitations when applied to MODIS imagery. Agriculture in the North China Plain is primarily family-based, with small field sizes, making most 1 km scale MODIS imagery mixed pixels [16]. Mixed pixel effects lead to multiple different ground object reflectances within a single pixel, thereby impacting the precision of the classification results. Therefore, higher-resolution remote sensing data (such as Landsat or Sentinel imagery) could yield more accurate results. A potential solution could be integrating Landsat or Sentinel images using deep learning methods to obtain higher-resolution remote sensing data and address the issue of mixed pixel effects. This approach can improve accuracy by reducing the influence of mixed pixels, especially in regions with smaller fields. Second, the model in this study was tested only on winter wheat and was not validated for other crops, such as corn and soybeans. This limits the model’s applicability, as its accuracy and reliability cannot be guaranteed for other crops. Different crops have varied growth cycles and phenological characteristics, necessitating independent modeling and validation to ensure the generalizability and accuracy of the prediction model. Additionally, the study tested the model only in the principal wheat production area of the North China Plain and requires more validation in other regions. Thus, the method’s generalizability and applicability require further research and verification.
Future work should consider integrating other data sources, such as weather data, soil information, and historical crop management practices. This holistic approach can enhance the model’s predictive capability by providing a more comprehensive understanding of crop growth and maturity. We should explore and implement advanced modeling techniques to adapt to the complexity of agricultural systems and remote sensing data. This may involve integrated approaches, machine learning methods, or hybrid models to effectively combine field observations with remote sensing data. Furthermore, more meaningful work could involve exploring the translation of the research findings into specific supporting technologies. For instance, applying maturity prediction approaches to operational applications in agriculture of varying scales.

6. Conclusions

The primary goal of this study was to propose a method for predicting winter wheat maturity via multitemporal remote sensing data. Our research reached the following conclusions:
(i)
Integration of the NDVI of the (a) jointing-heading and (b) maturation-harvesting stages can provide high-precision extraction of winter wheat planting areas.
(ii)
Utilizing the MSR model, RF model, and multitemporal multispectral remote sensing data enables high-performance prediction of winter wheat maturity. The proposed method offers the highest accuracy in predicting maturity at the winter wheat flowering stage, aiding in a timely and comprehensive understanding of the winter wheat maturity and in deploying large-scale harvesters within the region.
The method proposed in this study has the potential to significantly improve the efficiency of monitoring winter wheat maturation and harvesting. It can provide accurate predictions of winter wheat maturity, helping agricultural management departments adopt information-based measures, thus promoting the efficiency of precision agricultural operations and informatization efforts. Future work should consider integrating other data sources, such as weather data, soil information, and historical crop management practices. In addition, future studies should explore and implement advanced modeling techniques (such as deep learning methods) to adapt to the complexity of agricultural systems and remote sensing data. Furthermore, more meaningful work could involve exploring the translation of the research findings into specific supporting technologies. For instance, applying maturity prediction approaches to operational applications in agriculture of varying scales.

Author Contributions

Methodology, J.Y.; Validation, J.Y., H.Y. and Q.L.; Investigation, T.L., J.S., Y.W., X.X., Y.L., H.F., X.M., C.L., G.Y., H.Q. and H.Y.; Writing—original draft, J.Y.; Writing—review & editing, T.L., J.S., Y.W., X.X., Y.L., H.F., X.M., C.L., G.Y., H.Q., H.Y. and Q.L.; Funding acquisition, J.Y. All authors have read and agreed to the published version of the manuscript.

Funding

This research was funded by the Henan Province Science and Technology Research Project, China (232102111123), the National Natural Science Foundation of China (42101362), the National Key Research and Development Program of China (2021YFD2000102, 2022YFD2001104, 2023YFD2000102), and the Science and Technology Program of Ministry of Public Security (2022JC32).

Institutional Review Board Statement

Not applicable.

Data Availability Statement

Dataset available on request from the authors.

Conflicts of Interest

The authors declare no conflict of interest.

Appendix A

Table A1 shows the MSR and PLSR model parameters for the two strategies.
Table A1. MSR and PLSR model parameters for the two strategies.
StrategiesStrategy (1)Strategy (2)StrategiesStrategy (1)Strategy (2)
ModelsMSRPLSRMSRPLSRModelsMSRPLSRMSRPLSR
Constants3.001 6.397 5.967 5.918 -----
S1GNDVI0.000 0.280 0.000 0.436 S6GNDVI0.000 −0.821 0.000 −1.069
NDVI0.000 −0.504 5.765 −0.567 NDVI0.000 −0.634 0.000 −0.859
NDVI20.000 −0.037 0.000 −0.017 NDVI2−13.718 −0.488 −18.668 −0.630
RDVI0.000 0.288 0.000 0.436 RDVI0.000 −0.447 0.000 −0.632
SAVI0.000 0.427 0.000 0.604 SAVI0.000 −0.396 0.000 −0.565
OSAVI0.000 −0.110 0.000 −0.071 OSAVI0.000 −0.524 0.000 −0.724
EVI0.000 −0.993 0.000 −0.722 EVI52.601 −0.587 0.000 −1.081
CIRE0.000 0.244 0.000 0.359 CIRE0.830 −0.014 0.000 0.001
NDRE0.000 −0.267 0.000 −0.175 NDRE−25.486 −0.485 0.000 −0.630
NDII1−4.533 −0.969 0.000 −1.459 NDII131.536 −0.156 39.474 −0.166
NDII20.000 −1.114 −7.869 −1.454 NDII20.000 −0.471 0.000 −0.593
NIRV0.000 2.172 0.000 2.775 NIRV0.000 −0.268 0.000 −0.348
S2GNDVI0.000 0.691 0.000 0.882 S7GNDVI16.028 1.263 15.582 1.554
NDVI0.000 0.204 0.000 0.226 NDVI0.000 0.647 28.630 0.701
NDVI20.000 0.328 0.000 0.409 NDVI20.000 0.976 0.000 1.181
RDVI0.000 0.375 0.000 0.394 RDVI0.000 1.143 0.000 1.406
SAVI0.000 0.341 0.000 0.352 SAVI0.000 1.077 0.000 1.322
OSAVI0.000 0.251 0.000 0.260 OSAVI0.000 0.841 0.000 0.981
EVI0.000 −0.122 0.000 −0.382 EVI0.000 −0.500 0.000 −1.103
CIRE0.000 0.207 0.000 0.269 CIRE0.000 0.099 0.000 0.152
NDRE25.320 0.819 23.703 0.967 NDRE0.000 0.819 −43.237 1.000
NDII10.000 0.340 0.000 0.335 NDII10.000 0.434 0.000 0.574
NDII20.000 −0.026 0.000 −0.076 NDII20.000 0.191 0.000 0.199
NIRV0.000 0.806 0.000 0.934 NIRV0.000 1.906 0.000 2.507
S3GNDVI0.000 −0.579 0.000 −0.639 S8GNDVI0.000 0.895 0.000 1.243
NDVI0.000 −0.512 0.000 −0.606 NDVI0.000 −0.047 0.000 0.003
NDVI20.000 −0.065 0.000 −0.037 NDVI20.000 0.548 0.000 0.774
RDVI0.000 −0.245 0.000 −0.307 RDVI0.000 0.768 0.000 1.154
SAVI0.000 −0.207 0.000 −0.266 SAVI0.000 0.735 0.000 1.099
OSAVI0.000 −0.358 0.000 −0.437 OSAVI0.000 0.318 0.000 0.514
EVI−77.441 −1.976 −70.848 −2.540 EVI0.000 −2.677 0.000 −2.833
CIRE0.000 0.038 0.000 0.043 CIRE0.000 0.151 0.000 0.227
NDRE0.000 −0.075 0.000 −0.169 NDRE0.000 1.068 22.872 1.459
NDII10.000 −0.326 0.000 −0.495 NDII10.000 0.242 −17.831 0.405
NDII28.013 −0.518 0.000 −0.675 NDII20.000 −0.082 0.000 −0.060
NIRV0.000 0.341 0.000 0.429 NIRV0.000 1.822 0.000 2.636
S4GNDVI0.000 −0.077 0.000 −0.026 S9GNDVI0.000 −1.204 −14.801 −1.119
NDVI0.000 −0.481 0.000 −0.509 NDVI0.000 −1.458 0.000 −1.480
NDVI20.000 −0.264 0.000 −0.262 NDVI20.000 −0.931 0.000 −0.838
RDVI0.000 −0.368 0.000 −0.395 RDVI0.000 −0.911 0.000 −0.476
SAVI0.000 −0.341 0.000 −0.368 SAVI0.000 −0.788 0.000 −0.350
OSAVI0.000 −0.418 0.000 −0.449 OSAVI0.000 −1.162 0.000 −0.971
EVI0.000 −2.165 0.000 −2.393 EVI0.000 −1.059 0.000 0.699
CIRE−1.000 −0.113 0.000 −0.157 CIRE0.000 0.129 0.835 0.219
NDRE0.000 −1.077 0.000 −1.258 NDRE0.000 0.251 0.000 0.761
NDII10.000 −0.848 0.000 −0.949 NDII10.000 0.019 0.000 0.634
NDII20.000 −0.763 0.000 −0.860 NDII20.000 −0.415 0.000 −0.095
NIRV0.000 −0.056 0.000 −0.040 NIRV−11.468 −0.092 0.000 0.870
S5GNDVI0.000 −0.680 0.000 −0.830 S10GNDVI0.000 0.180
NDVI0.000 −0.767 0.000 −0.962 NDVI0.000 −0.577
NDVI20.000 −0.589 −7.182 −0.760 NDVI20.000 0.108
RDVI0.000 −0.608 0.000 −0.761 RDVI0.000 0.344
SAVI0.000 −0.544 0.000 −0.684 SAVI0.000 0.419
OSAVI0.000 −0.674 0.000 −0.851 OSAVI0.000 −0.117
EVI0.000 −2.654 0.000 −3.269 EVI0.000 −0.467
CIRE0.000 −0.101 0.000 −0.128 CIRE0.665 0.311
NDRE0.000 −0.999 0.000 −1.214 NDRE0.000 1.600
NDII10.000 −0.892 0.000 −1.120 NDII10.000 1.868
NDII2−30.131 −0.884 −23.086 −1.087 NDII20.000 0.595
NIRV23.287 −0.320 32.302 −0.378 NIRV0.000 1.772
Note: NDVI2: NDVI × NDVI.

References

  1. Hazard, B.; Trafford, K.; Lovegrove, A.; Griffiths, S.; Uauy, C.; Shewry, P. Strategies to Improve Wheat for Human Health. Nat. Food 2020, 1, 475–480. [Google Scholar] [CrossRef]
  2. Asseng, S.; Ewert, F.; Martre, P.; Rötter, R.P.; Lobell, D.B.; Cammarano, D.; Kimball, B.A.; Ottman, M.J.; Wall, G.W.; White, J.W.; et al. Rising Temperatures Reduce Global Wheat Production. Nat. Clim. Chang. 2015, 5, 143–147. [Google Scholar] [CrossRef]
  3. Wang, S.; Mo, X.; Liu, Z.; Baig, M.H.A.; Chi, W. Understanding Long-Term (1982–2013) Patterns and Trends in Winter Wheat Spring Green-up Date over the North China Plain. Int. J. Appl. Earth Obs. Geoinf. 2017, 57, 235–244. [Google Scholar] [CrossRef]
  4. Li, F.; Miao, Y.; Feng, G.; Yuan, F.; Yue, S.; Gao, X.; Liu, Y.; Liu, B.; Ustin, S.L.; Chen, X. Improving Estimation of Summer Maize Nitrogen Status with Red Edge-Based Spectral Vegetation Indices. Field Crops Res. 2014, 157, 111–123. [Google Scholar] [CrossRef]
  5. Tao, G.; Jia, K.; Wei, X.; Xia, M.; Wang, B.; Xie, X.; Jiang, B.; Yao, Y.; Zhang, X. Improving the Spatiotemporal Fusion Accuracy of Fractional Vegetation Cover in Agricultural Regions by Combining Vegetation Growth Models. Int. J. Appl. Earth Obs. Geoinf. 2021, 101, 102362. [Google Scholar] [CrossRef]
  6. Yue, J.; Tian, Q.; Liu, Y.; Fu, Y.; Tian, J.; Zhou, C.; Feng, H.; Yang, G. Mapping Cropland Rice Residue Cover Using a Radiative Transfer Model and Deep Learning. Comput. Electron. Agric. 2023, 215, 108421. [Google Scholar] [CrossRef]
  7. Yue, J.; Tian, J.; Philpot, W.; Tian, Q.; Feng, H.; Fu, Y. VNAI-NDVI-Space and Polar Coordinate Method for Assessing Crop Leaf Chlorophyll Content and Fractional Cover. Comput. Electron. Agric. 2023, 207, 107758. [Google Scholar] [CrossRef]
  8. Wang, L.; Gao, R.; Li, C.; Wang, J.; Liu, Y.; Hu, J.; Li, B.; Qiao, H.; Feng, H.; Yue, J. Mapping Soybean Maturity and Biochemical Traits Using UAV-Based Hyperspectral Images. Remote Sens. 2023, 15, 4807. [Google Scholar] [CrossRef]
  9. Lindsey, A.J.; Craft, J.C.; Barker, D.J. Modeling Canopy Senescence to Calculate Soybean Maturity Date Using NDVI. Crop Sci. 2020, 60, 172–180. [Google Scholar] [CrossRef]
  10. Trevisan, R.; Pérez, O.; Schmitz, N.; Diers, B.; Martin, N. High-Throughput Phenotyping of Soybean Maturity Using Time Series UAV Imagery and Convolutional Neural Networks. Remote Sens. 2020, 12, 3617. [Google Scholar] [CrossRef]
  11. Diao, C. Remote Sensing Phenological Monitoring Framework to Characterize Corn and Soybean Physiological Growing Stages. Remote Sens. Environ. 2020, 248, 111960. [Google Scholar] [CrossRef]
  12. Yue, J.; Yang, G.; Li, C.; Li, Z.; Wang, Y.; Feng, H.; Xu, B. Estimation of Winter Wheat Above-Ground Biomass Using Unmanned Aerial Vehicle-Based Snapshot Hyperspectral Sensor and Crop Height Improved Models. Remote Sens. 2017, 9, 708. [Google Scholar] [CrossRef]
  13. Yue, J.; Yang, H.; Yang, G.; Fu, Y.; Wang, H.; Zhou, C. Estimating Vertically Growing Crop Above-Ground Biomass Based on UAV Remote Sensing. Comput. Electron. Agric. 2023, 205, 107627. [Google Scholar] [CrossRef]
  14. Yue, J.; Yang, G.; Li, C.; Liu, Y.; Wang, J.; Guo, W.; Ma, X.; Niu, Q.; Qiao, H.; Feng, H. Analyzing Winter-Wheat Biochemical Traits Using Hyperspectral Remote Sensing and Deep Learning. Comput. Electron. Agric. 2024, 222, 109026. [Google Scholar] [CrossRef]
  15. Yue, J.; Feng, H.; Li, Z.; Zhou, C.; Xu, K. Mapping Winter-Wheat Biomass and Grain Yield Based on a Crop Model and UAV Remote Sensing. Int. J. Remote Sens. 2021, 42, 1577–1601. [Google Scholar] [CrossRef]
  16. Wu, B.; Zhang, M.; Zeng, H.; Tian, F.; Potgieter, A.B.; Qin, X.; Yan, N.; Chang, S.; Zhao, Y.; Dong, Q.; et al. Challenges and Opportunities in Remote Sensing-Based Crop Monitoring: A Review. Natl. Sci. Rev. 2023, 10, nwac290. [Google Scholar] [CrossRef] [PubMed]
  17. Lalechère, E.; Monnet, J.-M.; Breen, J.; Fuhr, M. Assessing the Potential of Remote Sensing-Based Models to Predict Old-Growth Forests on Large Spatiotemporal Scales. J. Environ. Manag. 2024, 351, 119865. [Google Scholar] [CrossRef] [PubMed]
  18. Zhao, Y.; Xiao, D.; Bai, H. The Simultaneous Prediction of Yield and Maturity Date for Wheat–Maize by Combining Satellite Images with Crop Model. J. Sci. Food Agric. 2024. Jun (Early Access). [Google Scholar] [CrossRef] [PubMed]
  19. d’Andrimont, R.; Taymans, M.; Lemoine, G.; Ceglar, A.; Yordanov, M.; van der Velde, M. Detecting Flowering Phenology in Oil Seed Rape Parcels with Sentinel-1 and -2 Time Series. Remote Sens. Environ. 2020, 239, 111660. [Google Scholar] [CrossRef]
  20. Belaqziz, S.; Khabba, S.; Kharrou, M.H.; Bouras, E.H.; Er-Raki, S.; Chehbouni, A. Optimizing the Sowing Date to Improve Water Management and Wheat Yield in a Large Irrigation Scheme, through a Remote Sensing and an Evolution Strategy-Based Approach. Remote Sens. 2021, 13, 3789. [Google Scholar] [CrossRef]
  21. Gao, F.; Zhang, X. Mapping Crop Phenology in Near Real-Time Using Satellite Remote Sensing: Challenges and Opportunities. J. Remote Sens. 2021, 2021, 8379391. [Google Scholar] [CrossRef]
  22. Zhang, M.; Abrahao, G.; Cohn, A.; Campolo, J.; Thompson, S. A MODIS-Based Scalable Remote Sensing Method to Estimate Sowing and Harvest Dates of Soybean Crops in Mato Grosso, Brazil. Heliyon 2021, 7, e07436. [Google Scholar] [CrossRef]
  23. Islam, M.M.; Matsushita, S.; Noguchi, R.; Ahamed, T. Development of Remote Sensing-Based Yield Prediction Models at the Maturity Stage of Boro Rice Using Parametric and Nonparametric Approaches. Remote Sens. Appl. Soc. Environ. 2021, 22, 100494. [Google Scholar] [CrossRef]
  24. Zafar, Z.; Zubair, M.; Zha, Y.; Fahd, S.; Ahmad Nadeem, A. Performance Assessment of Machine Learning Algorithms for Mapping of Land Use/Land Cover Using Remote Sensing Data. Egypt. J. Remote Sens. Space Sci. 2024, 27, 216–226. [Google Scholar] [CrossRef]
  25. Chang, Z.; Li, H.; Chen, D.; Liu, Y.; Zou, C.; Chen, J.; Han, W.; Liu, S.; Zhang, N. Crop Type Identification Using High-Resolution Remote Sensing Images Based on an Improved DeepLabV3+ Network. Remote Sens. 2023, 15, 5088. [Google Scholar] [CrossRef]
  26. Dong, J.; Fu, Y.; Wang, J.; Tian, H.; Fu, S.; Niu, Z.; Han, W.; Zheng, Y.; Huang, J.; Yuan, W. Early-Season Mapping of Winter Wheat in China Based on Landsat and Sentinel Images. Earth Syst. Sci. Data 2020, 12, 3081–3095. [Google Scholar] [CrossRef]
  27. Ayhan, B.; Kwan, C. Tree, Shrub, and Grass Classification Using Only RGB Images. Remote Sens. 2020, 12, 1333. [Google Scholar] [CrossRef]
  28. Yue, J.; Feng, H.; Yang, G.; Li, Z. A Comparison of Regression Techniques for Estimation of Above-Ground Winter Wheat Biomass Using Near-Surface Spectroscopy. Remote Sens. 2018, 10, 66. [Google Scholar] [CrossRef]
  29. Sun, J.; Di, L.; Sun, Z.; Shen, Y.; Lai, Z. County-Level Soybean Yield Prediction Using Deep CNN-LSTM Model. Sensors 2019, 19, 4363. [Google Scholar] [CrossRef]
  30. Amherdt, S.; Nieto, L.; Carcedo, A.J.P.; Pereira, A.; Cornero, C.; Ciampitti, I.A. Field Maturity Detection via Interferometric Synthetic Aperture Radar Images Time-Series: A Case Study for Maize Crop. Int. J. Remote Sens. 2023, 44, 1417–1432. [Google Scholar] [CrossRef]
  31. Ma, Y.; Jiang, Q.; Wu, X.; Zhu, R.; Gong, Y.; Peng, Y.; Duan, B.; Fang, S. Monitoring Hybrid Rice Phenology at Initial Heading Stage Based on Low-Altitude Remote Sensing Data. Remote Sens. 2020, 13, 86. [Google Scholar] [CrossRef]
  32. Zhao, F.; Yang, G.; Yang, H.; Long, H.; Xu, W.; Zhu, Y.; Meng, Y.; Han, S.; Liu, M. A Method for Prediction of Winter Wheat Maturity Date Based on MODIS Time Series and Accumulated Temperature. Agriculture 2022, 12, 945. [Google Scholar] [CrossRef]
  33. Diao, C.; Li, G. Near-Surface and High-Resolution Satellite Time Series for Detecting Crop Phenology. Remote Sens. 2022, 14, 1957. [Google Scholar] [CrossRef]
  34. Shen, Y.; Zhang, X.; Yang, Z. Mapping Corn and Soybean Phenometrics at Field Scales over the United States Corn Belt by Fusing Time Series of Landsat 8 and Sentinel-2 Data with VIIRS Data. ISPRS J. Photogramm. Remote Sens. 2022, 186, 55–69. [Google Scholar] [CrossRef]
  35. Zhao, Y.; Wang, X.; Hou, X.; Zhang, A. Spatio-Temporal Characteristics of Key Phenology of Winter Wheat in Shandong Province from 2003 to 2019. Acta Ecol. Sin. 2021, 41, 7785–7795. [Google Scholar] [CrossRef]
  36. Sakamoto, T. Refined Shape Model Fitting Methods for Detecting Various Types of Phenological Information on Major U.S. Crops. ISPRS J. Photogramm. Remote Sens. 2018, 138, 176–192. [Google Scholar] [CrossRef]
  37. Atkinson, P.M.; Jeganathan, C.; Dash, J.; Atzberger, C. Inter-Comparison of Four Models for Smoothing Satellite Sensor Time-Series Data to Estimate Vegetation Phenology. Remote Sens. Environ. 2012, 123, 400–417. [Google Scholar] [CrossRef]
  38. Zhu, L.; Si, R.; Shen, X.; Walker, J.P. An Advanced Change Detection Method for Time-Series Soil Moisture Retrieval from Sentinel-1. Remote Sens. Environ. 2022, 279, 113137. [Google Scholar] [CrossRef]
  39. Liu, L.; Zhang, X.; Yu, Y.; Guo, W. Real-Time and Short-Term Predictions of Spring Phenology in North America from VIIRS Data. Remote Sens. Environ. 2017, 194, 89–99. [Google Scholar] [CrossRef]
  40. Ji, H.; He, X.; Wang, W.; Zhang, H. Prediction of Winter Wheat Harvest Based on Back Propagation Neural Network Algorithm and Multiple Remote Sensing Indices. Processes 2023, 11, 293. [Google Scholar] [CrossRef]
  41. Ji, Z.; Pan, Y.; Zhu, X.; Wang, J.; Li, Q. Prediction of Crop Yield Using Phenological Information Extracted from Remote Sensing Vegetation Index. Sensors 2021, 21, 1406. [Google Scholar] [CrossRef]
  42. Teodoro, P.E.; Teodoro, L.P.R.; Baio, F.H.R.; da Silva Junior, C.A.; dos Santos, R.G.; Ramos, A.P.M.; Pinheiro, M.M.F.; Osco, L.P.; Gonçalves, W.N.; Carneiro, A.M.; et al. Predicting Days to Maturity, Plant Height, and Grain Yield in Soybean: A Machine and Deep Learning Approach Using Multispectral Data. Remote Sens. 2021, 13, 4632. [Google Scholar] [CrossRef]
  43. Campos-Taberner, M.; Moreno-Martínez, Á.; García-Haro, F.J.; Camps-Valls, G.; Robinson, N.P.; Kattge, J.; Running, S.W. Global Estimation of Biophysical Variables from Google Earth Engine Platform. Remote Sens. 2018, 10, 1167. [Google Scholar] [CrossRef]
  44. Jia, K.; Liang, S.; Gu, X.; Baret, F.; Wei, X.; Wang, X.; Yao, Y.; Yang, L.; Li, Y. Fractional Vegetation Cover Estimation Algorithm for Chinese GF-1 Wide Field View Data. Remote Sens. Environ. 2016, 177, 184–191. [Google Scholar] [CrossRef]
  45. Bian, J.; Li, A.; Zhang, Z.; Zhao, W.; Lei, G.; Yin, G.; Jin, H.; Tan, J.; Huang, C. Monitoring Fractional Green Vegetation Cover Dynamics over a Seasonally Inundated Alpine Wetland Using Dense Time Series HJ-1A/B Constellation Images and an Adaptive Endmember Selection LSMM Model. Remote Sens. Environ. 2017, 197, 98–114. [Google Scholar] [CrossRef]
  46. ENVI ENVI Tutorials. Available online: https://www.nv5geospatialsoftware.com/docs/tutorials.html (accessed on 10 June 2024).
  47. Wang, J.; Zhao, C.; Huang, W. Fundamental and Application of Quantitative Remote Sensing in Agriculture; Science China Press: Beijing, China, 2008. [Google Scholar]
  48. Rouse, J.W.; Hass, R.H.; Schell, J.A.; Deering, D.W. Monitoring Vegetation Systems in the Great Plains with ERTS. NASA Spec. Publ. 1974, 351, 309–317. [Google Scholar]
  49. Haghighattalab, A.; González Pérez, L.; Mondal, S.; Singh, D.; Schinstock, D.; Rutkoski, J.; Ortiz-Monasterio, I.; Singh, R.P.; Goodin, D.; Poland, J. Application of Unmanned Aerial Systems for High Throughput Phenotyping of Large Wheat Breeding Nurseries. Plant Methods 2016, 12, 35. [Google Scholar] [CrossRef]
  50. Yan, K.; Gao, S.; Chi, H.; Qi, J.; Song, W.; Tong, Y.; Mu, X.; Yan, G. Evaluation of the Vegetation-Index-Based Dimidiate Pixel Model for Fractional Vegetation Cover Estimation. IEEE Trans. Geosci. Remote Sens. 2022, 60, 1–14. [Google Scholar] [CrossRef]
  51. Huete, A.R. A Soil-Adjusted Vegetation Index (SAVI). Remote Sens. Environ. 1988, 25, 295–309. [Google Scholar] [CrossRef]
  52. Rondeaux, G.; Steven, M.; Baret, F. Optimization of Soil-Adjusted Vegetation Indices. Remote Sens. Environ. 1996, 55, 95–107. [Google Scholar] [CrossRef]
  53. Hornero, A.; North, P.R.J.; Zarco-Tejada, P.J.; Rascher, U.; Martín, M.P.; Migliavacca, M.; Hernandez-Clemente, R. Assessing the Contribution of Understory Sun-Induced Chlorophyll Fluorescence through 3-D Radiative Transfer Modelling and Field Data. Remote Sens. Environ. 2021, 253, 112195. [Google Scholar] [CrossRef]
  54. Jiang, Z.; Huete, A.R.; Didan, K.; Miura, T. Development of a Two-Band Enhanced Vegetation Index without a Blue Band. Remote Sens. Environ. 2008, 112, 3833–3845. [Google Scholar] [CrossRef]
  55. Gitelson, A.A.; Gritz, Y.; Merzlyak, M.N. Relationships between Leaf Chlorophyll Content and Spectral Reflectance and Algorithms for Non-Destructive Chlorophyll Assessment in Higher Plant Leaves. J. Plant Physiol. 2003, 160, 271–282. [Google Scholar] [CrossRef]
  56. Barnes, E.M.; Clarke, T.R.; Richards, S.E.; Colaizzi, P.D.; Haberland, J.; Kostrzewski, M.; Waller, P.; Choi, C.; Riley, E.; Thompson, T.; et al. Coincident Detection of Crop Water Stress, Nitrogen Status and Canopy Density Using Ground Based Multispectral Data. In Proceedings of the 5th International Conference on Precision Agriculture and other resource management, Bloomington, MN, USA, 16–19 July 2000. [Google Scholar]
  57. Hardisky, M.A.; Klemas, V.; Smart, R.M. The Influence of Soil Salinity, Growth Form, and Leaf Moisture on the Spectral Radiance of Spartina Alterniflora Canopies. Photogramm. Eng. Remote Sens. 1983, 49, 77–83. [Google Scholar]
  58. Kampstra, P. Beanplot: A Boxplot Alternative for Visual Comparison of Distributions. J. Stat. Softw. 2008, 28, 1–9. [Google Scholar] [CrossRef]
  59. Breiman, L. Random Forests. Mach. Learn. 2001, 45, 5–32. [Google Scholar] [CrossRef]
  60. Wold, H. Estimation of Principal Components and Related Models by Iterative Least Squares in Multivariate Analysis. Multivar. Anal. 1966, 391–420. [Google Scholar]
  61. Olofsson, P.; Foody, G.M.; Herold, M.; Stehman, S.V.; Woodcock, C.E.; Wulder, M.A. Good Practices for Estimating Area and Assessing Accuracy of Land Change. Remote Sens. Environ. 2014, 148, 42–57. [Google Scholar] [CrossRef]
  62. Zhu, X. Agricultural Utilization of Water Resources in North China Plain. World Surv. Res. 1998, 4, 9–12. [Google Scholar]
Figure 1. Location of the North China Plain (a) and the study area (b). Note: P1: northern part; P2: southern part; yellow + represents the selected 600 winter wheat labels.
Agriculture 14 01368 g001
Figure 2. Flow chart of the winter wheat maturity prediction method.
Agriculture 14 01368 g002
Figure 3. Time series of the Sentinel-2 NDVI curve of the main target in the study area.
Agriculture 14 01368 g003
Figure 4. Spectra and VIs of green wheat, mature wheat, and harvested cropland. Note: the red + represents outliers.
Agriculture 14 01368 g004
Figure 5. (a) Sentinel-2 MSI images; (b) extraction results of winter wheat planting areas; (c,d) Sentinel-2 MSI images and winter wheat planting areas of P1; (e,f) Sentinel-2 MSI images and winter wheat planting areas of P2. Note: yellow + represents the selected 600 winter wheat labels.
Agriculture 14 01368 g005
Figure 6. Prediction accuracy of winter wheat maturity based on the emergence-flowering strategy (1). Note: Appendix A Table A1 shows the MSR and PLSR model parameters for strategy (1).
Agriculture 14 01368 g006
Figure 7. Prediction accuracy of winter wheat maturity based on the emergence-filling strategy (2). Note: Appendix A Table A1 shows the MSR and PLSR model parameters for strategy (2).
Agriculture 14 01368 g007
Figure 8. Prediction results of winter wheat maturity via the MSR model and strategy (2). Note: MSR model is Y = 3.001 + S1-NDII1×(−4.533) + S2-NDRE × 25.32 + S3-EVI × (−77.441) + S3-NDII2 × 8.013 + S4-CIRE × (−1) + S5-NDII2 × (−30.131) + S5-NIRv × 23.287 + S6-NDVI2 × (−13.718) + S6-EVI × 52.601 + S6-CIRE × 0.83 + S6-NDRE × (−25.486) + S6-NDII1 × 31.536 + S7-GNDVI × 16.028 + S8-NIRv × (−11.468) + S10-CIRE × 0.665.
Agriculture 14 01368 g008
Figure 9. Prediction results of winter wheat maturity at different latitudes.
Agriculture 14 01368 g009
Table 1. Standards used for labeling the winter wheat planting area and non-wheat planting areas.
TypeLabelNumberDescription
winter wheat planting areawinter wheat cropland600winter wheat
non-wheat planting areawaterbody150rivers and lakes
road150cement and dirt roads
urban area150cities and towns (non-vegetation)
green vegetation-covered150non-wheat vegetation
Table 2. Sentinel 2 images and winter wheat growth stages.
AbbrTransit TimeWheat Growth StagesAbbrTransit TimeWheat Growth Stages
S12022-11-15emergenceS72023-03-28
2023-03-30
flagging
S22022-12-18overwintering 1S82023-04-09heading
S32023-01-07overwintering 2S92023-04-16
2023-04-22
2023-04-24
2023-04-27
2023-04-29
flowering
S42023-01-29overwintering 3S102023-05-07
2023-05-14
filling
S52023-02-15
2023-02-26
regreeningS112023-06-01
2023-06-06
2023-06-08
2023-06-13
harvest
S62023-03-10
2023-03-13
jointing
Table 3. Sentinel-2 MSI, GF-1 WFV, and HJ 2A/B images.
GroupTransit TimeType
Group 12023-6-1Sentinel-2 MSI
Group 22023-6-6Sentinel-2 MSI
2023-6-8Sentinel-2 MSI
Group 32023-6-12HJ-2A CCD, GF1-WFV
2023-6-13HJ-2B CCD, Sentinel-2 MSI
Table 4. Vegetation indices.
VIsTypesCalculation MethodRefs.
NDVImultifunctional(NIR-RED)/(NIR + RED)[48]
GNDVI(NIR-GREEN)/(NIR + GREEN)[49]
NDVI2NDVI × NDVI-
RDVI(NIR-RED)/((NIR + RED)0.5)[50]
SAVI1.5 × (NIR-RED)/(NIR + RED + 0.5)[51]
OSAVI1.16 × (NIR-RED)/(NIR + RED + 0.16)[52]
NIRvNIR × NDVI[53]
EVI2.5 × (NIR-RED)/(NIR + 6 × NIR − 7.5 × BLUE + 1)[54]
CIREchlorophyllRE3/RE1 − 1[55]
NDRE(NIR–RE1)/(NIR + RE1)[56]
NDII1leaf water(NIR–SWIR1)/(NIR + SWIR1)[57]
NDII2(NIR–SWIR2)/(NIR + SWIR2)[57]
Note: NDVI2: NDVI × NDVI.
Table 5. Confusion matrix.
Confusion MatrixReference
Winter WheatNon-Winter WheatTotal
MapWinter wheatp11p12p1
Non-winter wheatp21p22p2
Totalp1p21
Table 6. Confusion matrix for winter wheat extraction.
Confusion MatrixPredicted Value
Winter WheatNon-winter WheatTotal
Actual valueWinter wheat55050600
Non-winter wheat2598600
Total5526481200
Disclaimer/Publisher’s Note: The statements, opinions and data contained in all publications are solely those of the individual author(s) and contributor(s) and not of MDPI and/or the editor(s). MDPI and/or the editor(s) disclaim responsibility for any injury to people or property resulting from any ideas, methods, instructions or products referred to in the content.

