Abstract
Precision agriculture, rooted in the principles of intelligent agriculture, plays a pivotal role in fostering a sustainable, healthy, and eco-friendly economy. In order to promote the precision and intelligence of potato seedling management, an innovative platform designed using phased array LiDAR technology was used for precise and accurate detection of potato canopy height. The platform is intricately designed, featuring a suite of components that includes a high-precision rotary encoder, a reliable motor, a robust frame, an inclinometer for precise angle measurements, a computer for data processing, a height adjustment mechanism for adaptability, and an advanced LiDAR system. The LiDAR system is tasked with emitting pulses of laser light toward the canopy of the potato plants, which then scans the canopy to ascertain its height. The result of this scanning process is a rich, three-dimensional point cloud data map that provides a detailed representation of the entire experimental population of potato seedlings. Subsequently, a specialized algorithm for potato seedling canopy height was designed based on integrating the altitude of LiDAR’s installation, the precise measurements from the inclinometer sensor, and the meticulously conducted postprocessing of canopy height data. This algorithm meticulously accounts for a multitude of variables, thereby ensuring a high degree of precision and reliability in the assessment of the potato canopy’s dimensions. The minimum relative error between the measured values of the outdoor canopy height detection platform and the manually measured height is 3.67 ± 0.42%, and the maximum relative error is 8.36 ± 3.47%, respectively. The average relative error is between 3 and 9%, comfortably below the 10% benchmark, which meets the rigorous measurement standards. This platform can efficiently, automatically, and accurately scan the canopy information of potato plants, providing a reference for the automated detection of potato canopy height.
1. Introduction
The Sustainable Development Goals are committed to eradicating hunger, ensuring food security, enhancing nutritional well-being, and fostering sustainable agricultural practices, thereby driving global sustainable growth and human prosperity [1]. The potato, because of its adaptability, its yielding capacity, and its nutrition contribution, and as an important component of diversified cropping systems, has a long history of helping relieve food insecurities and contributing to improving household incomes in times of crisis and today’s population expansion. As one of the most widely consumed staple foods, potatoes provide essential carbohydrates and valuable nutrients, contributing to the diets of millions of people worldwide [2,3]. Potatoes are now the world’s third most important food crop after wheat and rice in terms of human consumption. The consumption of fresh potatoes accounts for approximately two-thirds of the harvest, and around 1.3 billion people eat potatoes as a staple food, including regions of India and China [4]. In China, potatoes are the fourth largest crop adding to food security and incomes. Per capita potato consumption in China doubled between 2007 and 2019, from 33.6 to 65 kg, while, in 2019, production peaked at some 92 million tons [5]. According to The Wall Street Journal (2015), the Chinese state has been working to increase national potato consumption, also launching a campaign in 2014 to promote both the cultivation and the consumption of this tuber. China became the world’s largest potato producer in 1993 and currently accounts for almost one-quarter of global potato production and about 28% of total cultivated areas in 2017 according to the Food and Agriculture Organization of the United Nations (FAO). In China, potatoes serve predominantly as a staple in culinary preparations, either as a fresh vegetable or in various processed forms. They are also utilized, albeit to a lesser extent, as a source of nutrition for livestock. However, over the past few decades, the cultivation of potatoes has faced significant challenges. Urbanization and industrial development have led to the conversion of vast expanses of arable land into urban and industrial zones. Concurrently, ecological restoration initiatives have transformed other areas back into forests and grasslands [6]. These factors have contributed to a notable reduction in the land available for potato cultivation. Potato is more than just food, the comprehensive production of potatoes plays a pivotal role in farmers’ income increase, rural economic growth, and agriculture development. In addition, changes in the potato planting management model have remarkable impacts on the yield of potatoes per hectare and food security.
The canopy architecture of row crops such as maize affects the light attenuation within the row crops, affecting plant growth, health, and crop yield [7]. As one of the key parameters in the field of agro-meteorological observation, crop canopy height not only reflects the growing status of crops but also is a vital sign of characterizing lodging resistance ability and plays an important role in the components of crop yield as well [8,9,10]. It has been confirmed that the canopy morphology of wheat affects its photosynthesis, which further affects the yield of wheat [11]. In the research on potato breeding and field management, plant height is a very important phenotypic trait that measures the growth status of potatoes and indicates plant biomass and potato yield [12,13]. At present, the acquisition of potato plant height mainly relies on manual measurement, which is not only time-consuming and laborious but also has significant subjective errors. Manual measurement cannot establish the informatization of potato seedlings, which restricts the intelligence of potato cultivation technology. Therefore, it is of great significance to quickly and effectively carry out automatic detection of potato canopy height in the field.
Precision-farming technologies are still mainly used in industrial agri-food systems in high-income countries, but massive and varied data management could foster new models to be developed and contribute to the development of decision support tools in countries with mainly rural-based agri-food systems, using adapted hand-held or tractor-based optical sensors. In order to monitor the growth status of potato crops, potato leaf area index estimation using multisensor imagery and machine learning was studied [14,15]. With the rapid development of crop surface information collection and three-dimensional (3D) reconstruction technology, an increasing number of modern measurement techniques are applied to crop surface information detection [16,17,18]. Scholars have adopted modern techniques to detect the phenotypic state of crops. For the past decade, LiDAR has been used to retrieve forest parameters such as tree height, crown diameter, number of stems, stem diameter, and base area [19]. NASA’s Global Ecosystem Dynamics Investigation (GEDI) is the first space-based LiDAR explicitly optimized to measure vertical forest structure predictive of aboveground biomass. And the University of Maryland presented a novel supervised machine learning approach to interpret GEDI waveforms and regress canopy top height globally [20]. Accordingly, remote sensing technology and computer visualization technology are also used in agriculture to measure the height of crops. For instance, the electronic image analysis was taken as a method for nondestructive measuring of individual plant growth parameters in different growth stages [21]. Other studies have shown that it is possible to use LiDAR to retrieve plant height and biomass of sugar beet and winter wheat, while for potatoes, both plant height and biomass estimation proved to be hard due to the complex canopy structure and the ridges on which potatoes are grown [22]. Sophisticated robotic technologies and near-infrared laser scanners were exploited to build a 3D imaging system, which was applied to crop growth measurement [23]. Multisensor and machine learning techniques have been successfully validated for assessing the leaf area index (LAI) of potato crops. LAI is a critical parameter that reflects the canopy’s structural and biochemical attributes and is widely utilized in estimating various agronomic metrics such as biomass [24], chlorophyll content [25], and crop yield [26]. However, the stringent environmental conditions required for these methods have hindered their practical implementation from the laboratory to real-world farm settings. As a result, the measurement of crop canopy height continues to be conducted manually for a multitude of reasons to this day.
The main objectives of this study are as follows: (1) a canopy height detection system for potato seedlings based on surface array LiDAR was established, (2) the system was used to measure the canopy height of Holland No. 15 potato seedlings, (3) the corresponding algorithm was designed to modify the 3D point cloud data of potato seedling canopy height measured in the field, and (4) the detection height of potato seedlings was compared with the manually measured height to verify the feasibility of the system in detecting the canopy height of potato seedlings in the field.
2. Materials and Methods
2.1. Morphological Characteristics of Potato Seedlings
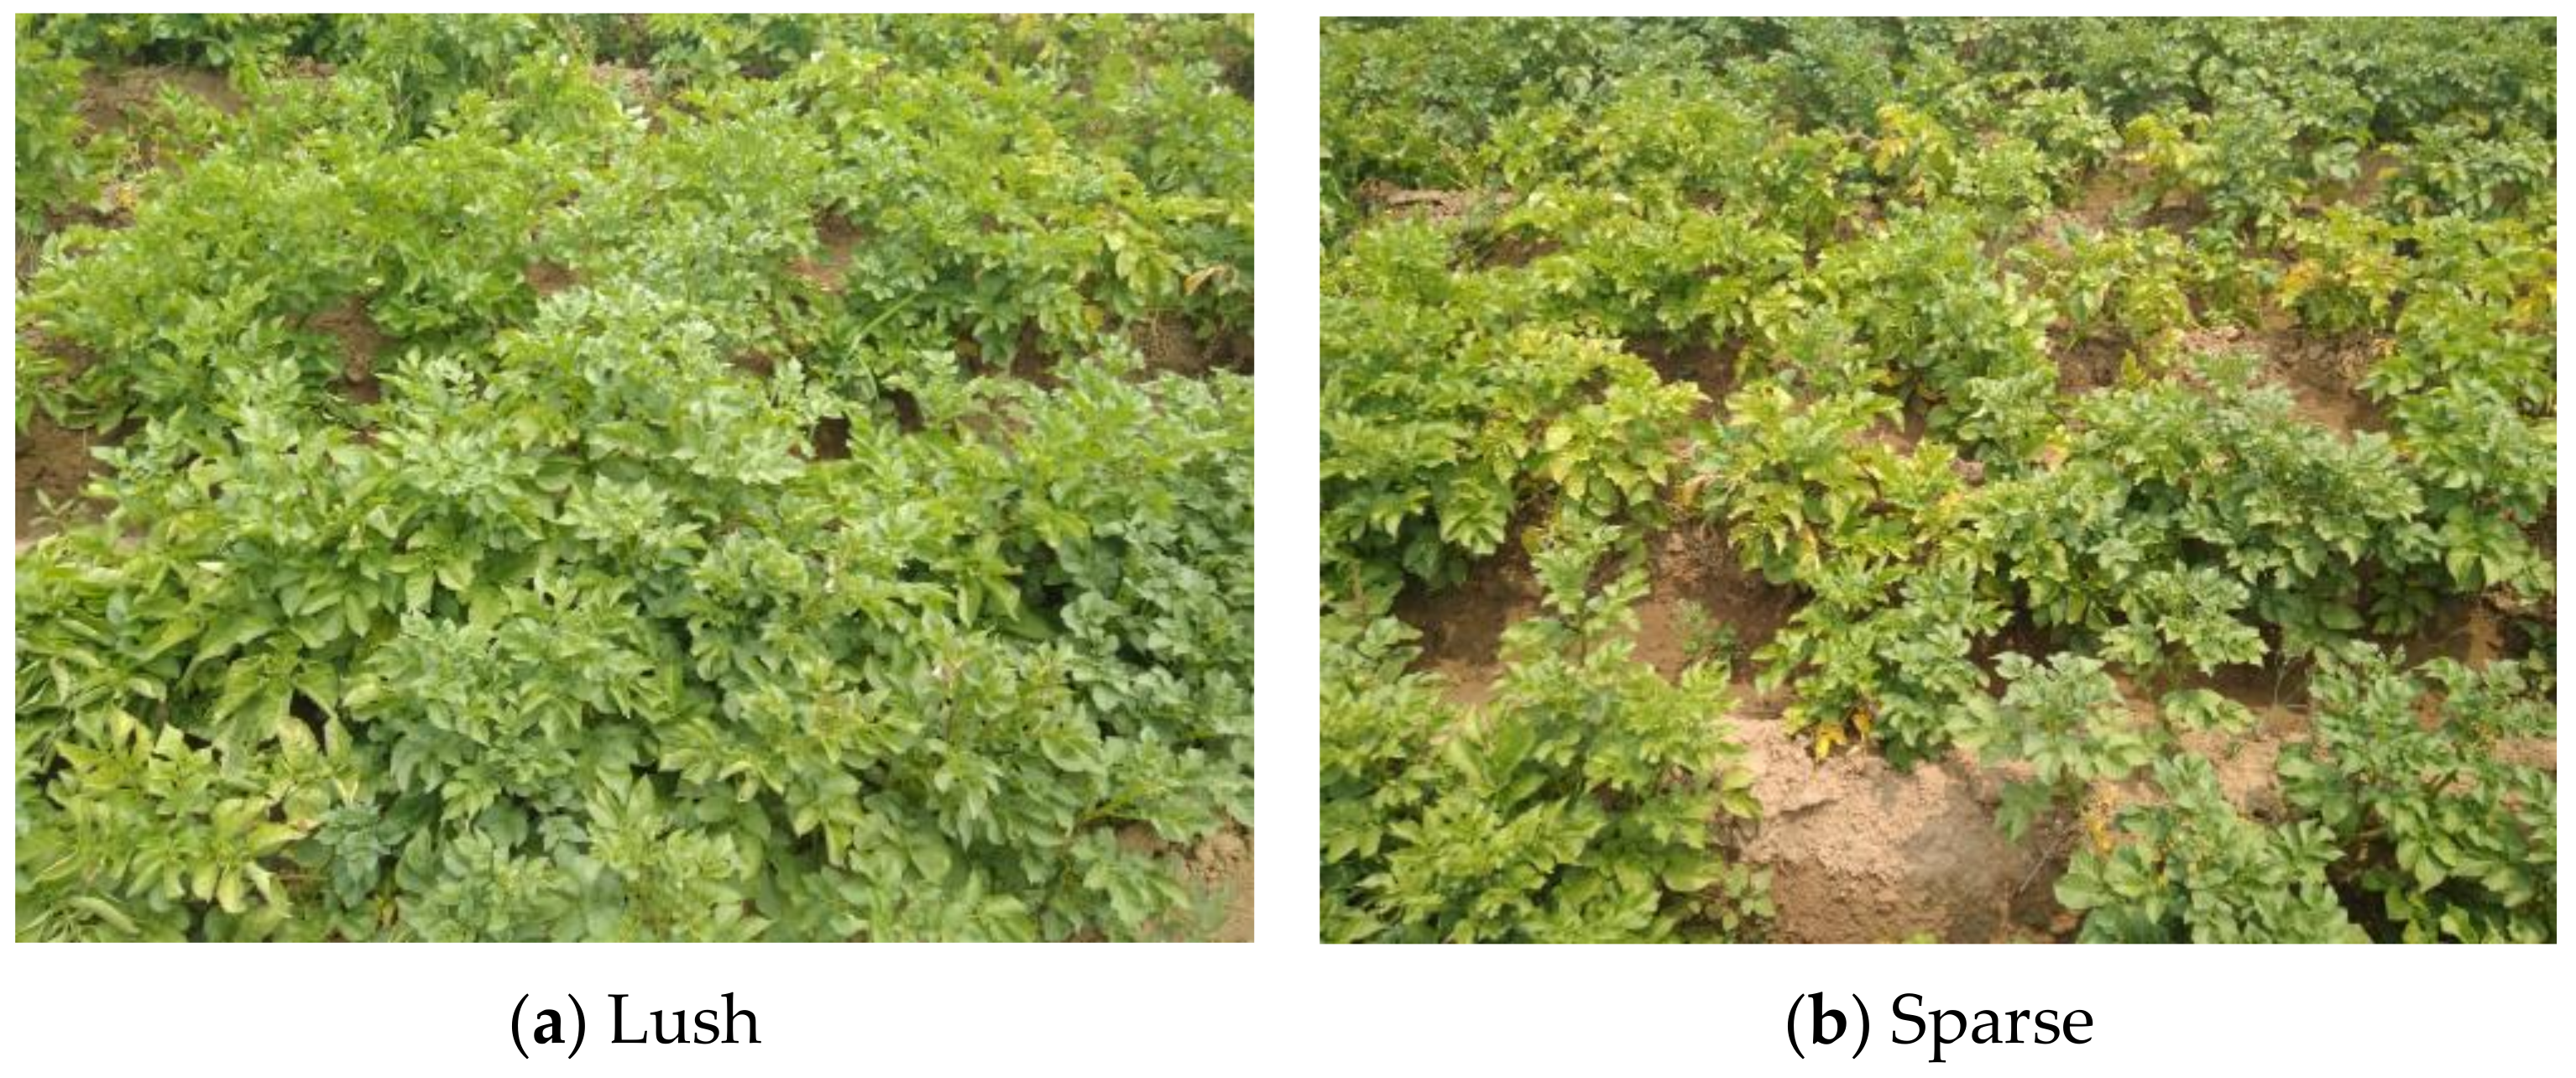
The potato seedlings in the maturity stage have distinct characteristics and can be divided by the angle between the main stem and the ground into three types: vertical, semivertical, and spreading. The stems of cultivated species are mostly erect and rarely bent to one side or semiprostrate. The height and plant exuberance both differ among different varieties of potato seedlings, which are greatly influenced by the cultivation conditions. The typical stature of these plants ranges from 300 to 800 mm, while some medium to late-maturing varieties can exceed a height of 1000 mm. Early-maturing potato plants typically exhibit a greater number of branches along the lower and middle sections of their stems. In contrast, medium- to late-maturing varieties are characterized by robust stems that branch early and often, with a count that typically ranges from 4 to 8 branches per plant. Even within the same potato variety grown on the same plot, there can be variability in the growth condition, with seedlings varying from lush to sparse. The diverse states of potato seedling growth in the field are illustrated in Figure 1, providing a visual representation of these variations. During the mechanical harvesting process, it is essential to adjust the operational parameters based on the density of the potato seedling canopy. For areas with dense potato seedlings, the machine’s power consumption or feed rate should be increased to accommodate the greater biomass. Conversely, when dealing with sparse potato seedlings, it is advisable to decrease the power consumption or adjust the feed rate accordingly to optimize the harvesting efficiency without compromising the crop yield. This adaptive approach ensures that the machinery performs optimally across varying field conditions. In response to the aforementioned factors, a canopy height detection system for potato seedlings was crafted. This system was designed to collect canopy height information of potato seedlings, provide essential data support for potato seedling recovery machinery, and enable the machine to adapt to different on-site conditions, ensuring a more effective and accurate harvesting process.
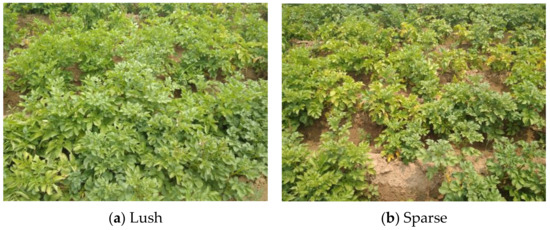
Figure 1.
Growth status of potato seedlings.
2.2. Structural Design of Potato Seedling Canopy Height Detection System in the Field
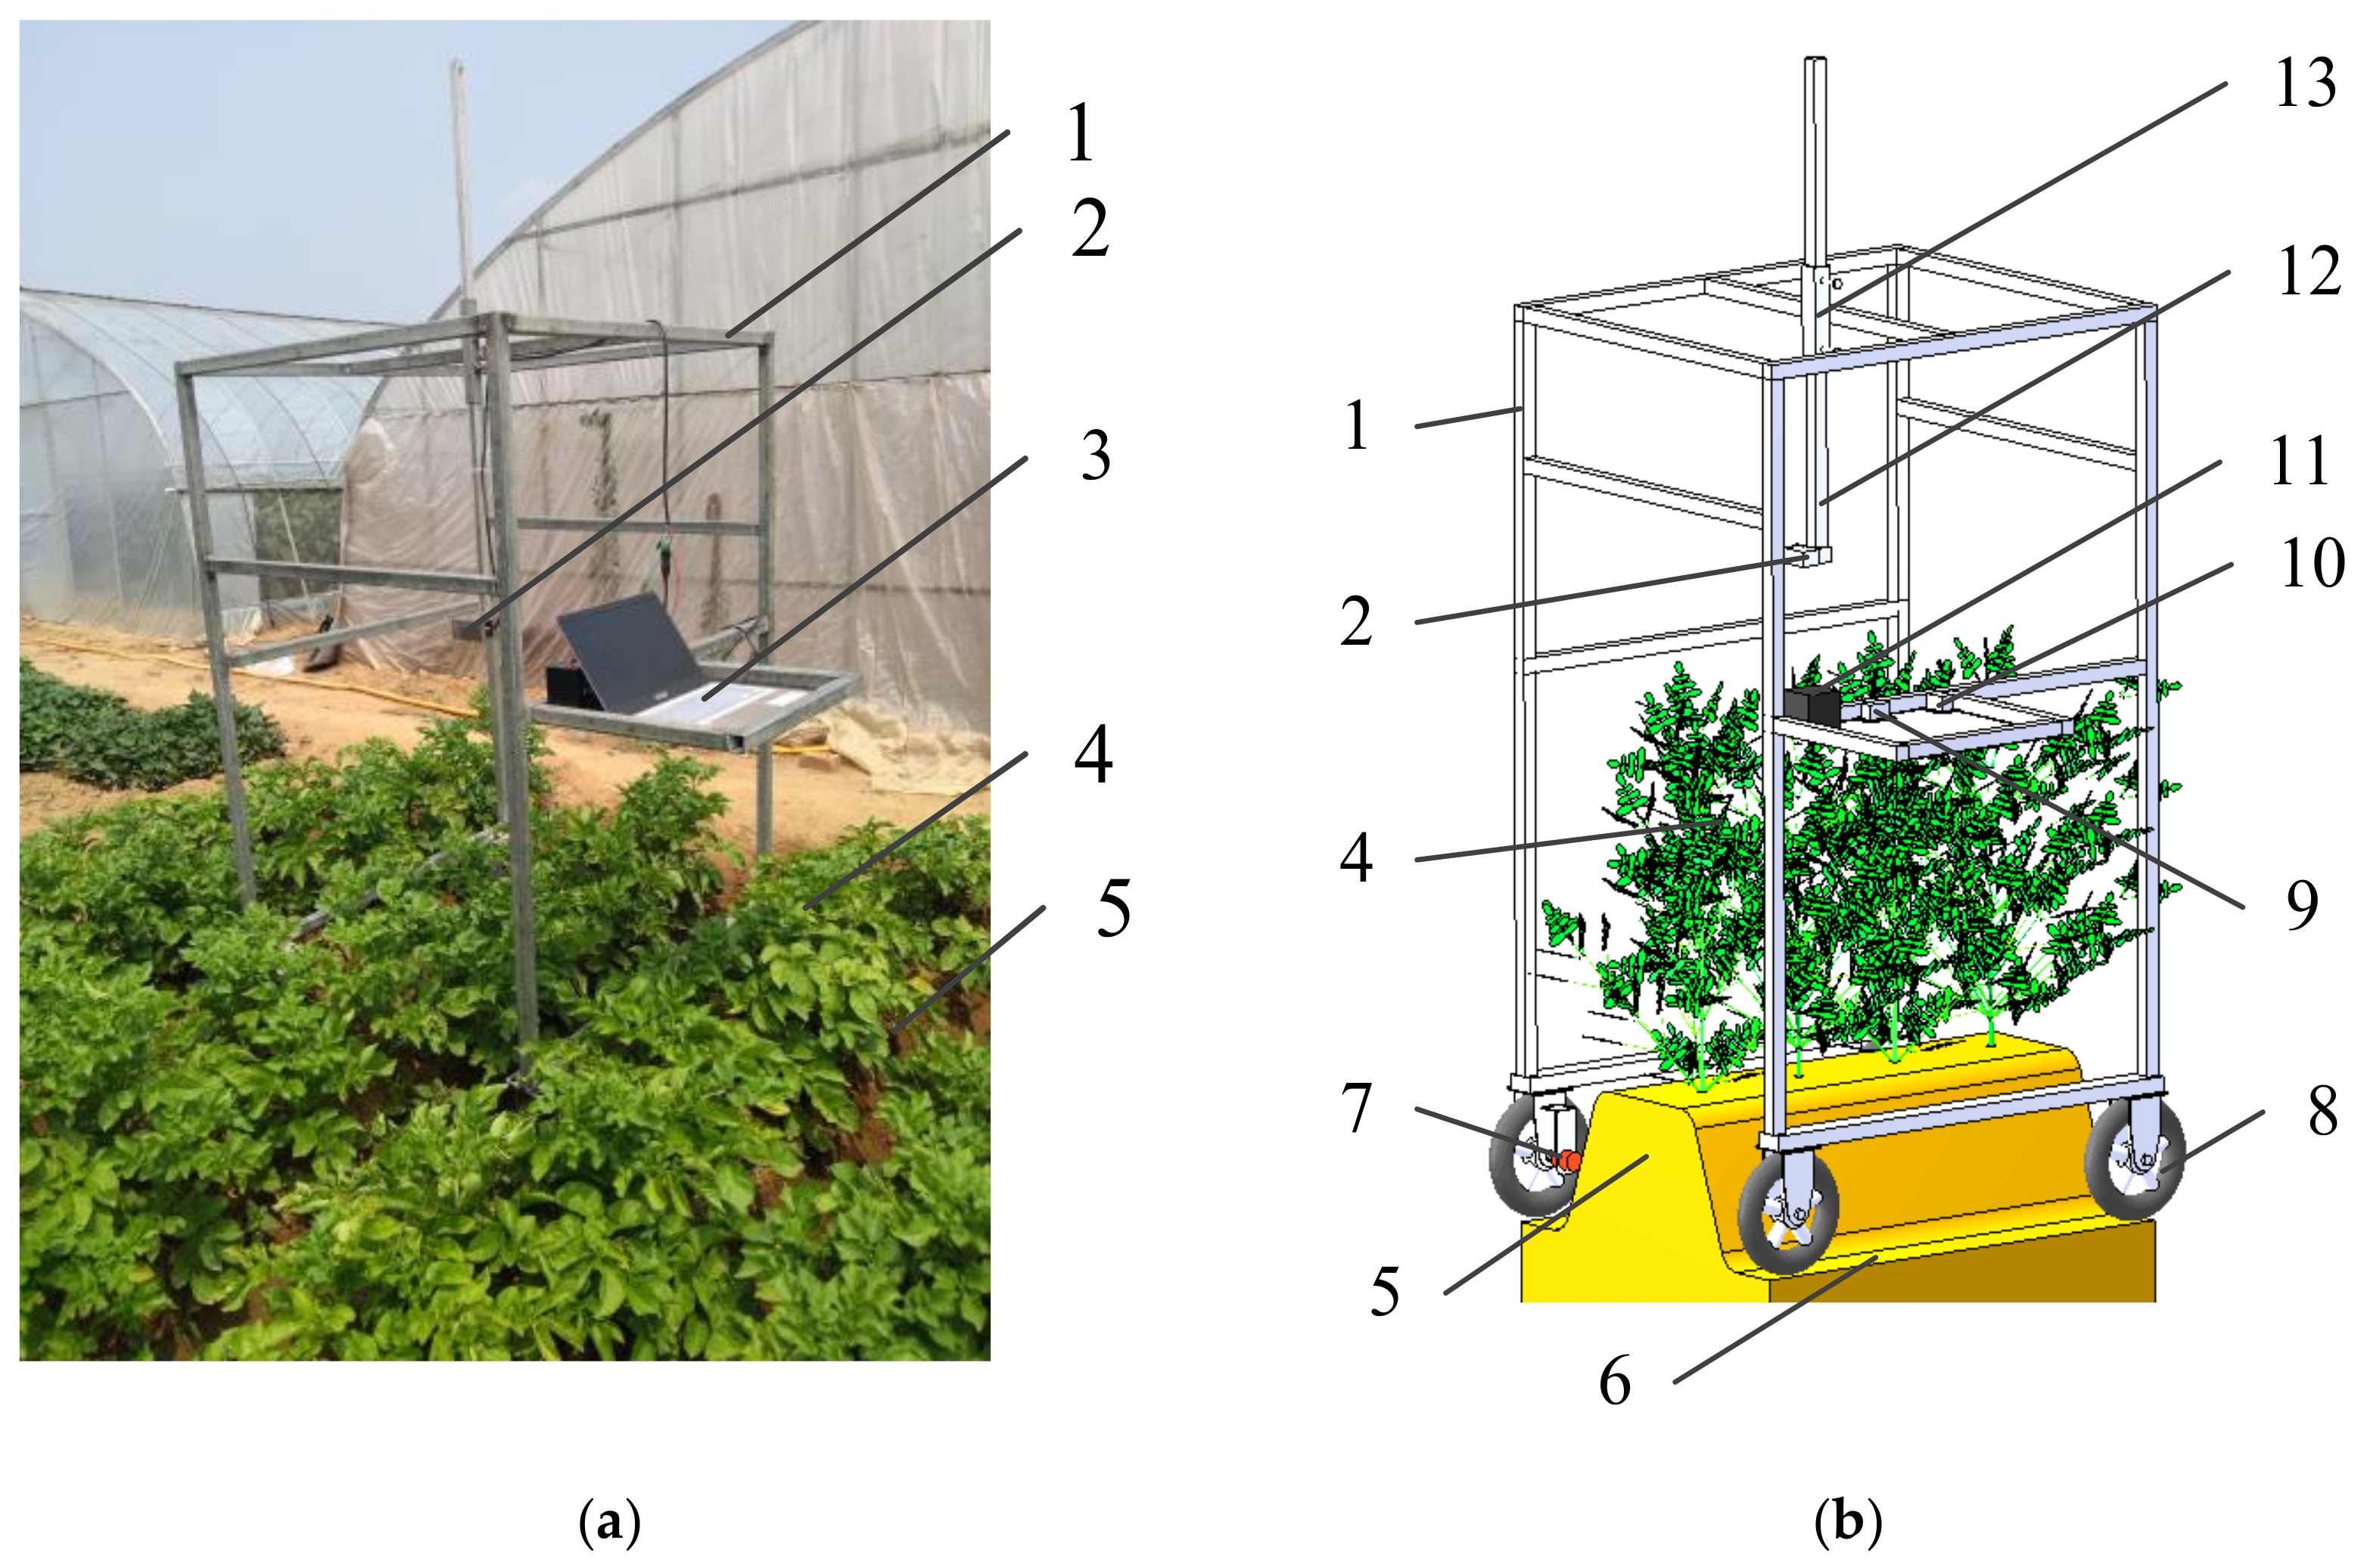
Potatoes are planted in ridges, with a variety of planting modes, and the potato seedlings grow vertically, with a maximum height of 800 mm. The measurement system platform was built for the single-ridge and single-row planting mode. To adapt to the environment of field operation and detect the height of potato seedlings, a field data detection system was established that will not damage the natural canopy height of potato seedlings in the field. The installation position of the surface array LiDAR was much higher than the highest canopy of potato seedlings, and the shape of the potato seedlings was unchanged during the detection. The wheels on both sides of the rack were driven at the ridge bottom, and the extension state of potato seedlings on both sides of the ridge was unchanged. The structure of the test bench is shown in Figure 2.

Figure 2.
Schematic diagram of canopy height detection system for potato seedlings in the field: (a) Field test drawing. (b) Schematic diagram of system rack structure. 1—The frame, 2—Laser LiDAR encapsulation, 3—Portable computer, 4—Potato seedlings, 5—Lane, 6—The ground, 7—Rotate the encoder, 8—Return roller, 9—Front and rear tilt sensors, 10—Left- and right-angle sensor, 11—Power supply (12 V), 12—Height adjusting lever, 13—The sleeve.
The system comprises several key components, including a rotary encoder, a motor, frames, angle sensors, a computer, laser sensors, a height-adjusting mechanism, and a package box. The HPS-3D160 laser LiDAR, housed within the package box, is tasked with scanning the canopy height. Positioned parallel to the ground, this laser LiDAR captures real-time data on the canopy of potato seedlings, thereby acquiring detailed canopy information. A height-adjusting rod, oriented perpendicularly to the ground, is mounted on the rack through a sleeve. The sleeve features a hole that is aligned with the rod, which is secured in place by tightening bolts through the hole. The overall framework of the system is depicted in Figure 2, providing a visual overview of its construction and components.
The frame, with dimensions of 1600 mm in height, 800 mm in width, and 1000 mm in length, is stabilized by four support wheels through a connecting frame. This arrangement ensures that the system platform can be maneuvered effectively in the field. The rotary encoder is strategically mounted coaxially within the right front wheel under the rack, serving to log the system’s travel distance and its real-time velocity. On the left platform, a tilt sensor is positioned to detect the angle of inclination of the platform, which can vary due to uneven terrain as the machine advances. The LiDAR, rotary encoder, and tilt sensor are powered by a single 12-volt battery, ensuring a streamlined energy supply. The data collected by these sensors are then wirelessly transmitted to a computer for further analysis and processing.
2.3. Data Acquisition Principle of the System Platform
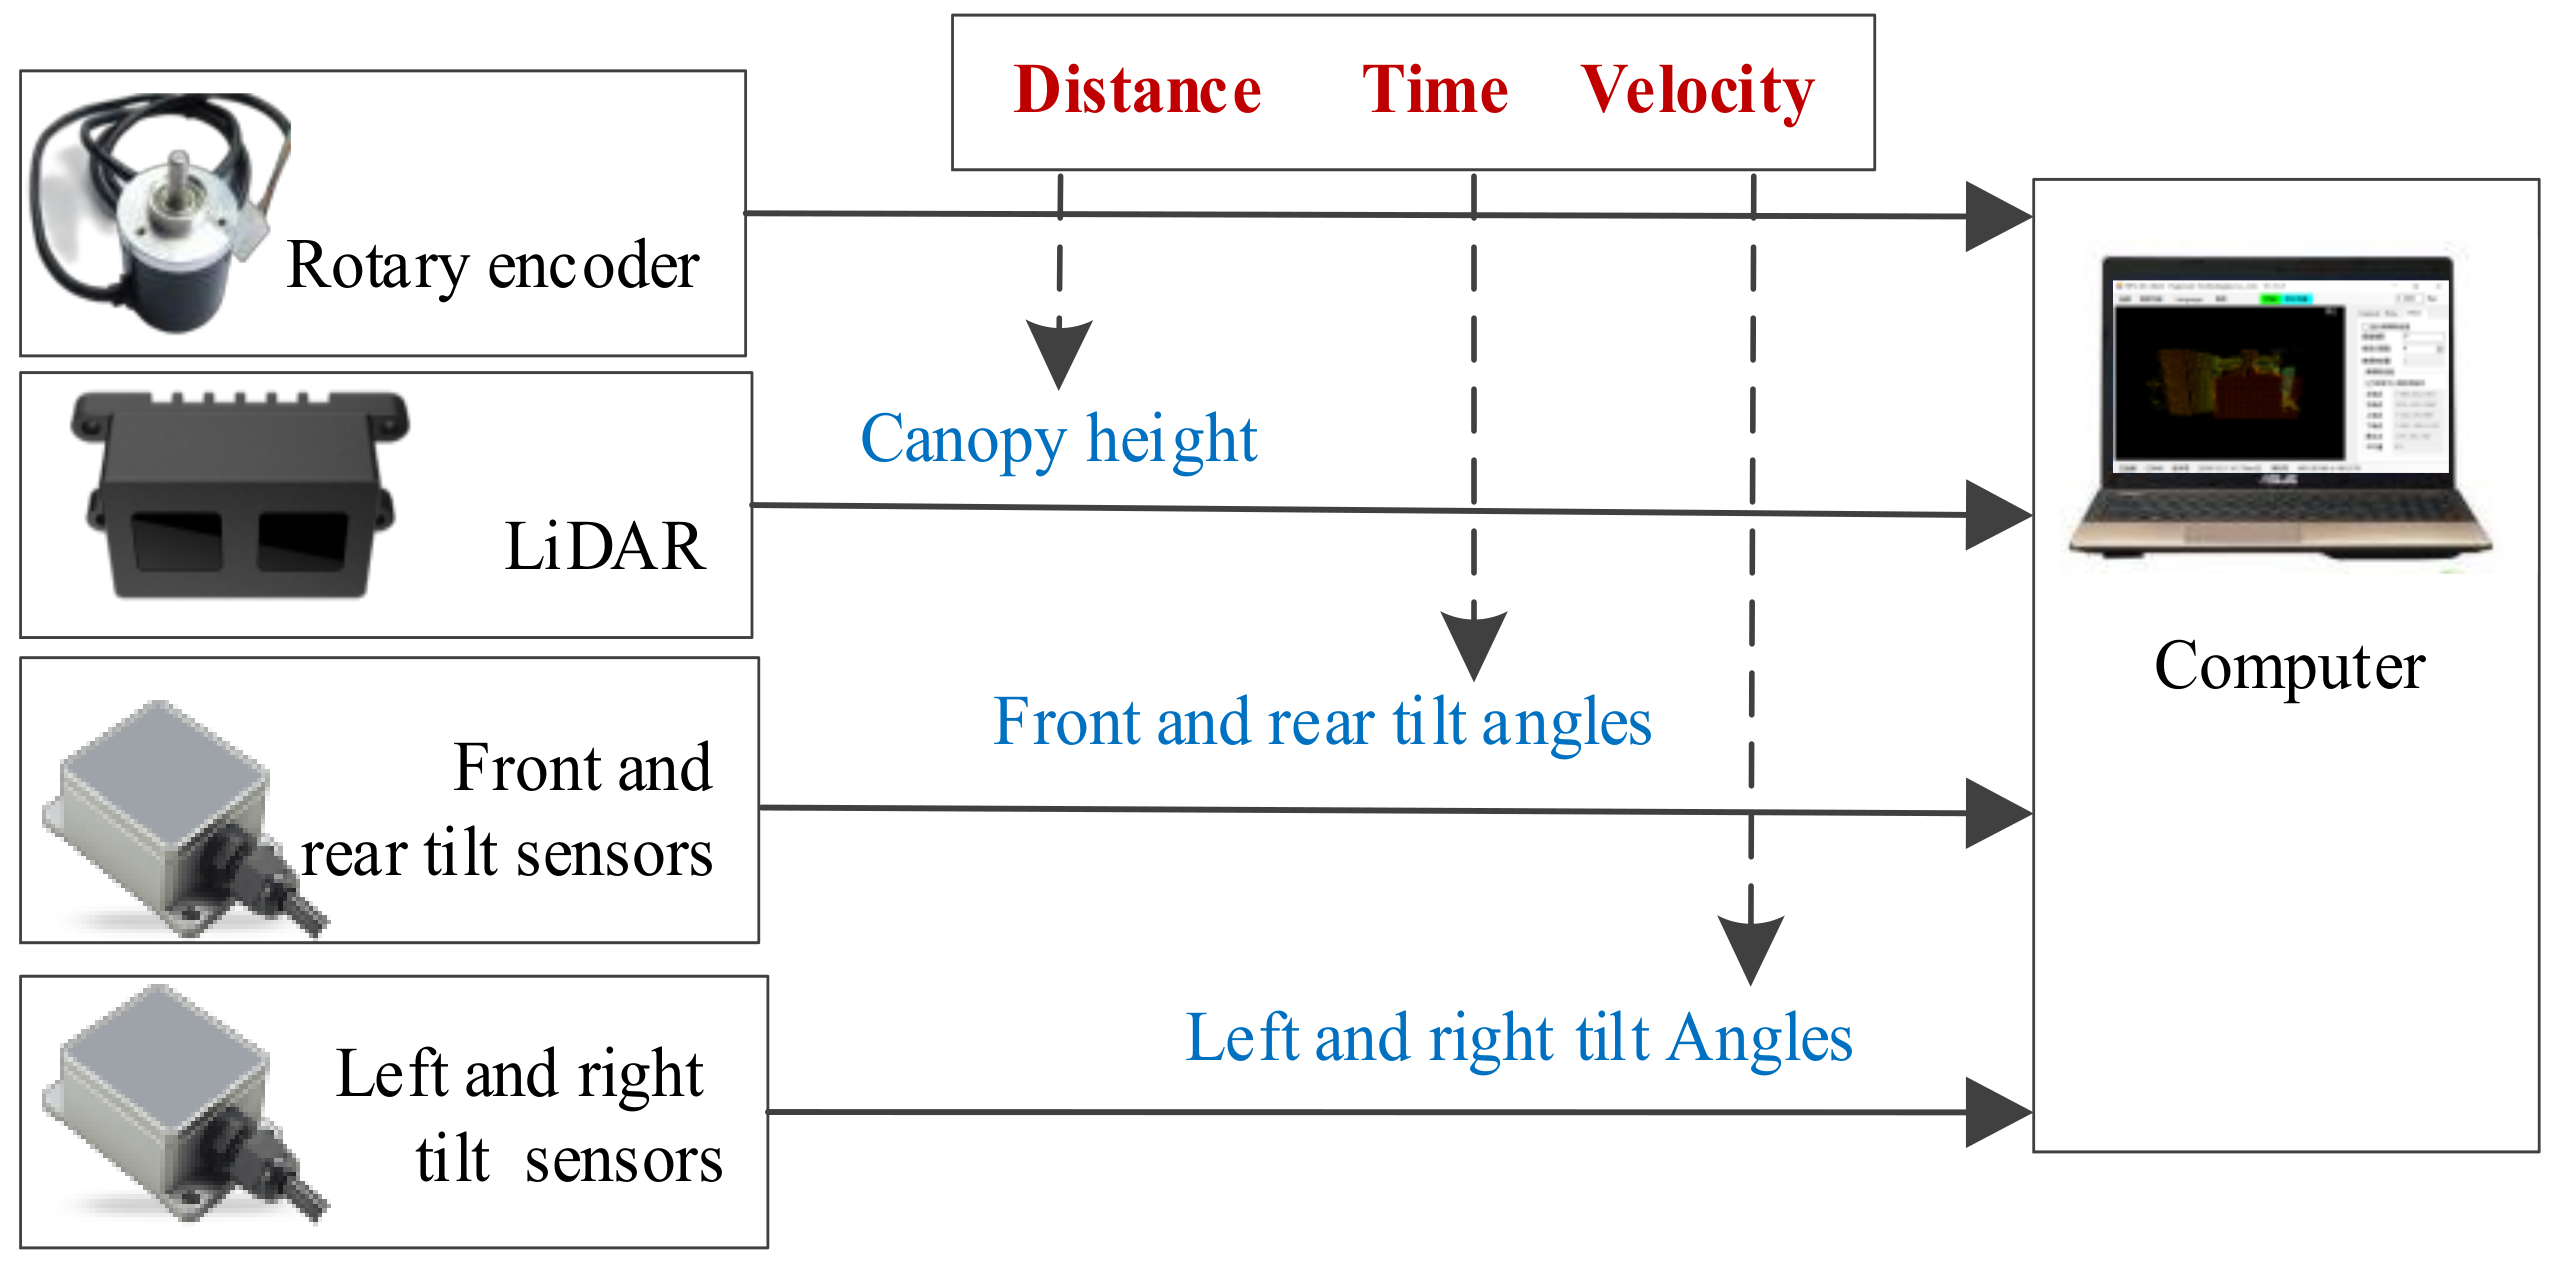
When the system platform moves forward, the rotary encoder in the platform detects the forward distance and forward speed of the system. The support wheel rotates to drive the rotary encoder to rotate, and the encoder records 1000 data points for each rotation. Since the length of each cell is fixed, the distance data points recorded by the encoder for each cell are basically consistent, and the corresponding real-time speed is recorded and calculated. LiDAR measures the height of potato seedlings in the corresponding area when the system platform advances. The front, rear, left, and right tilt sensors are used to measure the machine tilt angles caused by uneven ground during the measurement. Figure 3 shows the flow chart of data acquisition of the potato canopy height detection system.

Figure 3.
Data acquisition flow chart of potato canopy height detection system.
2.4. Field Tests and Measurement Methods
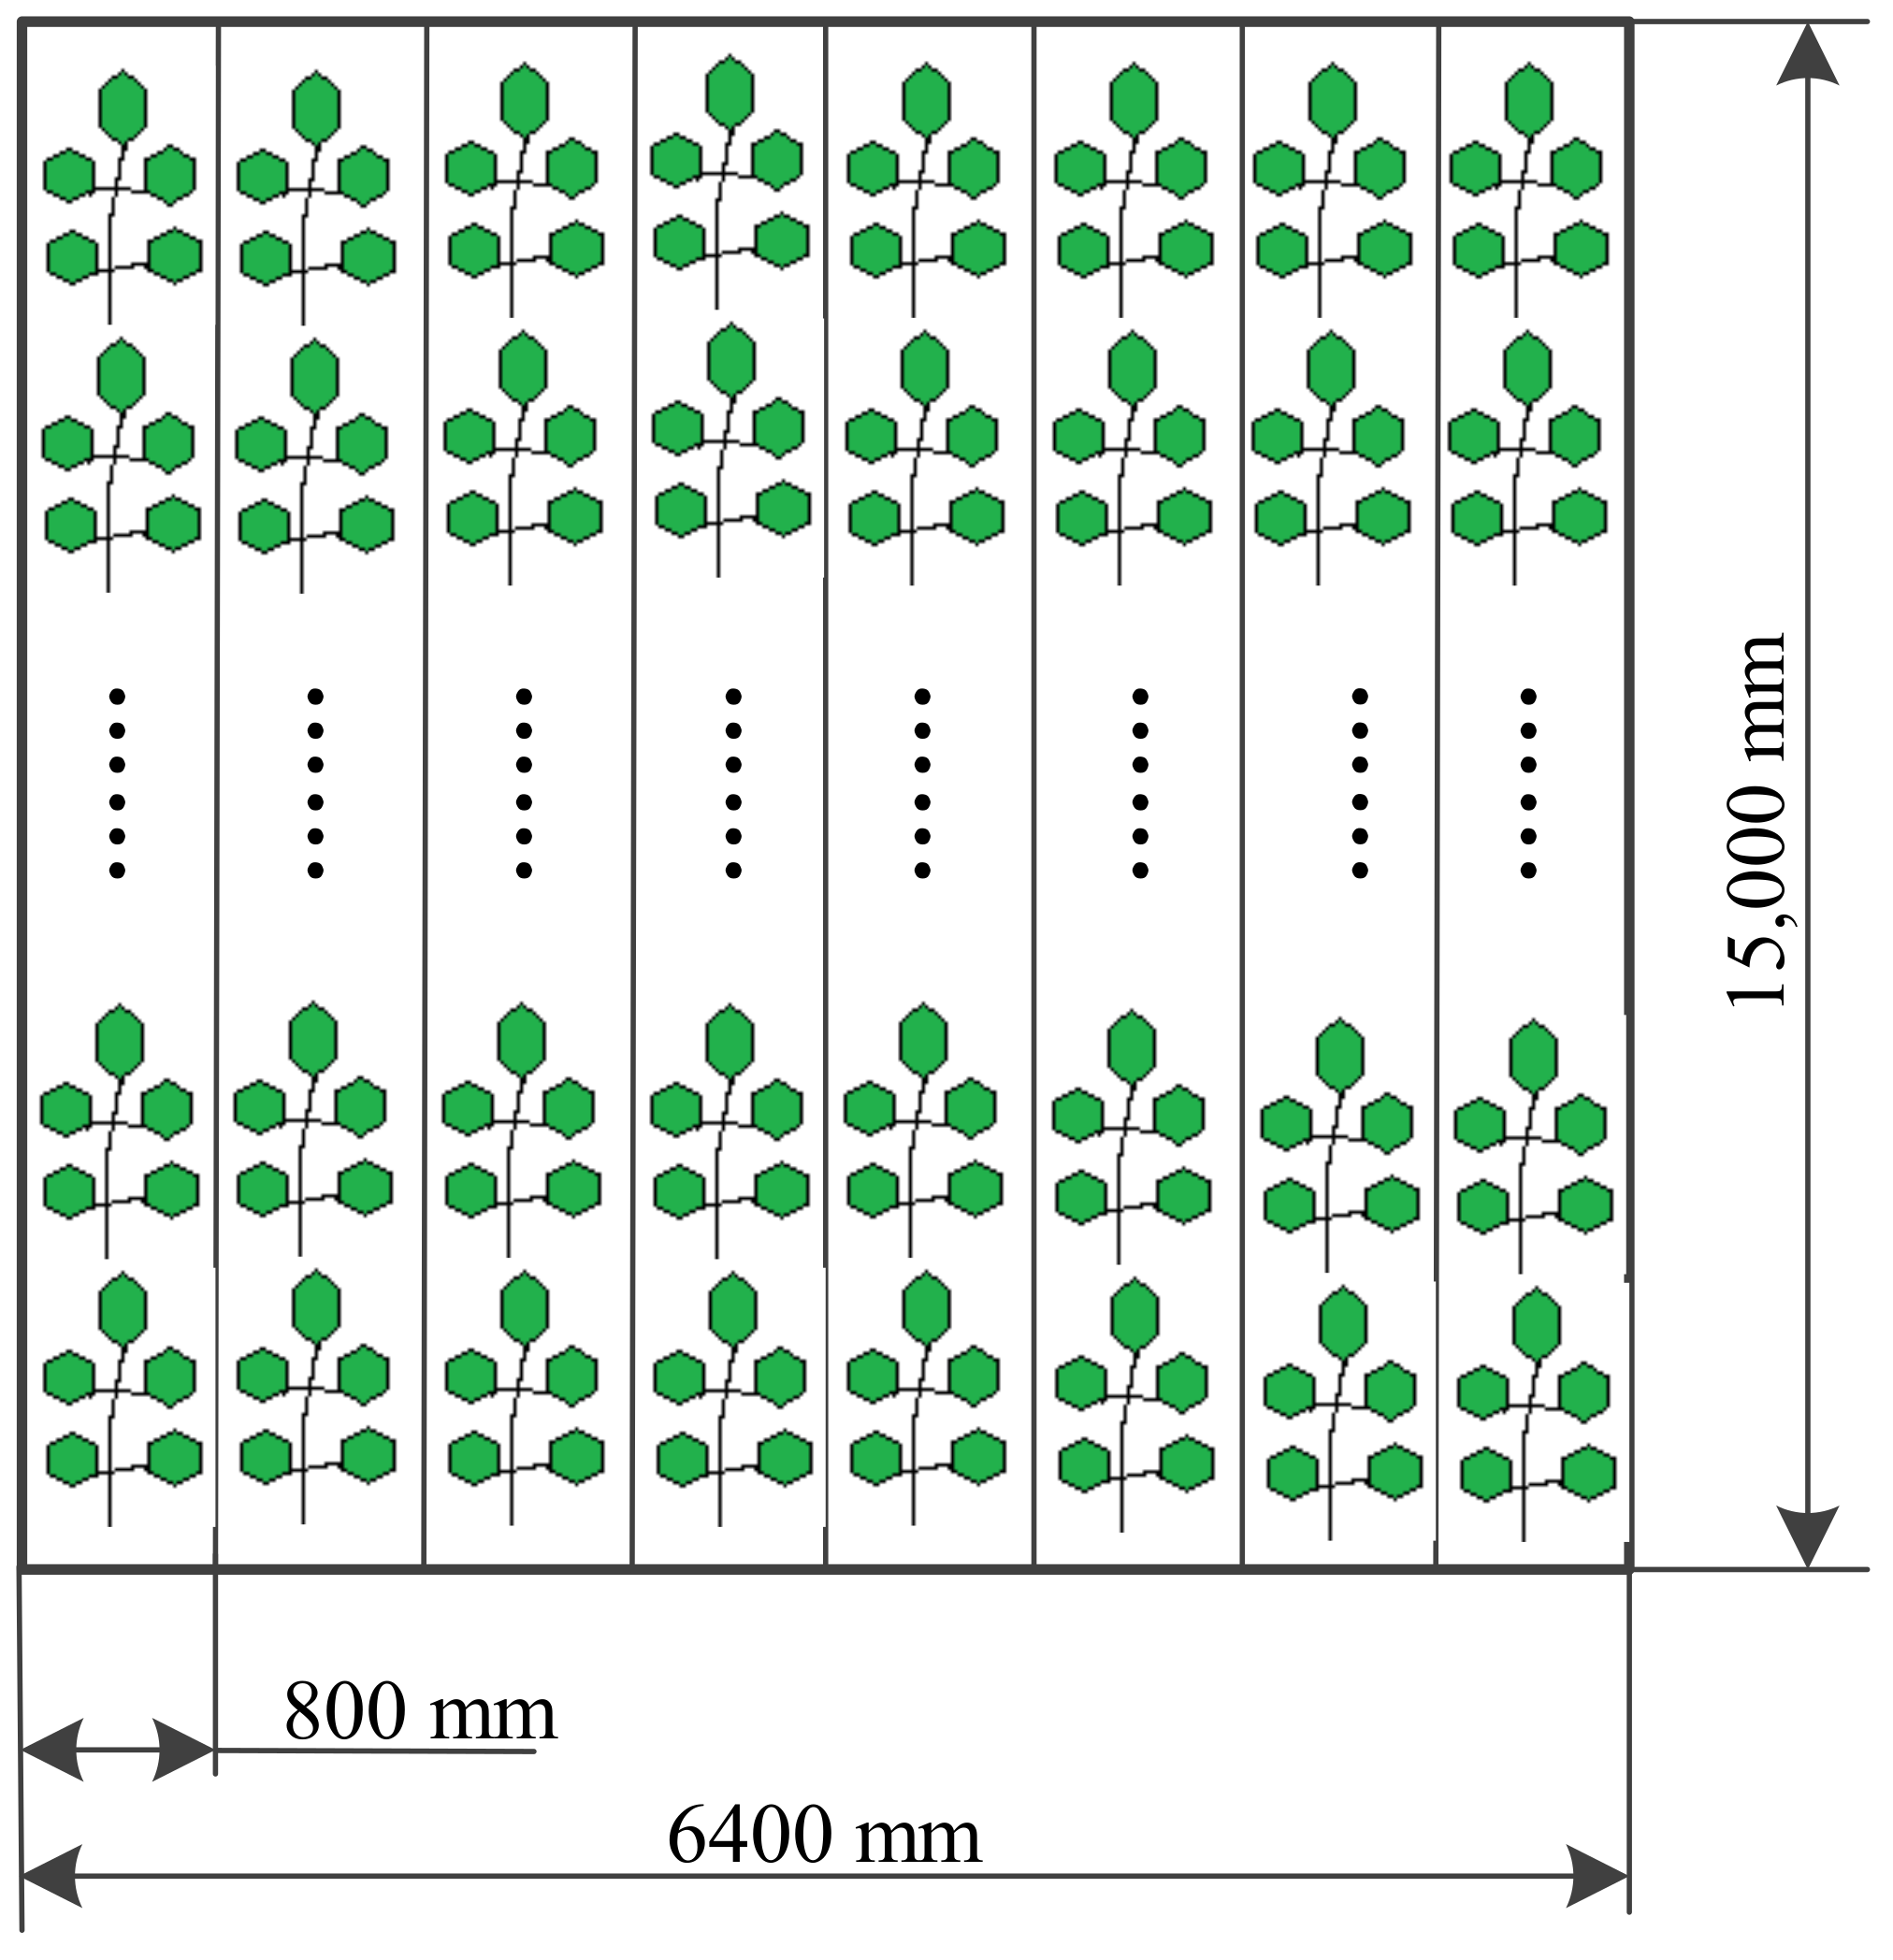
Field tests of potato seedling canopy height were conducted in the potato experimental field of Shandong Taian Academy of Agricultural Sciences in June 2023. The potato cultivar is No.15 in Holland, with a plant height of 300–600 mm. The test field consisted of 8 rows of potatoes arranged in a straight line. Each row consisted of 1 plot, with a total of 8 plots. The schematic diagram of cell arrangement is shown in Figure 4. The tests were carried out three times a day from June 11 to 15, and 8 plots were measured in each test. Cell division is shown in Figure 4.
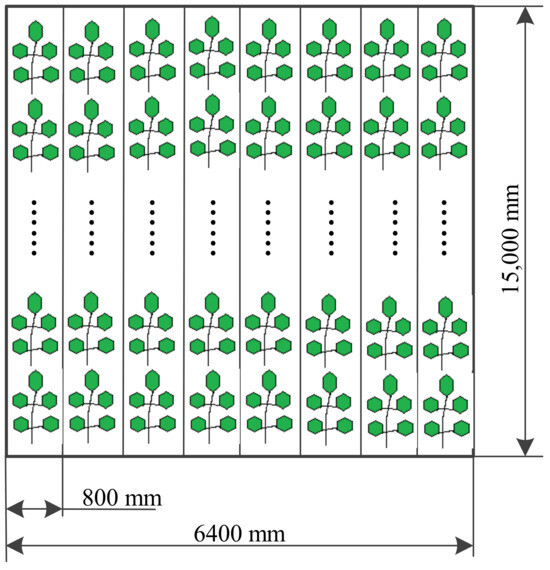
Figure 4.
Schematic diagram of experimental plot division.
2.5. Determination of Monitoring Principle and Installation Height of Planar Array LiDAR
The HPS-3D160 LiDAR is a new generation of high-performance solid-state LiDAR sensors designed by Hebson Technology based on the ToF principle. With an optimized lighting system and low-distortion infrared optical lens, the measuring distance can reach 12 m. LiDAR can be used in various reflectivity scenes. It has a laser emission angle of 76° (horizontal) × 32° (vertical) and scans 20 frames of data every second. Each frame returns 60 × 160 height data points, and the output result is depth data, which can form 3D images. According to field testing, the LiDAR needs to scan canopy information with a width of 800 mm, which will not damage the shape of the potato seedling canopy during the scanning process. The LiDAR should not touch the top of the potato seedling, and the scanning results should be true, reliable, complete, and effective. To scan complete canopy information, the installation height of LiDAR should be determined. According to the LiDAR response time, the movement speed of the system platform should not exceed 2.49 m/s. With the uniform movement of the platform, the potato canopy information in the whole test field was detected.
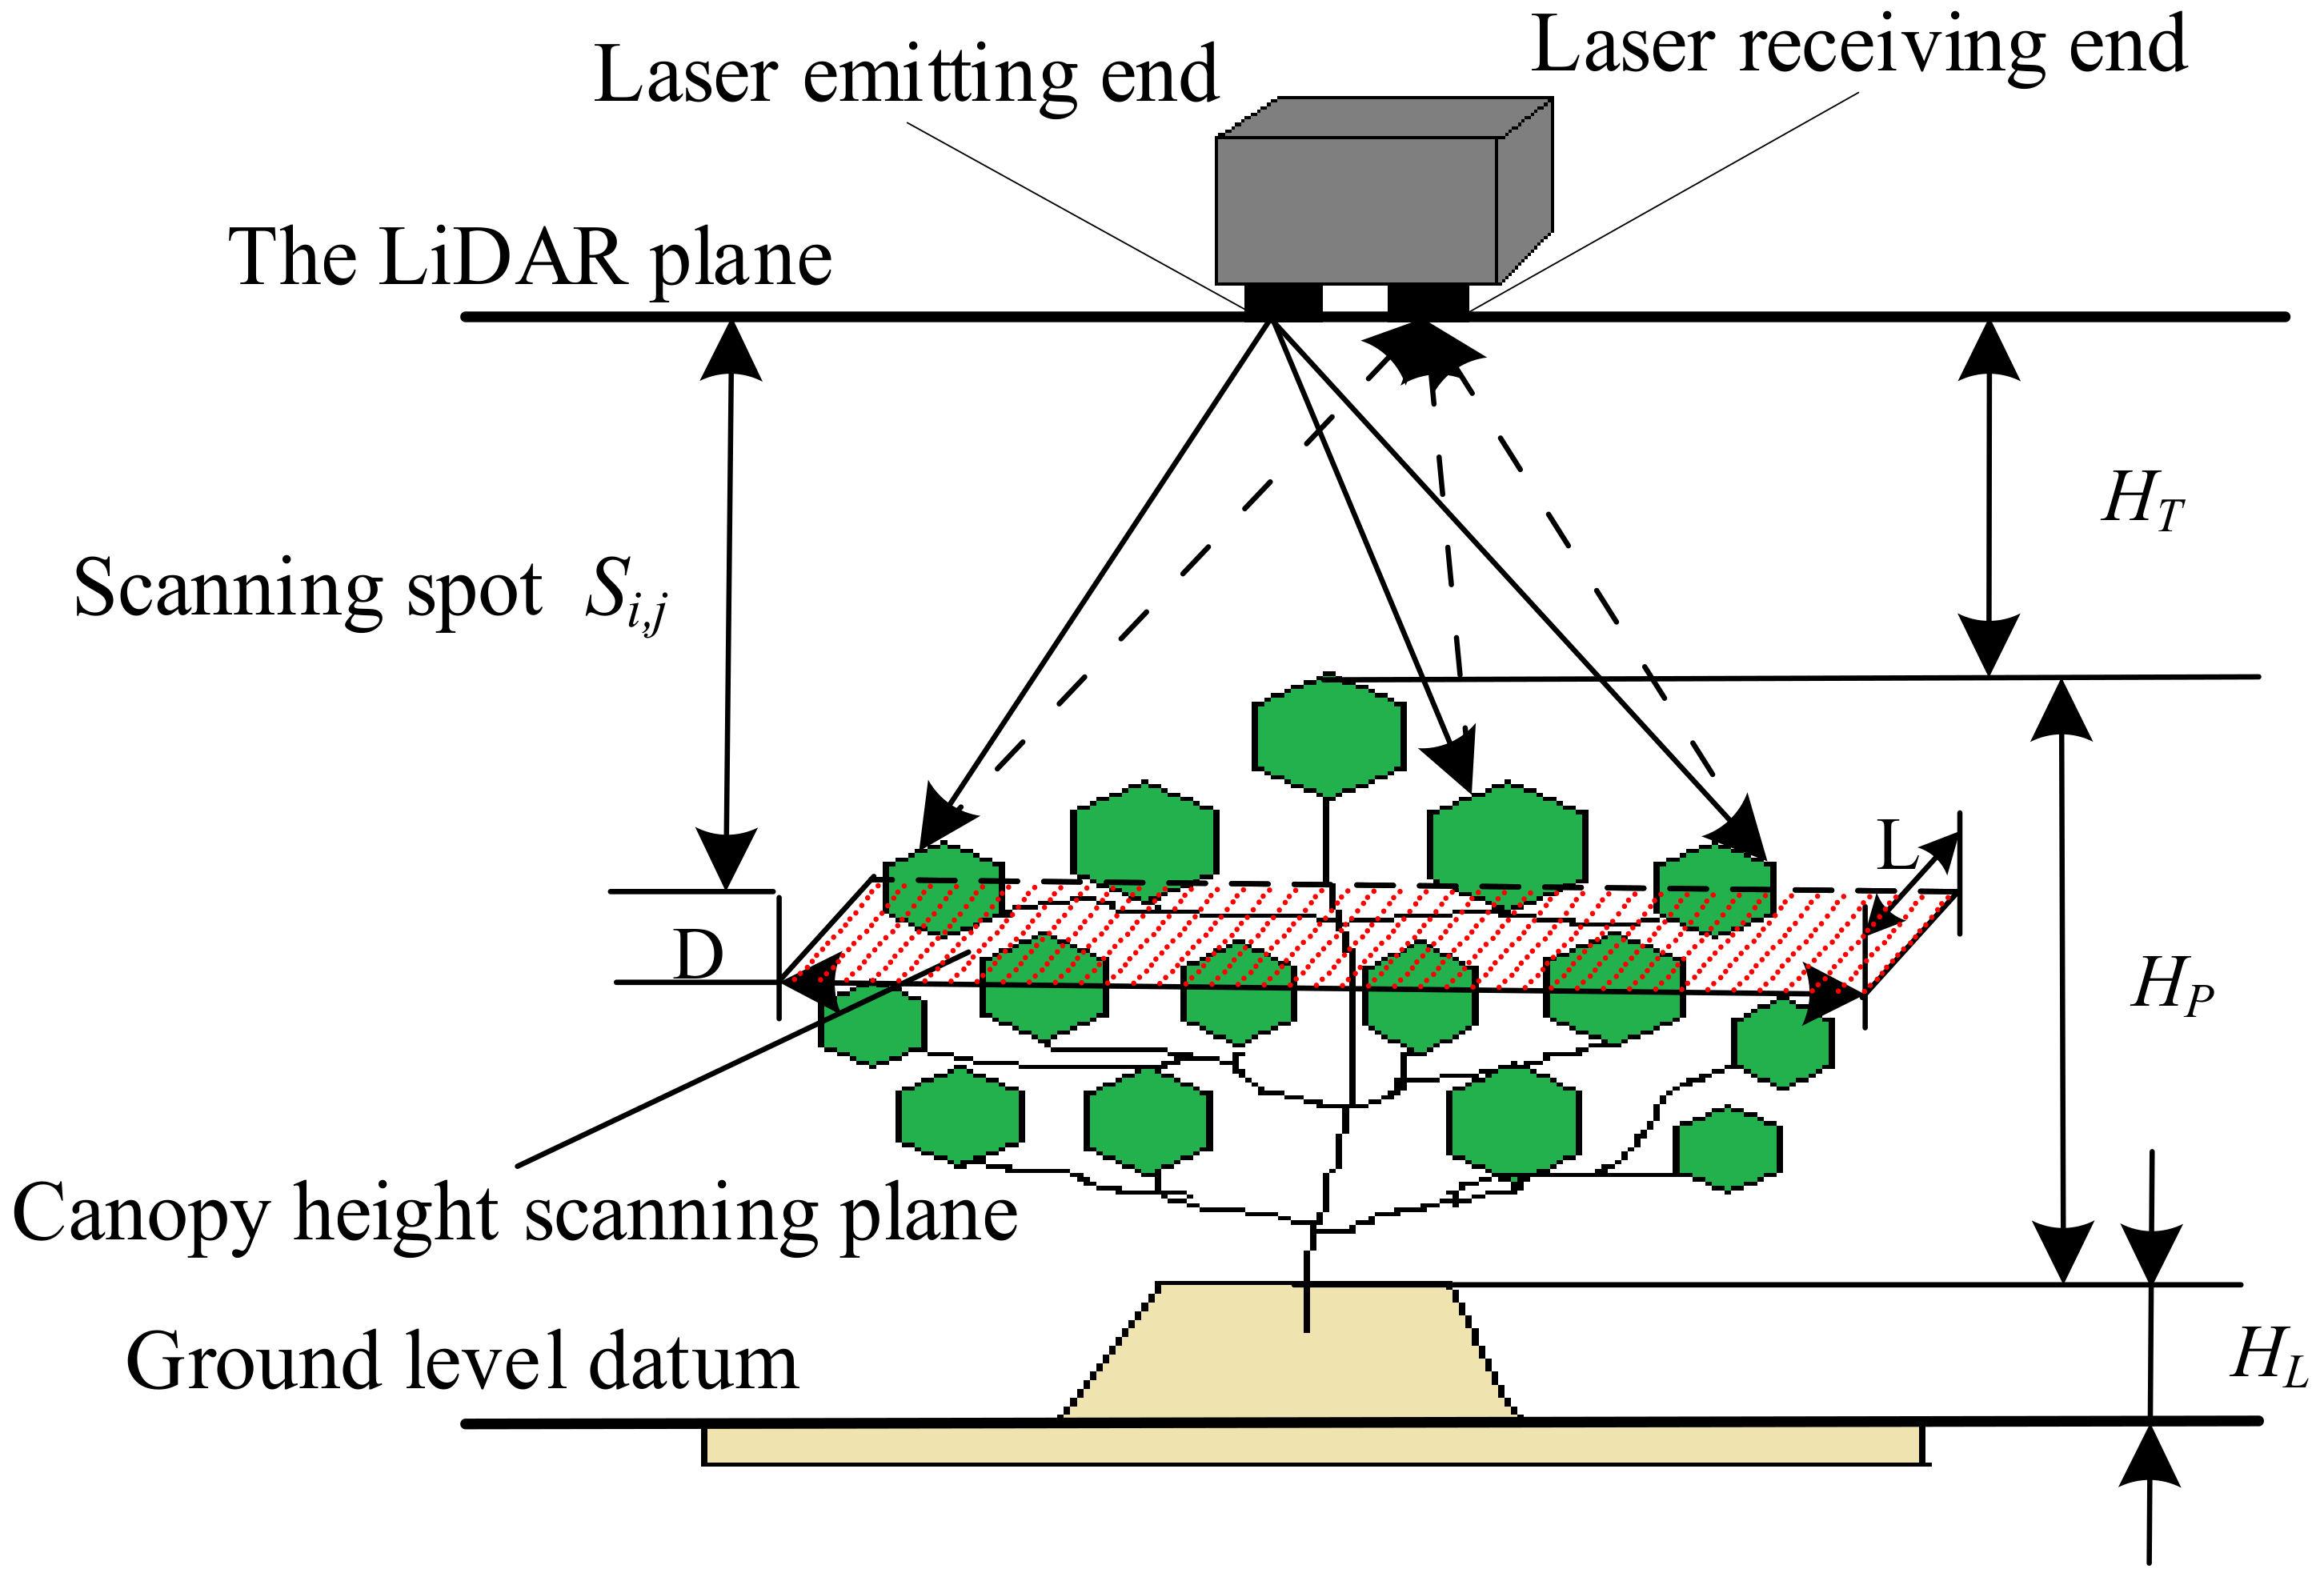
The canopy plane area scanned by LiDAR differs with height. The principle of LiDAR detection at fixed heights is shown in Figure 5. According to the field test, the LiDAR needs to scan the canopy width of a row of potatoes with a width of 800 mm and cannot damage the shape of potato seedlings during the scanning or touch the top of potato seedlings. The installation height of LiDAR to scan the complete and effective canopy information needs to be determined.
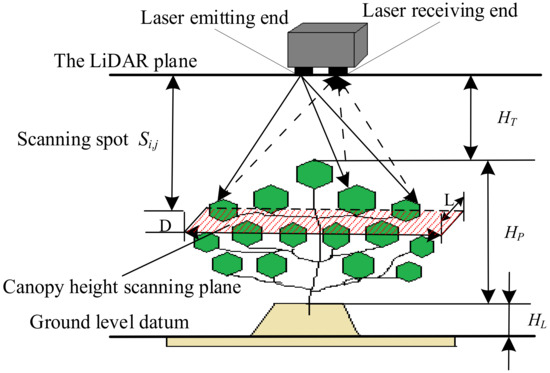
Figure 5.
Schematic diagram of LiDAR detection.
The detection area of a frame scanned by LiDAR is D × L. D is the width of canopy detected, or namely the width of a ridge of potato seedlings. The installation height of the face array LiDAR should first ensure that the range of D is 800 mm. The corresponding detection length L is the width of potato seedlings in parallel to the direction of ridge scanned by the planar array LiDAR. A total of 60 data points were scanned within the range L. The value of L should be determined by referring to the installation height of LiDAR. The distance between the potato seedling canopy plane and the LiDAR plane needs to be detected as shown in Figure 5. It can be obtained according to geometric calculation.
Arrange the above two equations and obtain
where L ≈ 124.64 mm, and HT ≈ 249.95 mm.
The installation height of LiDAR is
where H is the installation height of the sensor away from ridge bottom, in mm; HP is the height of potato seedling, and the height of potato seedling in the test field is 300–600 mm, Hp ≈ 500 mm; and HL is the height of potato ridge in the test field, HL ≈ 200 mm. After calculation, the installation height of LiDAR is H ≈ 950 mm (depending on the potato variety and its planting pattern, H can be determined by adjusting HP and HL).
2.6. Extraction of Canopy Height Information of Potato Seedlings
The height data obtained by the planar array LiDAR represent the distance from canopy to the planar array LiDAR, rather than its actual height. On the basis of these data, the height of canopy can be calculated by Formula (5):
where Hi,j is the actual height of the scanning point in row I, column J, in mm; Si,j is the distance between the plane where the LiDAR is in row I and the plane where the scanning points are in the height of potato seedling canopy, in mm.
2.7. Data Correction
The data contained vibration caused by uneven ground and the interference caused by the external objective environment during the data monitoring of the system platform. To obtain accurate test data, the irrelevant interference must be filtered before the 3D graphics reconstruction of potato seedling canopy height in the field.
2.7.1. Data Collation for a Tilted System
The LVT518T uniaxial tilt sensor adopts the principle of noncontact measurement and can output the real-time attitude inclination of the detection system platform moving in the field due to the uneven ground at ridge bottom, with an accuracy of up to 0.1°.
The ante-and-ante-dip measurement algorithm:
where S1 is the true distance between the plane involving LiDAR and the plane involving potato seedling canopy, in mm; S2 is the precorrection distance between the plane involving LiDAR and the plane involving potato seedling canopy, in mm; H1 is the height of modified seedling canopy scanning point from the ridge top, in mm; and θ is the tilt angle and degree of the platform during operation.
The right and left inclination measurement algorithm:
where S3 is the true distance between the plane involving LiDAR and plane involving the height of potato seedling canopy, in mm; S4 is the precorrection distance between the plane involving LiDAR and the plane involving the height of potato seedling canopy, in mm; H2 is the height of modified seedling canopy scanning point from the ridge top, in mm; and α is the left and right inclination and degree of platform during the operation.
Front and back left/right angle measurement algorithm:
where S5 is the true distance between the plane containing LiDAR and the plane containing the height of seedling canopy, in mm; S6 is the distance between the plane containing LiDAR and the plane containing the height of seedling canopy before correction, in mm; and H3 is the height of the modified seedling canopy scanning point from the ridge top, in mm.
2.7.2. Failure Point Search and Correction
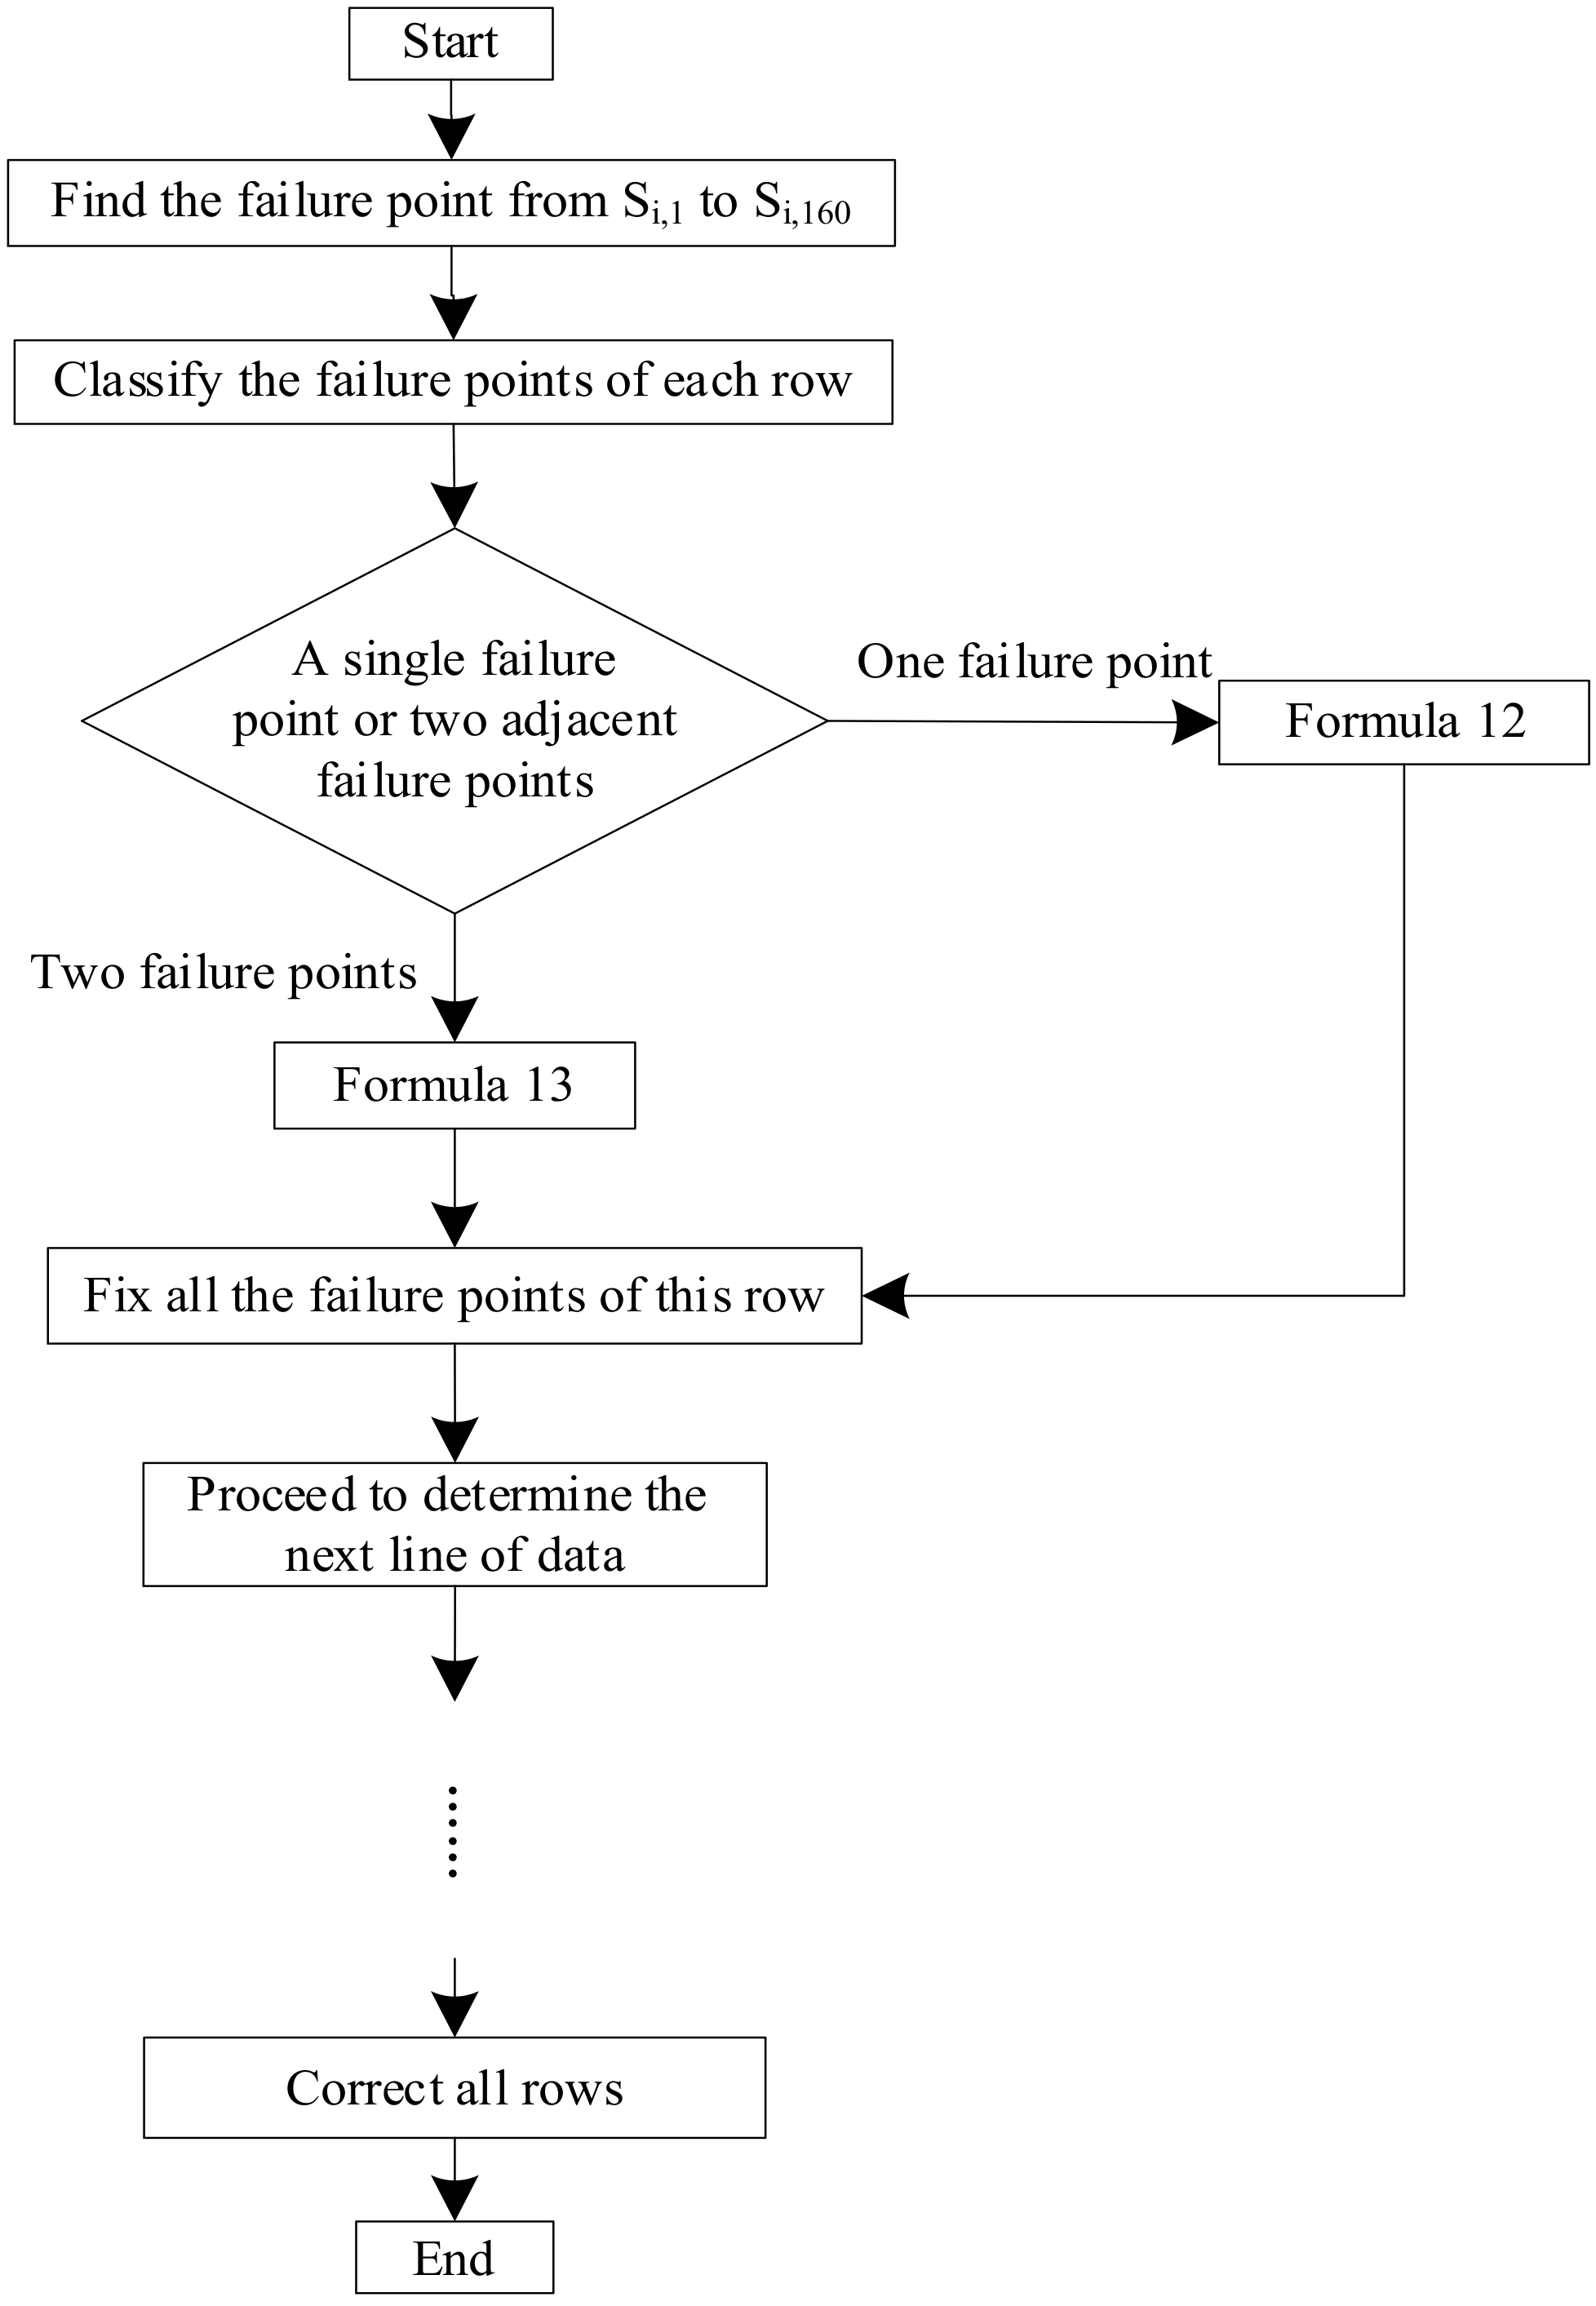
Before testing, the performance of the sensor was tested. It was found that 1–2 failure points will appear near the light reflection point. All failure points were concentrated in the middle of blade, and no failure point appeared at its edge. The failure points caused by light reflection in the data are corrected by the following algorithm:
In the case of one failure point, it may be in the middle of or at both ends of a row of data. Let the scanned data points be Si,j = 0, then
In the case of two failure points, they may be in the middle of or at the end of a row of data. Let the scanned data points be Si,j = Si,j+1 = 0, then
The flowchart for finding failure point is as Figure 6:
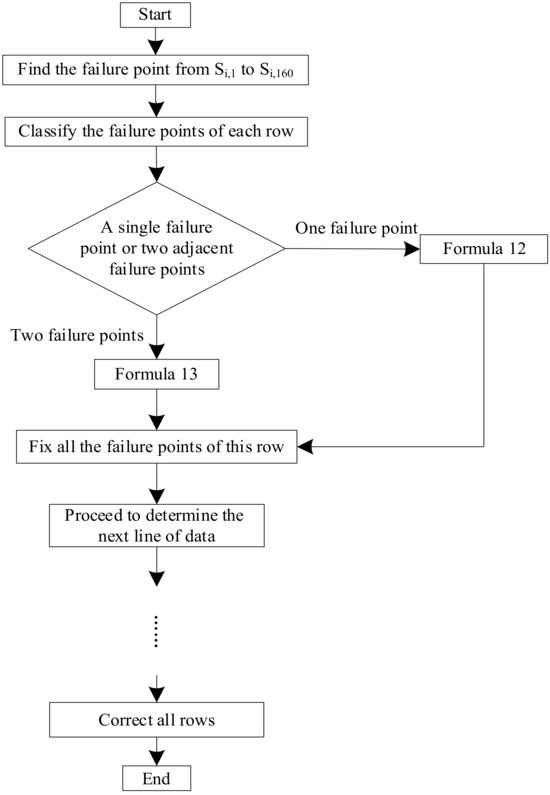
Figure 6.
Flow chart for finding correction failure point.
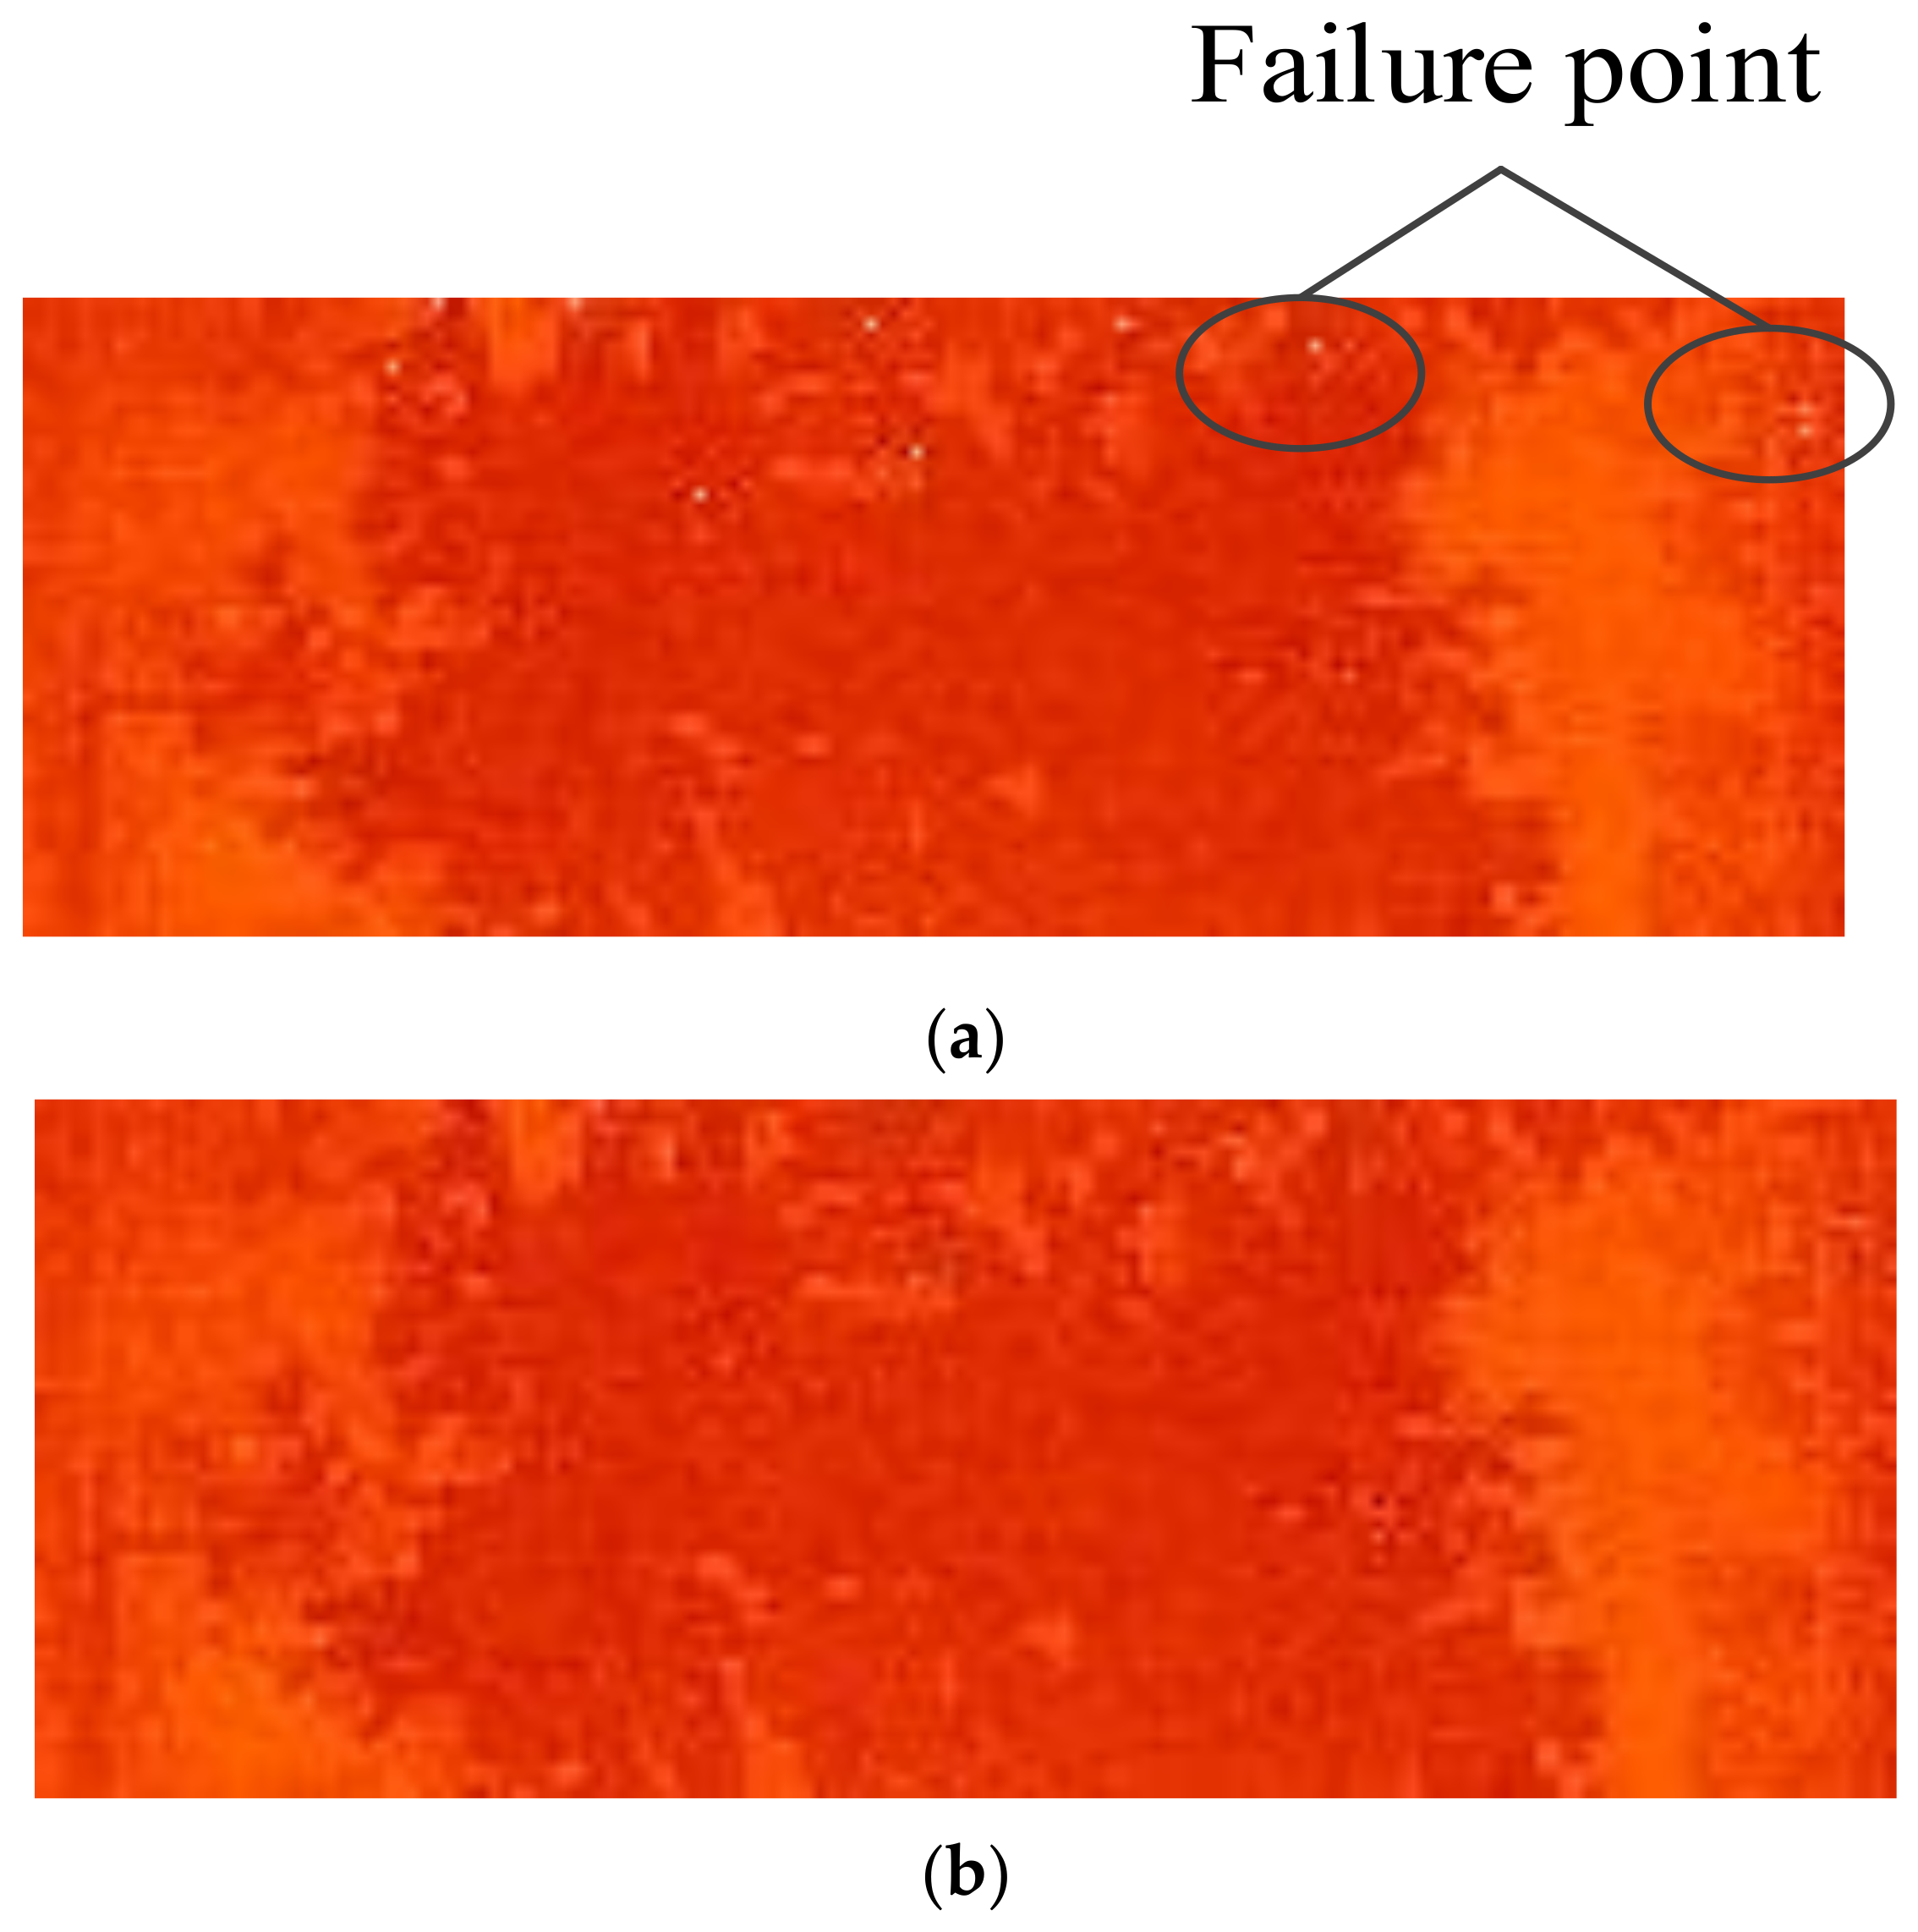
The 2D images of the potato seedling canopy information before and after failure point correction are shown in Figure 7. As shown in Figure 7a, the failure point is obviously a white bright spot. After correction, the fault was eliminated (as shown in Figure 7b).
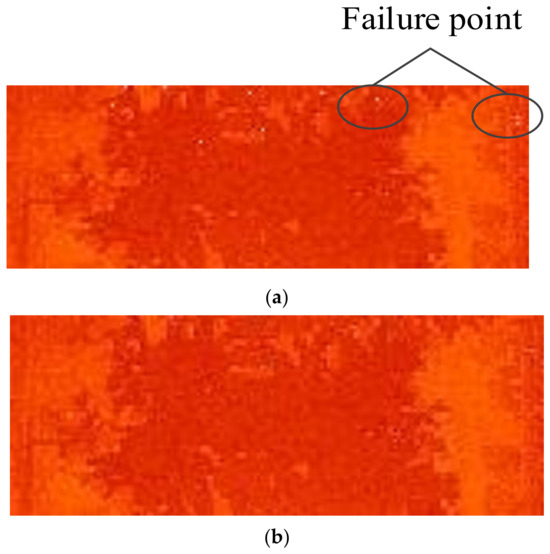
Figure 7.
Comparison of scanning before and after failure point correction: (a) Fix the scan before. (b) Fix the postfailure scan.
2.7.3. Dynamic Data Analysis
The LiDAR scans 20 frames per second at the interval of Δt = 0.05 s. The actual forward speed νa of the machine can be detected by the rotary encoder. The forward distance Lf of the machine between the two adjacent frames is
The installation height of the front array LiDAR is calculated in Section 3.1, and the length of the potato seedling canopy detected by the front array LiDAR scanning frame is L ≈ 124.64 mm. Substituting it into Equation (1) yields
where νt is the theoretical maximum forward speed of system platform. When the platform is moving in the field, the scanning data of two frames apart from each other scanned by the facial-array LiDAR can overlap and be precisely connected. If there are data missing between the two frames, the measurement results will be inaccurate, so the moving speed of the system platform cannot be too high.
Calculation shows that νt = 2.4928 m/s. If νa > νt, the part of canopy information between two adjacent frames cannot be detected; if νa = νt, the scanning points between the two adjacent frames are connected head to tail, without overlap between two adjacent frames; and if νa < νt, an overlap occurs between two adjacent frames. Due to the uneven field ground, the forward speed of the platform will not exceed 2.4829 m/s, and the information on potato seedling canopy detected by the LiDAR will overlap, rather than be missing.
The overlapping data points can be modified by the data algorithm as follows:
The frame overlap of potato seedling detected by planar array LiDAR is shown in Figure 8. Let the real-time forward speed detected by the platform be v, the overlap distance between every two frames be x, the scanning frequency of LiDAR is 20 frames/sec, and the corresponding detection length range be ν·Δt.
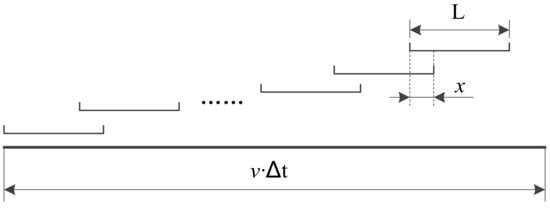
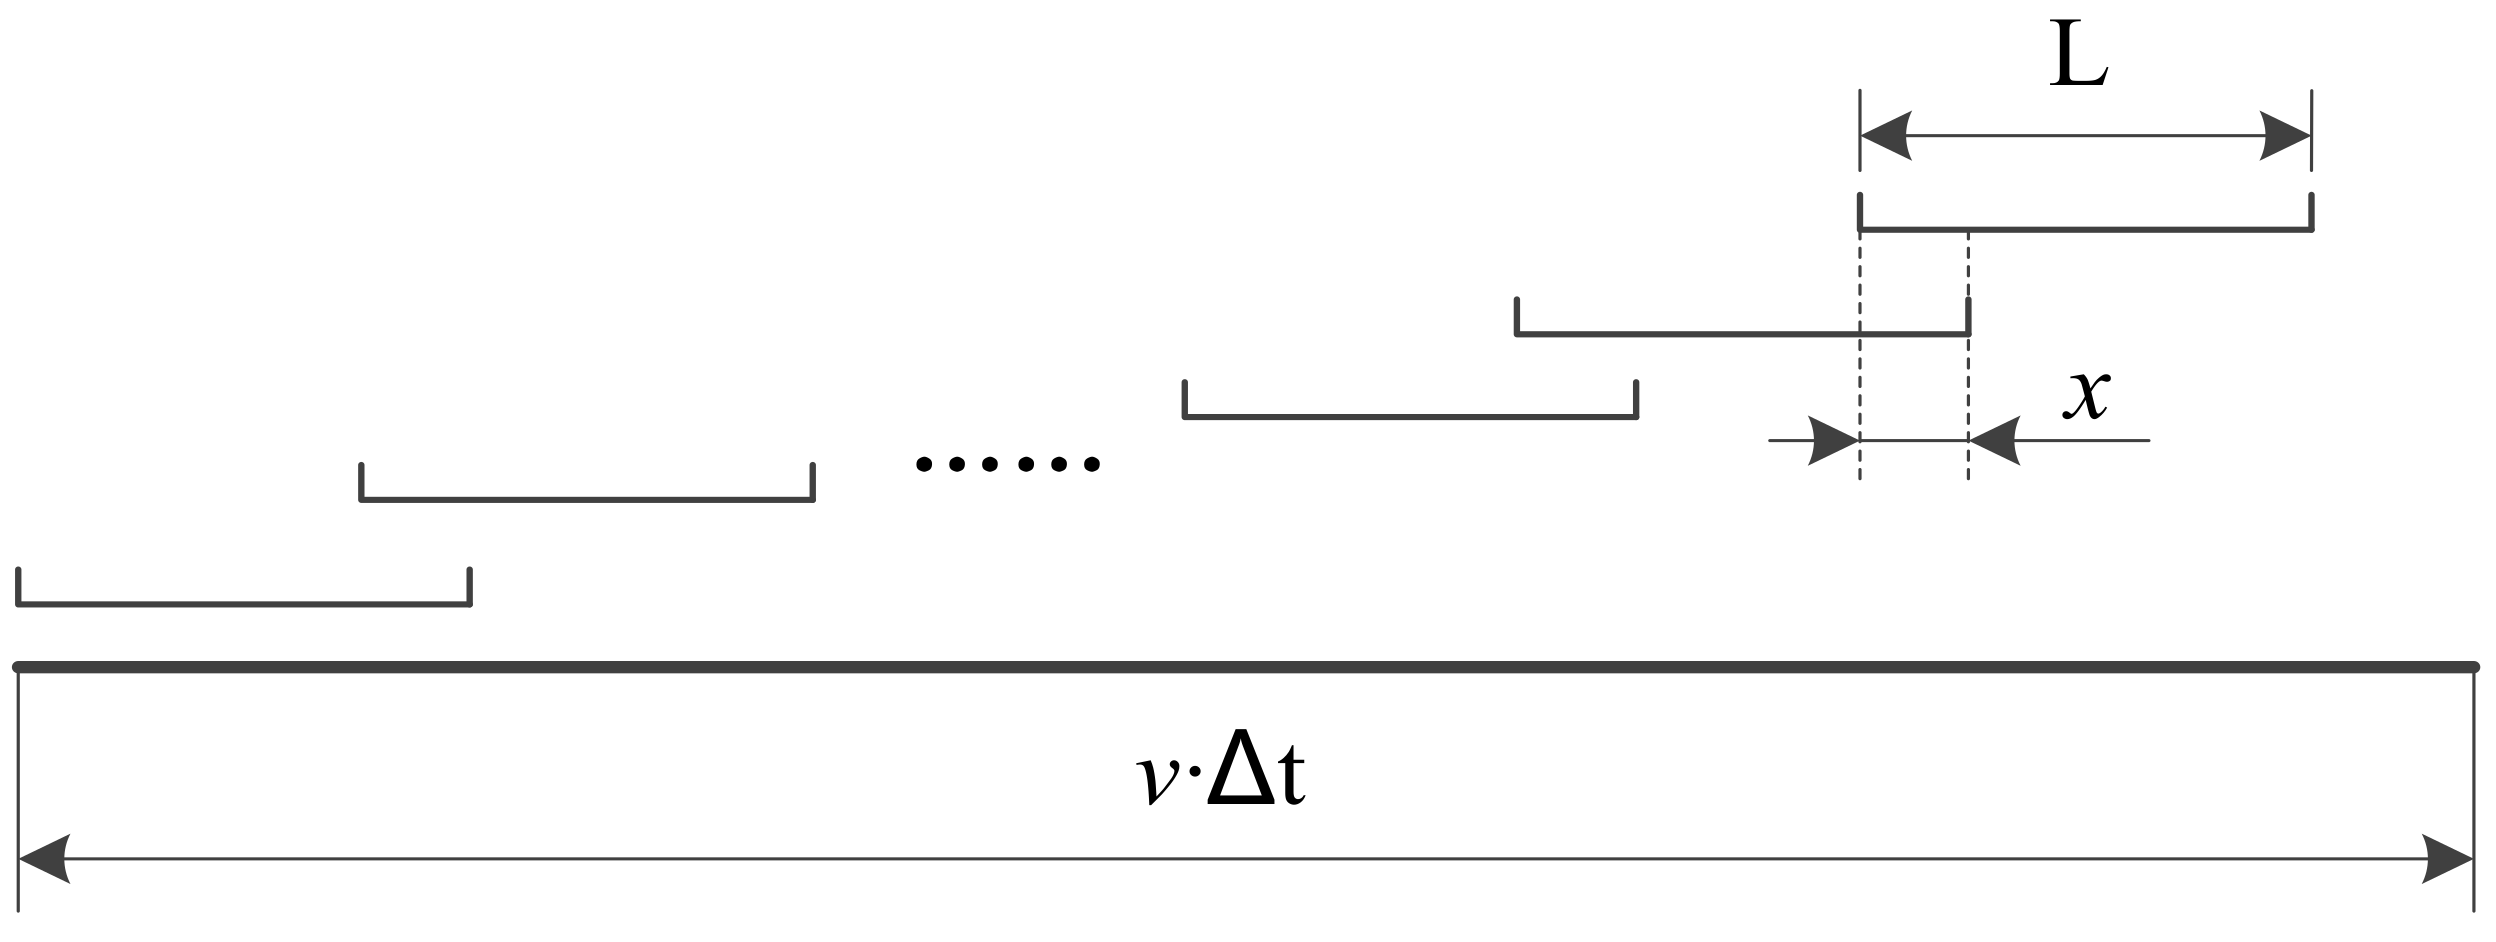
Figure 8.
A schematic diagram of each frame overlap of potato seedling detected by planar array LiDAR.
Figure 8.
A schematic diagram of each frame overlap of potato seedling detected by planar array LiDAR.
The overlapping distance between every two frames is obtained
The distance between two rows of scan points is
The number of overlapping rows of data points is
The first n rows of each frame were deleted from the second frame, and the remaining 60-n rows were joined end-to-end to obtain the corrected 160-column data point matrix of N rows.
According to the designed algorithm and measurement data, the actual measured height of the potato seedling crown without overlap was determined.
2.8. Data Reconstruction after Correction
The above algorithm was used to modify the collected data on potato seedling crown height, and the height morphology diagram of the whole test field was drawn as follows.
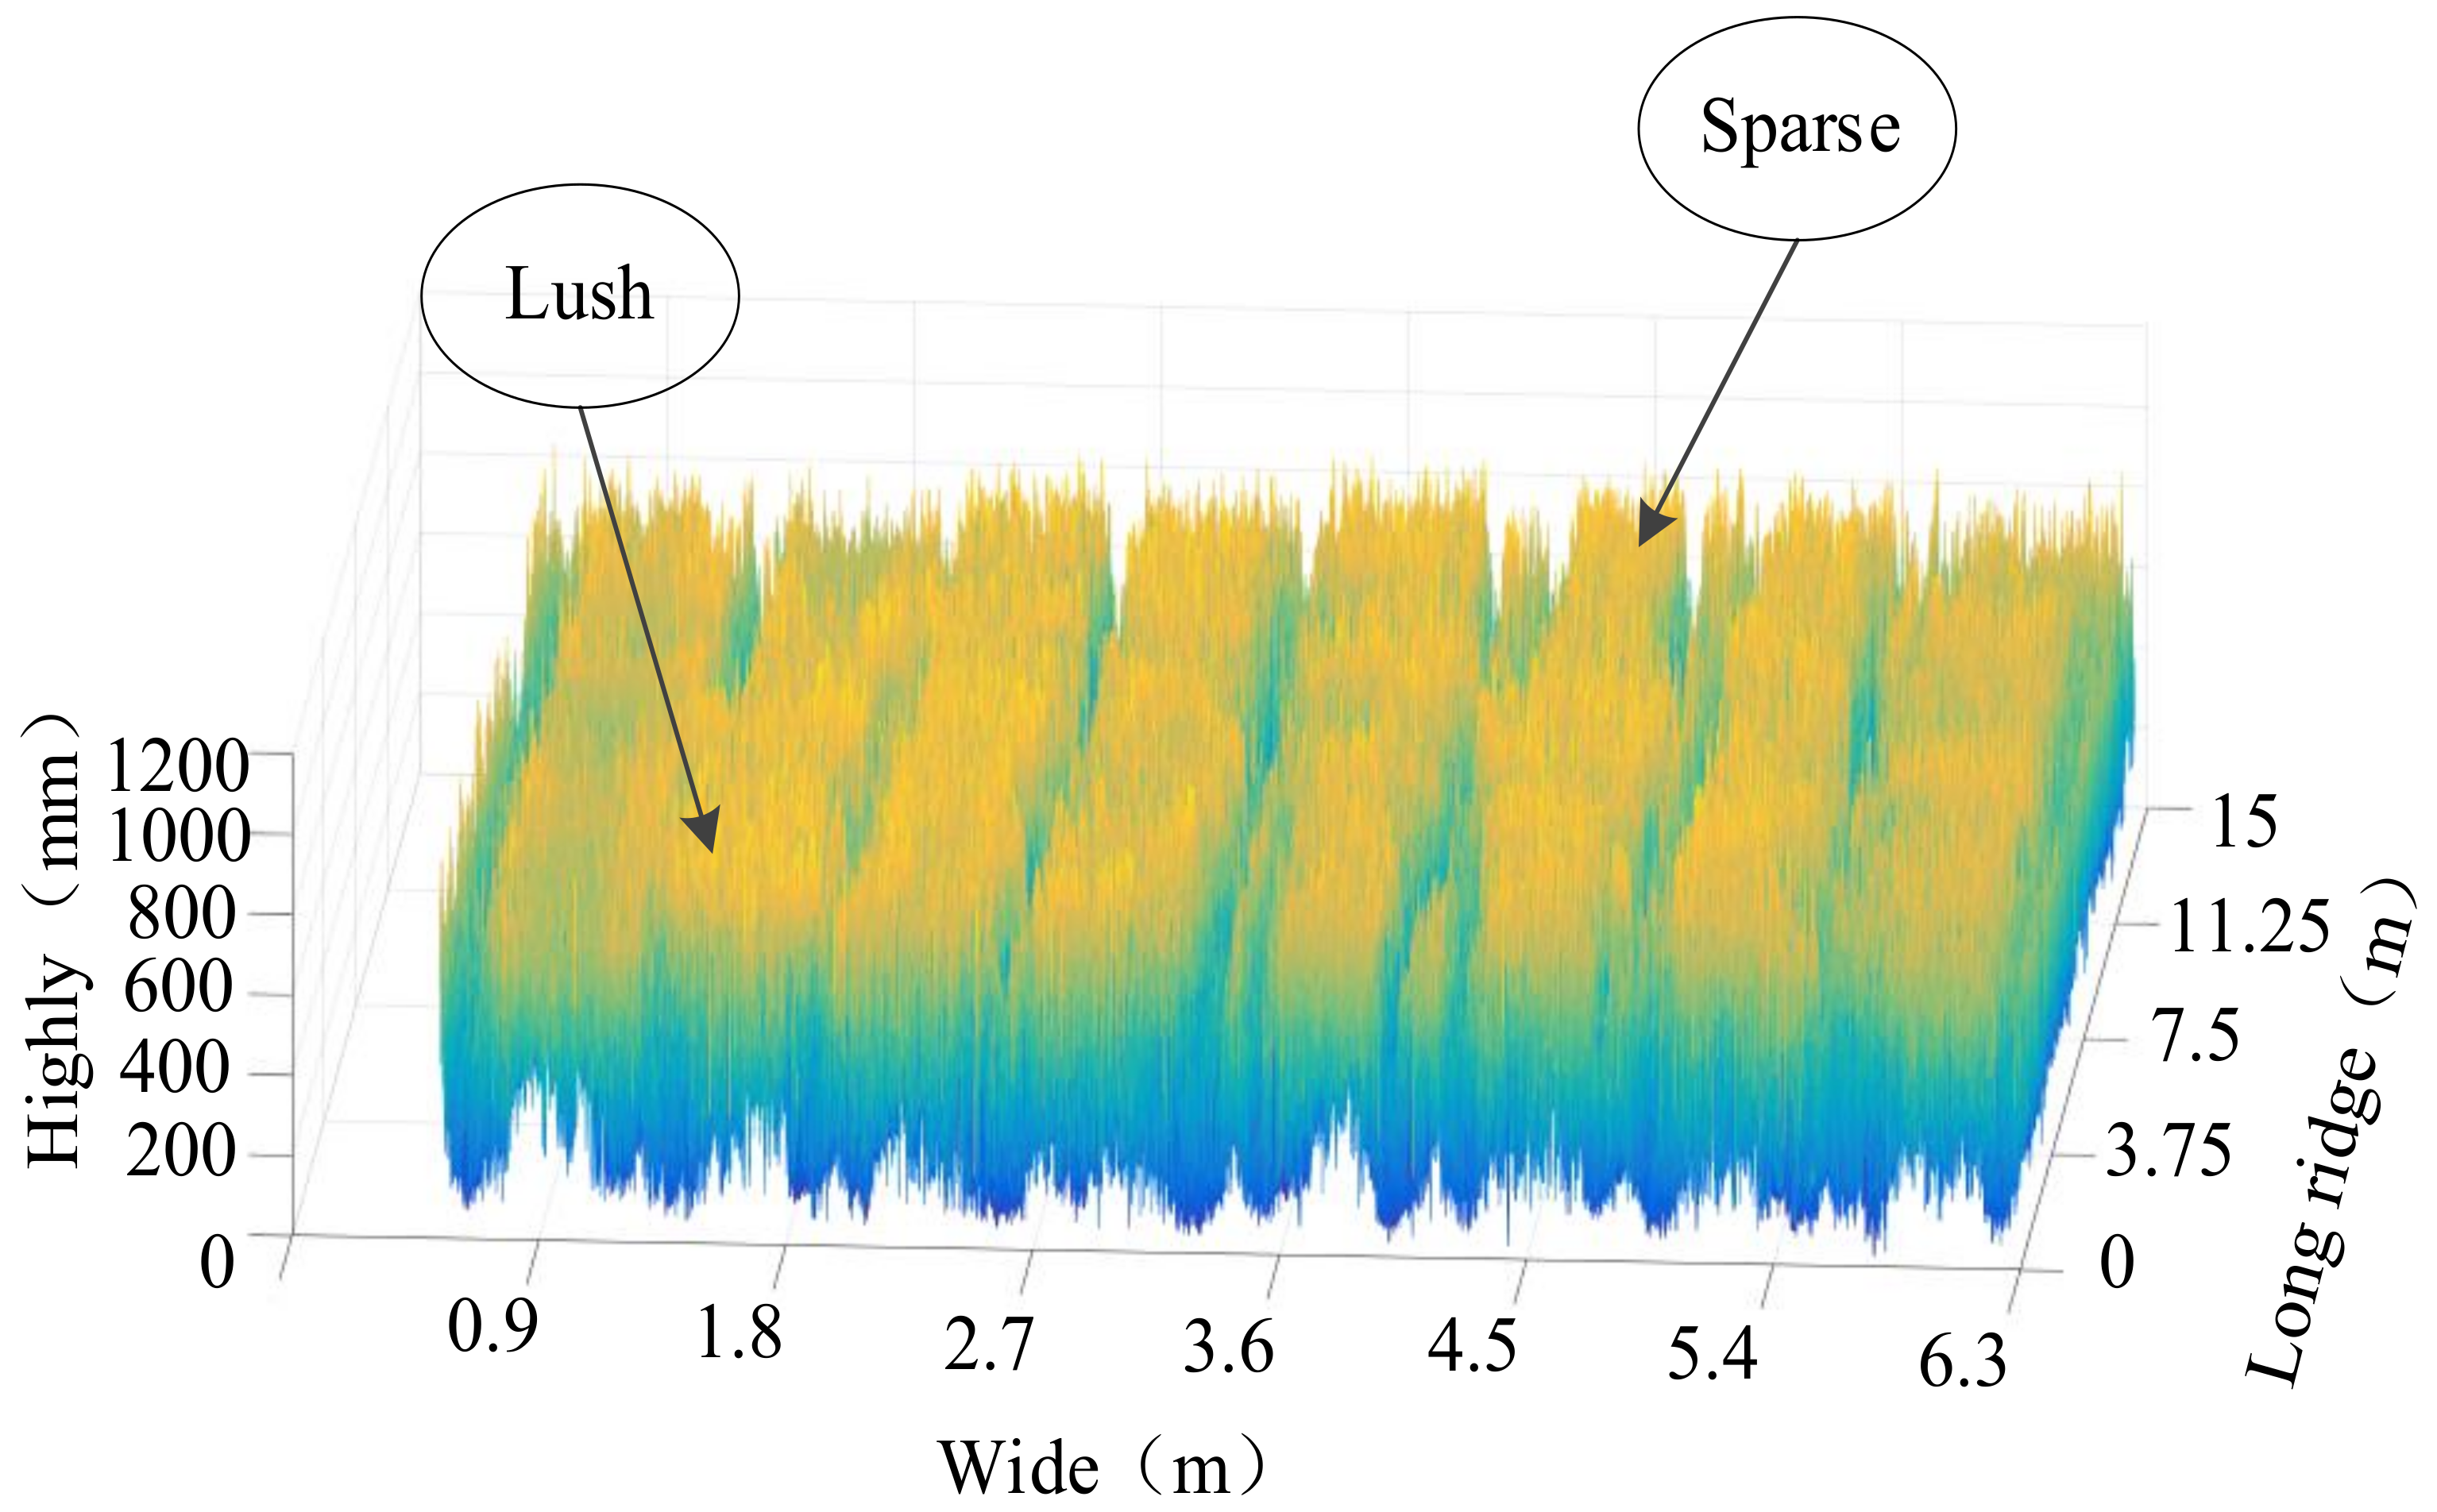
As shown in Figure 9, the height is the crown layer of potato seedlings, and the bottom of the ridge between two rows of potato seedlings is the ridge bed. The actual height of the ridge is lower than the crown layer of potato seedlings, and the ridges are all covered by potato seedlings. The distribution of the crown layer and ridge of potato seedlings can be clearly seen in Figure 9. The canopy of potato seedlings is obviously divided into eight ridges, and the height data of tested potato seedlings are dense. The position of corrugations is reflected in the reduction in measured data. Moreover, there is a line of reduced data between the canopy data of each two rows of potato seedlings. The height data of potato seedlings are sparse, or namely, the canopy of potato seedlings is sparse.
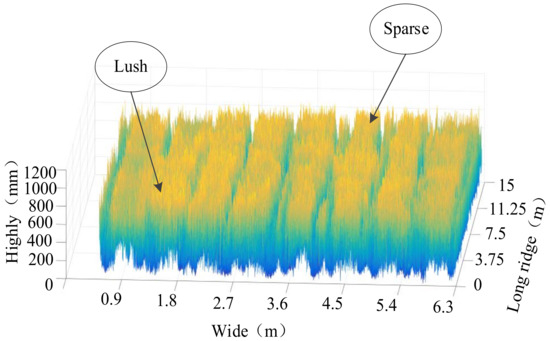
Figure 9.
Image of canopy height of potato seedling in eight plots in the test field.
3. Results and Discussion
3.1. Comparison of Detection System Method and Manual Measurement Method for Potato Seedling Canopy Height
To test and verify the laser LiDAR detection of potato canopy, each time before the field experiment of potato plants by the platform, canopy height was detected by artificial measurement. From a small area positioned close to the field edge, measurement was performed along the ridge direction from potato planting at an interval of 60 mm. Potato seedling height was measured from the field edge along the direction perpendicular to the ridge direction at an interval of 5 mm. A set of potato seedling heights was monitored. Three groups were set, and each group had 160 points. The three groups of data were measured at an interval of 6232 mm. Nine sets of data and 1440 sampling points were measured in an experimental plot. A total of 72 sets of data were measured in the whole test field.
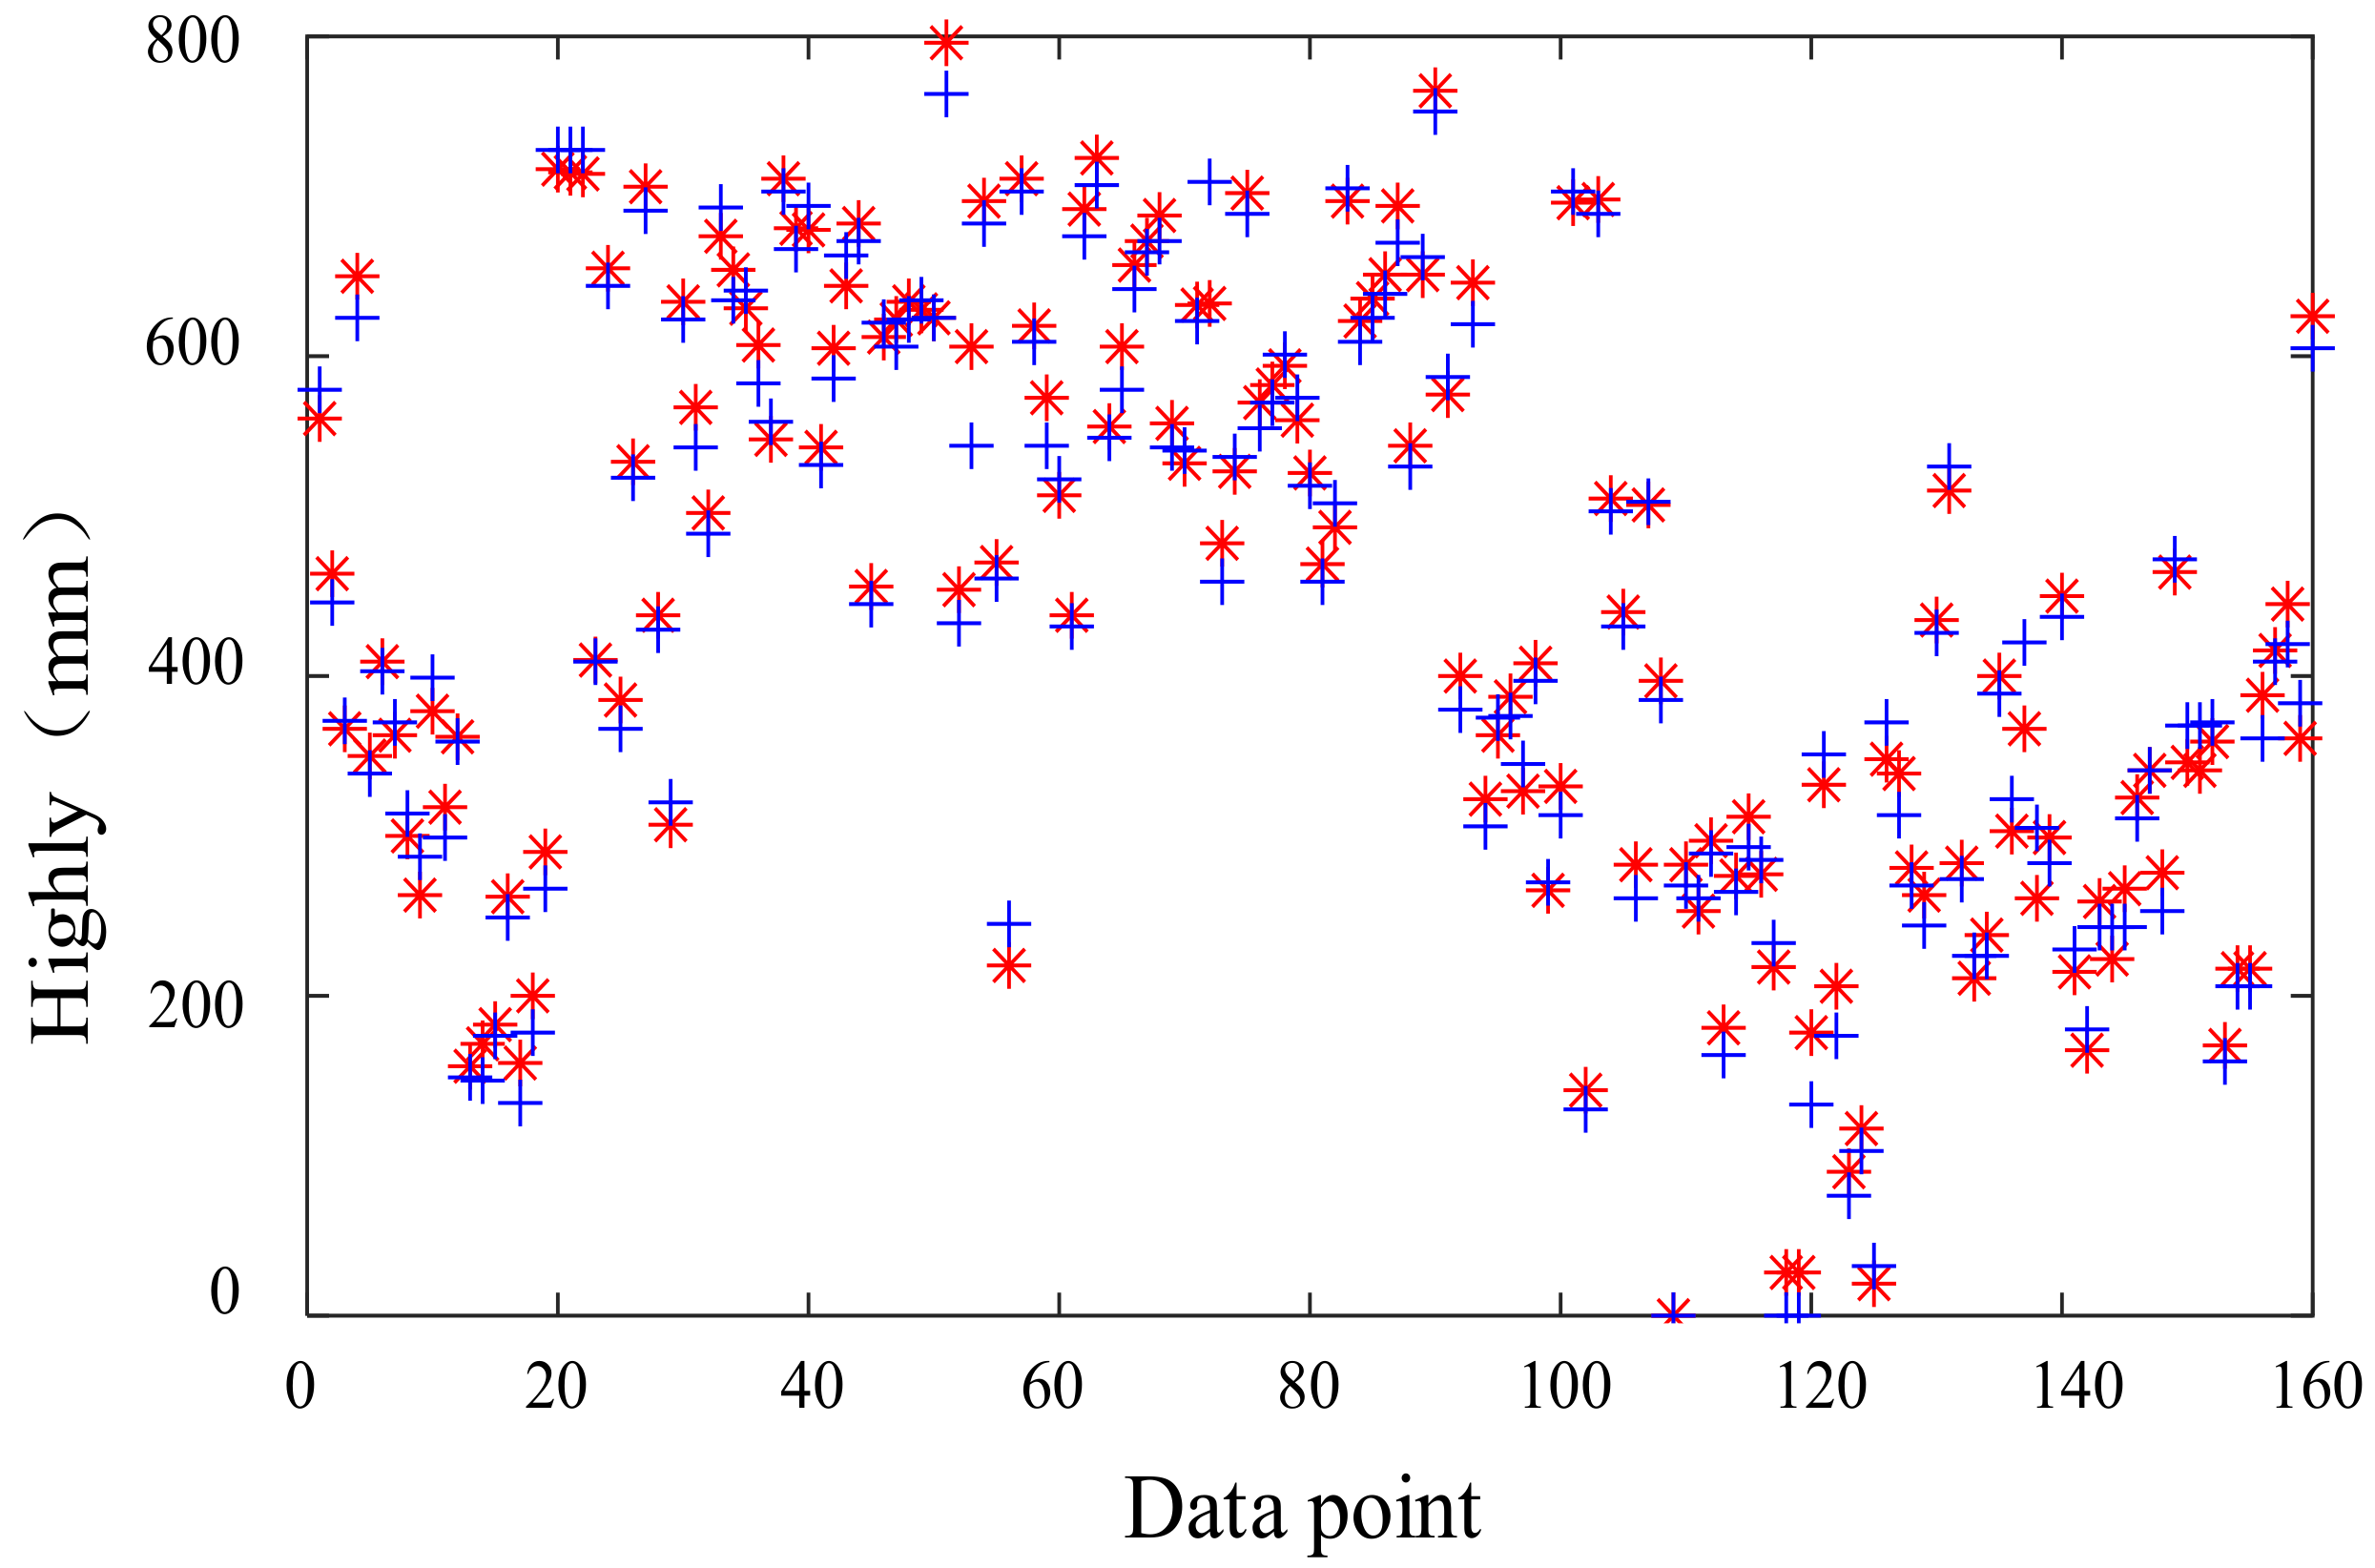
In order to ascertain the reliability of the detection system for measuring potato seedling canopy height, three distinct measurement data were corrected and averaged for analysis. Data pertaining to potato canopy height, as determined by the automated system, were meticulously extracted and aligned with the corresponding manually measured values. A direct comparison of these measurements, presented point by point, is illustrated in Figure 10.

Figure 10.
Comparison of measured values by manual method and the system (*: system measured value; +: manually measured value).
Data points from 30 to 90 are significantly elevated in altitude, with the canopy height predominantly ranging between 420 and 800 mm, as illustrated in Figure 10. This concentration indicates a consistent canopy height for the majority of the potato seedlings. The 120th data point, situated at the base of the furrow, along with points 100 to 140, displays irregularities in height measurements due to the inherent variability in the growth of potato seedlings. Specifically, the seedlings’ growth sometimes extends across to neighboring ridges, affecting the canopy’s appearance. The surface detection LiDAR accurately captures this canopy information, reflecting the seedlings’ natural irregularities. By comparing the system-measured values of the same data point with the manual-measured values, it was found that some of the system-measured values were larger than the manual-measured values, some were smaller, and some were very close to the manual-measured values. The error between the two measurements is irregular.
By meticulously comparing the system-derived measurements with the manual readings for each experimental plot, the average relative error between the automated measurements and the manual data set for each cell was calculated, as detailed in Table 1.

Table 1.
Comparison of the measured values of detection system and manual measurement values.
In the field experiment, the detection system’s relative errors, when compared with manual measurements, range from a minimum of 3.67 ± 0.42% to a maximum of 8.36 ± 3.47%. The average relative errors fall within the 3–9% bracket, all of which are below the 10% threshold, as depicted in Table 1. The plane array LiDAR detection system demonstrates adaptability to the complex environment between plot lanes, providing more precise measurements of potato plant canopy heights.
3.2. Analysis of Detection Efficiency
The detection system offers significant advantages in measuring canopy height, with its platform achieving a substantially higher efficiency than manual methods. In a test conducted on eight plots, the system completed scans in a mere 15–20 min, yielding over 900,000 effective data points. In contrast, manual measurement required 6 to 7 h of labor by four staff members to cover the same area, resulting in a mere 11,520 data points. Manual measurement is not only laborious and monotonous but also inefficient in terms of manpower utilization.
The sensor detection system has the capability to digitize the canopy information of potato seedlings, transforming it into digital signals. These signals can then be processed by an algorithm to generate control signals. This innovative approach can significantly enhance the efficiency and accuracy of machinery used for the recovery of potato seedlings, thereby advancing the progress of precision agriculture.
4. Conclusions
This study explored an innovative precision agriculture platform that incorporates phased array LiDAR technology, markedly improving potato cultivation. The automation system of this platform has improved the accuracy of canopy height measurement, reduced manual labor, and improved agricultural efficiency and sustainability.
(1) Automated Technology Integration: The platform features an array of high-precision components, including rotary encoders, motors, tilt sensors, and advanced LiDAR, which work in concert to automate data acquisition and analysis, producing detailed 3D canopy maps for morphological studies. Moreover, the device used in this experiment has a simple user interface design, convenient human–computer interaction, and can operate stably in complex field environments.
(2) Sophisticated Algorithms for Enhanced Accuracy: A specialized algorithm for analyzing potato canopy height has been developed by integrating the installation height of LiDAR, precise measurement of tilt sensors, and meticulous postprocessing technology. This algorithm ensures high precision and reliability in the measurement outcomes, with a minimum relative error of 3.67 ± 0.42%, a maximum relative error of 8.36 ± 3.47%, and an average error rate within the 3% to 9% range, all of which are well below the stringent 10% measurement standard, satisfying the rigorous demands of precision agriculture.
(3) Practical Impact and Advancement: The automatic scanning of this platform simplifies the collection of potato canopy data and provides valuable insights for accurate canopy management. It advances agricultural informatization and precision, setting new standards for efficiency and accuracy. With ongoing technological improvements, the platform is expected to enhance measurement speed and accuracy, supporting sustainable and low-carbon agricultural practices. The success of this platform may also catalyze the development of further intelligent agricultural technologies, fostering industry modernization and intelligence.
The algorithm employed in this study represents an innovative mathematical computation technique, which, despite its inherent limitations in data processing capacity, lays a foundation for future advancements. Subsequent research endeavors will integrate state-of-the-art LiDAR technology with sophisticated neural network-based intelligent algorithms to achieve a more nuanced and accurate characterization of plant canopy dynamics. The ultimate goal is to seamlessly integrate these smart technologies into the field management practices of agricultural crops, thereby enhancing precision and efficiency in agricultural operations.
Author Contributions
H.T., writing—original draft; P.W., writing—review and editing; X.Y., providing materials; Q.X., software, investigation, validation, formal analysis, and data curation; G.M., conceptualization and methodology; Z.L., resources, project administration, and funding acquisition. All authors have read and agreed to the published version of the manuscript.
Funding
This work was supported by the Foundation of Modern Agricultural Technology System Innovation Team Expert in Shandong Province (SDAIT-16-10), the Agricultural Equipment Research and Development Innovation Program of Shandong Province (NO.2018YF020, NO.2017YF002).
Institutional Review Board Statement
Not applicable.
Informed Consent Statement
Not applicable.
Data Availability Statement
The data presented in this study are available on request from the corresponding author. The data are not publicly available due to this experiment being conducted at Shandong Agricultural University and the data belonging to Shandong Agricultural University. Since the author has changed her work unit and the data in this paper belong to the original organization, the data cannot be published after her resignation.
Acknowledgments
Thanks to Honglei Jia from Jilin University for his support during the verification phase of the study and the writing process of the paper. We would like to express our gratitude.
Conflicts of Interest
The authors declare no conflicts of interest.
References
- Gil, J.D.B.; Reidsma, P.; Giller, K.; Todman, L.; Whitmore, A.; Ittersum, M.v. Sustainable development goal 2: Improved targets and indicators for agriculture and food security. Ambio 2019, 48, 685–698. [Google Scholar] [CrossRef] [PubMed]
- Campos, H.; Ortiz, O. The Potato Crop: Its Agricultural, Nutritional and Social Contribution to Humankind; Springer: Berlin/Heidelberg, Germany, 2019. [Google Scholar] [CrossRef]
- Ezekiel, R.; Singh, N.; Sharma, S.; Kaur, A. Beneficial phytochemicals in potato—A review. Food Res. Int. 2013, 50, 487–496. [Google Scholar] [CrossRef]
- Devaux, A.; Goffart, J.P.; Kromann, P.; Andrade-Piedra, J.; Polar, V.; Hareau, G. The potato of the future: Opportunities and challenges in sustainable agri-food systems. Patato Res. 2021, 64, 681–720. [Google Scholar] [CrossRef] [PubMed]
- Lu, Y.; Kear, P.; Lu, X.P.; Gatto, M. The status and challenges of sustainable intensification of rice-potato systems in southern China. Am. J. Potato Res. 2021, 98, 361–373. [Google Scholar] [CrossRef]
- Wang, L.H.; Ma, H.; Li, J.L.; Gao, Y.H.; Fan, L.; Yang, Z.H.; Yang, Y.Z.; Wang, C.Y. An automated extraction of small- and middle-sized rice fields under complex terrain based on SAR time series: A case study of Chongqing. Comput. Electron. Agric. 2022, 200, 107232. [Google Scholar] [CrossRef]
- Maddonni, G.A.; Otegui, M.E.; Cirilo, A.G. Plant population density, row spacing and hybrid effects on maize canopy architecture and light attenuation. Field Crops Res. 2001, 71, 183–193. [Google Scholar] [CrossRef]
- Yu, Z.H.; Cao, Z.G.; Bai, X.D. Automatic measurement of crops canopy height based on monocular vision. In Proceedings of the 7th Symposium on Multispectral Image Processing and Pattern Recognition (MIPPR)—Remote Sensing Image Processing, Geographic Information Systems, and Other Applications, Guilin, China, 4–6 November 2011; Volume 8006. [Google Scholar] [CrossRef]
- Begna, S.H.; Hamilton, R.I.; Dwyer, L.M.; Stewart, D.W.; Cloutier, D.; Liu, A.; Smith, D.L. Response of corn hybrids differing in canopy architecture to chemical and mechanical (rotary hoeing) weed control: Morphology and yield. J. Agron. Crop Sci.-Z. Acker Pflanzenbau 2001, 186, 167–173. [Google Scholar] [CrossRef]
- Grenzdörffer, G.J. Crop height determination with uas point clouds. Int. Arch. Photogramm. Remote Sens. Spatial Inf. Sci. 2014, 40, 135–140. [Google Scholar] [CrossRef]
- Richards, R.A.; Cavanagh, C.R.; Riffkin, P. Selection for erect canopy architecture can increase yield and biomass of spring wheat. Field Crops Res. 2019, 244, 107649. [Google Scholar] [CrossRef]
- Uranbey, S.; Başalma, C. Correlations among stolon length, stolon number, plant height and tuber yield in potato. Turk. J. Field Crops 1998, 3, 27–39. Available online: https://xueshu.baidu.com/usercenter/paper/show?paperid=9740992a83e0214476084dca4bdf0d86&site=xueshu_se&hitarticle=1 (accessed on 7 July 2024).
- Nyende, A.B.; Schittenhelm, S.; Mix-Wagner, G.; Greef, J.M. Yield and canopy development of field grown potato plants derived from synthetic seeds. Eur. J. Agron. 2005, 22, 175–184. [Google Scholar] [CrossRef]
- Víg, R.; Huzsvai, L.; Dobos, A.; Nagy, J. Systematic measurement methods for the determination of the spad values of maize (Zea mays L.) canopy and potato (Solanum tuberosum L.). Commun. Soil Sci. Plant Anal. 2012, 43, 1684–1693. [Google Scholar] [CrossRef]
- Cai, L.; Zhao, Y.; Huang, Z.; Gao, Y.; Li, H.; Zhang, M. Rapid measurement of potato canopy coverage and leaf area index inversion. Appl. Eng. Agric. 2020, 36, 557–564. [Google Scholar] [CrossRef]
- Lati, R.N.; Filin, S.; Eizenberg, H.J.C. Estimating plant growth parameters using an energy minimization-based stereovision model. Comput. Electron. Agric. 2013, 98, 260–271. [Google Scholar] [CrossRef]
- Brocks, S.; Bareth, G. Evaluating dense 3D reconstruction software packages for oblique monitoring of crop canopy surface. In Proceedings of the 23rd Congress of the International-Society-for-Photogrammetry-and-Remote-Sensing (ISPRS), Prague, Czech Republic, 12–19 July 2016; pp. 785–789. [Google Scholar] [CrossRef]
- Chang, A.J.; Jung, J.H.; Maeda, M.M.; Landivar, J. Crop height monitoring with digital imagery from Unmanned Aerial System (UAS). Comput. Electron. Agric. 2017, 141, 232–237. [Google Scholar] [CrossRef]
- Hyyppa, J.; Hyypp, H.; Leckie, D.; Gougeon, F.; Yu, X.; Maltamo, M. Review of methods of small-footprint air borne laser scanning for extracting forest inventory data in boreal forests. Int. J. Remote Sens. 2008, 29, 1339–1366. [Google Scholar] [CrossRef]
- Lang, N.; Kalischek, N.; Armston, J.; Schindler, K.; Dubayah, R.; Wegner, J.D. Global canopy height regression and uncertainty estimation from GEDI LIDAR waveforms with deep ensembles. Remote Sens. Environ. 2022, 268, 112760. [Google Scholar] [CrossRef]
- Meyer, G.E.; Davison, D.A. An electronic-image plant-growth measurement system. Trans. ASAE 1987, 30, 242–248. [Google Scholar] [CrossRef]
- Harkel, J.; Bartholomeus, H.; Kooistra, L. Biomass and crop height estimation of different crops using uav-based Lidar. Remote Sens. 2020, 12, 17. [Google Scholar] [CrossRef]
- Chaudhury, A.; Ward, C.; Talasaz, A.; Ivanov, A.G.; Barron, J.L. Computer vision based autonomous robotic system for 3D plant growth measurement. In Proceedings of the 12th Conference on Computer and Robot Vision CRV, Halifax, NS, Canada, 3–5 June 2015; pp. 290–296. [Google Scholar] [CrossRef]
- Dong, T.; Liu, J.; Qian, B.; He, L.; Liu, B.; Wang, R.; Jing, Q.; Champagne, C.; McNairn, H.; Powers, J.; et al. Estimating crop biomass using leaf area index derived from Landsat 8 and Sentinel-2 data—ScienceDirect. ISPRS J. Photogramm. Remote Sens. 2020, 168, 236–250. [Google Scholar] [CrossRef]
- Milas, A.S.; Romanko, M.; Reil, P.; Abeysinghe, T.; Marambe, A. The importance of leaf area index in mapping chlorophyll content of corn under different agricultural treatments using UAV images. Int. J. Remote Sens. 2018, 39, 5415–5431. [Google Scholar] [CrossRef]
- Gonzalez, B.; Delia, A.; Kiniry, R.J.; Maas, S.J.; Mario, T.L.; Jaime, M.C.; Mendoza, J.L.; Richardson, C.W.; Jaime, S.G.; Manjarrez, J. Large-area maize yield forecasting using leaf area index based yield model. Agron. Model. 2005, 97, 418–425. [Google Scholar] [CrossRef]
Disclaimer/Publisher’s Note: The statements, opinions and data contained in all publications are solely those of the individual author(s) and contributor(s) and not of MDPI and/or the editor(s). MDPI and/or the editor(s) disclaim responsibility for any injury to people or property resulting from any ideas, methods, instructions or products referred to in the content. |
© 2024 by the authors. Licensee MDPI, Basel, Switzerland. This article is an open access article distributed under the terms and conditions of the Creative Commons Attribution (CC BY) license (https://creativecommons.org/licenses/by/4.0/).