Abstract
In large-scale poultry farming, real-time online measurement of egg weight and shape parameters remains a challenge. To address this, we developed FEgg3D, a non-contact dynamic measuring device based on a self-designed laser scanner. The device employed a subset of the point cloud generated to predict the shape parameters and weight of eggs using machine learning algorithms. Different colors and sizes of eggs on various backgrounds were scanned using FEgg3D mounted on a gantry system. Our results demonstrated the following: (1) The Support Vector Regression (SVR) model was optimal for major axis length estimation, with an R2 of 0.932 using six laser lines and eight points per line. (2) The Gaussian Process Regression (GPR) model excelled in minor axis length estimation, achieving an R2 of 0.974 with six laser lines and 16 points per line. (3) SVR was optimal for volume estimation, attaining an R2 of 0.962 with six laser lines and 16 points per line. (4) GPR showed superior performance in weight prediction, with an R2 of 0.964 using five laser lines and 16 points per line. Including density features significantly improved accuracy to an R2 of 0.978. This approach paves the way for advanced online egg measurement in commercial settings.
1. Introduction
The layer hen industry is an integral component of animal husbandry and stands as a cornerstone of agriculture. Eggs, being a cost-effective and nutritionally rich food source, constitute a vital aspect of people’s daily dietary intake [1]. In the layer hen farming industry, the quality of eggs serves as a crucial indicator for evaluating feed conversion efficiency and the production performance of laying hens [2,3]. Parameters such as egg weight exhibit significant correlations with various egg quality indicators, including egg shape index, shell thickness, percentage of albumen weight, and percentage of yolk weight [4], often serving as benchmarks for egg grading. Moreover, the geometric characteristics of eggs provide essential reference information for tasks such as poultry weight prediction and shell quality inspection in layer farming operations [5]. However, traditional methods of measuring egg weight and geometric parameters, such as collecting eggs for centralized measurement, lack traceability to individual laying hens, thus failing to provide precise insights into the production performance of each hen. Alternatively, individual-level data collection typically relies on manual methods, resulting in prolonged detection times, increased labor burdens, and inconsistent measurements due to subjective factors. Additionally, human intervention poses challenges in poultry house management and sanitation, rendering manual methods impractical for large-scale layer hen farming. Therefore, advancing research in the automated and intelligent detection of egg weight and geometric parameters within layer hen facilities is important.
The drainage method based on Archimedes’ principle is widely used for measuring egg volume, but this can affect the eggs, such as impacting the hatching process [6]. Consequently, many researchers have investigated non-destructive methods for measuring egg parameters. Narushin et al. [7] developed mathematical models using egg length and width to accurately represent the egg contour, providing theoretical formulas for volume and surface area. Although this method does not damage the eggs, it still requires contact-based measurements to obtain the length and width, which are time-consuming, labor-intensive, and prone to human error.
In the current research on non-contact measurement of egg parameters, researchers focused on segmenting eggs from images and extracting one-dimensional (1D) and 2D features to estimate egg parameters using machine learning algorithms. Thipakorn et al. [8] employed candling in a darkroom to capture high-contrast RGB images of individual eggs. After threshold segmentation, they extracted 13 geometric features and used them to predict egg weight with Linear Regression and for size classification with the Support Vector Machine (SVM) classifier. This approach achieved a correlation coefficient (r) of 0.9915 and a classification accuracy of 87.58%. Siswantoro et al. [9] developed a computer vision system to capture top-view images of individual eggs against a black background, enhanced by two LED lights for brightness. They converted the RGB images to grayscale for threshold segmentation and extracted 1D and 2D features. These features were then input into a neural network to predict egg volume, achieving an r value of 0.9738 when compared with the actual volume. The two approaches required high image quality, necessitating additional light sources. Moreover, manually placing eggs on a fixed collection platform made automation difficult and extended the time required for each egg measurement. Waranusast et al. [10] extracted six geometric features of individual eggs from images captured by a smartphone camera. They employed SVM classification to categorize egg sizes, achieving an accuracy of 80.4%. The study converted RGB images to the HSV (hue, saturation, and value) color model and applied threshold segmentation to the S channel (saturation) to minimize the need for additional light sources. However, accuracy was affected by factors like low image quality and lens distortion. Furthermore, to ensure significant saturation differences between eggs and backgrounds, only brown eggs on a white background could be reliably detected. Additionally, to allow more flexibility in the shooting distance, a coin was placed next to the egg as a reference, and only one egg could be detected at a time. Duan et al. [11] developed a high-throughput online detection system for egg shape and size based on the convex hull algorithm. The camera was fixed above a conveyor belt, moving at 30,000 eggs per hour, dynamically capturing egg images. They utilized the convex hull algorithm to extract size dimensions and roundness features of eggs for classification, achieving a size classification accuracy of 90.5% and a roundness classification accuracy of 89.3%. However, the system required the addition of transmitted light sources for illumination. Okinda et al. [12] developed a depth image-based egg volume estimation system using the Microsoft Kinect v2 camera, which featured both color and depth channels for image capture. Threshold segmentation in the depth channel helped avoid the impact of ambient light sources on segmentation and enabled the prediction of the volume of single or multiple eggs arranged in various configurations within the same plane. However, since the depth information was used solely to improve the segmentation process, it required ensuring all eggs were on the same plane. Moreover, the imaging speed of 10 frames per minute cannot meet real-time measurement needs, limiting its current application to static measurements only. Additionally, the system has yet to be validated on different types of eggs.
Feature extraction from 2D images typically requires high imaging quality. However, in commercial farm environments, particularly in layered cage systems, illumination levels are often below 20 lux, complicating egg segmentation and feature extraction [13]. Additionally, supplementary visible light sources may induce stress in poultry, adversely affecting their production performance and potentially increasing mortality rates. Furthermore, 2D image-based measurements often necessitate specific imaging backgrounds or egg types and consistent imaging heights in the absence of additional reference objects. Due to these limitations, many researchers are turning to three-dimensional (3D) information to measure egg parameters. Zhang et al. [14] constructed egg models from 3D point clouds using a refinement algorithm based on incremental Delaunay triangulation. They computed the volume and surface area of the eggs and employed the Monte Carlo method to correct the volume estimates based on a sample set of eggs. This method achieved an accuracy of up to 99% compared to Archimedes’ displacement method. However, this method required capturing multiple images from different positions and orientations. A target field was necessary to provide tie points between images for reconstructing a complete 3D point cloud of the eggs. Chan et al. [15] developed a system for measuring egg volume using a Microsoft Kinect. Their approach involved fitting the point cloud data to a 3D geometric model of an egg, utilizing only approximately half of the egg’s surface points. This method eliminated the need for point cloud registration. The system achieved an average volume estimation accuracy of 93.3%. However, the limited depth measurement accuracy of the Microsoft Kinect camera imposes a constraint on further improving the precision of egg volume measurements.
Currently, laser scanners are extensively utilized in industrial applications due to their high precision, high resolution, and robustness [16]. Uyar and Erdoğdu [17] explored the potential applications of laser scanners in food process engineering studies. They utilized a 3D scanner to scan eggs and measured their volume and surface area, achieving an error of less than 1% compared to results obtained from empirical equations in other literature. However, these scanners are costly and require placing the object on a rotating stage for multi-angle imaging, resulting in a lengthy scanning process. In contrast, push-broom line laser scanners offer the potential for real-time measurement while maintaining high accuracy. In the 3D visual measurement method based on double-line structured light, designed by Wang et al. [18], the laser was fixed on a slider to scan the gauge block, while the camera captured continuous images of the moving laser stripes at a rate of 50 frames per second, achieving efficient and precise measurements. Min et al. [19] designed an online dynamic non-contact metering system based on line laser triangulation on a conveyor belt platform. This system was capable of calculating the 3D profiles and volume flow of bulk materials. The line laser scanner was fixed above the experimental conveyor belt at a speed of 2 m/s for scanning and imaging, demonstrating high efficiency, precision, and stability in measurement results. Although line lasers have not been applied to online egg measurement in large-scale poultry houses, their characteristics of high accuracy and good dynamic performance suggest significant potential for such applications.
Eggshells exhibit a relatively rough texture at the microscopic scale, leading to excellent diffuse reflection properties. This characteristic allows for high-quality imaging when scanned by structured light, making eggs highly suitable for surface reconstruction and measurement using line laser scanners. Previous research based on 2D images [8,9,11] typically required additional visible light illumination to obtain high-quality images, which caused stress in chickens. Our method, FEgg3D, employs line laser scanning technology, which performs better in low-light environments and achieves excellent measurement results. Using near-infrared (NIR) lasers, invisible to chickens, the measurement process does not induce stress. Additionally, image-based studies typically require a consistent distance between the camera and the eggs [12] or the use of reference objects [10]. In contrast, FEgg3D captures three-dimensional information that includes the distance between the eggs and the measuring device, and variations in this distance within the measurement range do not affect the reconstruction of the egg surface shape. FEgg3D has fewer requirements and limitations for measurement, making it more adaptable for use in poultry houses.
Previous studies using depth cameras to obtain 3D information on eggs often required multi-angle imaging to construct a relatively complete point cloud for accuracy [14], with measurements based on partial point clouds being limited in precision [15]. In contrast, FEgg3D leverages the principles of laser triangulation, typically providing higher accuracy and stability in close-range measurements [20,21,22], theoretically achieving higher precision with partial egg point clouds.
Additionally, conventional static measurement methods typically involve measuring one or a few eggs at a time and require manual placement [8,9,10,12,14,15], while rotating laser scanners also consume considerable time during the imaging process [17]. These methods are unsuitable for real-time detection. In contrast, push-broom imaging line scanners achieve faster measurement speeds, with the measurement speed primarily depending on the movement speed of the device. In large-scale egg-laying houses, eggs usually slide from the cages onto conveyor belts after being laid, making the practical application of line laser scanners well suited to this scenario.
In summary, our contribution is the design of a non-contact, dynamic measurement NIR laser scanning device. Considering the high computational resources and time required to reconstruct egg surfaces or fit 3D models from each image frame, we propose a method to estimate egg parameters using a small number of points from the egg point cloud with machine learning algorithms, thereby enhancing measurement efficiency and stability.
2. Materials and Methods
2.1. Design of FEgg3D
2.1.1. Hardware Configuration
The laser scanner system comprised an NIR camera, an NIR line laser, and an NIR fill light. The camera (MV-CA023-10UM, Hikvision Digital Technology Co., Ltd., Hangzhou, China) was paired with an industrial lens (C12F16-12MP, ANNAL Technology Co., Ltd., Shenzhen, China) and equipped with an 850 nm filter, enabling it to function as an NIR camera. Image acquisition was managed through third-party software (MVS, Hikrobot Co., Ltd., Hangzhou, China) via a USB 3.0 interface for real-time data transmission. As illustrated in Figure 1, the NIR laser (HSGD 1690-850AB100, Huashang Laser Technology Co., Ltd., Shenzhen, China) and the camera were mounted on a fixture, maintaining a 17-degree angle between the camera’s imaging plane and the laser plane. The NIR fill light was also secured to the fixture, surrounding the NIR laser generator.
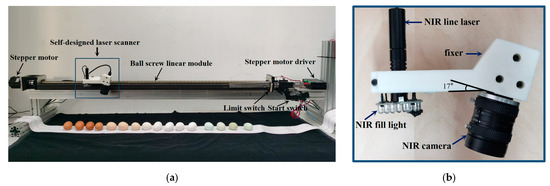
Figure 1.
Egg scanning system based on a self-designed laser scanner. (a) Egg scanning system; (b) self-designed laser scanner. Note: The supplementary NIR light was not used in this study.
The laser scanner was mounted on a 2 m long ball screw linear module (KK10020P 201BL-5002, HIWIN Technologies Corp., Taichung, Taiwan, China), positioned approximately 25 cm above the tabletop. The linear module’s movement was driven by a stepper motor (57BYG350DL, Beijing HollySys Electric Technology Co., Ltd., Beijing, China), controlled by a stepper motor driver.
To manage the scanning operation, a limit switch and a start switch were installed on the linear module. The limit switch set the initial position of the laser scanner, while the start switch initiated the scanning sequence. An Arduino microcontroller (Mega2560, Arduino S.r.l., Monza, Italy) governed both the stepper motor driver and the switches. This microcontroller was powered by a 5V supply. The stepper motor driver was supplied with 31V from an adjustable power source (HY3005B, Hangzhou Huayi Electronics Industry Co., Ltd., Hangzhou, China). The system’s camera was connected to an industrial computer via a USB interface for image collection and data processing.
2.1.2. Workflow
Before initiating measurements, the object to be measured was aligned along the length of the ball screw linear module, as illustrated in Figure 1. Upon powering up the stepper motor driver and the microcontroller, the laser scanner moved directly toward the limit switch until contact was made, establishing the initial position. When the start switch was pressed, the laser scanner moved in the opposite direction, and simultaneously, the camera began capturing images. The laser scanner continued its movement until it reached a predetermined position, at which point both the scanner’s motion and the image capture ceased. Pressing the switch again commanded the laser scanner to return to its initial position. The precise control provided by the stepper motor facilitated relative motion between the object and the laser scanner, enabling linear push-broom imaging of the object’s surface [23].
2.1.3. System Calibration
After constructing the measurement system, a comprehensive calibration was required to establish the spatial relationships among the camera, the laser plane, and the world coordinate system. The calibration process comprised two main steps: camera calibration and laser plane calibration. Camera calibration determined the intrinsic parameters necessary for correcting image distortion and was used in the subsequent laser plane calibration. The laser plane calibration then computed the equation of the laser plane in the camera’s coordinate system.
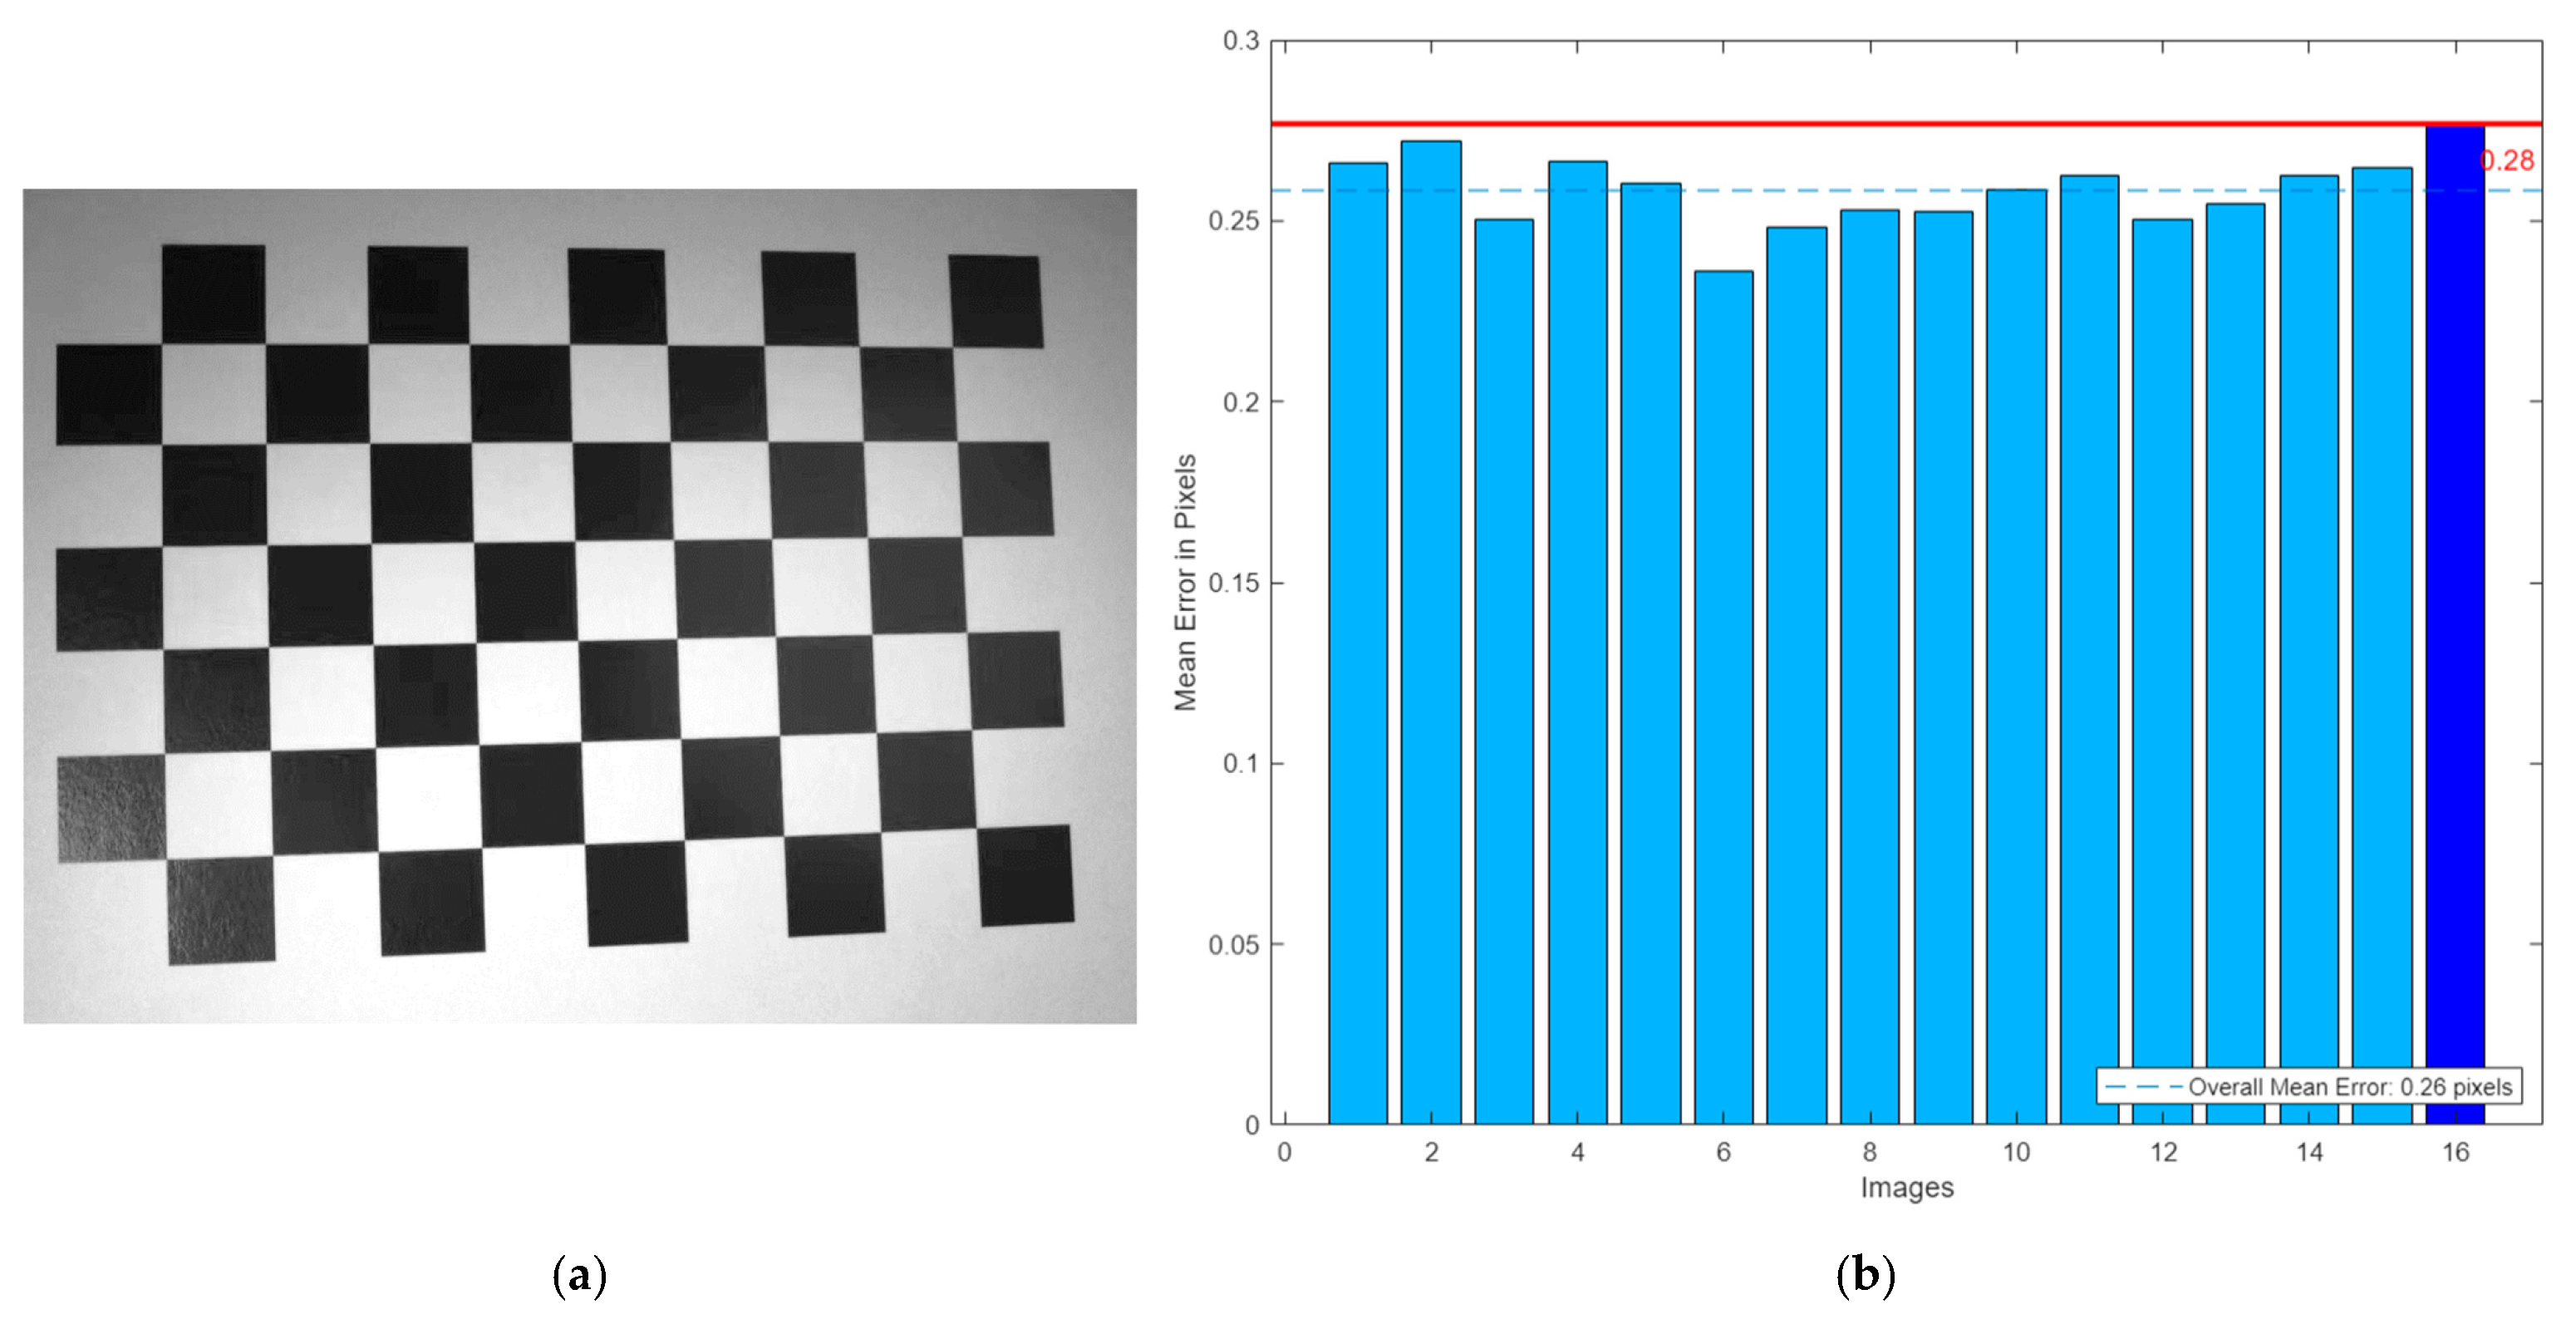
For camera calibration, we employed the Zhang-Zhengyou method [24]. A black-and-white checkerboard (7 × 10 grid, 11.60 mm per square) was printed and mounted on a flat surface, as shown in Figure 2a. We captured sixteen images of the calibration board from various distances and angles. Calibration was performed using MATLAB (R2022b, The MathWorks, Inc., Natick, MA, USA) and its Camera Calibration Toolbox, which computed the camera’s intrinsic and extrinsic parameters. The calibration yielded a mean reprojection error of less than 0.28 pixels, as depicted in Figure 2b, demonstrating the calibration accuracy.
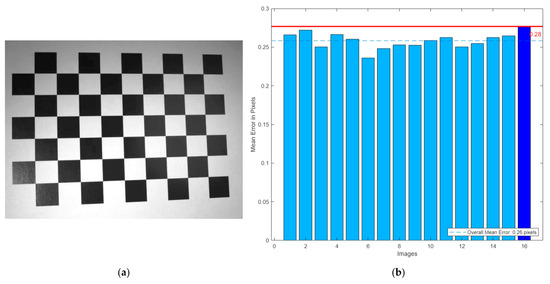
Figure 2.
Camera calibration. (a) The calibration board; (b) mean reprojection error.
To determine the laser plane equation, we needed to calculate a unit normal vector to the laser plane and identify a point on the plane. We developed a calibration method in MATLAB to achieve this. The calibration process involved capturing several laser lines in the world coordinate system and then transforming these coordinates into the camera coordinate system using the extrinsic matrices for each laser line. These transformed coordinates were subsequently used to compute the unit normal vector and the reference point in the camera coordinate system.
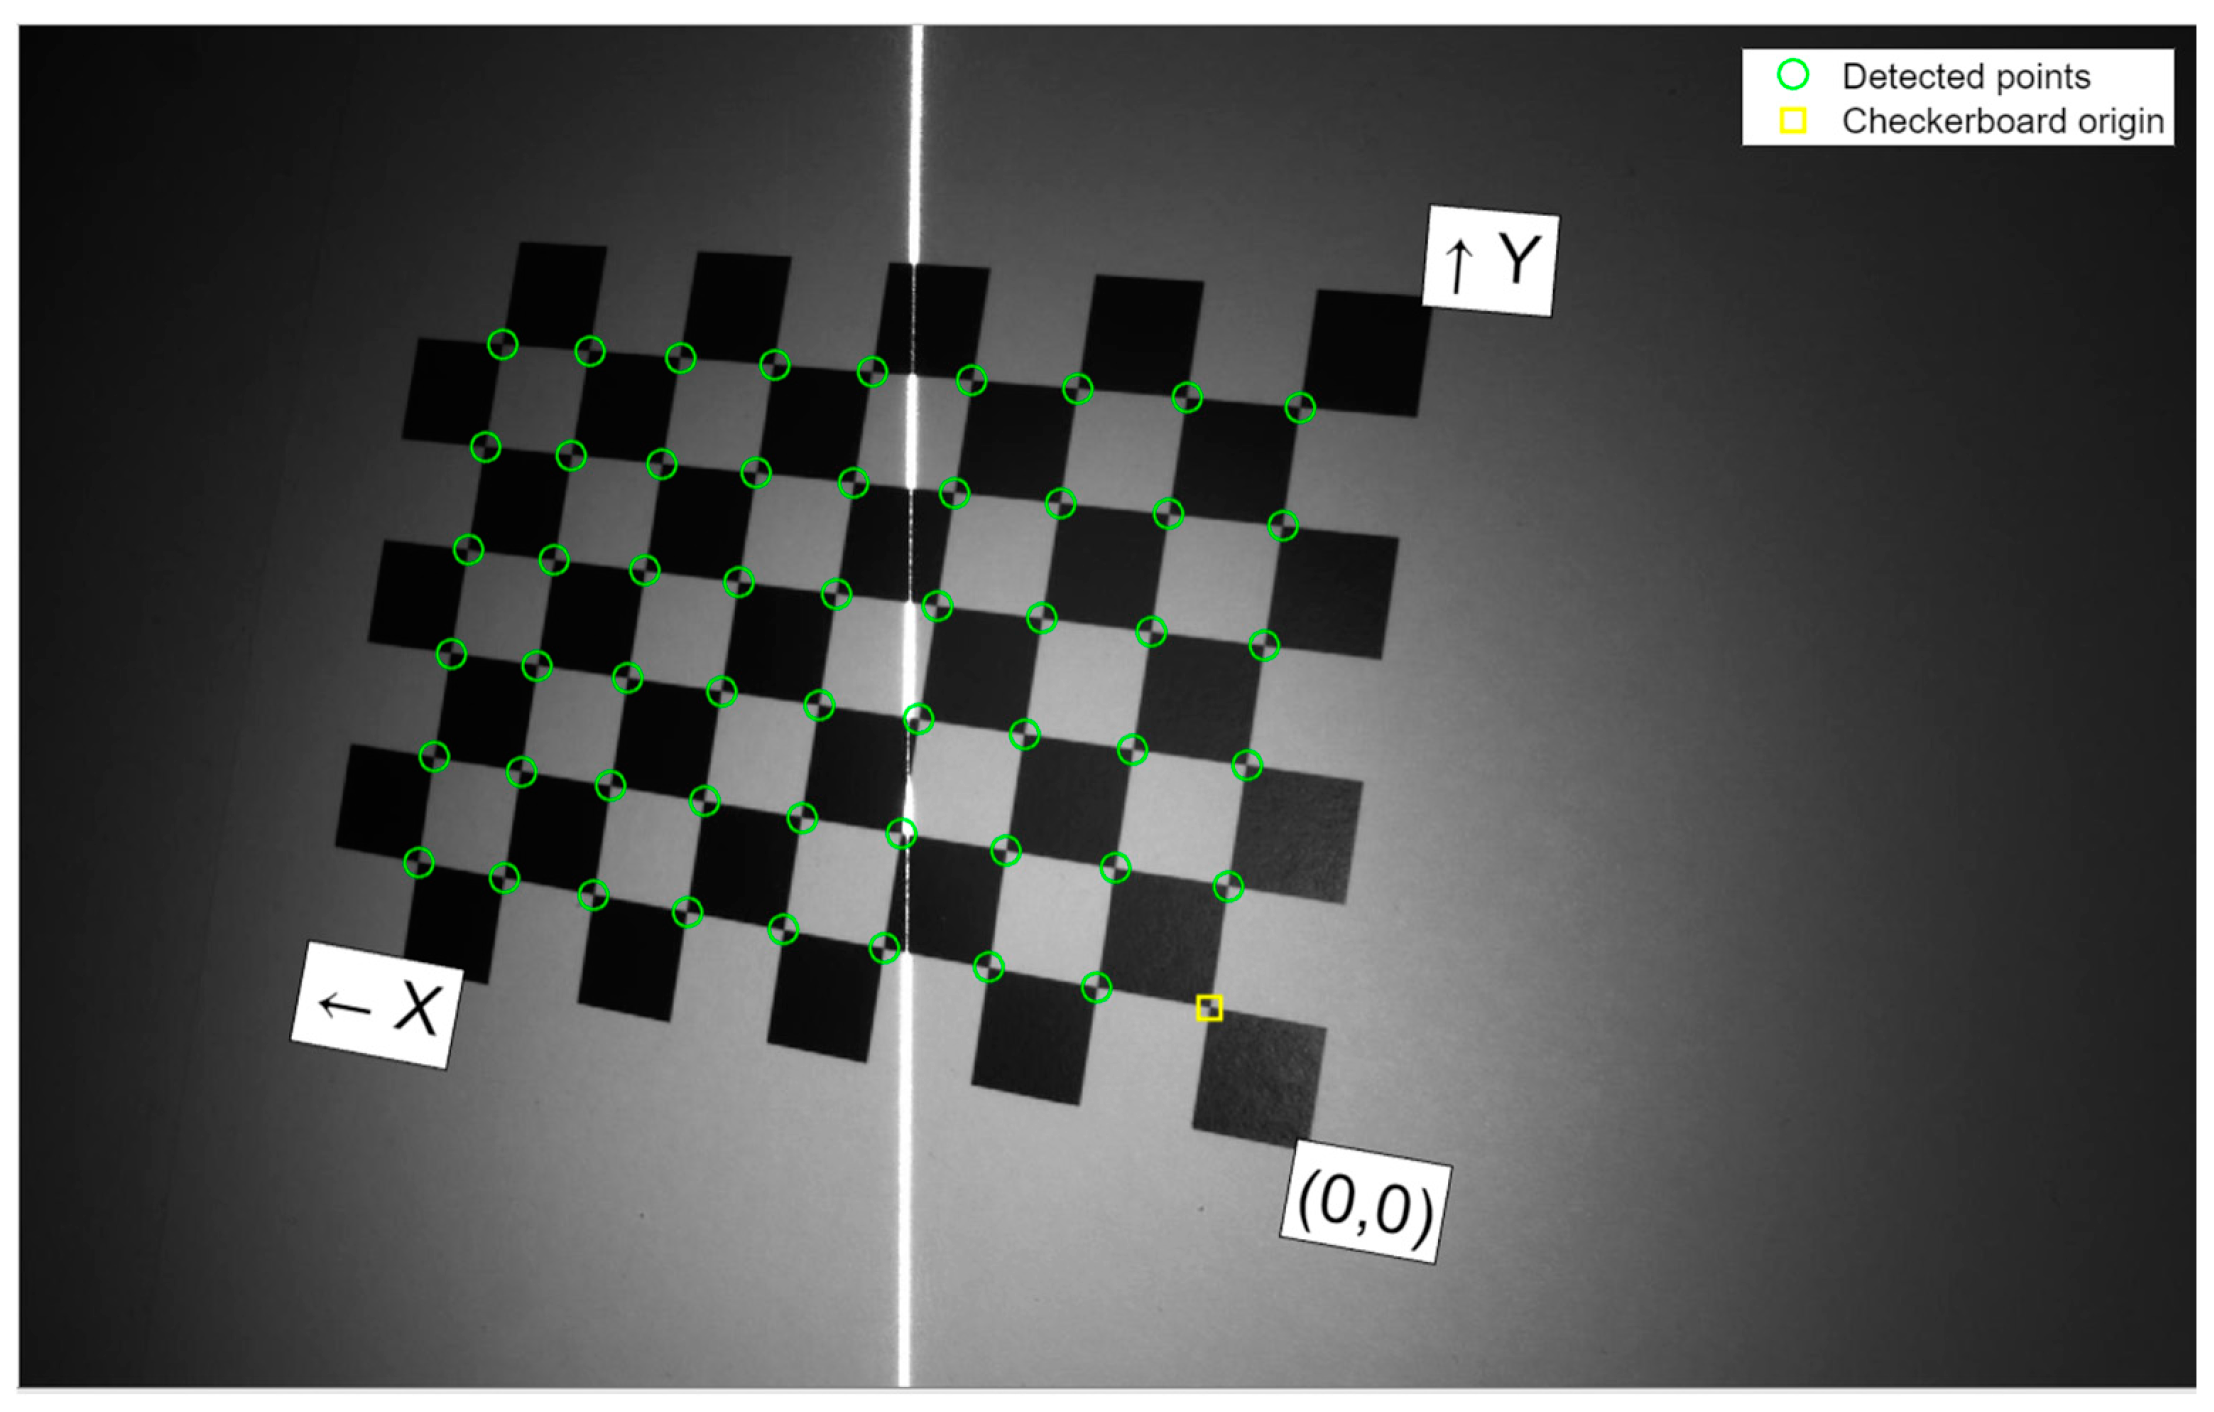
We captured nine images of the calibration board illuminated by the line laser from various angles and distances, as depicted in Figure 3. During this process, the origin and the XOY plane of the world coordinate system were aligned with the plane of the calibration board. The coordinate axes were defined based on the orientation of the checkerboard pattern. We calculated the extrinsic parameters for each image using the intrinsic parameters obtained from the camera calibration. From each captured image, we extracted a single-pixel-wide skeleton of the laser line, a process detailed in Section 2.4.

Figure 3.
World coordinate system for calibration.
Based on the pinhole imaging model, the linear imaging model of the camera is expressed as follows:
where (u, v) are the image coordinates of the laser line in pixels. (Xc, Yc, Zc) and (Xw, Yw, Zw) represent the 3D coordinates of the laser line in the camera coordinate system and the world coordinate system, respectively. R and T are the rotation and translation matrices that transform coordinates from the world coordinate system to the camera coordinate system. These matrices are the extrinsic parameters for each specific image. Here, K denotes the camera’s intrinsic matrix:
where fx and fy are the focal lengths, and (cx, cy) are the principal point coordinates.
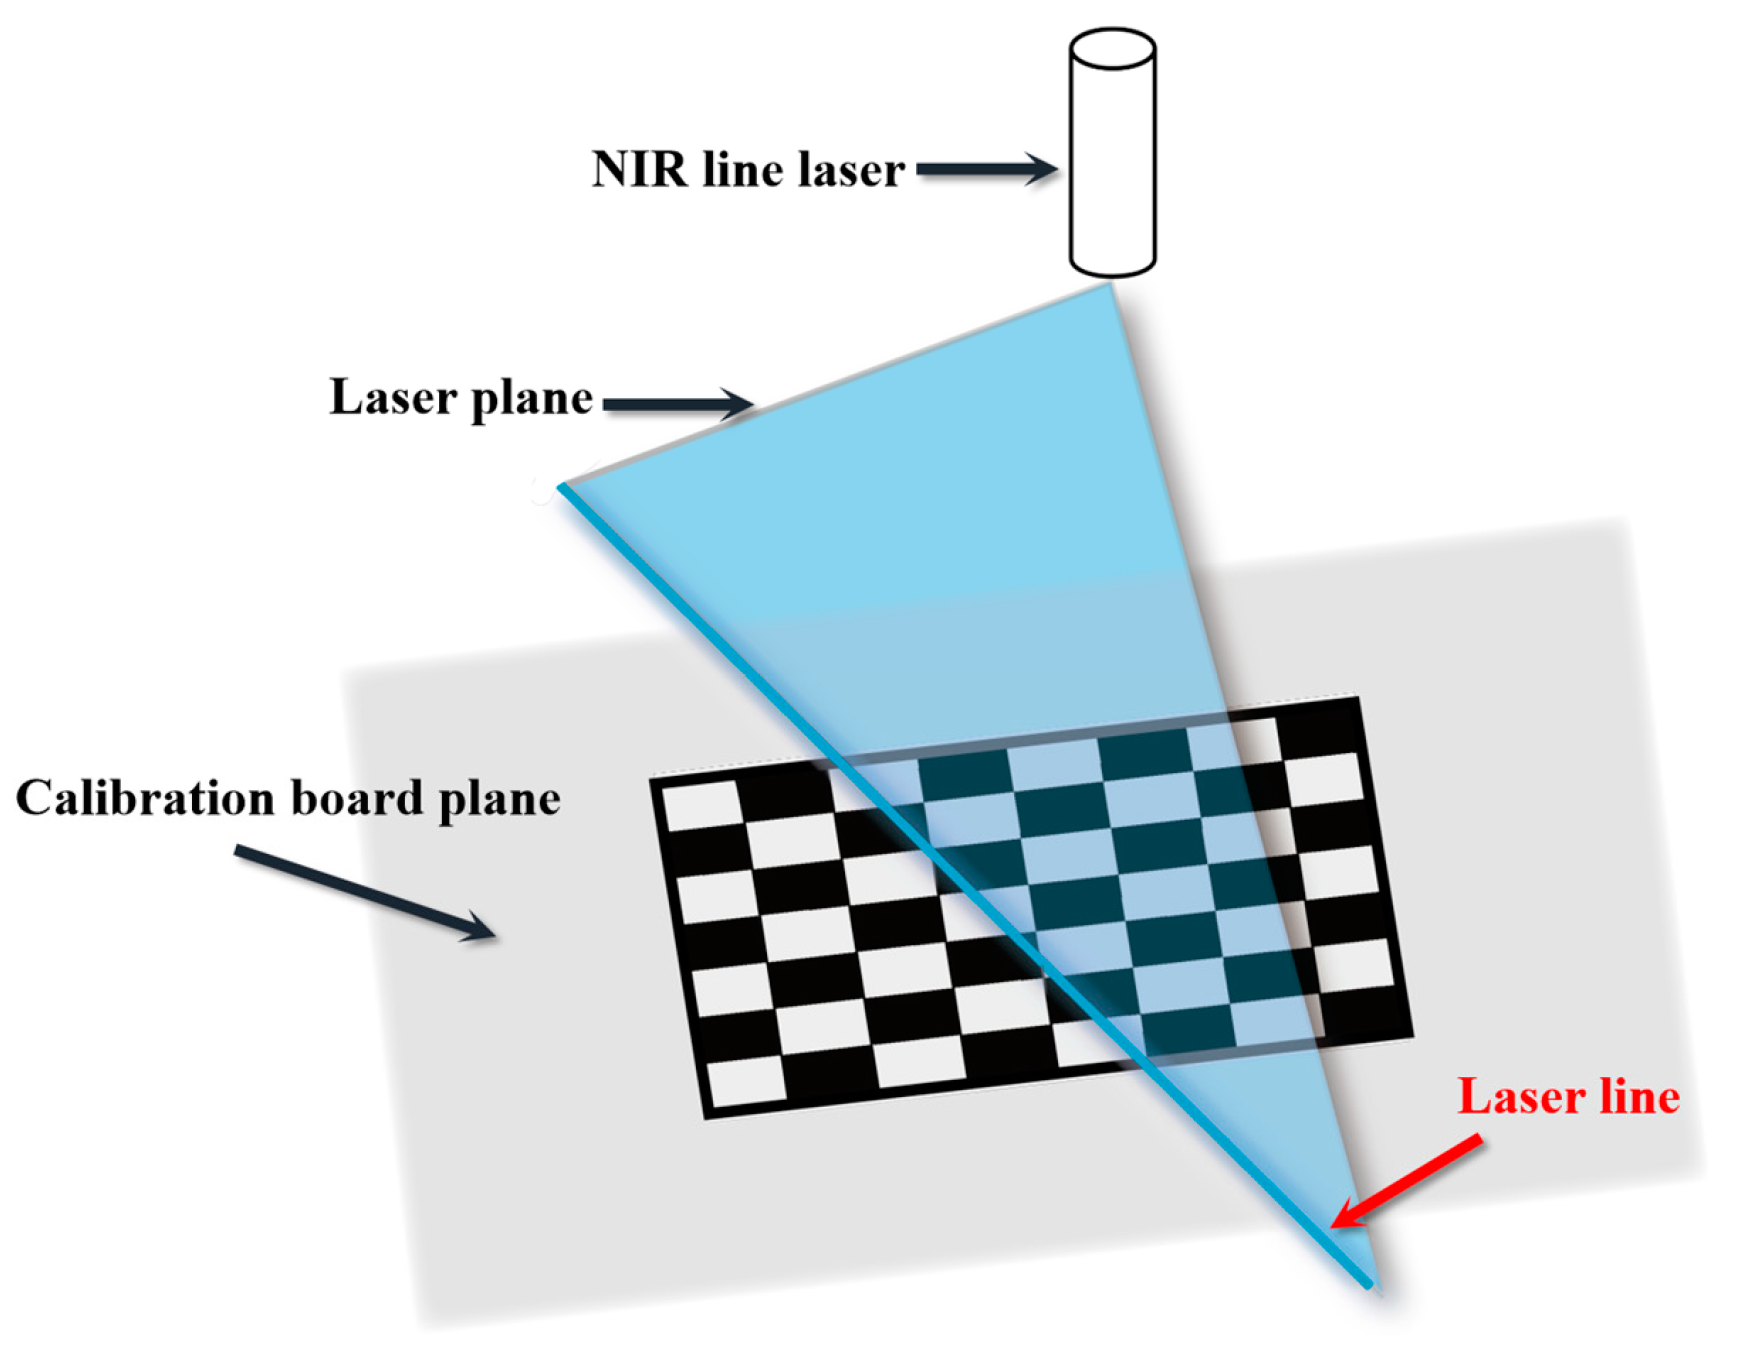
The laser line is the intersection of the laser plane and the calibration board plane, as depicted in Figure 4. Since the Zw coordinates of the laser lines in the world coordinate system are zero, we can determine Xw and Yw using the following equation:
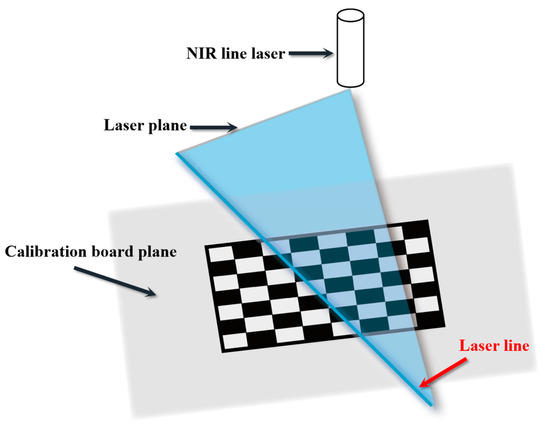
Figure 4.
Two planes across the laser line.
The transformation between the camera coordinate system and the world coordinate system is described by Equation (4).
Using Equation (4), we transformed the coordinates of the laser lines from the world coordinate system to the camera coordinate system, as illustrated in Figure 5. By examining these transformed laser lines, we determined the middle point P = (xp, yp, zp) by averaging the coordinates of points on these lines. To define the laser plane equation, we employed the singular value decomposition (SVD) method to calculate a unit normal vector n = (xn, yn, zn) to the plane. The equation of the laser plane can then be expressed as follows:
where the coefficients A, B, and D are defined as follows:
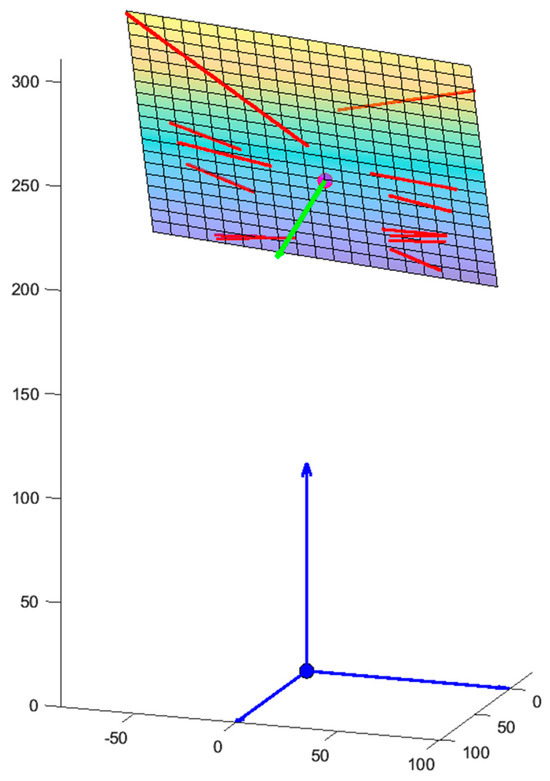
Figure 5.
Laser plane in the camera coordinate system.
2.2. Assessment Method for Measurement Accuracy
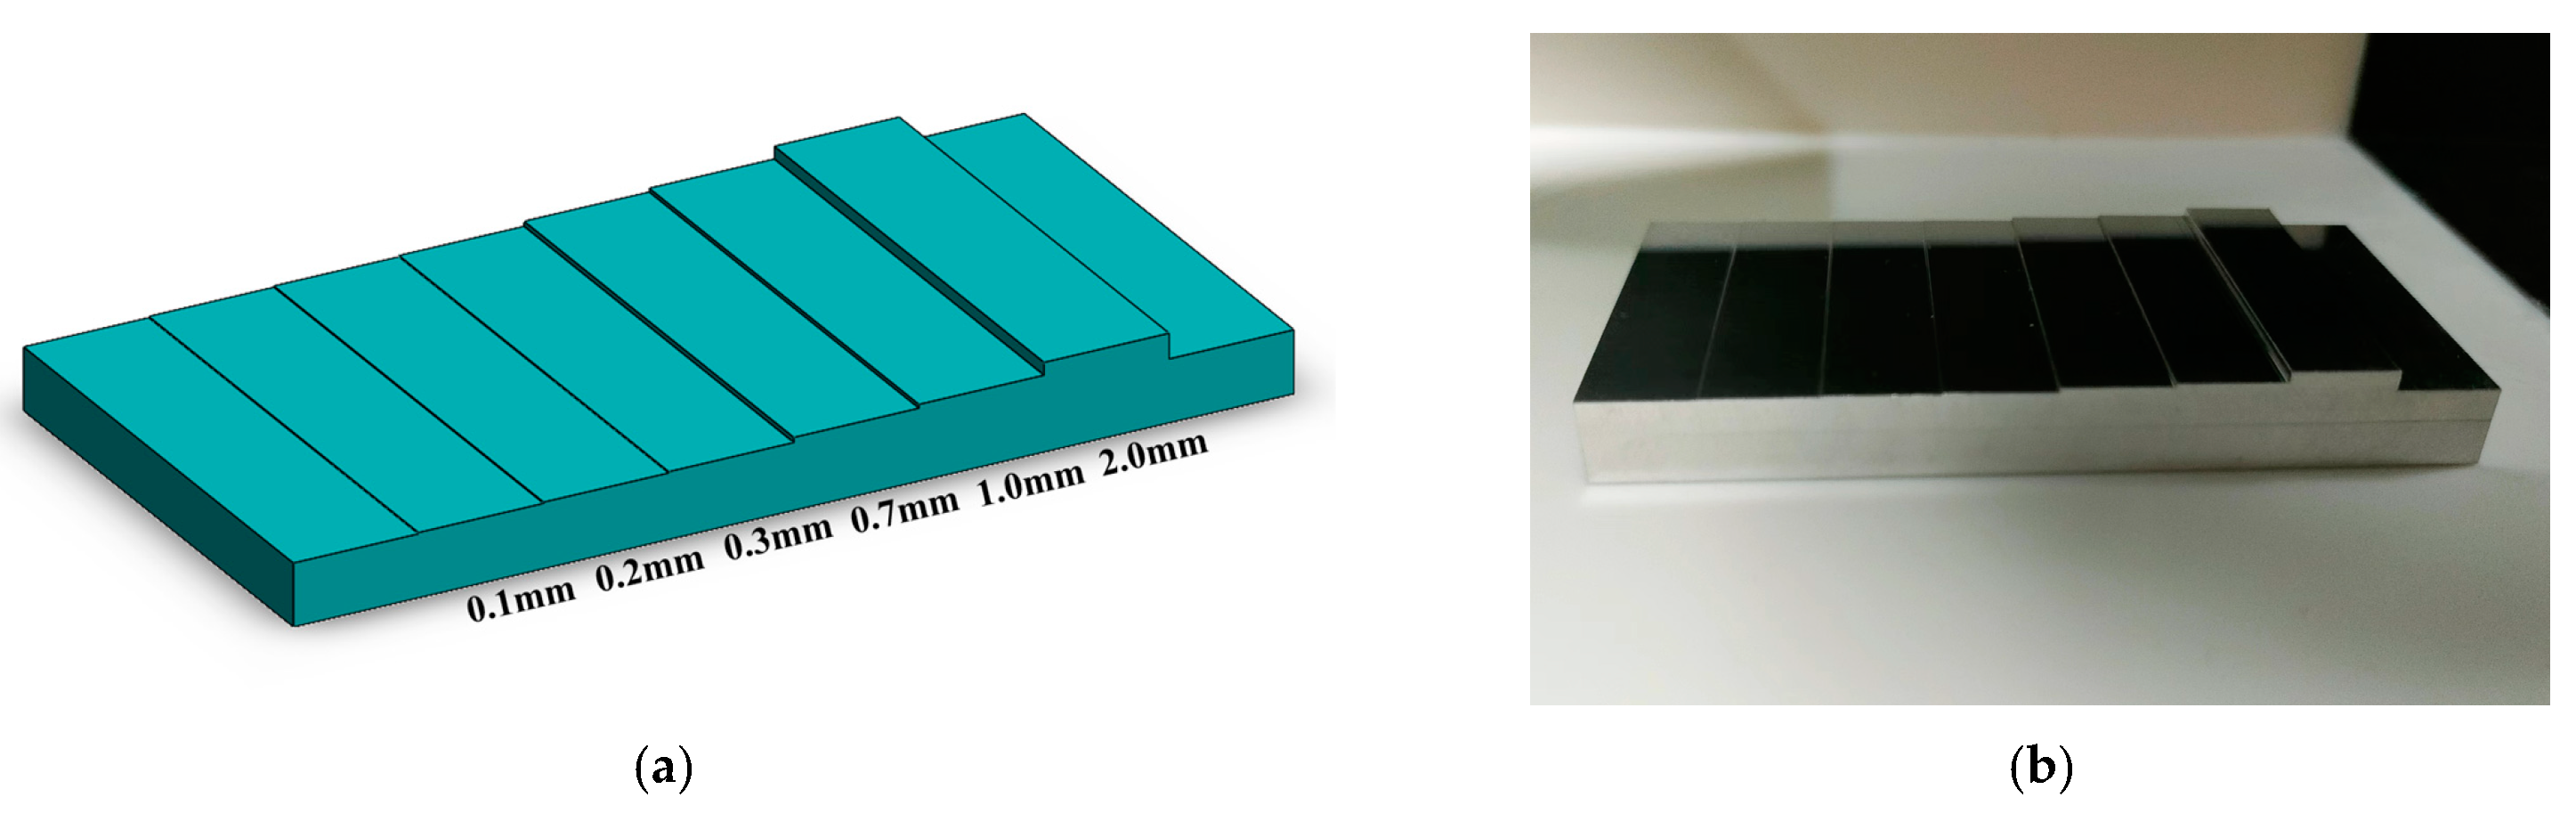
To evaluate the measurement accuracy of the laser scanner, we designed and manufactured a stepped gauge block from aluminum alloy, as shown in Figure 6. The gauge block consists of 6 steps measuring 0.10, 0.20, 0.30, 0.70, 1.00, and 2.00 mm, with a manufacturing error within ±0.01 mm across all measurement surfaces. The gauge block was scanned using FEgg3D to capture 3D point clouds, which were subsequently processed. The measurement planes were segmented from the point clouds, and 220 measurement values were randomly selected from each measurement surface. The average value was calculated as the final measurement result to assess the laser scanner’s measurement accuracy.

Figure 6.
Stepped gauge block. (a) Design drawing; (b) physical object photograph.
2.3. Data Acquisition
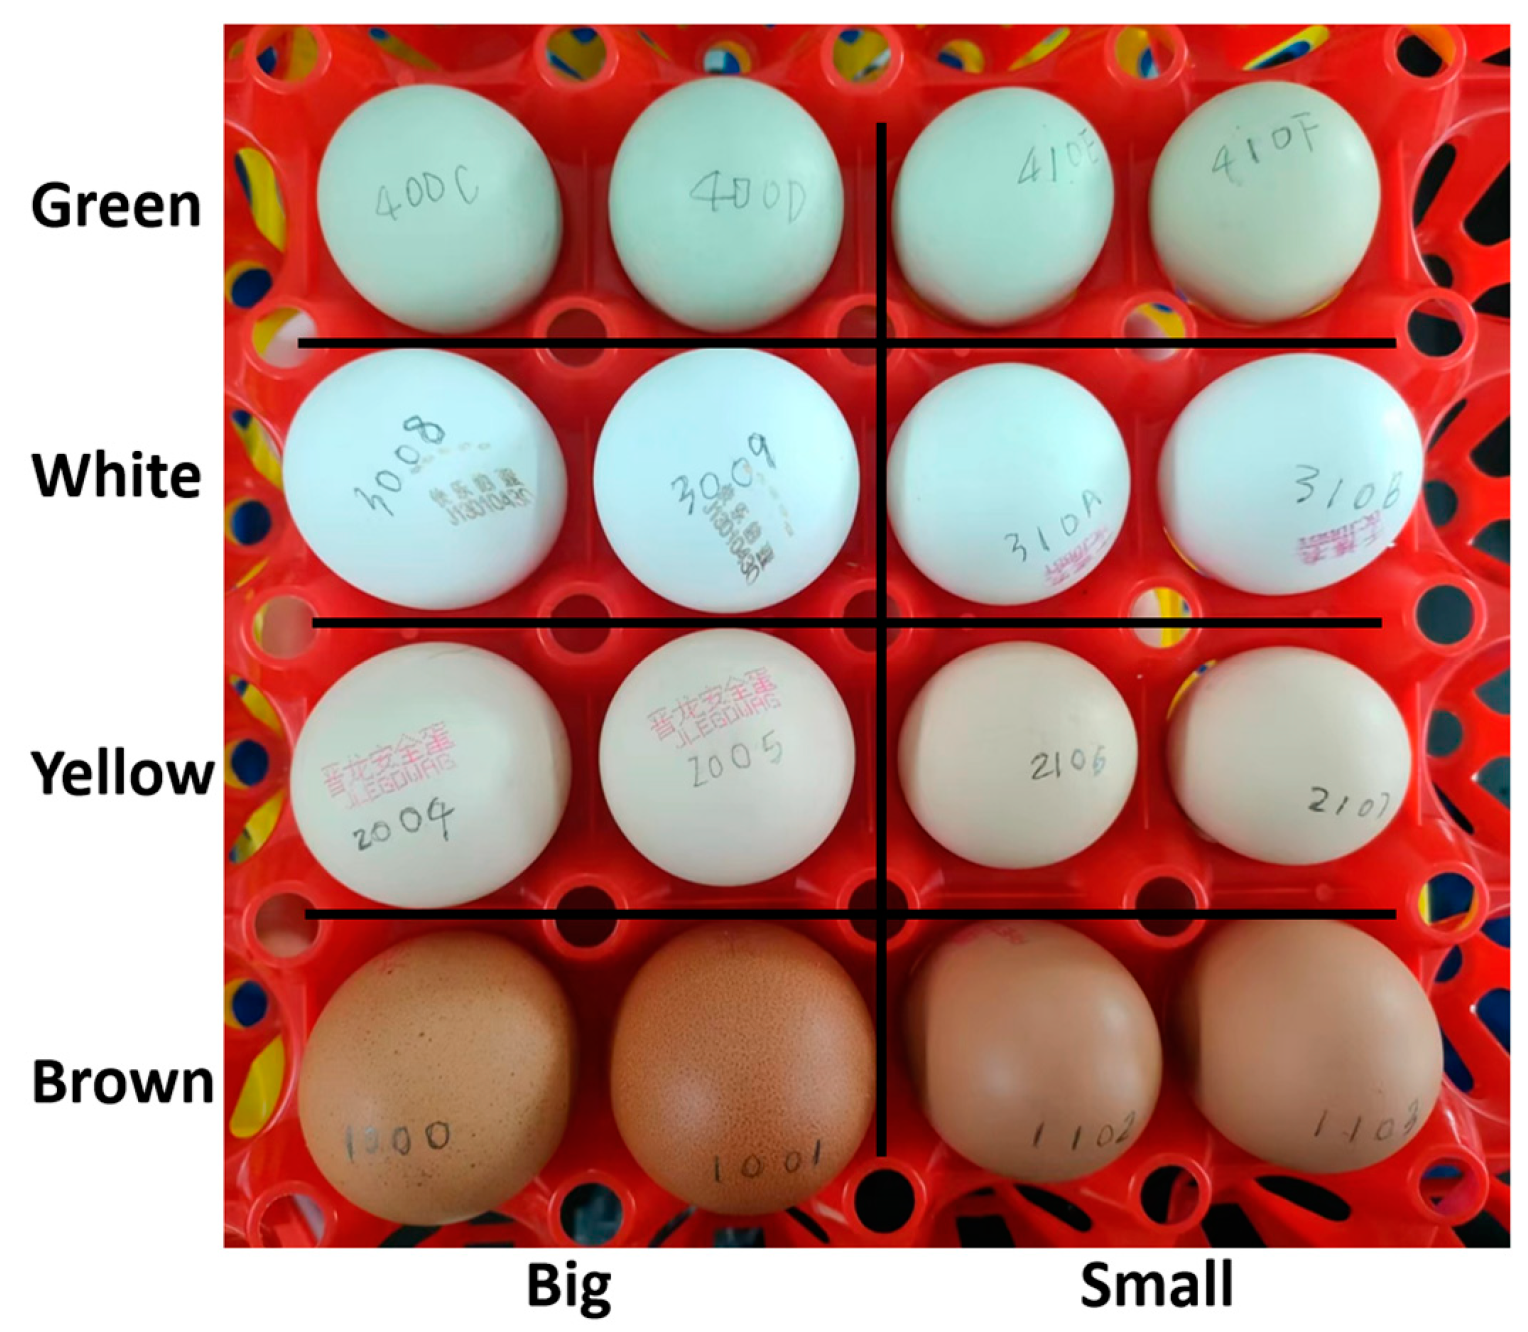
The egg samples utilized in this study were purchased from supermarkets in Beijing, China, and were produced between 18 April and 1 May 2023. The total sample comprised 192 eggs, categorized into four different eggshell colors (brown, yellow, white, and green) and two sizes (big and small), resulting in 12 groups, with each group containing two eggs of each type. Each egg was labeled with a unique four-digit number, as illustrated in Figure 7. Each group of eggs includes eight types of eggs of varying colors and sizes. Overall, brown eggs are the largest, while green eggs are the smallest. The production dates of these different types of eggs are not uniform, meaning they vary in freshness and density. These four colors of eggs encompass nearly all the varieties commonly consumed and are among the most frequently encountered in supermarkets. Additionally, each color of egg includes groups of different sizes, providing a more comprehensive representation of the eggs available on the market, thus offering a representative sample.
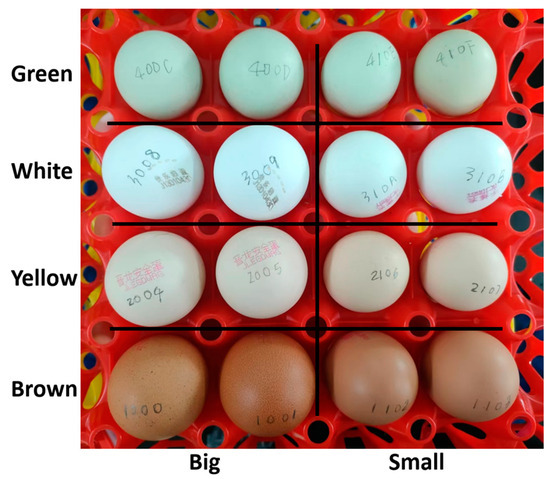
Figure 7.
A group of egg samples. Note: A few eggs had trademarks printed on them, which had no impact on the experiment.
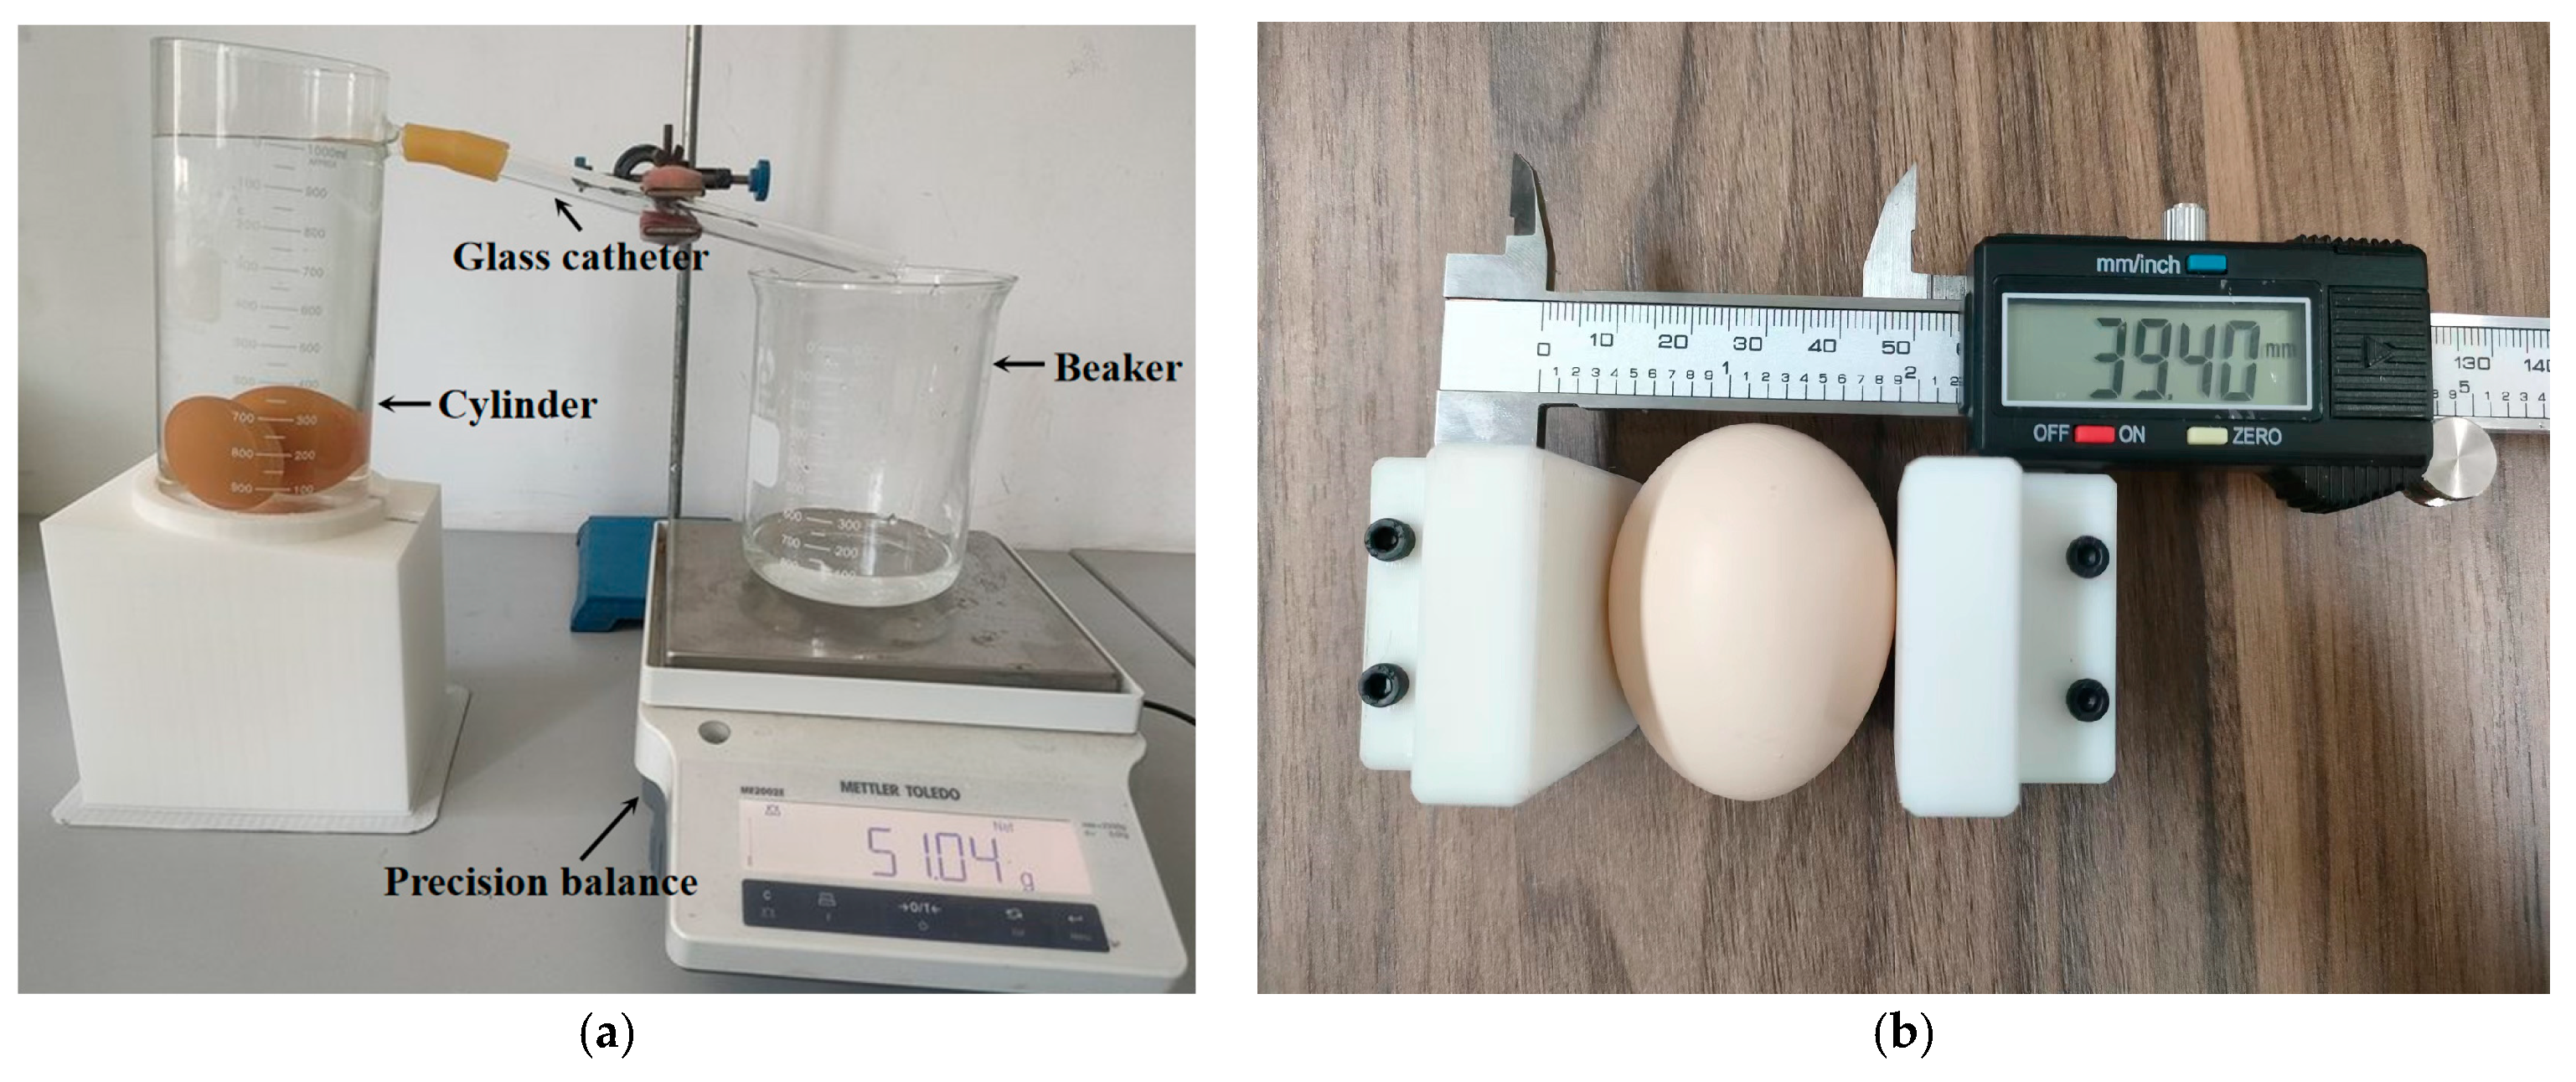
The eggs’ mass was measured using a precision balance. Following the method inspired by Rush et al. [6], the volume of eggs was determined using the water displacement method. As depicted in Figure 8a, the apparatus consisted of a 1000 mL cylinder with a spout on the side connected to a glass catheter via a rubber tube, a 1000 mL beaker positioned under the glass catheter, and a precision balance. Before measurement, the cylinder was filled with pure water. An egg was gently placed into the cylinder to establish an initial state, and the balance was zeroed once the water became calm. Eggs were moistened beforehand to prevent dry eggshells from absorbing water. The volume of water displaced through the glass catheter equaled the volume of the egg submerged in the cylinder. Due to the water’s density of 1 g/cm3, the mass and volume of displaced water were equivalent. Additionally, the lengths of the major and minor axes of the eggs were measured using a vernier caliper equipped with clamping devices, as shown in Figure 8b. Eggs were approximated as ellipsoids, where the major axis was defined as the longest diameter passing through the egg’s endpoints, and the minor axis was perpendicular to the major axis, passing through the egg’s endpoints.
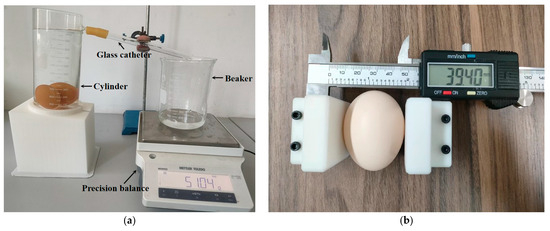
Figure 8.
Measuring devices for the ground truth of (a) egg volume and (b) axis length.
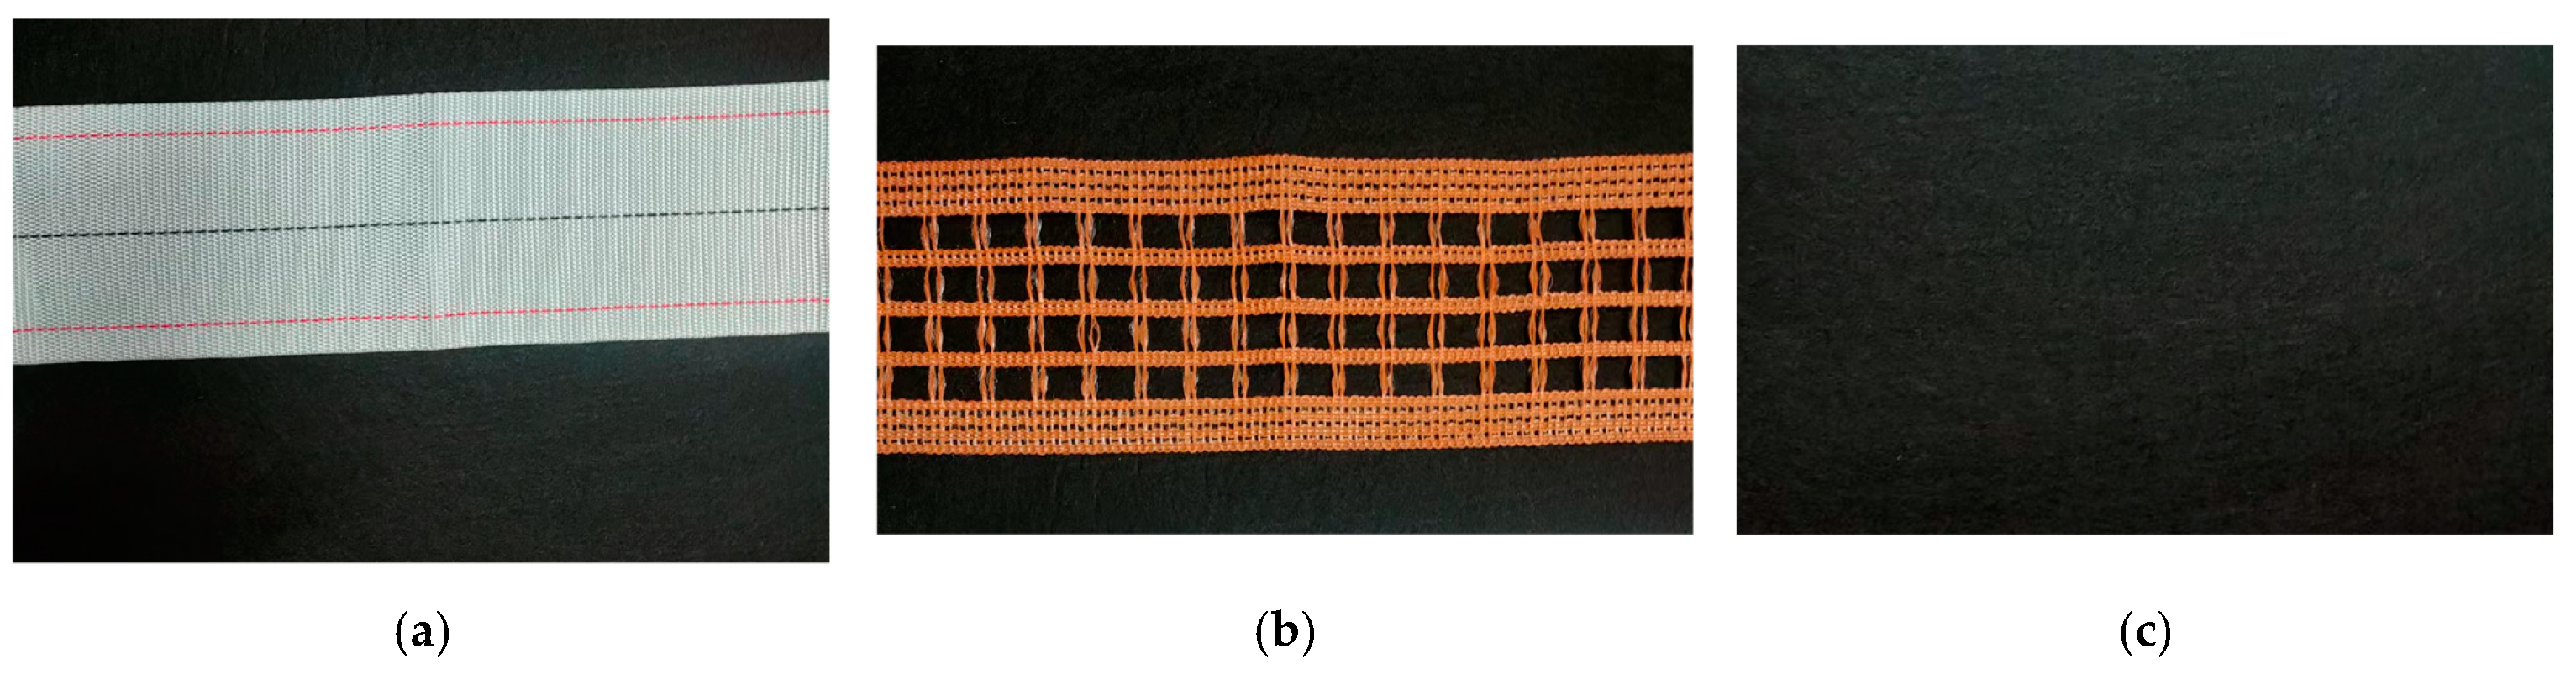
The experimental data were collected on 7 May 2023, from 10:00 a.m. to 12:00 p.m. and from 10:00 p.m. to 12:00 a.m. The experiment was conducted in a laboratory illuminated by fluorescent lights. Since our camera was equipped with a NIR filter, the intensity of indoor lighting had minimal impact on data collection. As shown in Figure 1, during the experiment, a set of eggs was laid out in a sequence according to their designated numbers within the measurement area. The egg scanning system recorded videos at a frame rate close to 20 fps. The laser scanner moved at a speed of 20 mm/s, with the camera’s exposure time set to 50 ms. Each set of eggs was placed against three different backgrounds: two types of egg belts (a white egg belt and a perforated egg belt) and a black background, as illustrated in Figure 9. This setup resulted in a total of 36 videos. To mitigate the impact of the eggs’ orientation on the measurements, each video captured the eggs positioned in four different states: horizontally, vertically, at a 45° angle rightward, and at a 45° angle leftward. The rotation of the eggs was adjusted based on the eggshell color, as depicted in Figure 1.
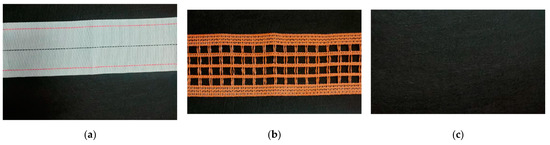
Figure 9.
Three different backgrounds. (a) White egg belt; (b) perforated egg belt; (c) black background.
2.4. Image Processing
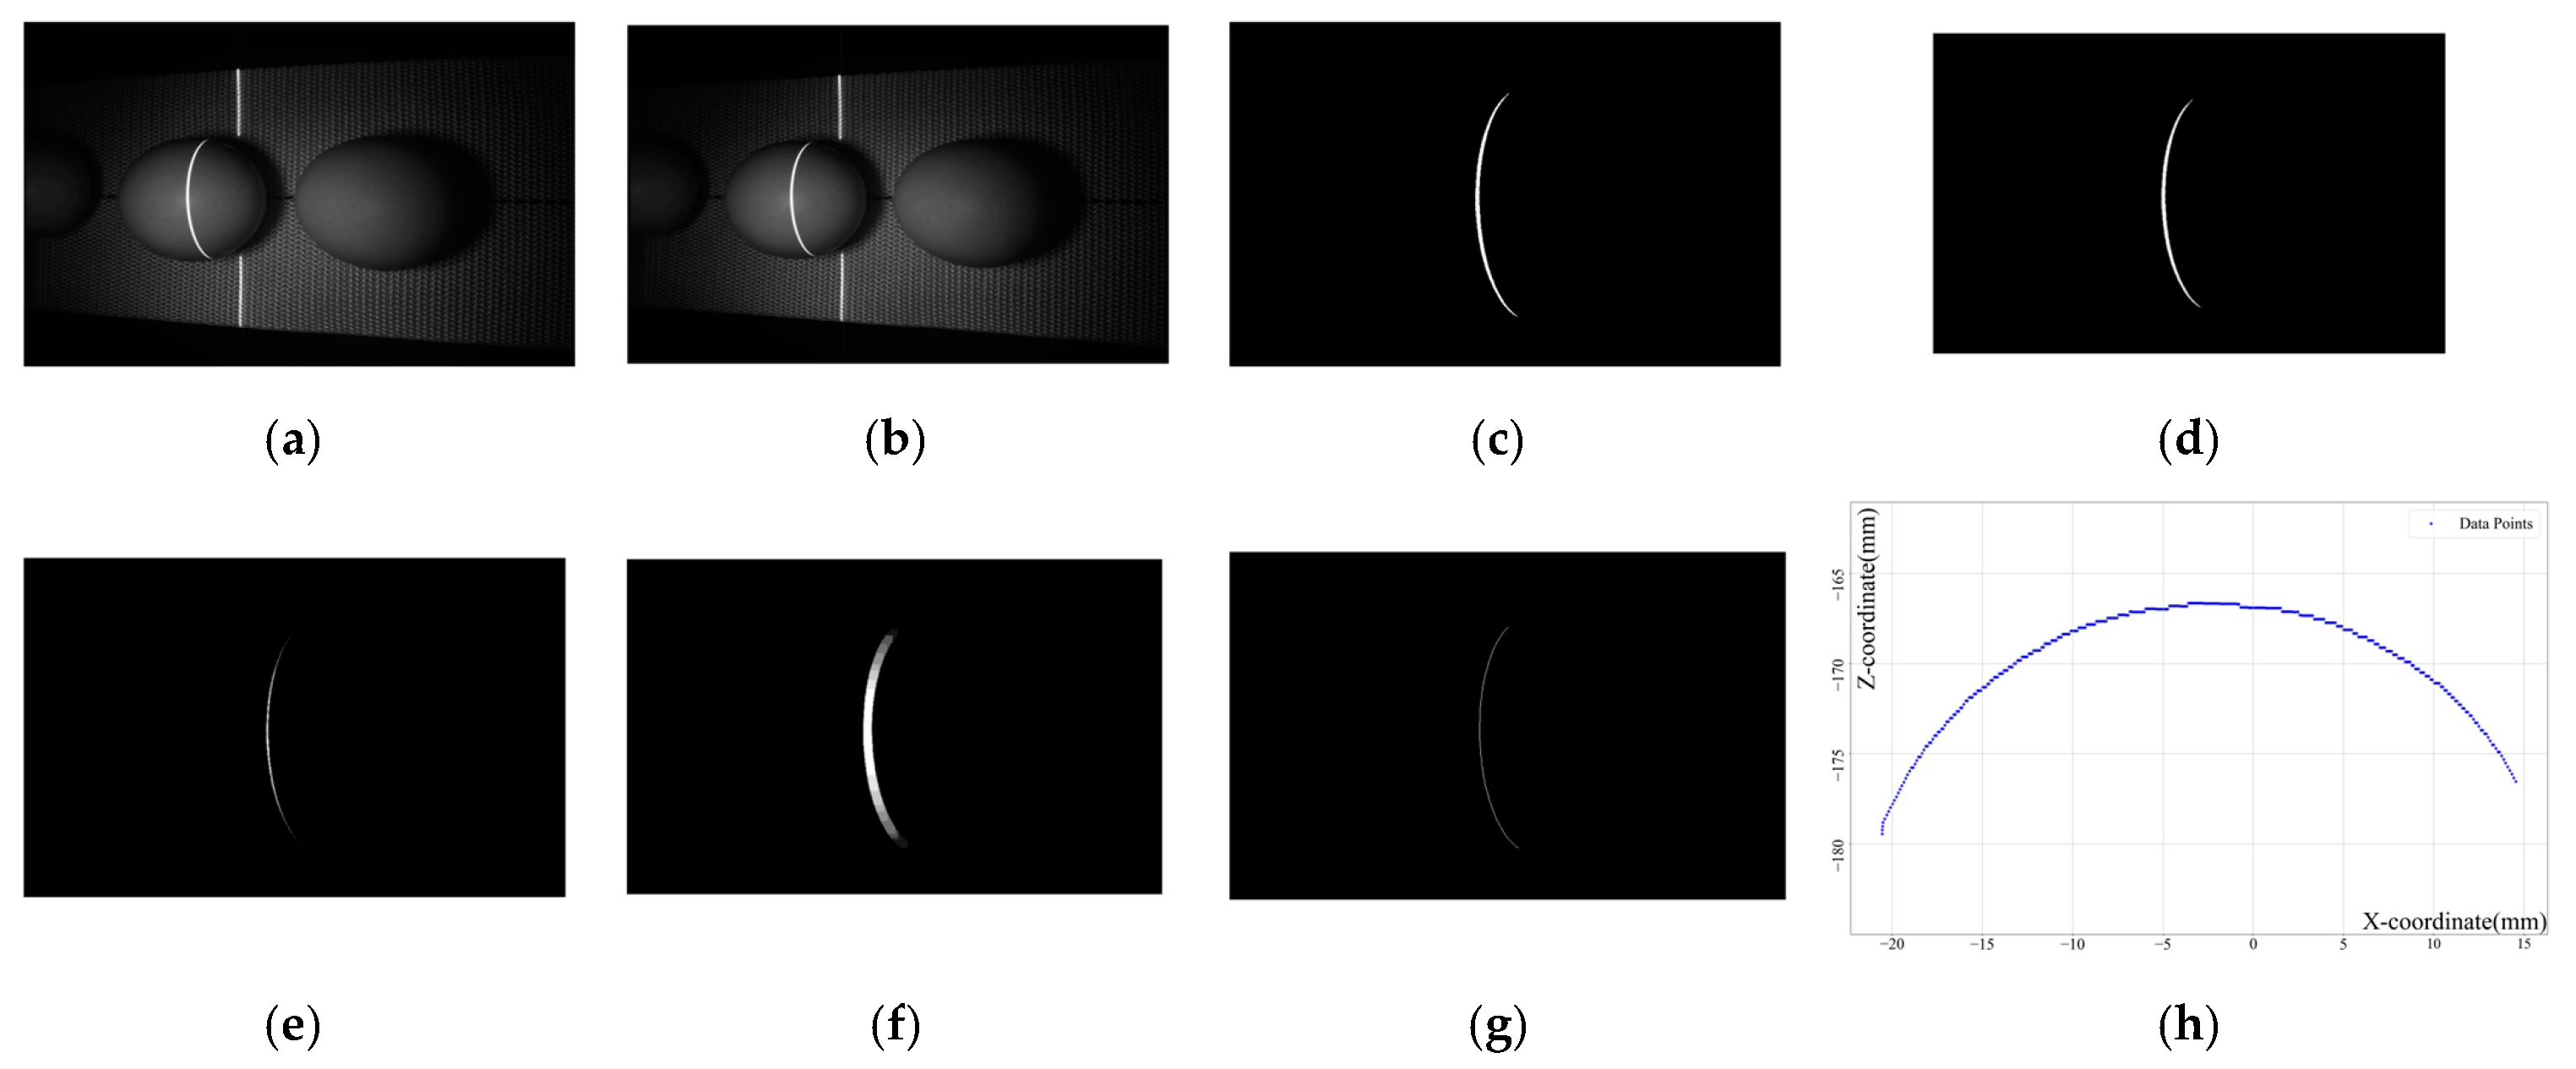
Figure 10 illustrates the stages of image processing. Figure 10a shows the original input image from the video. Figure 10b displays the image after removing camera distortion using intrinsic parameters from camera calibration. Due to the higher brightness of the laser, threshold segmentation effectively isolates the laser region, as shown in Figure 10c. A Gaussian filter is applied to blur the image, reducing noise and small artifacts, as seen in Figure 10d. To remove larger artifacts from reflections and bridge gaps in the laser line, a morphological opening operation is performed involving erosion (Figure 10e) followed by dilation (Figure 10f). Finally, the skeleton of the laser line (Figure 10g), reduced to a single-pixel width, is extracted. This image-processing workflow is also used during the calibration of the laser plane.
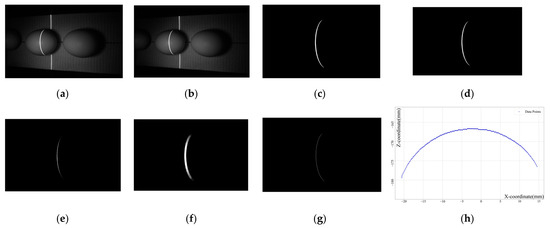
Figure 10.
Image processing of FEgg3D. (a) Original image; (b) distortion-free image; (c) threshold segmentation; (d) Gaussian filtering; (e) erosion; (f) dilation; (g) skeletonization; (h) a 3D slice of an egg.
2.5. Intersection Measurement
With the calibration and laser stripe processing completed, we can proceed to triangulation-based measurements using the derived results. The measurement process involves first converting the pixel coordinates of the laser stripe in the image to coordinates in the camera coordinate system and subsequently transforming these coordinates into the world coordinate system we have established.
To illustrate this process, consider a point q on the laser stripe. Based on the pinhole camera model, the transformation from image pixel coordinates to the camera coordinate system can be expressed as follows:
where (u0, v0) are the image pixel coordinates of point q, (Xc0, Yc0, Zc0) are the corresponding coordinates in the camera coordinate system, and K represents the intrinsic parameters of the camera obtained through calibration. This equation determines the direction of point q in the camera coordinate system but lacks sufficient constraints to determine its exact position.
Since the laser stripe is the intersection line of the laser plane and the surface of the object being measured, points on the laser stripe lie on the laser plane and satisfy the plane Equation (5). By combining these equations, we can solve for the pixel coordinates in the camera coordinate system.
To meet our measurement requirements, we establish a world coordinate system based on the detection setup. The origin of this system is defined as the foot of the perpendicular from the camera’s optical center to the laser plane. The ZW-axis of the world coordinate system is parallel to the intersection line of the laser plane and the XCOZC plane of the camera coordinate system. The XW-axis is parallel to the intersection line of the laser plane and the plane that is perpendicular to the ZW-axis. The coordinates XW and ZW can be determined by the following equations:
where A, B, and D are the coefficients of the laser plane equation in (5).
Through this transformation process, point q is converted from the pixel coordinate system to the world coordinate system. By applying this transformation to all points on a laser stripe, a 3D slice of the measured object can be obtained. Figure 10h illustrates a 3D slice of an egg. From these 3D coordinates, we can accurately determine the object’s height and width, thus completing the triangulation measurement. Given the constant speed of the scanning device, the YW coordinate of the object correlates directly with the time of image acquisition. We calculate the YW coordinate by multiplying the scanning speed by the acquisition time.
2.6. Preprocessing of Point Cloud Data
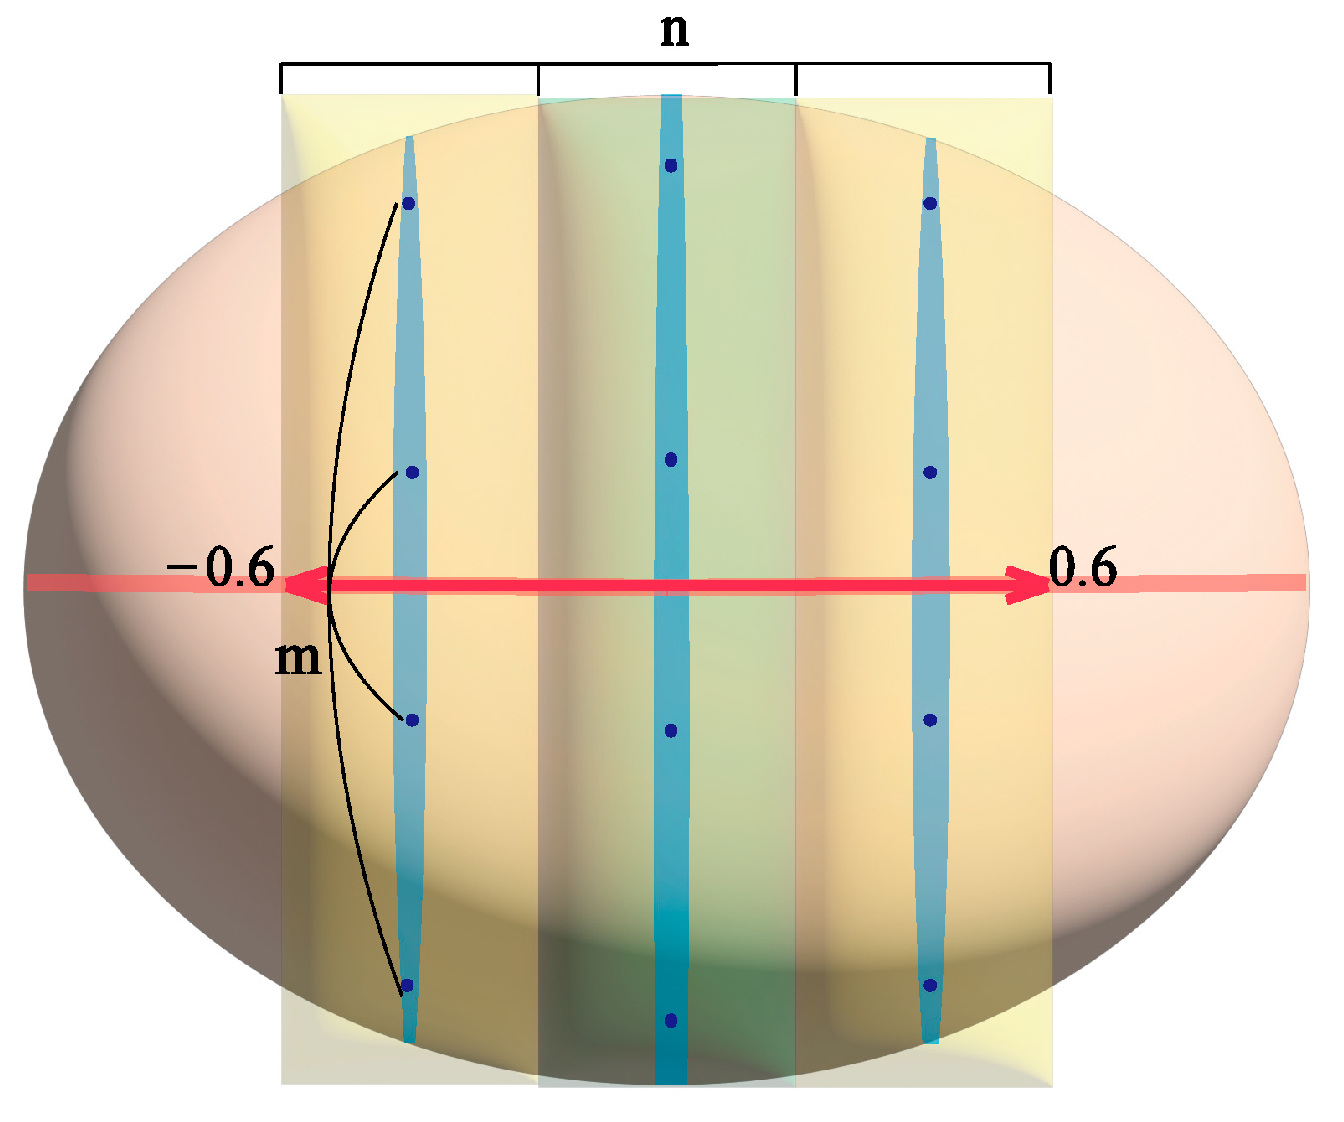
The data preprocessing process was implemented using the Python programming language. As shown in Figure 11, the frame numbers of all laser stripe images of an egg in the video were mapped to a real number space of [−1, 1], serving as the YW coordinate position indices for the 3D slices. Initially, 3D slices with absolute position indices greater than 0.6 were filtered out, as they were considered to represent the edge of the egg and could not significantly represent the shape characteristics of the egg. The remaining sections were then divided into regions of equal spacing based on the position indices, and a 3D slice was randomly selected from each region, ensuring that the interval between all selected 3D slices for an egg was no less than 5 frames. Quadratic interpolation fitting curves were applied to each laser stripe, and sampling was performed at equal intervals.
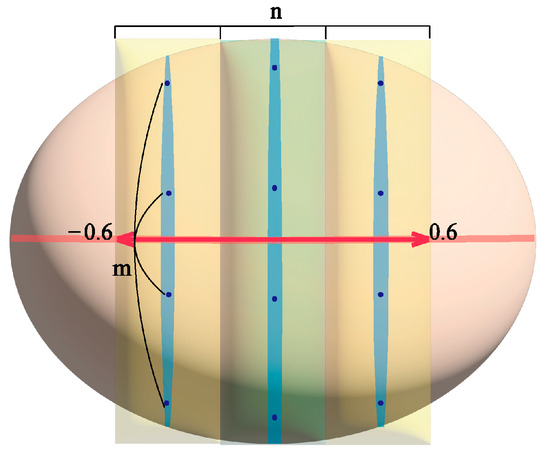
Figure 11.
Point cloud data processing process. Note: n represents the number of egg partitions, m represents the number of sampling points for a laser stripe.
To eliminate the influence of the egg’s placement, the following processing was applied to all selected 3D slices for each egg:
where n represented the number of egg partitions, m was the number of sampling points for a laser stripe, i denoted the serial number of a 3D slice of an egg, and j indicated the serial number of a point on a 3D slice. Zij and Xij represented the original coordinates of a point in the world coordinate system, while fi represented the frame number of the collected 3D slice. Furthermore, Z0max, X0cen, and f0 referred to the maximum Z-coordinate, median X-coordinate, and frame number of the first laser line, respectively. Zij′, Xij′, and fi′ referred to the processed coordinates and frame numbers. After this processing, the 3D coordinates of each egg were transformed into an egg-specific coordinate system based on the first laser stripe of each egg.
To investigate the effect of the number of selected laser lines and the sampling points per laser line on the measurement results and select the optimal sampling combination, the number of regions n was set to 4, 5, 6, or 7, while the number of sampling points m was set to 8, 16, or 24.
Finally, the input features for a sample comprise the coordinates of m sampling points on n 3D slices, along with the corresponding frame numbers of each laser line captured. For each egg, 24 samples were selected, corresponding to 24 different combinations of laser lines. Among the 12 groups of eggs, 8 were randomly selected as the training set, while the data from the remaining four groups were used as the test set to ensure that no egg data from the test set appeared in the training set.
2.7. Regression Algorithms and Evaluation Metrics
In this study, seven machine learning algorithms were employed to predict egg parameters through regression analysis. These algorithms included Random Forest, Lasso Regression, Ridge Regression, SVR [25], GPR, Elastic Net, and Linear Regression. Due to its high computational complexity and processing time, the GPR model was implemented using MATLAB. The remaining six models were developed using Python with the scikit-learn machine learning library. For parameter selection, except for Linear Regression, all methods underwent multiple parameter adjustments to select the optimal combination. Specifically, the number of decision trees in Random Forest was set to 100, with a random seed of 3407, and all other parameters used default settings. The regularization strength for the Lasso Regression was set to 0.01, with other parameters at default values. Ridge Regression’s regularization strength was set to 46.0, with other parameters at default values. SVR used a polynomial kernel function with a regularization term of 1900, tolerance of 0.51, and polynomial constant of 10, with other parameters at default values. GPR used a squared exponential kernel with other parameters at default values. Elastic Net’s regularization strength was set to 0.005, with the L1 and L2 regularization ratio set to 0.5 and other parameters at default values. Linear Regression used default parameters and settings.
We use the root mean squared error (RMSE) to evaluate the proximity of the model’s predicted values to the actual values and the R2 to assess the model’s goodness of fit to the data. Their formulas are defined as follows:
where is the number of samples in the training or test dataset, is the measured actual value, is the predicted value, and is the mean of the measured values.
3. Results and Discussion
3.1. Accuracy of the Laser Scanner
Initially, a laser scanner was employed to scan a stepped gauge block to evaluate the measurement accuracy of the device. The measurement results are presented as a depth map shown in Figure 12, and the specific numerical values are recorded in Table 1.
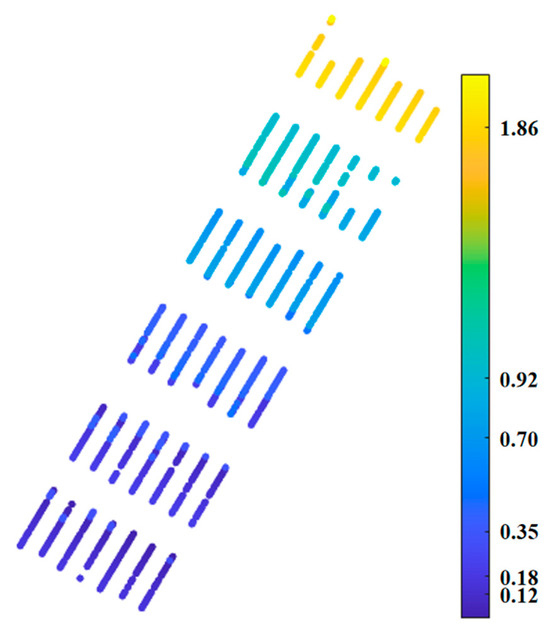
Figure 12.
Distribution diagram of stepped gauge block measurement results (unit mm).

Table 1.
Measurement results of the stepped gauge block.
As illustrated in Figure 12, our self-designed line laser scanner could clearly distinguish between various measurement surfaces. According to Table 1, the minimum resolution achieved is 0.1 mm. The primary factor affecting accuracy was likely the extraction process of the laser centerline. The width of the laser centerline we extracted was one pixel. While sub-pixel laser centerlines tended to offer higher precision, the more complex computational process would consume more time. Considering the size of the eggs, a resolution of 0.1 mm was sufficient.
3.2. Measurement Accuracy of Egg Parameters
For each algorithm, we performed multiple rounds of tuning to achieve optimal results. To prevent overfitting, we randomly selected 8 out of 12 egg groups for training and used the remaining 4 groups for testing, ensuring that the test eggs were not included in the training set. Results indicate that our model achieved good performance on the independent test set.
3.2.1. Measurement Accuracy of the Major Axis Length of Egg
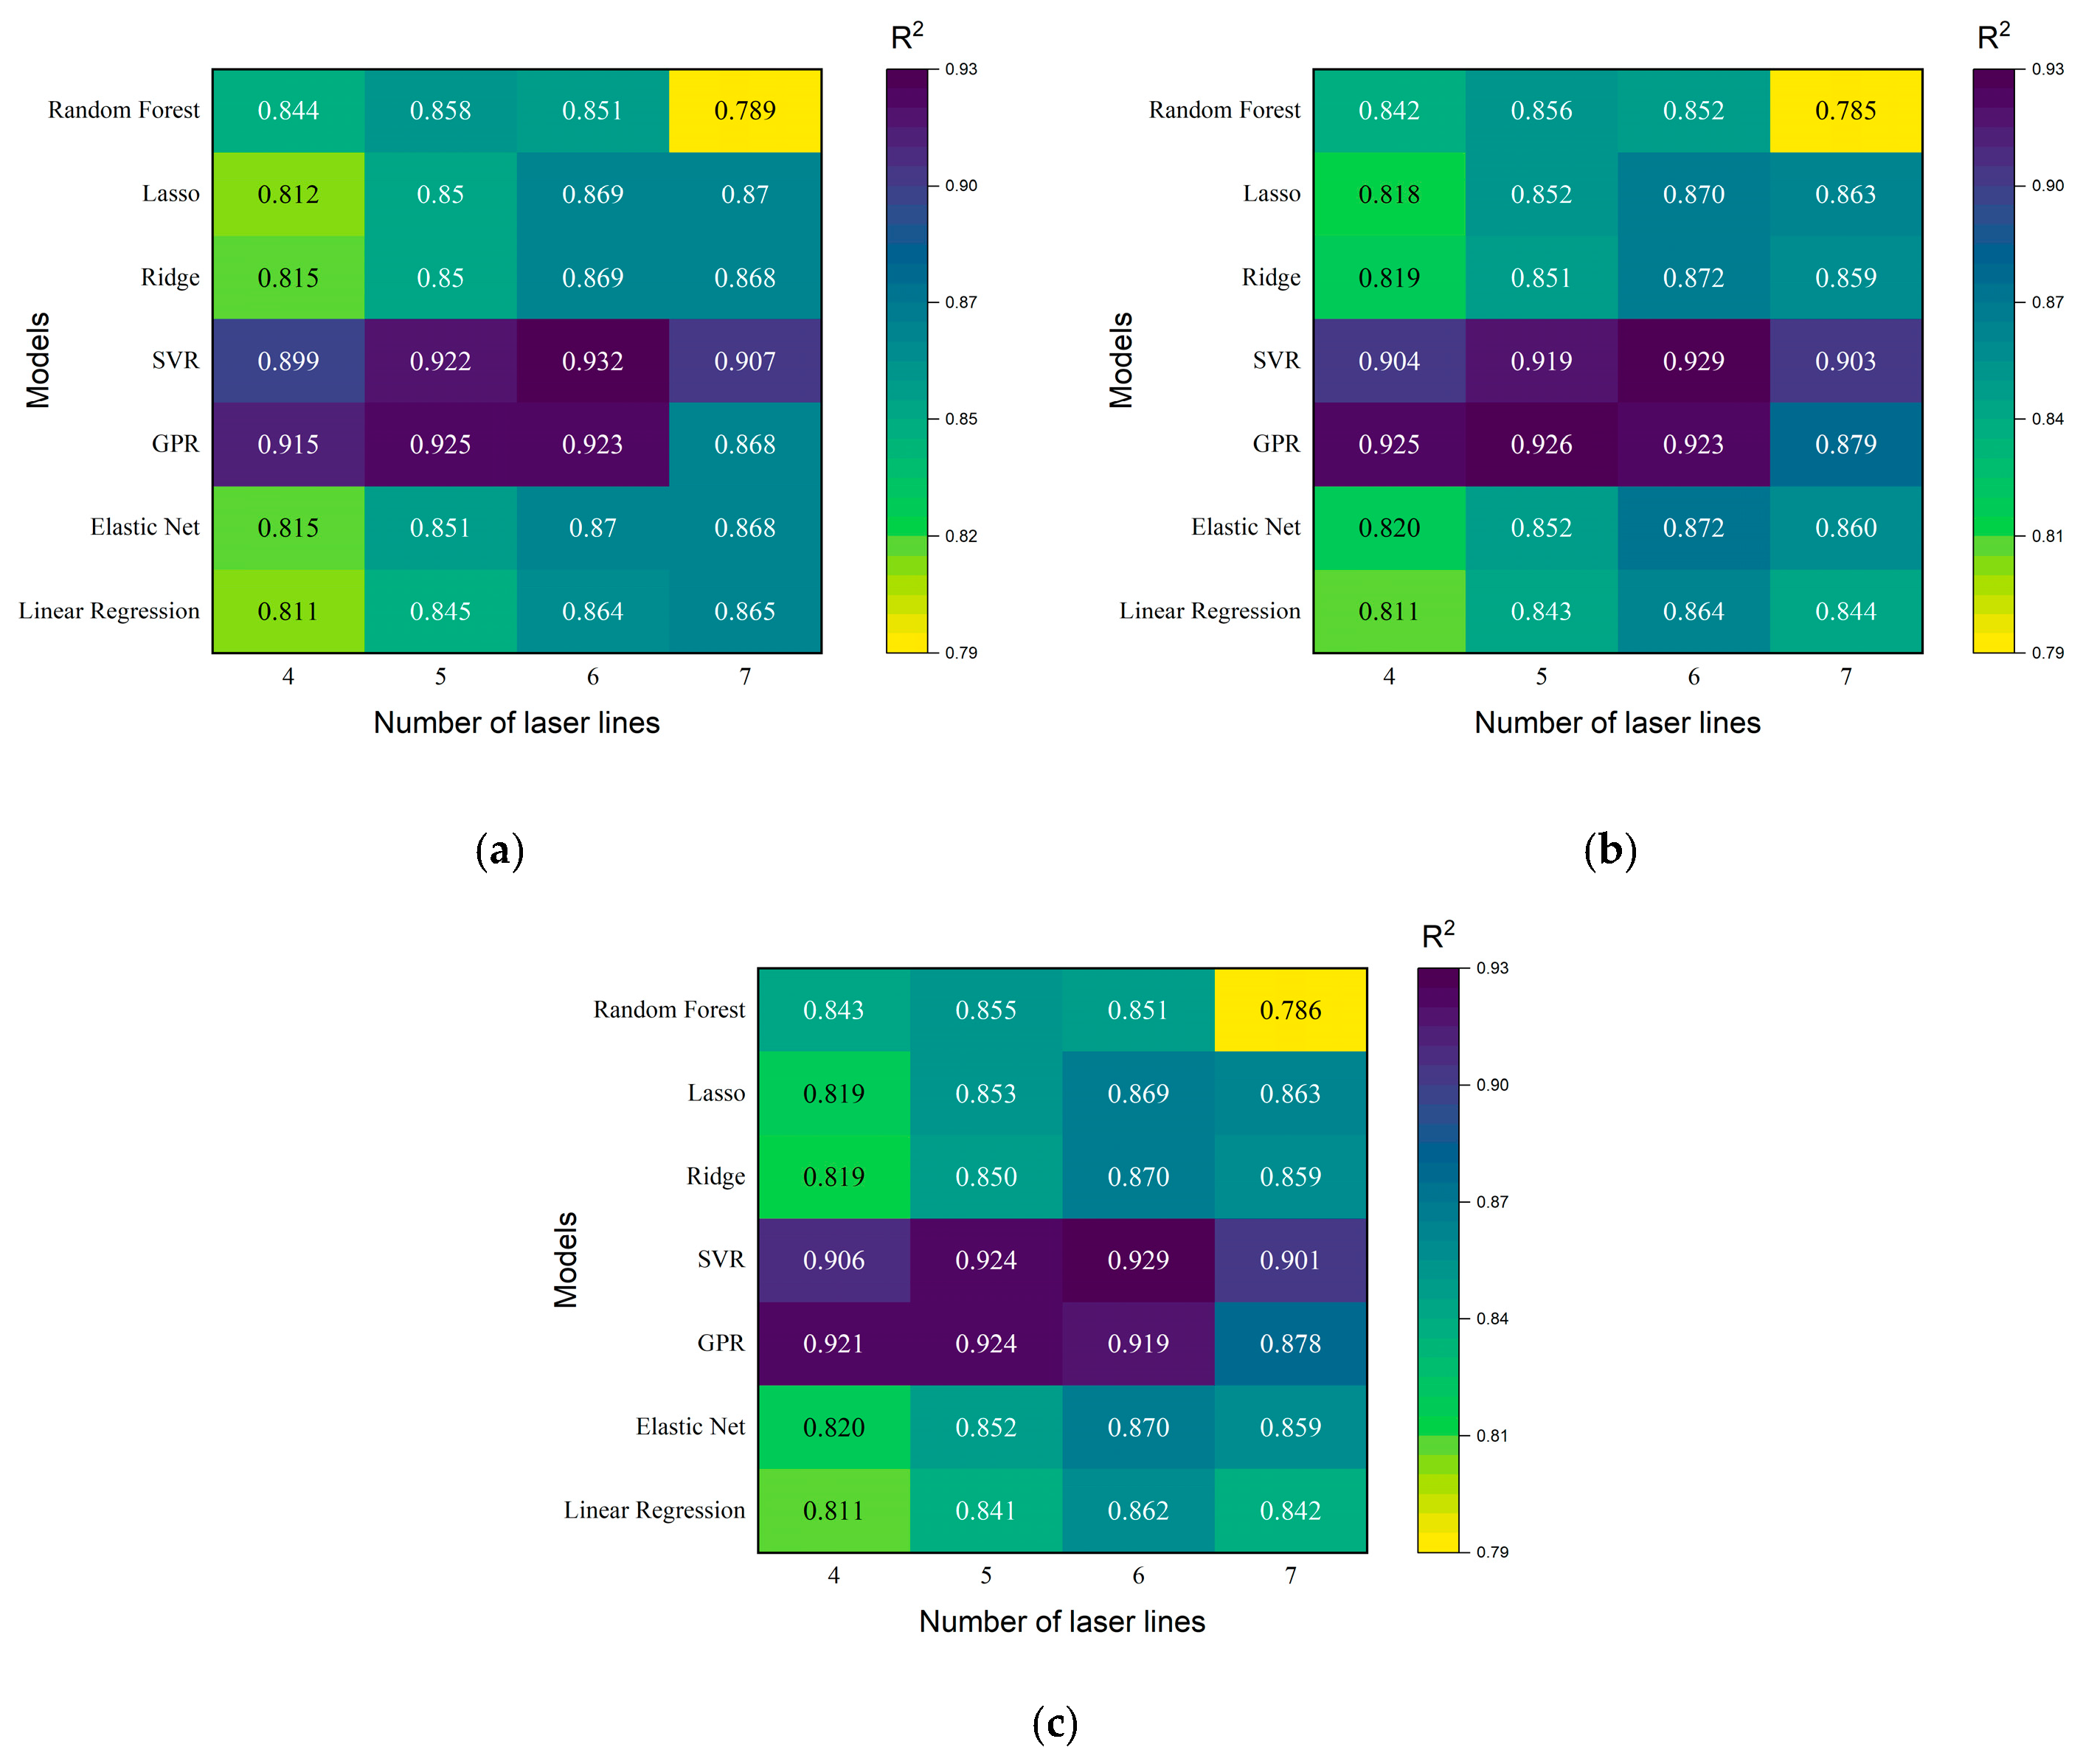
Using Random Forest, Lasso Regression, Ridge Regression, SVR, GPR, Elastic Net, and Linear Regression models to regress the major axis length of eggs, with a sampling of four, five, six, and seven laser lines and 8, 16, or 24 data points per laser line, the results are shown in Figure 13. As observed, using six laser lines generally provided good results across different models and sampling points. Among these, SVR and GPR models demonstrated significantly higher accuracy compared to others. Specifically, for GPR, the accuracy with five laser lines slightly surpassed that with six lines. In contrast, Ridge Regression and Elastic Net models achieved higher precision with seven laser lines than with six, suggesting that additional data might have improved performance. However, this would have required more resources, and given the superior performance of SVR and GPR, such exploration appeared unnecessary. The regression outcomes were consistent across varying numbers of sampled points per laser line. The detailed regression results for GPR and SVR models are shown in Table 2.
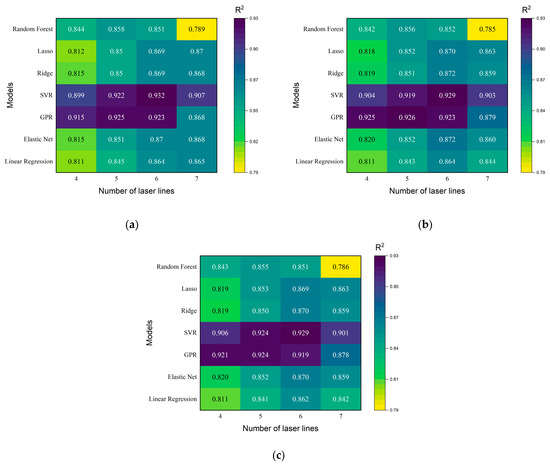
Figure 13.
R2 of the egg’s major axis length using seven models with different numbers of sampled laser lines and different numbers of sampled points per laser line (a–c), respectively sampling 8, 16, and 24 data points per laser line.
Table 2.
Results of GPR and SVR models for egg major axis length regression.
From Figure 13 and Table 2, it could be observed that the regression performance varied little with different sampling point numbers, indicating a minor impact of sampling points on prediction accuracy.
For the SVR model, the best results with five laser lines were achieved when each line sampled 24 points, whereas, with six laser lines, the best results were obtained when each line sampled eight points, showing overall better performance using six lines compared to five. For the GPR model, using five laser lines yielded the best results when each line sampled 16 points, while with six laser lines, the best results were obtained with each line sampling 16 points, indicating superior performance with five lines compared to six. The division of egg regions had a significant impact on egg major axis length regression, facilitating better reconstruction of egg shape across various tilting states. However, excessive partitioning might have reduced regression accuracy due to potential model overfitting. For eggs in different tilting states, a single laser line might not have consistently captured the egg’s major axis length information. Moreover, excessive sampling points per laser line could have introduced redundant information, leading to a slight decrease in accuracy.
For regression of egg major axis length, the SVR model performed best when the egg was divided into six regions, with each laser line sampling eight points, achieving an R2 of 0.932 and an RMSE of 0.741 mm. To investigate the impact of different factors on regression results, the average predicted values for 24 samples corresponding to one egg are plotted in Figure 14.
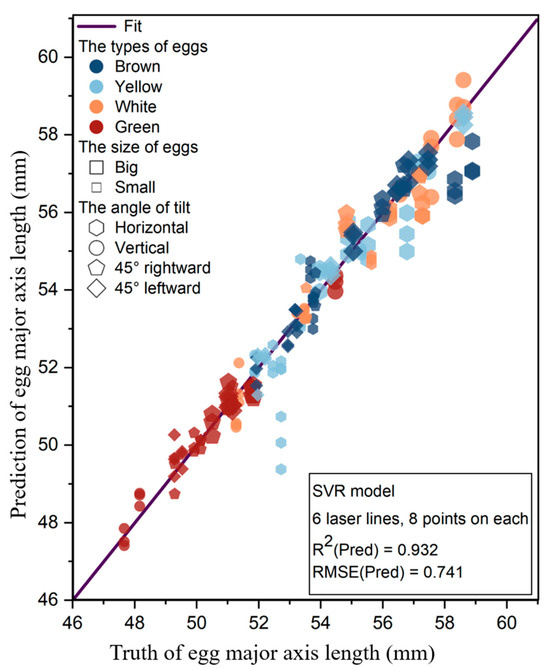
Figure 14.
Relationship between predicted and truth values of egg major axis length regression by SVR model on the test set, using 6 laser lines with each line sampling 8 points.
For the same type of egg, horizontally positioned eggs showed the largest deviation from the true values, mostly underestimating them. Specifically, for small yellow eggs and big yellow eggs, predictions for other inclinations closely approximated the true values, whereas horizontally positioned eggs notably underestimated their corresponding true values. Horizontal positioning refers to when the egg’s major axis is perpendicular to the laser line, making it difficult for the coordinates of points on the laser line to reflect the egg’s major axis length information. Since egg groups were randomly selected when constructing the test set, it ensured an even distribution of egg types but did not necessarily ensure an even distribution of egg inclinations within egg types. For instance, as shown in the figure, horizontally positioned eggs were predominantly yellow, but this did not imply that yellow eggs performed poorly. Comparing regression results for vertically positioned eggs, eggs tilted 45° to the right, and eggs tilted 45° to the left, there was no significant difference between different types of eggs. This indicated that egg type and the inclinations of vertically positioned, right-tilted 45°, and left-tilted 45° eggs had minimal impact on regression results. The model demonstrated robust predictive performance across datasets containing eggs of various types and sizes in non-horizontal positions.
3.2.2. Measurement Accuracy of the Minor Axis Length of Eggs
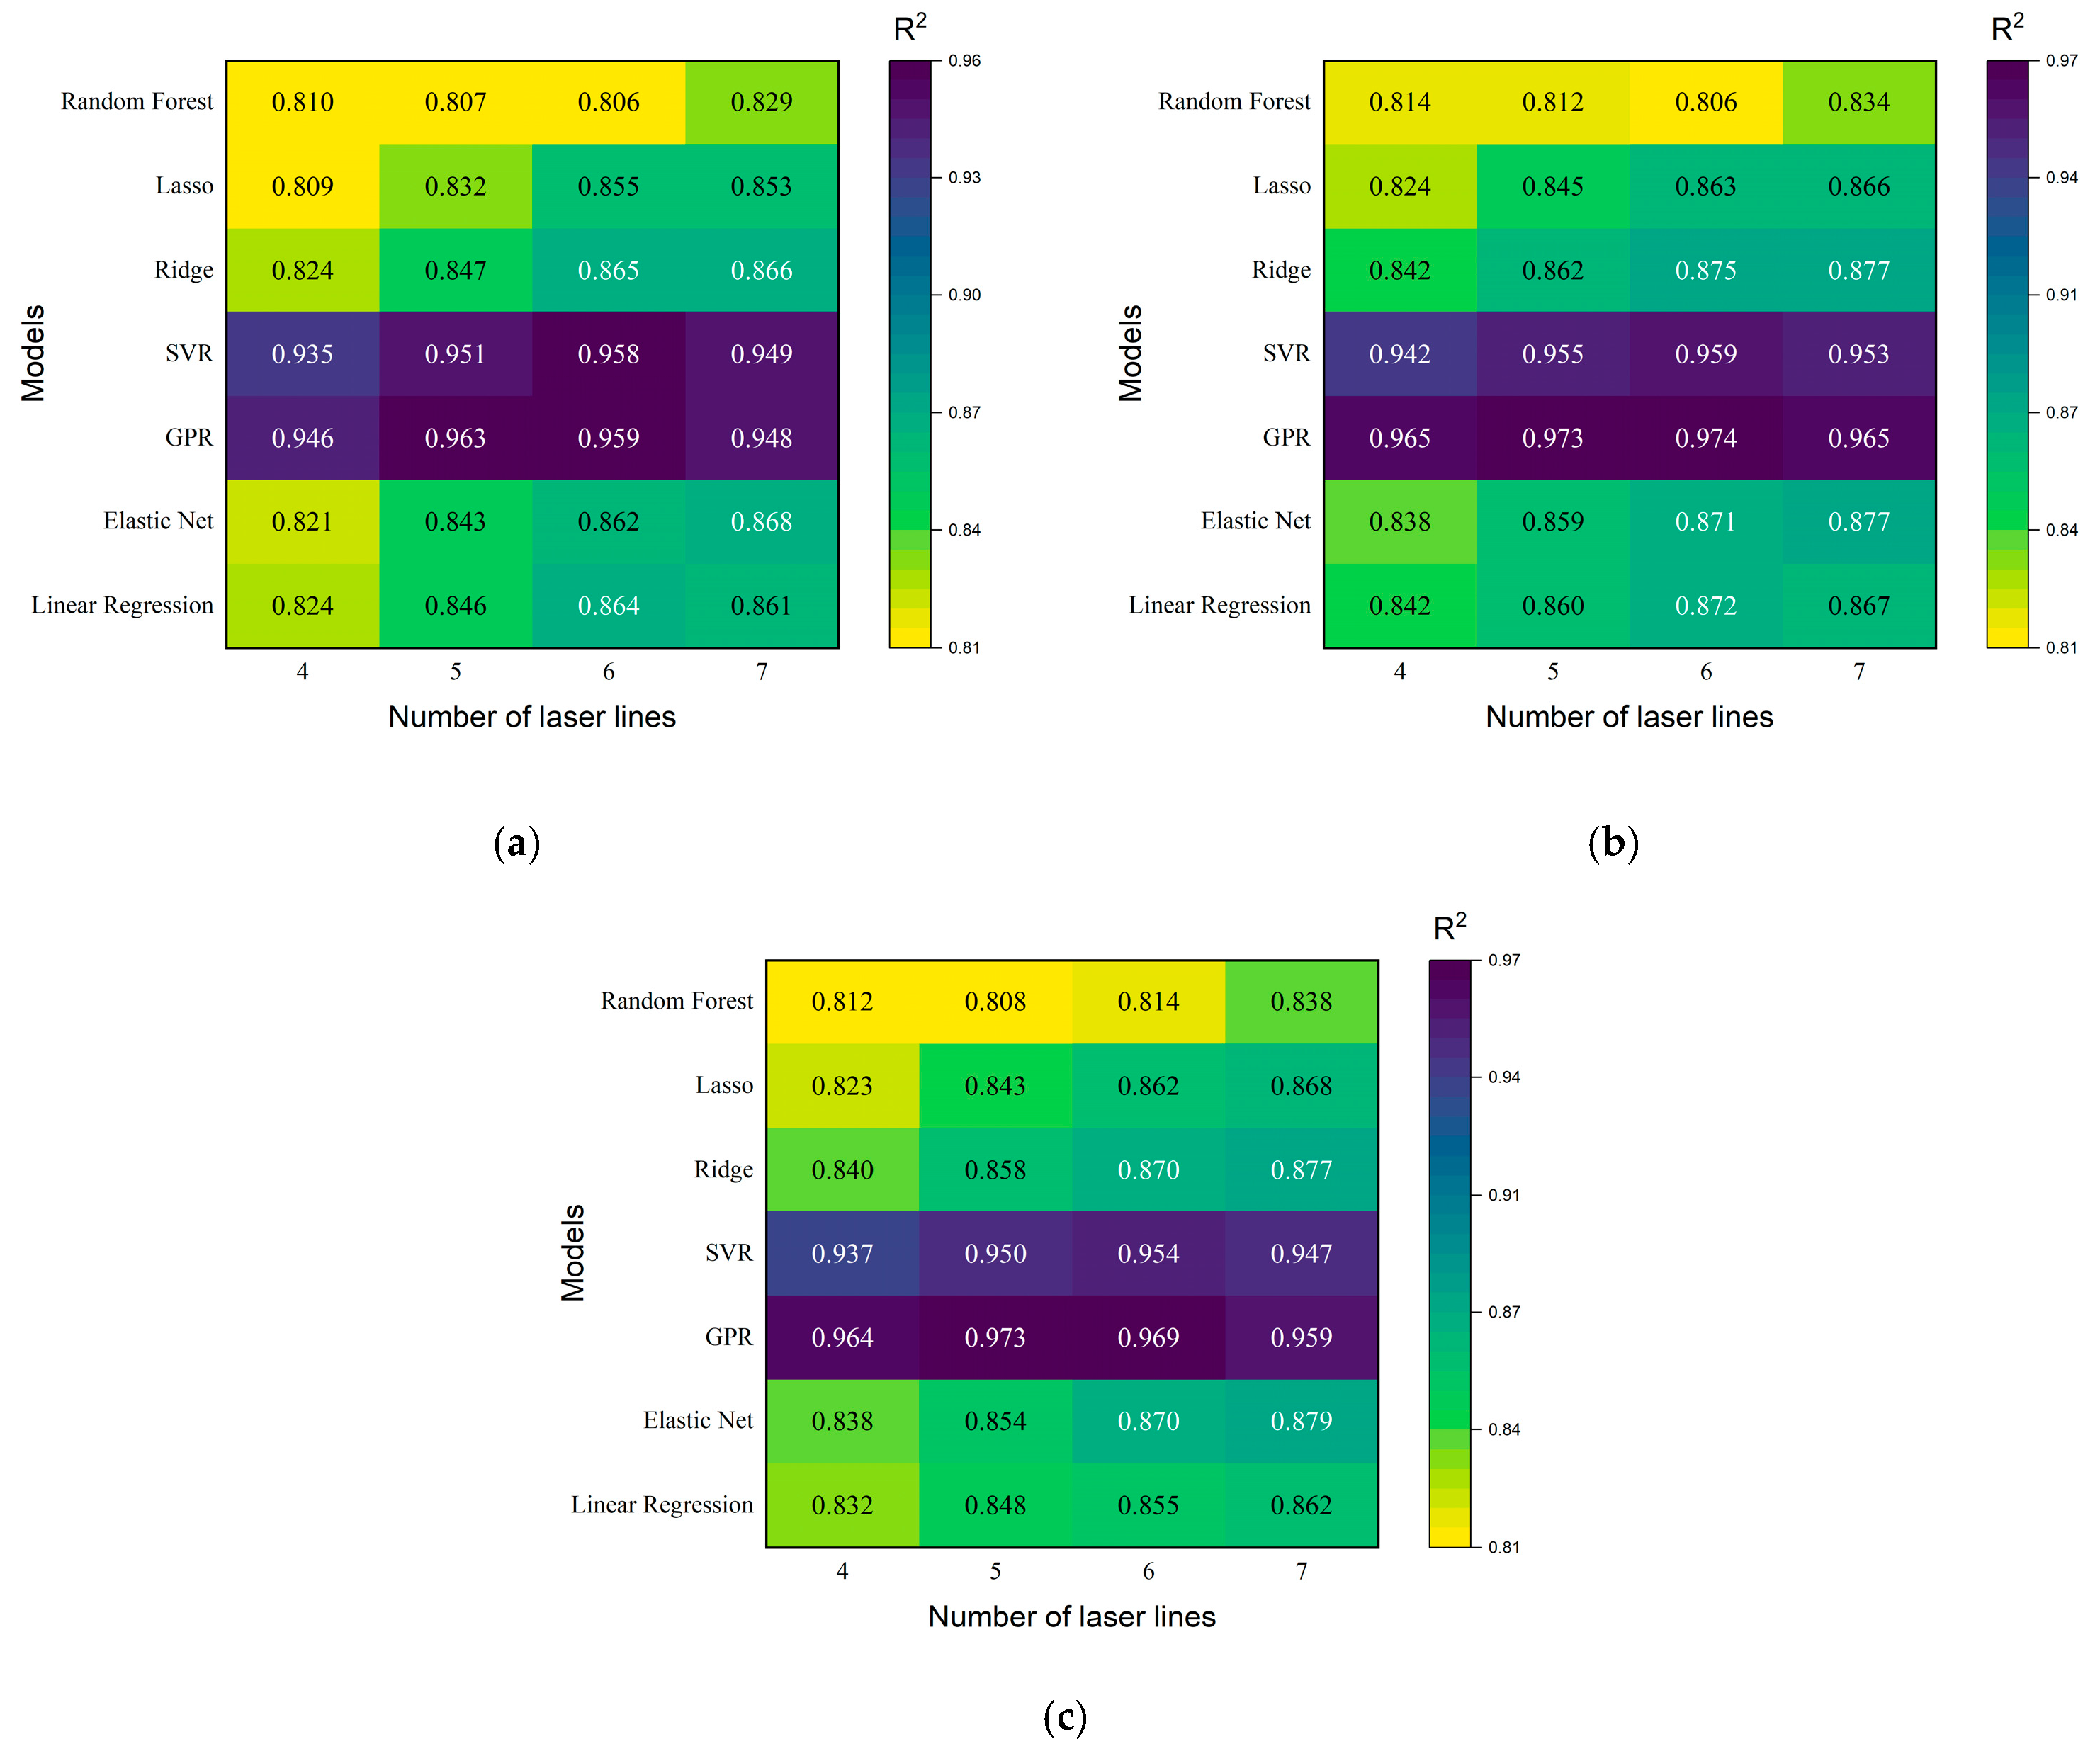
Using Random Forest, Lasso Regression, Ridge Regression, SVR, GPR, Elastic Net, and Linear Regression models to predict the minor axis length of eggs, with a sampling of four, five, six, and seven laser lines and each laser line sampling 8, 16, or 24 data points, the results are shown in Figure 15. Upon comparing the prediction results from different models, it was evident that the Linear Regression and Random Forest models performed the worst. In contrast, the GPR and SVR models significantly outperformed the others in terms of accuracy and exhibited very high R2 values. Predictions using five and six laser lines were superior to those using four and seven lines for these two models. The regression results for the minor axis length using GPR and SVR models with five and six laser lines are detailed in Table 3.

Figure 15.
R2 of the egg’s minor axis length using seven models with different numbers of sampled laser lines and different numbers of sampled points per laser line (a–c), respectively sampling 8, 16, and 24 data points per laser line.
Table 3.
Results of GPR and SVR models for egg minor axis length regression.
From the data in Table 3, it was observed that the R2 values of the SVR and GPR models were both above 0.95. The prediction results for the egg’s minor axis length were significantly better than those for the major axis length. Moreover, when regressing the minor axis length compared to the major axis length, a decrease in accuracy was observed only when more data points were used. This happened because the egg was approximated as an ellipsoid, where both dimensions of the egg were similar to the egg’s minor axis, and each laser line reflected information about the egg’s minor axis length with less redundant information. Both models achieved the highest R2 when sampling six laser lines, with each line sampling 16 points. Specifically, GPR achieved a maximum R2 of 0.974. The specific predicted values and mean true values of this model are shown in Figure 16.
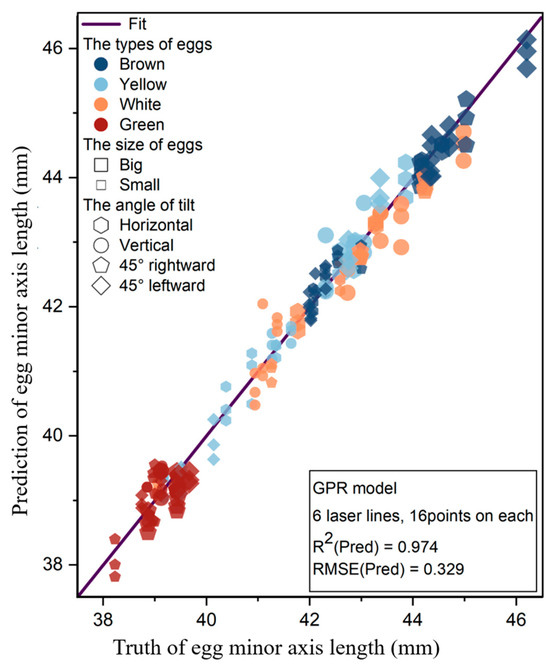
Figure 16.
Relationship between predicted and actual values of egg minor axis length regression by GPR model on the test set, using 6 laser lines with each line sampling 16 points.
Figure 16 shows that different types of eggs exhibited consistent deviations between predicted and true values across various inclinations, with no significant discrepancies observed. Eggs placed horizontally tended to have predictions closer to the true values. This occurred because when eggs were placed horizontally, the egg’s minor axis aligned parallel to the laser line, capturing both the length and height of the egg, thus yielding better regression results. Each laser line’s 3D information reflected the egg’s minor axis length, resulting in slightly inferior predictions for vertically placed eggs compared to other orientations, yet without notable deviations. Overall, using six sampled laser lines, with each line capturing 16 points, the GPR model achieved robust prediction performance across datasets of eggs with varying types and inclinations.
3.2.3. Measurement Accuracy of Egg Volume
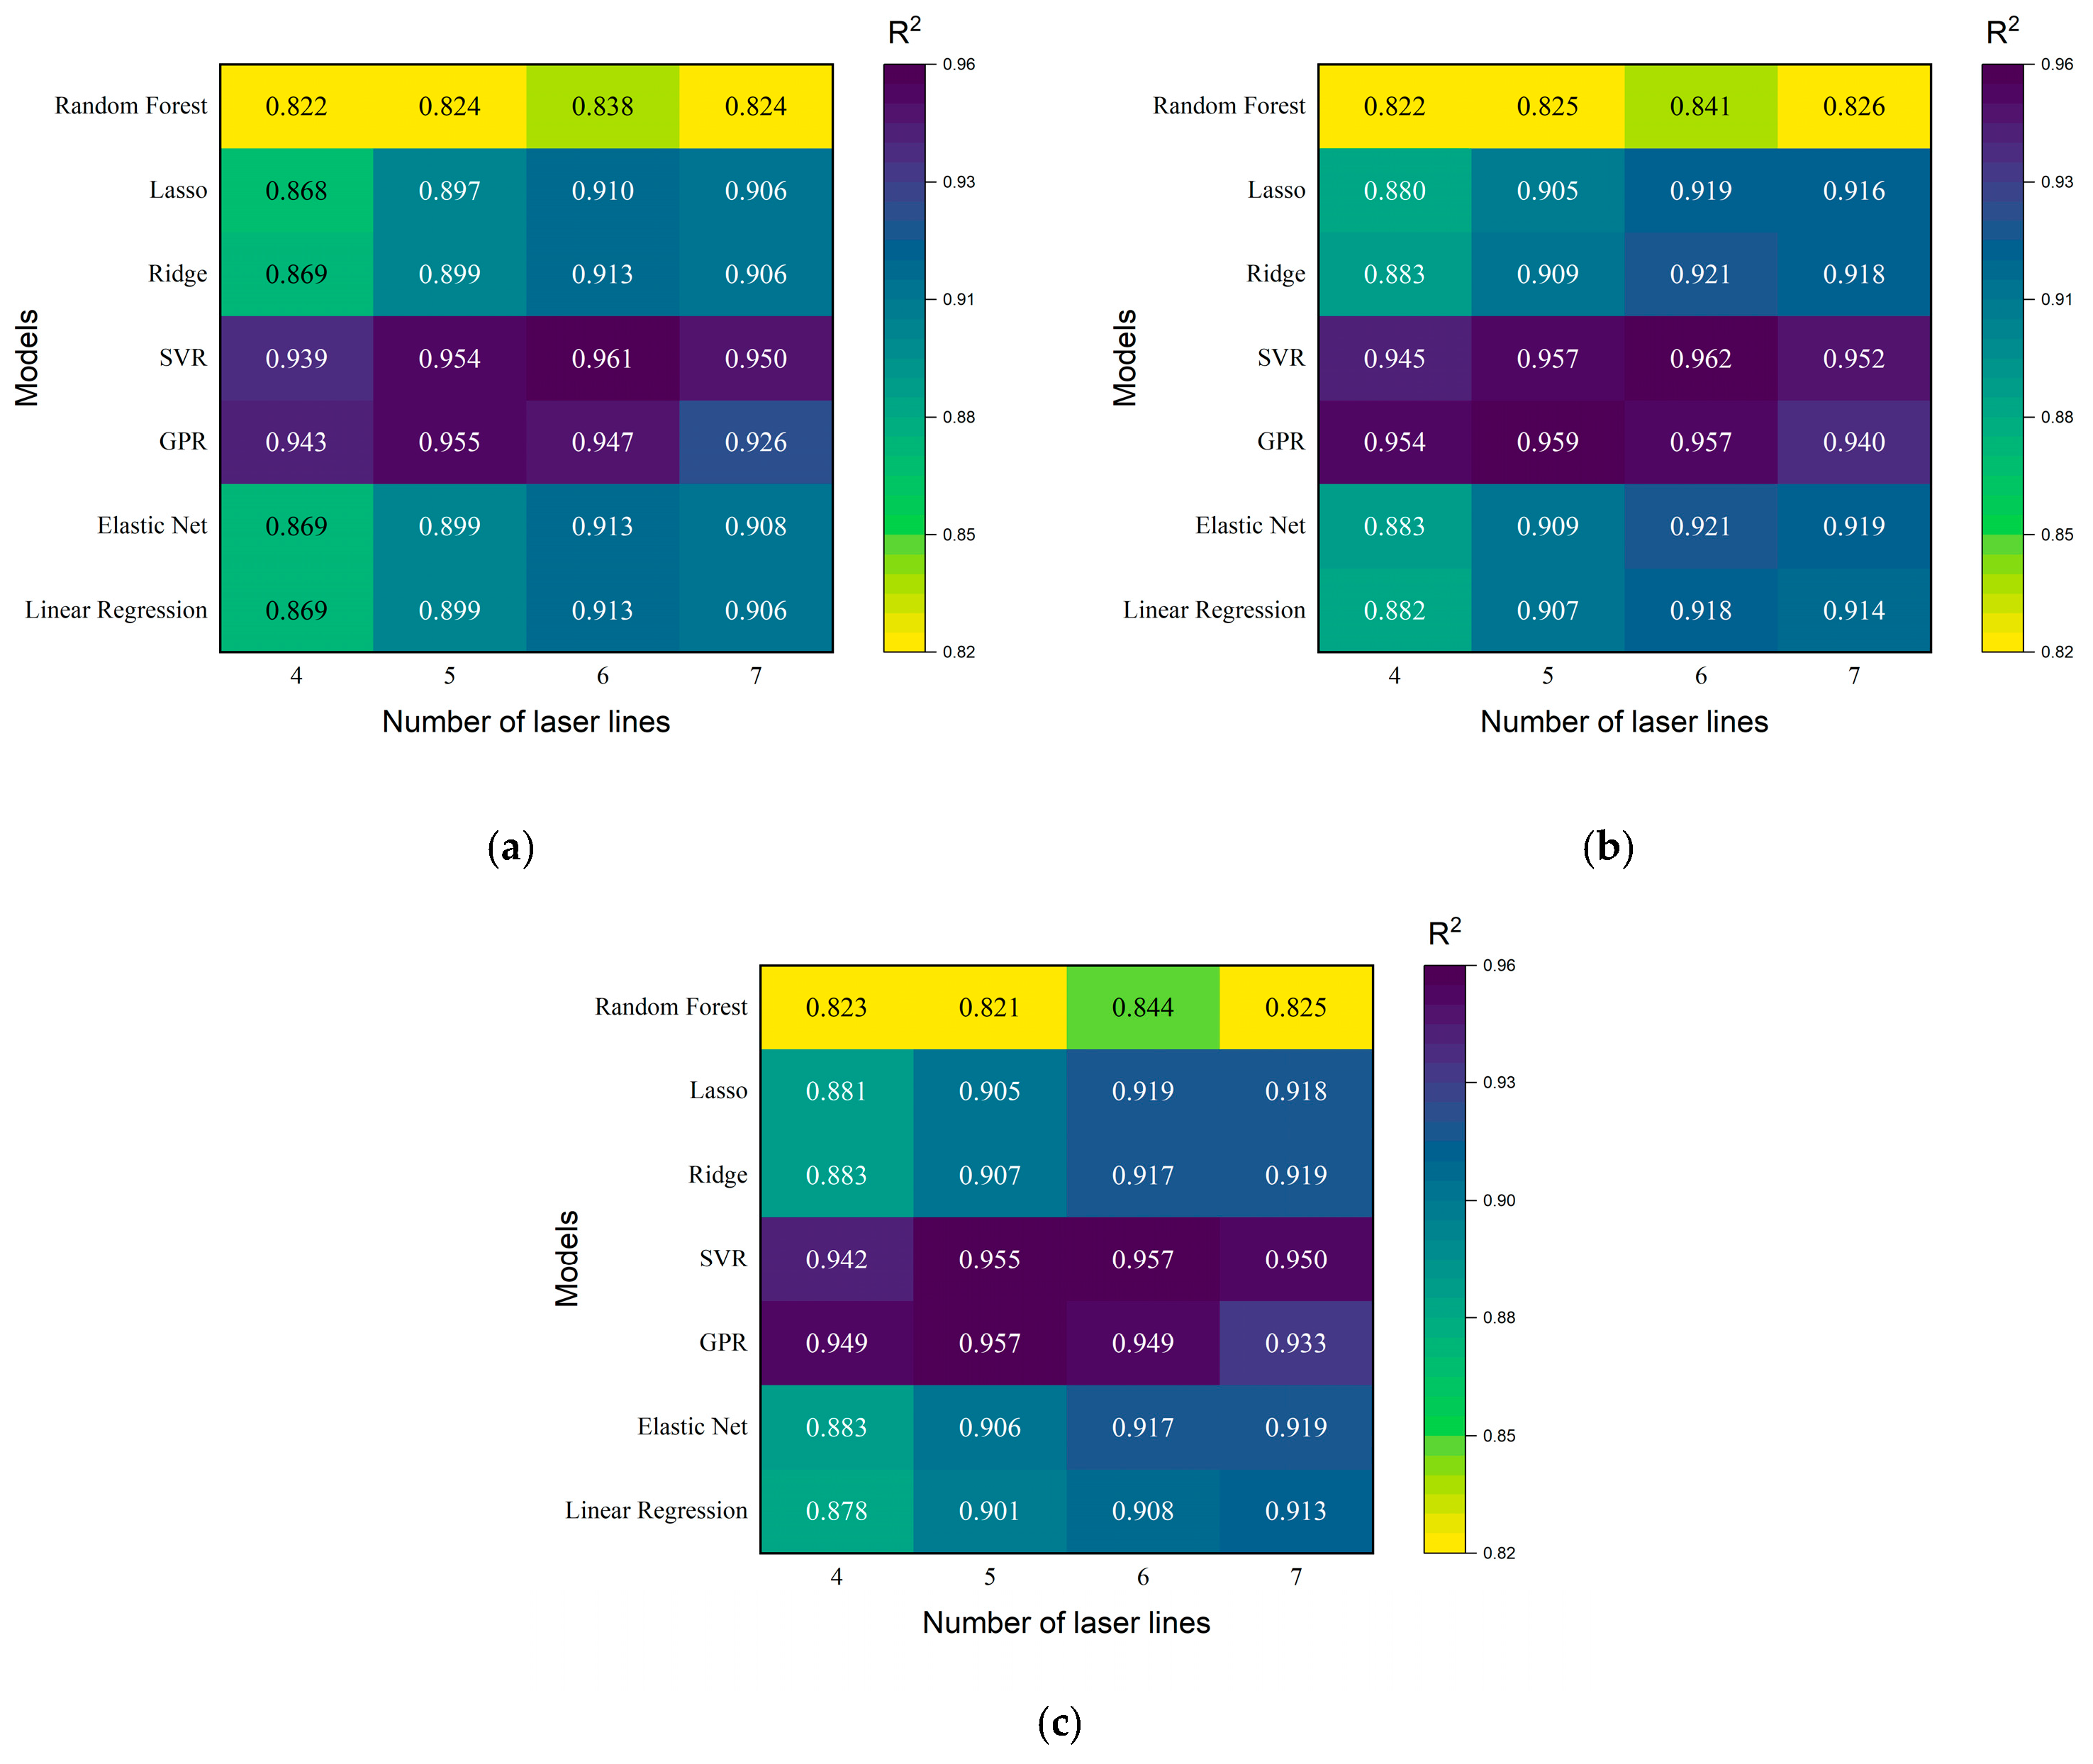
Using Random Forest, Lasso Regression, Ridge Regression, SVR, GPR, Elastic Net, and Linear Regression models to regress the volume of eggs, we sampled four, five, six, and seven laser lines, with each laser line sampling at 8, 16, or 24 data points. The results are shown in Figure 17. It was observed that the Random Forest model performed significantly worse compared to other models. The remaining models demonstrated relatively good regression performance for egg volume, with the GPR and SVR models performing exceptionally well. Specifically, the GPR model performed better with five sampled laser lines, while the SVR model performed better with six sampled laser lines. The regression results using five and six laser lines for the GPR and SVR models are shown in Table 4.
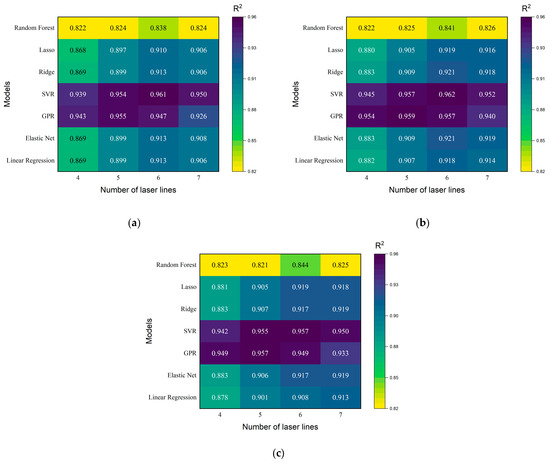
Figure 17.
R2 of the egg’s volume using seven models with different numbers of sampled laser lines and different numbers of sampled points per laser line (a–c), respectively sampling 8, 16, and 24 data points per laser line.
Table 4.
Results of GPR and SVR models for egg volume regression.
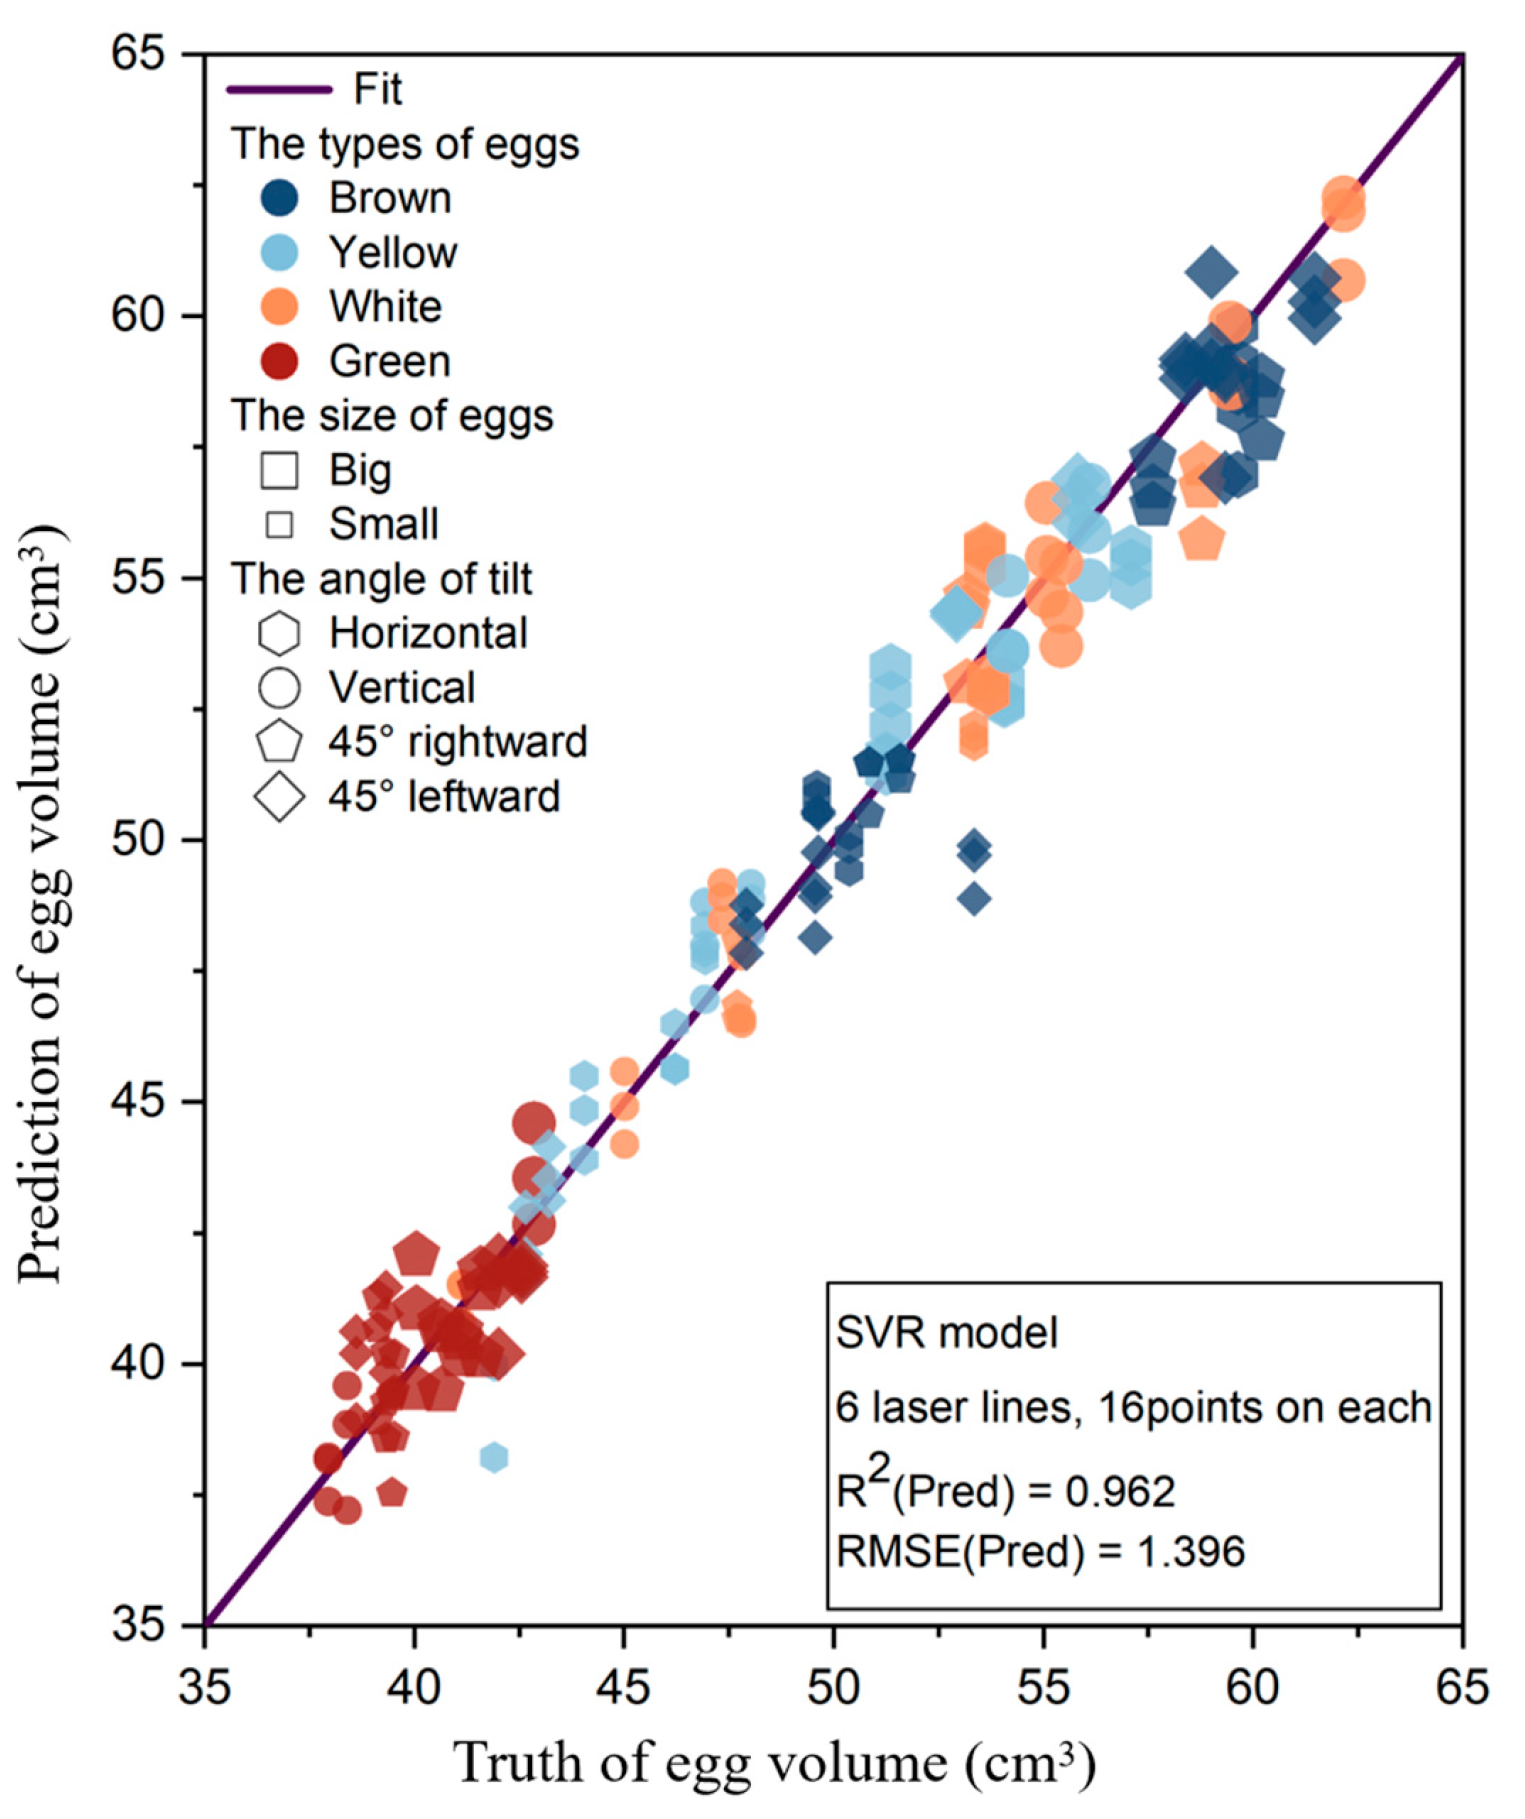
If the egg is approximated as an ellipsoid, its volume can be calculated using its major and minor axes lengths. From the data in Table 4, it is evident that SVR achieves higher accuracy in predicting volume compared to predicting the minor axis length, indicating SVR’s better fit to complex data relationships. When dividing the egg into five regions and sampling 16 points per laser line, GPR demonstrated the highest accuracy in volume prediction, which corresponded to its optimal data sampling combination for predicting the major axis length. The prediction of egg volume by the GPR model was influenced to some extent by the egg’s major axis. For regression of egg volume using the SVR model and dividing the egg into six regions with 16 points sampled per laser line, the model achieved the best performance with an R2 of 0.962 and RMSE of 1.396 cm3. To explore the impact of different factors on regression results, the average predicted values of 24 samples per egg were plotted, as shown in Figure 18.

Figure 18.
Relationship between predicted and actual values of egg volume regression by SVR model on the test set, using 6 laser lines with each line sampling 16 points.
From the distribution plot of predicted values, it was observed that SVR’s predictions for egg volume did not exhibit significant deviations from the true values, unlike the predictions for egg major axis length when placed horizontally. The deviations between predicted and true values for eggs placed at different tilt angles were relatively uniform, although slightly larger when the egg was placed horizontally. The SVR model’s predictions for egg volume were still influenced to some extent by the egg’s major axis. Predictions for eggs tilted 45° to the left were generally close to the true values across different egg types, but there were three outliers with notably larger deviations. These outliers corresponded to the same egg captured under three different backgrounds, potentially due to significant measurement errors in the true value of that egg. Overall, with the sampling of six laser lines and 16 points per line, the SVR model demonstrated robust prediction performance across various egg types and tilt angles.
3.2.4. Measurement Accuracy of Egg Weight
Using Random Forest, Lasso Regression, Ridge Regression, SVR, GPR, Elastic Net, and Linear Regression models to regress the weight of eggs, with a sampling of four, five, six, and seven laser lines and each laser line sampling 8, 16, or 24 data points, the results are shown in Figure 19. Given the approximate uniformity in egg density, there was a linear relationship between the egg’s weight and its volume. The distribution of prediction accuracy for egg weight across different models mirrored that observed for egg volume. Among the models, GPR and SVR demonstrated superior performance in predicting egg weight. Specifically, the GPR model performed best with five laser lines, while the SVR model excelled with six laser lines. The regression results for egg weight using GPR and SVR with five and six laser lines are summarized in Table 5.
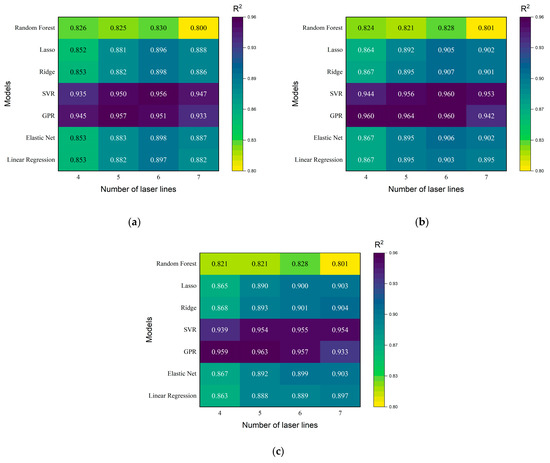
Figure 19.
R2 of the egg’s weight using seven models with different numbers of sampled laser lines and different numbers of sampled points per laser line (a–c), respectively sampling 8, 16, and 24 data points per laser line.
Table 5.
Results of GPR and SVR models for egg weight regression.
The regression performance of the SVR model on weight was not as good as its performance on volume, with slightly poorer fitting to more complex data relationships. In contrast, the GPR model exhibited better regression results on weight compared to volume, showing superior fitting to complex data relationships. For regression of egg weight, the GPR model achieved the highest prediction accuracy with five sampled laser lines, and each line was sampled 16 points, with an R2 of 0.964 and RMSE of 1.445g. To explore the impact of different factors on regression results, the average predicted values of 24 samples corresponding to one egg are plotted in Figure 20.
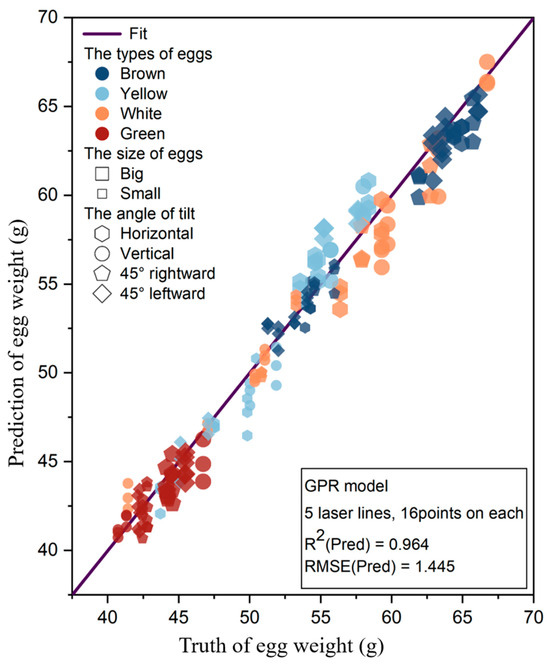
Figure 20.
Relationship between predicted and actual values of egg weight regression by GPR model on the test set, using 5 laser lines with each line sampling 16 points.
From Figure 20, it was observed that for different orientations, the predictions obtained using the GPR model were close to the true values, with the best performance observed at a 45° tilt to the right. The deviation between predicted and true values varied slightly for different types of eggs, attributed to the dataset used for model construction containing only 3D coordinates of the egg surface. Egg weight is not only related to geometric dimensions but also to egg density. Average densities for different types of eggs are presented in Table 6.
Table 6.
Average density of different types of eggs.
Based on Table 6, it was evident that different types of eggs had similar but distinctly different densities. As observed from Figure 20, for eggs with higher densities, such as big brown eggs, small yellow eggs, big white eggs, big green eggs, and small green eggs, the predicted values were mostly lower than the actual values. Conversely, for eggs with lower densities, like big yellow eggs and small white eggs, the predicted values tended to be higher than the actual values. Considering the impact of density on egg weight prediction, the density information of eggs was incorporated into the training dataset features for model construction. Due to the relatively small numerical values of density, it was multiplied by a weight of 1.6 when added to the training set to achieve optimal weight.
After adding the density feature, the model’s predictive accuracy showed a noticeable improvement. Using the GPR model with five laser lines sampled, each laser line sampling 16 points, the R2 was 0.978, and the RMSE was 1.125 g. The specific predictions are shown in Figure 21.
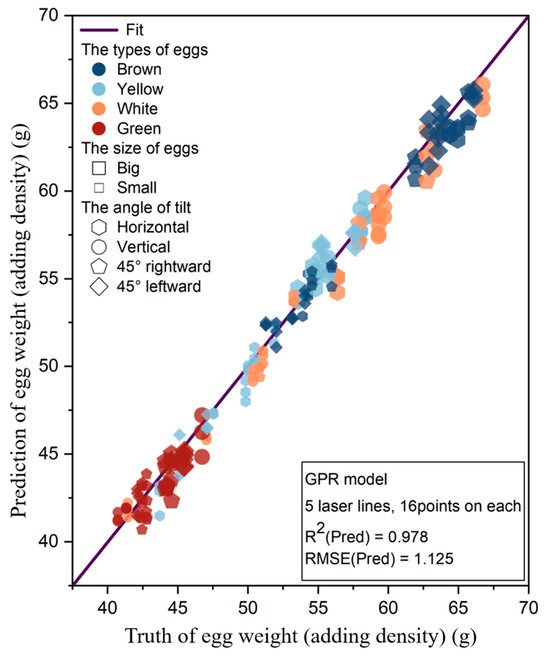
Figure 21.
Relationship between predicted and actual values of egg weight regression by GPR model on the test set after adding the density feature, using 5 laser lines with each line sampling 16 points.
Comparing Figure 20 and Figure 21, it was evident that the addition of density information significantly improved predictive accuracy. The distribution of predicted values for different types of eggs became more uniform. The issue of overestimation for eggs with higher density and underestimation for eggs with lower density showed noticeable improvement. The GPR model demonstrated effective fitting for complex data relationships. By incorporating 3D laser point coordinates from the egg surface and density information, the model accurately predicted egg weight. The optimal data sampling configuration used five laser beams, with each beam sampling 16 points.
In the present study, the inconsistency in egg varieties and shelf life resulted in significant density differences. However, eggs from poultry farms were fresh and of uniform breed, thus maintaining consistent density. Therefore, the impact of egg density on the model was minimal.
3.3. Impact of Different Backgrounds
During image acquisition, we imaged each group of eggs against three different backgrounds: a white egg belt, a perforated egg belt, and a black background without a belt. The R2 values across these backgrounds were recorded for the best regression results of egg parameters using various models and data combinations, as shown in Table 7.
Table 7.
R2 of egg parameters with different models, number of laser lines, and number of points per laser line across different backgrounds.
Based on the data presented in Table 7, it was observed that the results for egg parameter regression varied slightly across different backgrounds. When regressing the egg’s major axis length, the white egg belt yielded the highest R2 values, followed by the perforated egg belt. For egg volume regression, the white egg belt again showed the best performance, with the black background coming next. When regressing the minor axis length and weight, the black background achieved the highest R2 values, while the perforated egg belt performed the worst.
The white egg belt, widely used in poultry farms, consistently showed good results across different parameters, indicating that our self-designed laser scanner held significant practical value. In the control group without an egg belt (black background), the R2 values remained high, reaching 0.984 in minor axis length regression and 0.982 in weight regression. This demonstrated the applicability of our method in measuring egg parameters, suggesting that in a laboratory setting, the black background could be effectively used depending on the parameter being measured. Although the R2 values for the perforated egg belt were not as high as those for the other two backgrounds, it still achieved R2 values above 0.95 for all parameters except the major axis length. This indicated that our method maintained good robustness across different backgrounds.
3.4. Comparison to Conventional Research
Compared to the water displacement method, our study utilizes a non-contact measurement device that does not affect the eggs during the measurement process. Additionally, our device employs a push-broom imaging technique, which allows for dynamic measurement when mounted on a steadily moving platform. The measurement speed primarily depends on the movement speed of the device and the imaging quality. In our study, the device moved at a speed of 20 mm/s, enabling it to scan an egg in four seconds. We also tested the device at a speed of 40 mm/s, achieving similar imaging and measurement results. Theoretically, our method can measure 900–1800 eggs or more per hour, though this real-time capability requires further validation.
We compared the findings from the relevant literature with our research results, as documented in Table 8.
Table 8.
Comparison of results between previous research methods and our method.
The table shows that some studies on egg size and shape classification have relatively low accuracy and require manual placement, additional light sources, or reference objects. Although we did not focus on egg grading, the high accuracy of egg parameter measurements with FEgg3D indicates significant potential for egg grading research. Thipakorn et al. [8] and Siswantoro et al. [9] achieved high r values for the correlation between the actual and measured values for egg weight and volume, respectively. However, their methods required external light sources for high-quality images and could only measure one egg at a time, necessitating manual placement, which made them unsuitable for large-scale measurements in poultry houses. Okinda et al. [12] could image up to 15 eggs simultaneously with an R2 of 0.979, but their method was limited to static measurements and required manual egg placement. Zhang et al. [14] used a depth camera for egg volume measurement, achieving 99% accuracy, but their approach involved multi-angle imaging, posing significant challenges for real-time applications. Our device ensures high measurement throughput without requiring additional light sources or reference objects, thus demonstrating substantial application potential.
4. Limits and Future Work
Since we installed an NIR filter in the FEgg3D camera, and the poultry house is typically illuminated with LED lights, variations in indoor ambient light should have relatively little impact on the measurement process; however, this requires further validation. During video capture, the background of the eggs was limited to the egg belt or a black background. However, in actual poultry farms, the camera’s field of view may include other objects, such as metal cages and feathers, which could affect the measurement process. Further experiments are needed to validate the extent of this impact. Additionally, special textures or stains on the egg surface might affect the measurement process. In summary, since our experiments were conducted under controlled conditions, further testing in diverse environmental settings is needed to validate the robustness of the system.
In some commercial multi-tier layer hen houses, the space above the egg belt is narrow, and the FEgg3D system is relatively large. We are currently testing the integration of FEgg3D with the trolley feeding system in commercial poultry houses to collect field data for evaluating laying hen performance. Moreover, we aim to deploy our model on embedded devices and mount FEgg3D on mobile platforms to facilitate field application in commercial layer farms. These works are intended to refine the FEgg3D’s functionality and extend its practical application across various poultry farming environments. Currently, our device uses relatively costly NIR cameras and NIR line lasers to ensure accurate measurements, and the cost of processors for real-time processing is also considerable. This limits the wide application of our device. However, a single device is expected to have a lifespan of 5 years. We are also exploring the use of lower-cost hardware to determine if similar measurement performance can be achieved.
5. Conclusions
In this study, we proposed a highly accurate device, FEgg3D, based on line laser scanning technology for measuring egg parameters. By utilizing a limited number of points from point clouds, we applied machine learning algorithms to predict the major axis length, minor axis length, volume, and weight of various types of eggs across different backgrounds.
The FEgg3D demonstrated the ability to discern height differences as small as 0.1 mm, providing sufficient precision for egg measurement. We employed seven algorithms for regressing egg parameters, with SVR and GPR performing significantly better than the other algorithms. Using our device, we achieved high measurement accuracy for egg parameters. Specifically, the R2 for regressing the egg’s long axis reached up to 0.932; for the short axis, it was 0.974; for volume, it was 0.962; and for weight, it reached 0.964. For weight prediction, when incorporating the density feature, the R2 further improved to 0.978 under the same conditions. Our method demonstrates high accuracy and robustness across different types of eggs and backgrounds. Compared to methods proposed in other literature, our approach better meets the requirements for egg measurement, providing both a method and equipment for online egg parameter measurement in commercial layer hen houses. Our future research will aim at downsizing the hardware to be compatible with different poultry farm configurations and incorporating the system into existing farm management software. Our future research will focus on miniaturizing the hardware to fit various poultry farm setups, integrating the system with existing farm management software, and reducing equipment costs.
Author Contributions
Conceptualization, L.W. and Y.Z.; methodology, Y.Z.; software, Y.Z.; validation, Y.Z., J.B. and X.W.; formal analysis, Y.Z. and D.S.; investigation, Y.Z. and S.L.; resources, H.W. and L.W.; data curation, Y.Z.; writing—original draft preparation, Y.Z.; writing—review and editing, L.W. and D.S.; visualization, Y.Z.; supervision, L.W.; project administration, L.W. and H.W.; funding acquisition, L.W. All authors have read and agreed to the published version of the manuscript.
Funding
This research was funded by the Sci-Tech Innovation 2030 Agenda of China, grant number 2021ZD0113804-3.
Institutional Review Board Statement
Not applicable.
Data Availability Statement
The data are not publicly available due to privacy reasons.
Acknowledgments
The authors are grateful to the China National University Student Innovation & Entrepreneurship Development Program for providing funding for this research under grant number 202310019029.
Conflicts of Interest
The authors declare no conflicts of interest.
References
- Miranda, J.M.; Anton, X.; Redondo-Valbuena, C.; Roca-Saavedra, P.; Rodriguez, J.A.; Lamas, A.; Franco, C.M.; Cepeda, A. Egg and Egg-Derived Foods: Effects on Human Health and Use as Functional Foods. Nutrients 2015, 7, 706–729. [Google Scholar] [CrossRef] [PubMed]
- Carey, J.B.; Kuo, F.L.; Anderson, K.E. Effects of Cage Population on the Productive Performance of Layers. Poult. Sci. 1995, 74, 633–637. [Google Scholar] [CrossRef] [PubMed]
- Abbas, G.; Khan, S.H.; Rehman, H.U. Effects of formic acid administration in the drinking water on production performance, egg quality and immune system in layers during hot season. Avian Biol. Res. 2013, 6, 227–232. [Google Scholar] [CrossRef]
- Shi, S.R.; Wang, K.H.; Dou, T.C.; Yang, H.M. Egg weight affects some quality traits of chicken eggs. J. Food Agric. Environ. 2009, 7, 432–434. [Google Scholar]
- Nyalala, I.; Okinda, C.; Kunjie, C.; Korohou, T.; Nyalala, L.; Chao, Q. Weight and volume estimation of poultry and products based on computer vision systems: A review. Poult. Sci. 2021, 100, 101072. [Google Scholar] [CrossRef] [PubMed]
- Rush, S.A.; Maddox, T.; Fisk, A.T.; Woodrey, M.S.; Cooper, R.J. A precise water displacement method for estimating egg volume. J. Field Ornithol. 2009, 80, 193–197. [Google Scholar] [CrossRef]
- Narushin, V.G.; Romanov, M.N.; Griffin, D.K. Delineating an ovoidal egg shape by length and breadth: A novel two-parametric mathematical model. Biosyst. Eng. 2022, 224, 336–345. [Google Scholar] [CrossRef]
- Thipakorn, J.; Waranusast, R.; Riyamongkol, P. Egg weight prediction and egg size classification using image processing and machine learning. In Proceedings of the 2017 14th International Conference on Electrical Engineering/Electronics, Computer, Telecommunications and Information Technology (ECTI-CON), Phuket, Thailand, 27–30 June 2017. [Google Scholar] [CrossRef]
- Siswantoro, J.; Hilman, M.Y.; Widiasri, M. Computer vision system for egg volume prediction using backpropagation neural network. In Proceedings of the IOP Conference Series: Materials Science and Engineering, Bali, Indonesia, 24–25 August 2017. [Google Scholar] [CrossRef]
- Waranusast, R.; Intayod, P.; Makhod, D. Egg size classification on Android mobile devices using image processing and machine learning. In Proceedings of the 2016 Fifth ICT International Student Project Conference (ICT-ISPC), Nakhonpathom, Thailand, 27–28 May 2016. [Google Scholar] [CrossRef]
- Duan, Y.F.; Wang, Q.H.; Li, X.M.; Tang, Y.H. High-throughput online detection method of egg size and shape based on convex hull algorithm. Trans. Chin. Soc. Agric. Eng. 2016, 32, 282–288. [Google Scholar]
- Okinda, C.; Sun, Y.; Nyalala, I.; Korohou, T.; Opiyo, S.; Wang, J.; Shen, M. Egg volume estimation based on image processing and computer vision. J. Food Eng. 2020, 283, 110041. [Google Scholar] [CrossRef]
- Luo, S.; Ma, Y.M.; Jiang, F.; Wang, H.Y.; Tong, Q.; Wang, L.J. Dead Laying Hens Detection Using TIR-NIR-Depth Images and Deep Learning on a Commercial Farm. Animals 2023, 13, 1861. [Google Scholar] [CrossRef]
- Zhang, W.; Wu, X.; Qiu, Z.; He, Y. A novel method for measuring the volume and surface area of egg. J. Food Eng. 2016, 170, 160–169. [Google Scholar] [CrossRef]
- Chan, T.O.; Lichti, D.D.; Jahraus, A.; Esfandiari, H.; Lahamy, H.; Steward, J.; Glanzer, M. An Egg Volume Measurement System Based on the Microsoft Kinect. Sensors 2018, 18, 2454. [Google Scholar] [CrossRef] [PubMed]
- Manorathna, P.; Ogun, P.; Marimuthu, S.; Justham, L.; Jackson, M. Performance Evaluation of a Three Dimensional Laser Scanner for Industrial Applications. In Proceedings of the 2014 7TH International Conference on Information and Automation for Sustainability (ICIAFS), Chinese Acad Sci (CAS), Beijing, China, 27–29 September 2012. [Google Scholar] [CrossRef]
- Uyar, R.; Erdoğdu, F. Potential use of 3-dimensional scanners for food process modeling. J. Food Eng. 2009, 93, 337–343. [Google Scholar] [CrossRef]
- Wang, M.Z.; Sun, Q.C.; Gao, C.B.; Ren, Z.M.; Dai, W.Y. A three-dimensional vision measurement method based on double-line combined structured light. Sci. Rep. 2023, 13, 18660. [Google Scholar] [CrossRef] [PubMed]
- Min, F.; Lou, A.; Wei, Q. Design and Experiment of Dynamic Measurement Method for Bulk Material of Large Volume Belt Conveyor Based on Laser Triangulation Method. In Proceedings of the 7TH Annual International Conference on Material Science and Environmental Engineering, Wuhan, China, 15–16 November 2019. [Google Scholar] [CrossRef]
- Dashpute, A.; Anand, C.; Sarkar, M. Depth Resolution Enhancement in Time-of-Flight Cameras Using Polarization State of the Reflected Light. IEEE Trans. Instrum. Meas. 2019, 68, 160–168. [Google Scholar] [CrossRef]
- Frangez, V.; Salido-Monzu, D.; Wieser, A. Assessment and Improvement of Distance Measurement Accuracy for Time-of-Flight Cameras. IEEE Trans. Instrum. Meas. 2022, 71, 1003511. [Google Scholar] [CrossRef]
- Pasinetti, S.; Nuzzi, C.; Luchetti, A.; Zanetti, M.; Lancini, M.; De Cecco, M. Experimental procedure for the metrological characterization of time-of-flight cameras for human body 3D measurements. Sensors 2023, 23, 538. [Google Scholar] [CrossRef] [PubMed]
- Yao, L.S.; Liu, H.B. Design and Analysis of High-Accuracy Telecentric Surface Reconstruction System Based on Line Laser. Appl. Sci. 2021, 11, 488. [Google Scholar] [CrossRef]
- Zhang, Z.Y. A flexible new technique for camera calibration. IEEE Trans. Pattern Anal. Mach. Intell. 2000, 22, 1330–1334. [Google Scholar] [CrossRef]
- Awad, M.; Khanna, R. Support Vector Regression. In Efficient Learning Machines: Theories, Concepts, and Applications for Engineers and System Designers; Awad, M., Khanna, R., Eds.; Apress: Berkeley, CA, USA, 2015; pp. 67–80. [Google Scholar]


Disclaimer/Publisher’s Note: The statements, opinions and data contained in all publications are solely those of the individual author(s) and contributor(s) and not of MDPI and/or the editor(s). MDPI and/or the editor(s) disclaim responsibility for any injury to people or property resulting from any ideas, methods, instructions or products referred to in the content. |
© 2024 by the authors. Licensee MDPI, Basel, Switzerland. This article is an open access article distributed under the terms and conditions of the Creative Commons Attribution (CC BY) license (https://creativecommons.org/licenses/by/4.0/).