Article

Biochar Application in Combination with No Tillage Enhanced Yield and Grain Quality of Ratoon Rice

Chongqing Academy of Agricultural Sciences, Chongqing 401329, China
*
Author to whom correspondence should be addressed.
Agriculture 2024, 14(8), 1407; https://doi.org/10.3390/agriculture14081407
Submission received: 5 July 2024 / Revised: 14 August 2024 / Accepted: 16 August 2024 / Published: 20 August 2024
(This article belongs to the Special Issue The Responses of Food Crops to Fertilization and Conservation Tillage)

Abstract

:
Biochar is beneficial as a clean, stable, and efficient soil amendment to improve rice quality and yield. However, there are few reports on the effects of no-tillage in combination with biochar application on rice growth, yield, and quality in regenerative rice systems. This study evaluated rice yield, grain quality, multiple antioxidant enzyme activities, and malondialdehyde content under four treatments: rotary tillage alone, rotary tillage + biochar application, no-tillage alone, and no-tillage + biochar. The results showed that the rice yield under no-tillage alone was 15% lower than that under rotary tillage alone, but that biochar application significantly increased rice yield by 10% and 20% under rotary tillage and no-tillage conditions, respectively, which might be attributed to the fact that biochar application increased panicle number, spikelet number per panicle, grain filling rate, and antioxidant enzyme activities. Additionally, biochar application also increased fine rice rate and protein content, meanwhile reducing chalkiness degree and chalky grain rate in both the main-season rice and ratoon-season rice. These results suggest that biochar application could enhance the yield and grain quality of ratoon rice, thus compensating for the no-tillage-induced yield loss. This study reveals the role of biochar in main-season rice and ratoon rice cultivation, providing a valuable reference for improved fertilizer utilization and cleaner agricultural production.

1. Introduction

Rice (Oryza sativa L.), as a fundamental staple crop, serves as a primary source of essential nutrients and energy for human consumption [1]. In recent years, with increasing affluence and improved living standards, the demand for higher-quality rice has experienced a notable surge. The production and cultivation of high-quality rice have emerged as a central topic in rice research [2]. Ratoon rice is the product of a second season of rice cultivation, where the seedlings develop and mature again from buds remaining on the nodes of rice straw after the main crop harvest [3]. The recent studies have highlighted multiple advantages of ratoon rice cultivation, such as superior grain quality, increased yield, reduced labor and time consumption, lower production costs, and ultimately enhanced economic benefits [4]. In comparison to the primary cultivation season, the rice ratoon season exhibits a lower average temperature and wider temperature fluctuation range during the grain filling stage. These temperature variations result in plumper grains, higher milling yield, lower chalkiness, and better taste attributes [5]. The combination of effective cultivation management measures and planting systems plays a crucial role in optimizing the inherent qualities of regenerative rice and achieving high and stable yields of rice [6].
During the rice ratoon season, regrowth originates from dormant buds that persist at different nodes of the parent plant. Each episode of regrowth results in the formation of new rice panicles, thereby increasing the density of effective panicles per unit area compared to traditional single-season late rice [7]. The stubble height of the main-season rice is a critical factor influencing the number of effective panicles during the ratoon season. Maintaining a stubble height of 40 cm facilitates the recovery and preservation of root system vitality in the main-season rice, thus enhancing the regrowth rate and ultimately increasing rice yield [8]. A stubble height exceeding 15 cm can increase the thousand-grain weight, overall grain yield, and straw yield [9]. A stubble height of 20 cm can stimulate the emergence of axillary buds at the basal nodes, resulting in increased yield. However, it should be noted that this practice (20 cm stubble) significantly prolongs the maturity period [10]. The differences resulting from different stubble heights could be attributed to the distinct regenerative bud sprouting characteristics exhibited among different varieties [11]. Differences in growth stages significantly affect the dry matter accumulation of ratoon shoots, thereby impacting rice quality. During the booting and grain filling stages, a larger diurnal temperature variation contributes to dry matter accumulation, ultimately enhancing rice quality [12]. Studies have shown that the yield of ratoon rice is significantly higher than that of main-season rice. At the same time, the gelatinization rate and gelatinization degree of ratoon rice are significantly lower than those of main-season rice [13]. The amylose content in ratoon rice is significantly higher than that in main-season rice, while the gelatinization viscosity is slightly reduced [14]. Additionally, the protein content of ratoon rice is lower than that of main-season rice, but its alkaline solubility value is higher [15]. There are significant variations in ratoon rice during the grain filling stage due to differences in varieties and cultivation management, and these differences have important effects on both yield and rice quality.
In recent years, numerous studies have investigated the effects of different rice cultivation methods on the growth, physiological and biochemical traits, and yield of rice. These studies indicate that no-tillage can effectively improve soil quality in double-season rice fields [16,17]. Additionally, compared to traditional tillage practices, ridge cultivation significantly enhances protective enzyme activity and the photosynthetic rate in rice, thereby effectively promoting rice yield [18]. Although existing research suggests that no-tillage has significant advantages in improving economic traits related to rice yield [19], further studies are needed to evaluate and compare the specific impacts of rotary tillage and no-tillage on rice yield.
Biochar is a solid carbon-based material, and it is generated from high-temperature pyrolysis of biomass in anaerobic or oxygen-restricted conditions [20]. Biochar is characterized by high carbon content, remarkable stability, aromaticity, large surface area, strong adsorption capacity, and distinctive porous structure [21]. Additionally, biochar has a rich nutrient profile, making it a novel substance with great potential to improve soil structure, fertility, and fertilizer utilization efficiency, thus ultimately increasing crop yield [22]. The application of biochar, either solely or in combination with chemical fertilizers, has a positive influence on nutrient assimilation, biomass accumulation, and subsequent increase in rice yield. Moreover, biochar application can improve soil structure, optimize nitrogen utilization efficiency, augment effective tillering, and facilitate grain formation in rice crops [23,24]. In addition, biochar-based fertilizer, as a novel type of organic fertilizer, has exhibited the ability to enhance crop quality throughout the production process [25,26]. Therefore, applying biochar to paddy fields as a strategy to enhance rice production can be considered a multi-win approach. However, research reports on the yield and quality of ratoon rice under different tillage practices and biochar application conditions are still insufficient.
Previous studies have primarily focused on the effects of biochar or farming methods on rice yield and quality, while reports on the interaction between biochar and farming methods regarding these aspects are relatively limited. This study aims to evaluate the impacts of different tillage methods and biochar application on the yield, quality, and antioxidant activities of ratoon rice. To this end, we compared the effects of biochar application versus non-application on various indicators of both main-season rice and ratoon-season rice under four different tillage practices, assessing the potential role of biochar in mitigating the negative effects of no-tillage on rice yield and grain quality.

2. Materials and Methods

2.1. Field Experimental Details

Field experiments were conducted on a farm (30°21′ N, 112°8′ E) situated in Yangtze University, Jingzhou, Hubei province, China, during the years 2020 and 2021. The soil samples were collected from the topsoil (20 cm), and subsequently subjected to various soil property analyses [27]. The soil is calcareous alluvial, displaying the following properties: pH, 5.72; organic matter content, 24.64 g kg−1; alkali-hydrolysable nitrogen, 224.51 mg kg−1; available phosphorus, 11.37 mg kg−1; and available potassium, 117.48 mg kg−1. Over a two-year span, soil property data were averaged. The rice straw biochar used in our study was provided by Nanjing Qinfeng Zhongcheng Biomass New Materials Co., Ltd. (Nanjing, China). This biochar underwent a charring process at a temperature of 450 °C, with a pH value of 8.65. The biochar exhibited an organic carbon content of 667.22 g kg−1, a total nitrogen content of 1.99 g kg−1, and a total potassium content of 27.15 g kg−1. The rice planting pattern was main-season rice planting followed by a winter fallow period and ratoon-season rice planting. The Fengliangyou2 (FLY2) variety was selected for the field experiment, which is known for its high yield and strong regenerative capabilities. The entire growth cycle including the main season and ratoon season reached up to 213 days.
A split-plot design was adopted, the experiments were conducted in triplicate, and each subplot covered an area of 50 m2. Rice seedlings were planted in rows, with a spacing of 16 × 30 cm2 and 2 seedlings per hill. Four treatments were designed in this study, which were rotary tillage with no biochar (RTNC), rotary tillage + biochar (RTC), no-tillage with no biochar (NTNC), and no-tillage + biochar (NTC), and the biochar was applied during the booting stage. Under the rotary tillage treatment, the soil was tilled using a rotary tiller with a depth of approximately 10–15 cm. The rotary tillage was performed twice prior to rice seedling transplantation. Under the rotary treatments, all rice straws were fully mixed into the soil by tilling, but under the no-tillage treatment, the rice straws covered the soil surface, functioning as mulch. Under both rotary tillage and no-tillage treatments, biochar was applied at 450 kg ha−1, with 50% utilized as a basal fertilizer and the remaining 50% utilized during the panicle initiation stage [28]. The main rice season spanned from 24 March to 13 August, with rice harvest occurring around 13 August, leaving a 30 cm stubble for the subsequent ratoon rice growth from 13 August until 1 November. The ratoon rice was harvested around 1 November. Under no-tillage treatment, the soil was kept as it was from harvest to subsequent seeding. The compound fertilizers (N:P2O5:K2O = 22%:9%:15%) were applied twice, with 300 kg ha−1 applied at the basal stage and 100 kg ha−1 applied at the panicle initiation stage (a total application amount of 400 kg ha−1). The rice cultivation followed standard crop management practices. To ensure that biomass and production are not lost, we have adopted consistent plant protection measures, including the use of effective chemical pesticides to achieve strict pest control. Throughout the rice growth cycle, from the transplantation of the main-season rice to the maturity of the ratoon rice, daily data on air temperature and precipitation were consistently acquired from the meteorological observatory located in close proximity to the experimental field (Figure 1). The daily temperature and precipitation variations between the two years were negligible.

2.2. Measurement of Grain Yield, Yield Components

During the maturity stage, a total of 16 rice plants (from 8 hills) were randomly selected and sampled in a diagonal pattern from a harvest area of 5 m2 for the determination of harvest index (HI) and yield components. The panicle number per hill was counted to calculate the average panicle number per m2. Afterwards, the straw was separated from panicles for each plant, and then the panicles underwent manual threshing. Filled spikelets were separated from the unfilled ones by dipping them in tap water. For the analytical process, the 30 g filled spikelets and 3 g unfilled spikelets were randomly selected as subsamples, respectively, for an accurate spikelet counting. The spikelets per panicle was counted, and the grain-filling rate was calculated by the formula (100 × filled spikelet number/total spikelet number). From each plot, 1000 seeds were randomly, and the process was repeated for 3 times. The difference between repeated treatments should be less than 0.5 g, and the 1000-grain weight was measured. Furthermore, grain yield in a 5 m2 area of each plot was measured, and the grain water content was measured simultaneously and converted to a yield with a water content of 14%.

2.3. Measurement of Grain Quality

Matured cereals were harvested from 3 randomly selected areas within each plot, with each area covering 2 m2. The moisture in the harvested cereals was adjusted to a level of 14%. The assessment of grain quality was conducted after grain sun-drying and subsequent 3-month storage at room temperature. The evaluation of grain quality encompassed examining the rates of brown rice, fine rice, and head rice [5]. The determination of protein content and amylose content was carried out using a Danish near-infrared grain analyzer (INFRATEC-1241, FOSS Corporation, Nanterre, France). Meanwhile, the chalkiness degree and chalkiness rate of the rice grains were assessed using a rice appearance quality analyzer (SC-E, Hangzhou Wanshen Corporation, Hangzhou, China).

2.4. Measurement of Antioxidant Activities

The fresh flag leaf samples were initially ground in liquid nitrogen to obtain a homogenate. Subsequently, 9 mL of 50 mM sodium phosphate buffer (pH 7.8) was added to the homogenate. The resulting mixture was centrifuged at 8000 rpm for 15 min at 4 °C, and the supernatant was collected for the determination of superoxide dismutase (SOD), peroxidase (POD), and catalase (CAT) activities, and malondialdehyde (MDA) content [16]. The unit of SOD activity was defined as the amount of enzyme required to reduce the initial rate of the nitro blue tetrazolium reaction by half at 560 nm. To determine POD activity, a reaction mixture was prepared that consisted of 1 mL sodium phosphate buffer (pH 7.8), 0.95 mL of 0.2% guaiacol solution, 1 mL of 0.3% H2O2 solution, and 0.05 mL of enzyme extract. The absorbance of this mixture was measured at 470 nm every 30 s for a duration of 90 s. The unit of POD activity is defined as the amount of enzyme required to catalyze the decomposition of 1 mg of substrate, indicated by the change in absorbance at 470 nm. For the determination of CAT activity, the mixture was composed of 1 mL of distilled water, 1 mL of 0.3% H2O2 solution, and 0.05 mL of enzyme extract, with absorbance recorded at 470 nm every 30 s for 90 s. The unit of CAT activity is defined as the amount of enzyme required to decompose 1 M H2O2 in 1 min, with 1 g of fresh leaf used as the sample. Additionally, MDA content was measured using 1.5 mL of enzyme extract. The enzyme extract was mixed with 0.5 mL of 5% trichloroacetic acid solution and heated in a water bath at 100 °C for 30 min. After cooling, the mixture was centrifuged at 3000 rpm for 15 min, and the absorbance of the resulting solution was measured at 450 nm, 532 nm, and 600 nm. Finally, the MDA content was calculated using the following formula: MDA content = 6.45(OD532 − OD600) − 0.599OD450.

2.5. Statistical Analysis

Data were analyzed using a three-way analysis of variance, conducted with R 4.3.1 software (provided by Analytical Software, Tallahassee, FL, USA). The means of the various treatment groups were compared using the least significant difference (LSD) test, with a p-value < 0.05 considered statistically significant.

3. Results

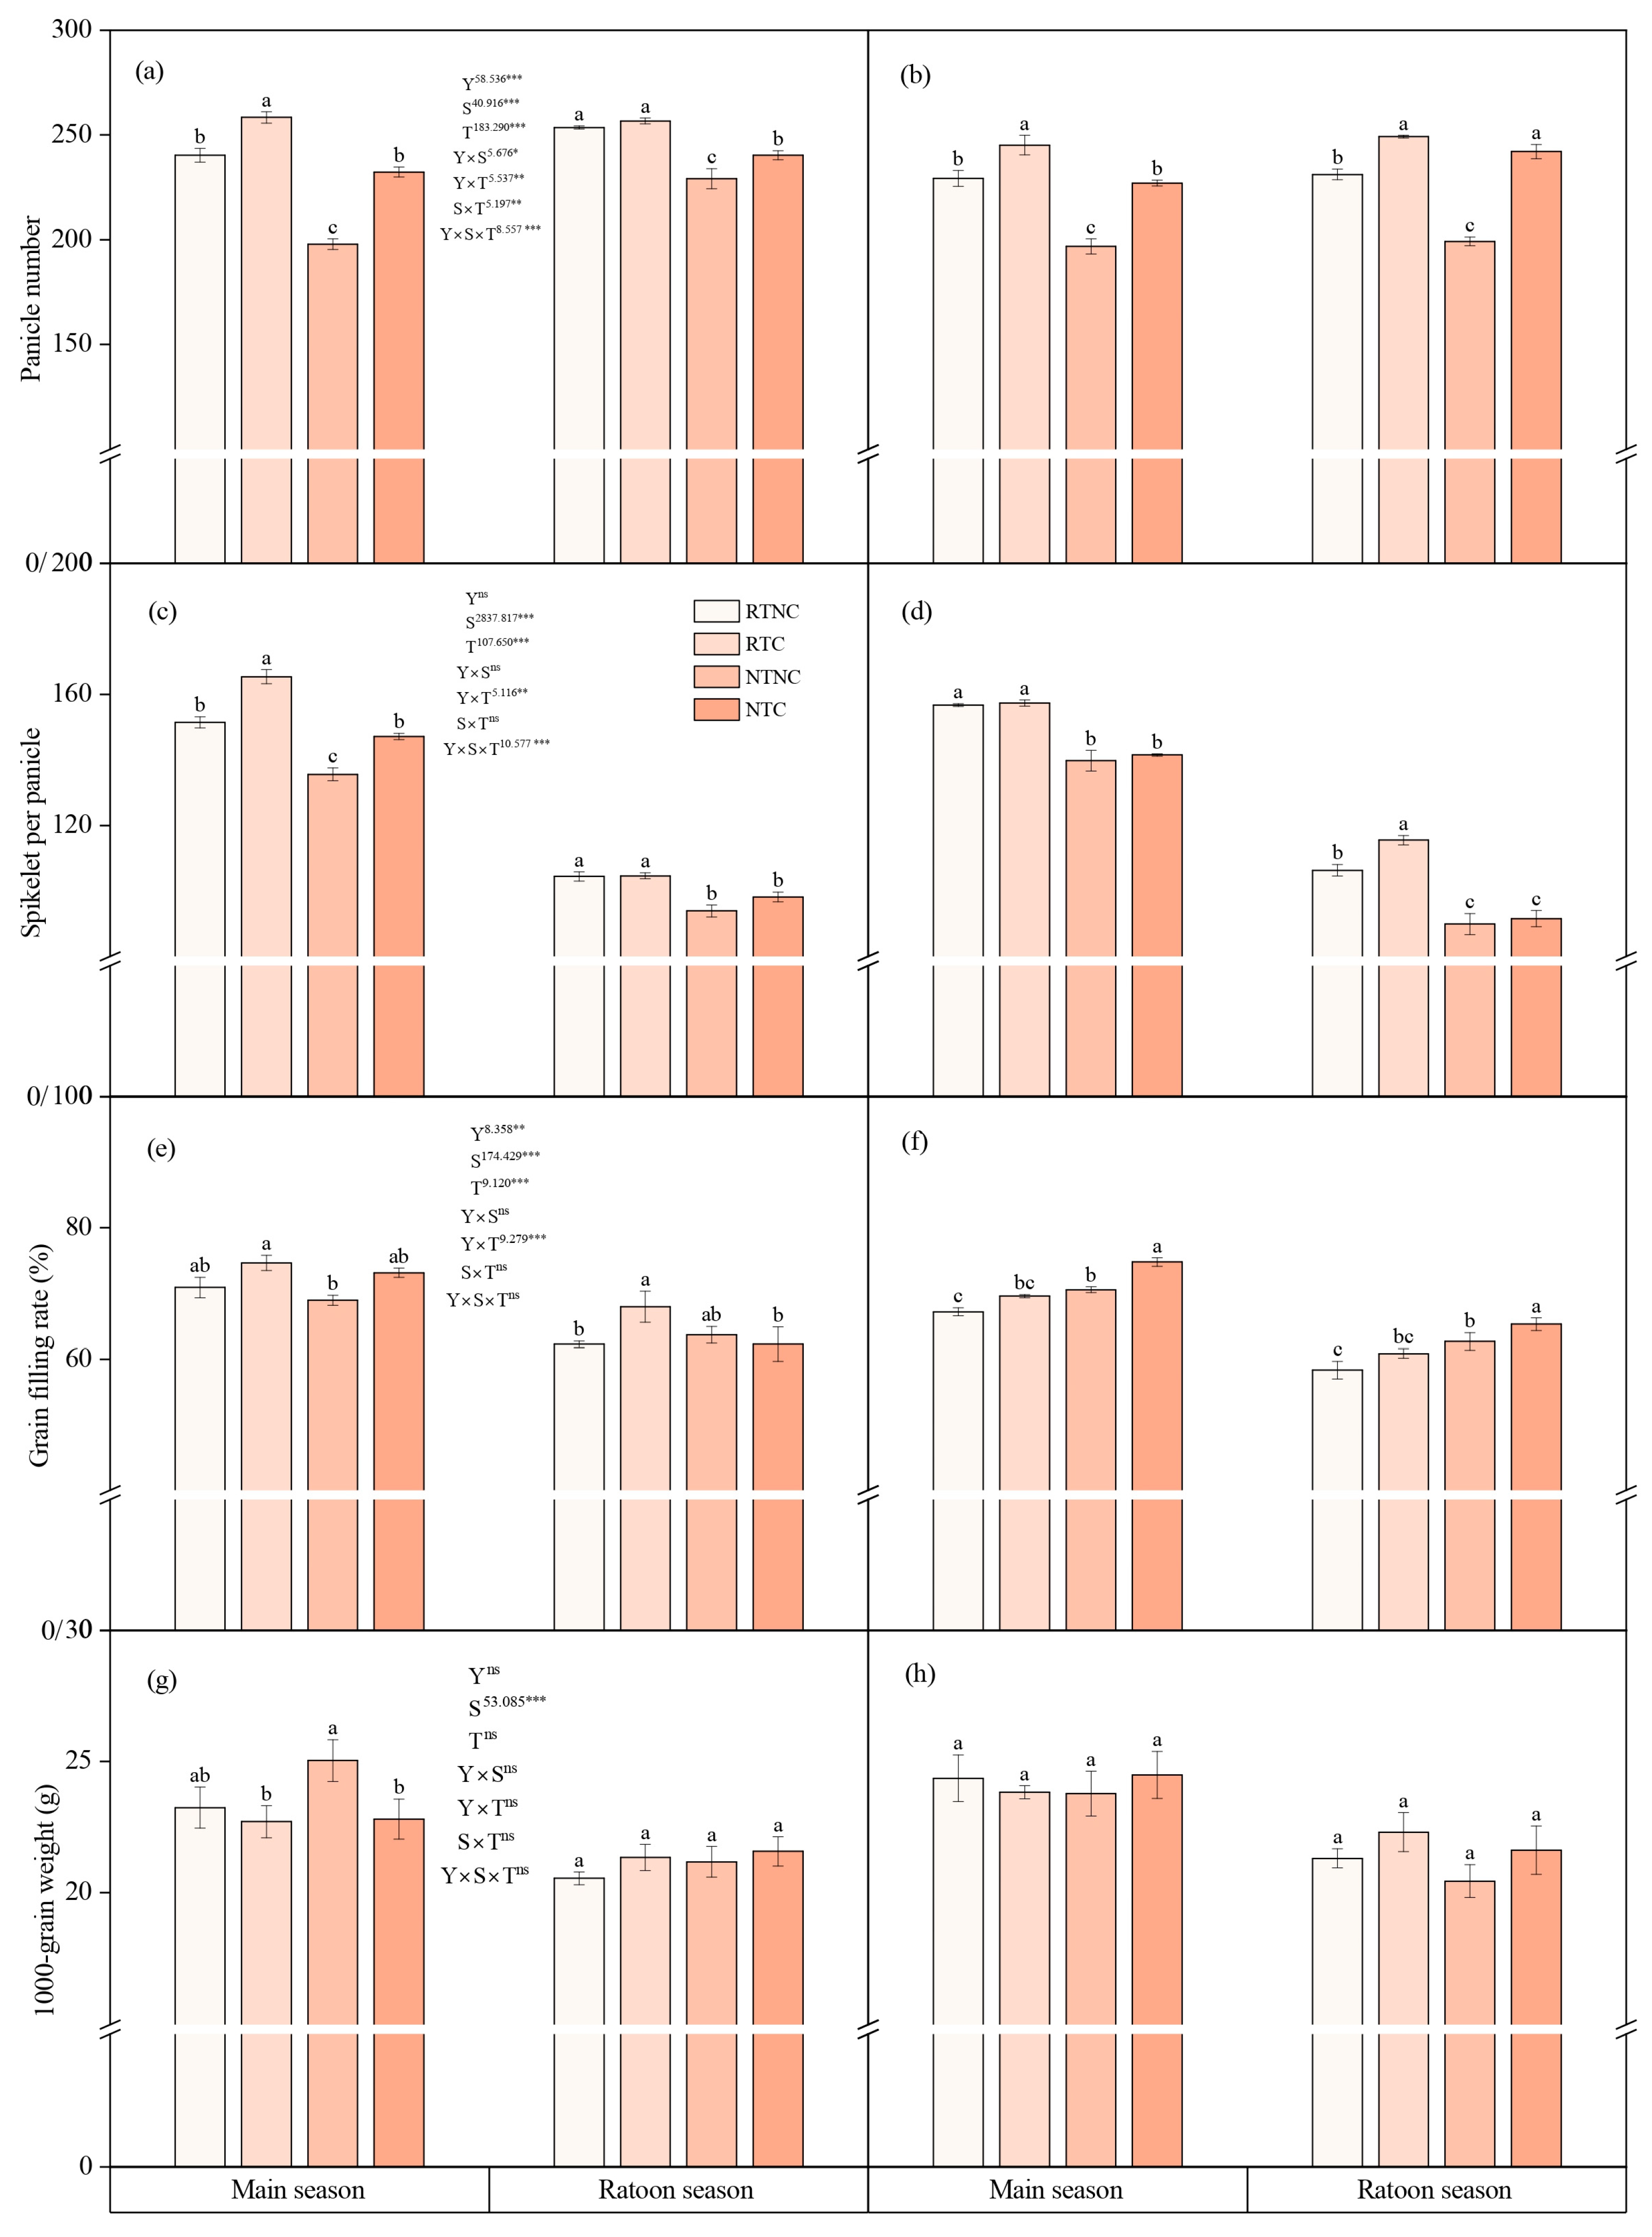
3.1. Yield and Yield Components

In both 2020 and 2021, grain yield under rotary tillage was significantly (p < 0.05) higher than that under no-tillage (Figure 2), which was 24.0% higher under RTNC than under NTNC. Notably, the introduction of biochar significantly bolstered grain yield under both tillage regimes, yielding 17.3% and 26.8% increases under RTC and NTC treatments, respectively. In addition, the impact of biochar on the yield of main-season rice and ratoon-season rice was significant, and the biochar application resulted in a 7.5% increase in yield for main-season rice, while a 43.9% increase for ratoon rice.
The number of panicles, spikelets per panicle, and grain filling rate were all significantly influenced by various tillage methods and the biochar application (Figure 3). Panicle number and spikelet number per panicle under RTNC were 11.3% and 13.3% higher than those under NTNC, respectively. With the application of biochar, panicle number, spikelet number per panicle, and grain filling rate were significantly improved under the RTC and NTC treatments. Compared with no biochar application, biochar application increased panicle number by 5.8% and 14.4%, spikelet number per panicle by 4.6% and 4.2%, and grain filling rate by 5.6% and 3.6% under RTC and NTC, respectively. No significant differences in 1000-grain weight were observed among different tillage methods and biochar application treatments.

3.2. Grain Quality

Brown rice rate, chalkiness degree, chalky grain rate, and protein content were significantly different (p < 0.01) under different tillage and biochar treatments (Table 1). Specifically, the brown rice rate was 1.8% higher under NTNC than under RTNC. The biochar application significantly increased brown rice rate by 1.0% and 1.5% and protein content by 16.5% and 13.5% under RTC and NTC treatments, respectively. In addition, the chalkiness degree and chalky grain rate under NTNC treatment were 17.9% and 10.1% higher than those under RTNC treatment. Notably, the biochar application reduced chalkiness degree by 18.3% and 28.7% and chalky grain rate by 11.4% and 5.7% under RTC and NTC treatments, respectively. Overall, we observed no significant differences in brown rice rate and amylose content among different tillage and biochar application treatments.

3.3. MDA Content and Activities of SOD, CAT, and POD

NTNC significantly increased the activities of POD, CAT, and MDA content by 19.6%, 14.6%, and 23.1%, respectively, compared with RTNC (Figure 4). In addition, the application of biochar also markedly elevated the enzymatic activities of POD, CAT, and MDA content, particularly under NTC treatment. Specifically, the POD activity was increased by 10.3% and 10.7% under RTC and NTC treatments, respectively, relative to RTNC and NTNC; the CAT activity was increased by 2.6% and 5.6%, respectively; and the MDA content was increased by 10.3% and 12.6%, respectively, upon biochar application.

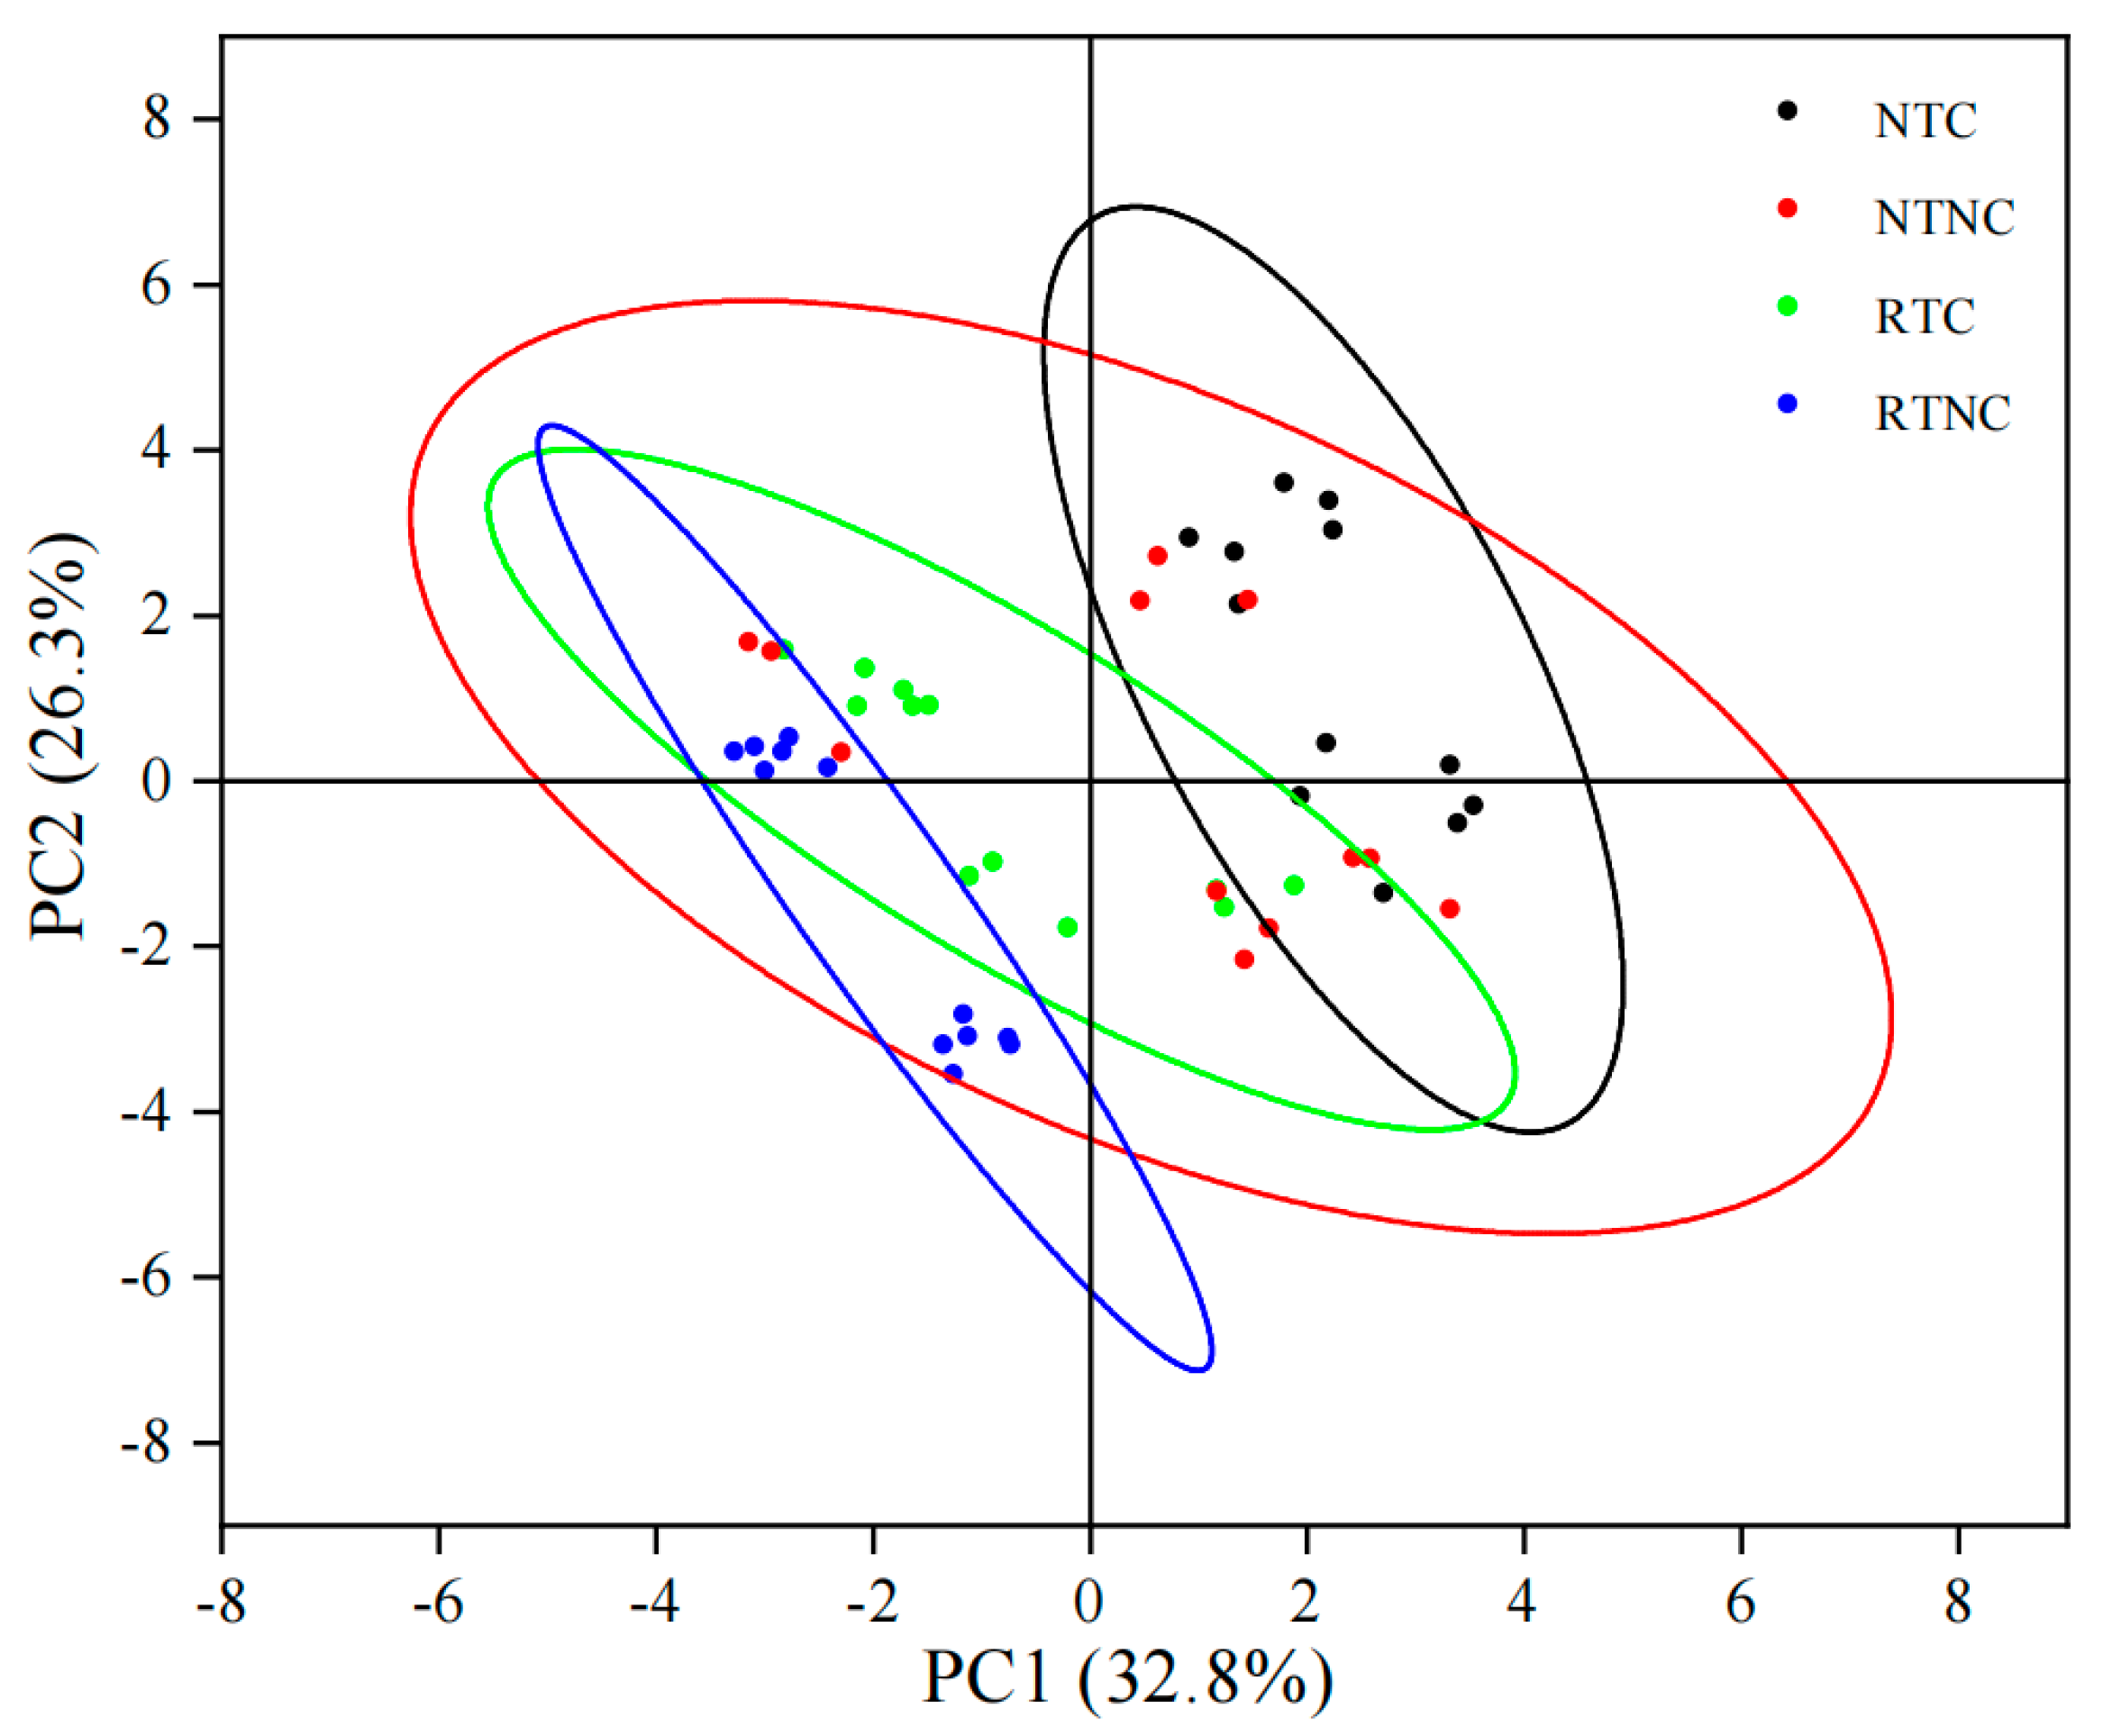
3.4. Principal Component Analysis

Principal component 1 was rice quality and antioxidant enzymes. Principal component 2 was yield and yield component (Figure 5 and Table 2). In principal components 1 and 2, there was no significant difference between NTNC and NTC, RTC, and RTNC, but significant difference between NTC, RTC, and RTNC. Compared with RTNC, the advantages of NTC and RTC mainly come from the increase of panicle number, spikelet per panicle and grain filling rate; in addition, yield differences were mainly positively correlated with spikelet per panicle, grain filling rate and 1000-grain weight, and negatively correlated with panicle number. The quality of rice was mainly positively correlated with the presentation of brown rice rate, milled rice rate, chalk grain rate, amylose content, and protein content, and negatively correlated with chalkiness degree.

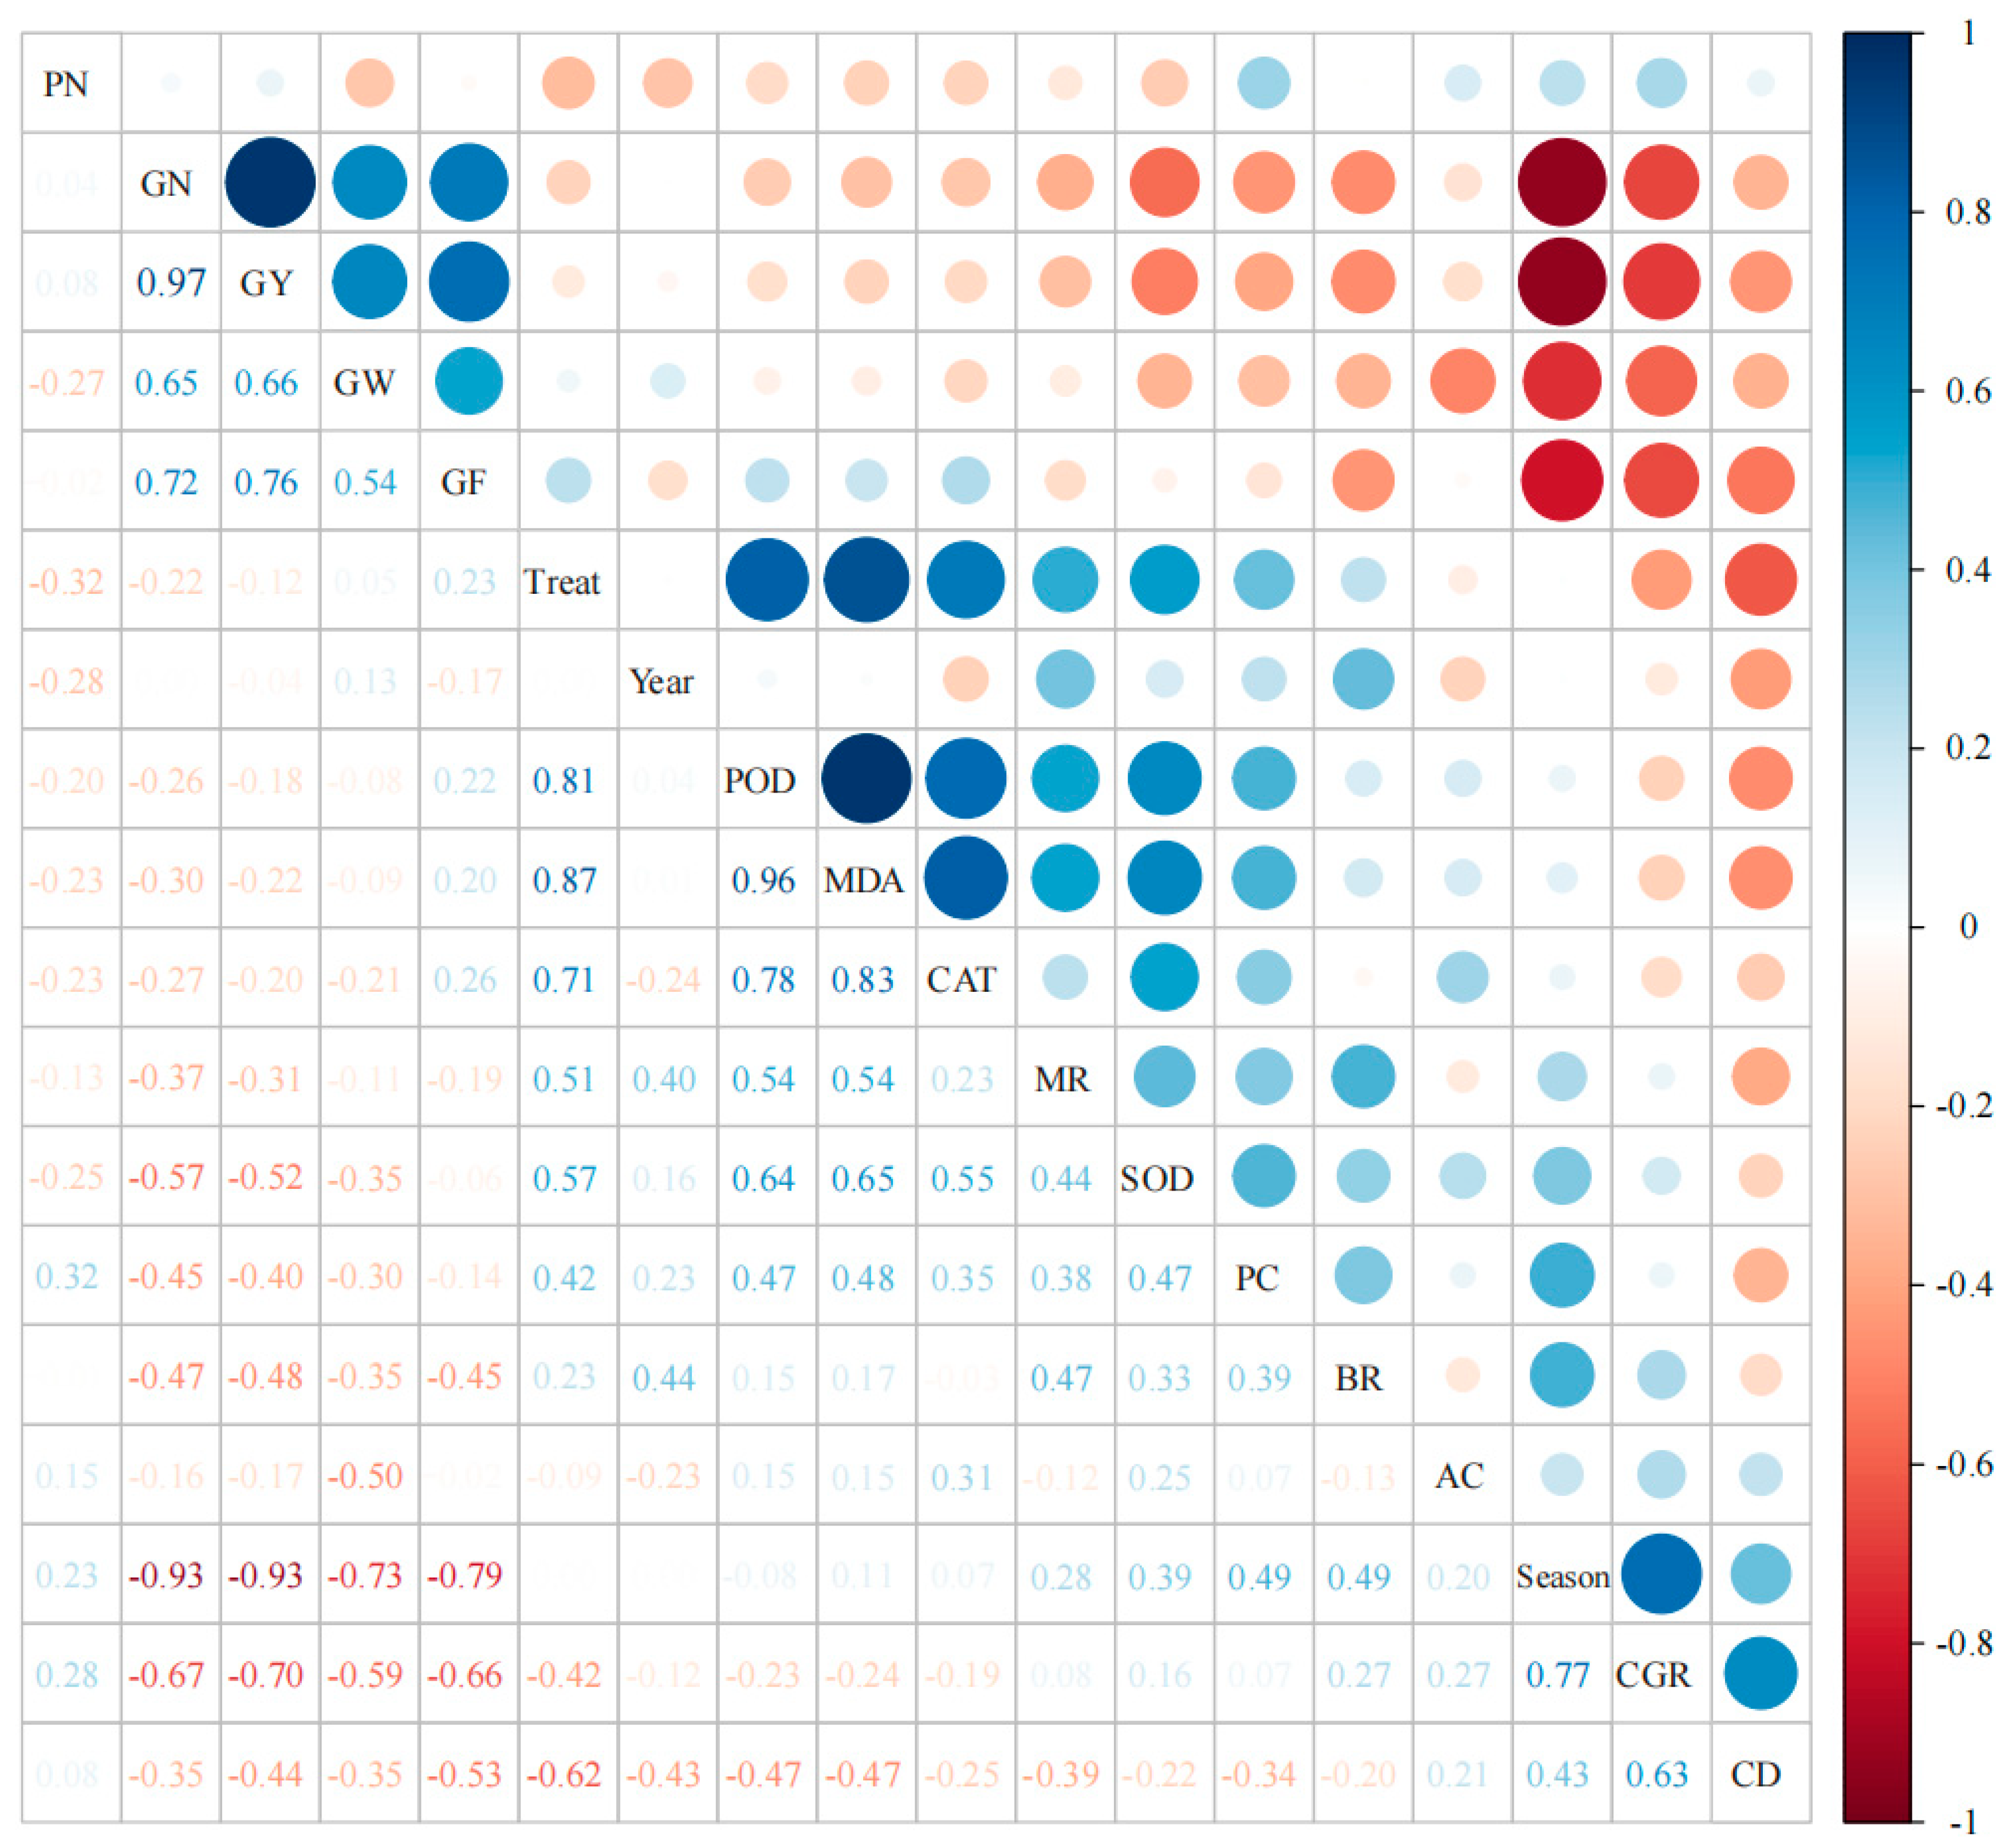
3.5. Correlation Analyses

Further, we investigated the correlation between grain yield components and rice growth parameters. As shown in Figure 6, each treatment was significantly (p < 0.01) positively correlated with POD, SOD, and CAT activity, MDA content, fine rice rate (MR), and protein content (PC), but these treatments were negatively correlated with chalky grain rate (CGR) and chalkiness degree (CD). In addition, there was a highly significant (p < 0.01) positive relationship between grain yield and spikelet number per panicle (GN), 1000-grain weight (GW), and grain filling rate (GF), but it was negatively correlated with SOD activity, brown rice rate (BR), chalky grain rate (CGR), and chalkiness degree (CD). Moreover, fine rice rate (MR) and protein content (PC) were significantly (p < 0.01) positively correlated with POD activity, MDA content, and SOD activity. However, CGR and CD were significantly negatively correlated with GN, GY, GW, and GF (Figure 6).

4. Discussion

4.1. Grian Yield and Yield Components

This study evaluated rice yield, grain quality, activities of various antioxidant enzymes, and malondialdehyde content under four treatments: rotary tillage alone, rotary tillage + biochar application, no-tillage alone, and no-tillage + biochar. We investigated the impact of various rice tillage methods and biochar application treatments on rice yield and yield components. Our results demonstrated the substantial influence of tillage methods on rice yield and related yield components. One previous study has indicated that both the straw biomass and grain yield of main-season rice and ratoon rice are significantly higher under rotary tillage conditions than under no-tillage conditions [29]. Over time, no-tillage can improve the physicochemical properties of the soil, including enhancing soil fertility in the upper layer and increasing compaction, compared to rotary tillage. These alterations further influence the infiltration rate of water, ultimately impacting the growth and yield of rice. Our results showed that the application of biochar effectively enhanced nutrient uptake and facilitated dry matter accumulation, ultimately resulting in a significant increase in rice yield.
Consistent with our results, one previous study has reported that the addition of biochar substantially improves soil structure, increases nitrogen use efficiency, and stimulates rice tillering, thus raising rice yield [30]. The biochar has been found to act as a nutrient source for rice, and its application can improve soil physicochemical properties and effectively promote dry matter accumulation in rice [31]. Moreover, the abundant negative charges on its surface contribute to cation exchange. Biochar exhibits a remarkable ability to effectively retain nutrient ions and water molecules, thus improving soil aeration and water-holding capacity [32]. Moreover, biochar can promote organic carbon transformation and active carbon adsorption due to its high carbon content, stable structure, and remarkable adsorption capacities. The utilization of biochar assists in the regulation of environmental factors such as soil, water, and air, thereby enhancing rice yield [33]. These previous findings on biochar are supported by our results showing that biochar application increased panicle number and spikelet number per panicle under both the rotary tillage and no-tillage, thus increasing rice yield. Our results are consistent with a previous report that biochar-induced increases in rice yield can be attributed to the fact that biochar significantly increased rice panicle number, filling rate, and spikelet number per panicle by promoting tillering, enhancing photosynthesis, optimizing nutrient utilization, and promoting spikelet differentiation, thereby increasing rice yield [34]. In another study, the application of biochar fertilizer in rice cultivation has been found to lead to an average rice yield increase of 25.28%, and this observed increase in rice yield is also primarily ascribed to notable improvements in panicle number, spikelet number per panicle, and grain filling rate [35,36]. In addition to the above-mentioned reasons, it has been reported that biochar-induced higher grain density might also be responsible for the increase in rice yield [37]. Taken together, the above findings collectively indicated that the application of biochar was an effective strategy to augment the panicle number, spikelet number per panicle, and grain filling rate, thereby increasing rice yield in rice cultivation, and these improvements can counteract the yield loss associated with no-tillage.

4.2. Grain Quality and Antioxidant Enzyme Activities

Previous research has established a clear correlation between the processing quality of rice and the brown rice rate or fine rice rate [38]. The appearance quality of rice is determined by two key factors, namely, the chalky grain rate and the chalkiness degree [39]. The texture properties of rice are closely related to the amylose content in its grains [40]. Ratoon rice exhibits significantly superior sensory properties, including taste and texture, in comparison with main-season rice. The research results indicate that the application of biochar significantly improved the head rice yield and protein content of both main-season rice and ratoon rice, while significantly reducing the chalky grain rate and chalkiness degree [41]. However, the utilization of biochar had no significant effect on the amylose content. Our data also showed that ratoon rice exhibited significantly lower chalkiness degree and chalky grain rate than main-season rice, but significantly higher fine rice rate and protein content, which was consistent with previous research [42]. Overall, these findings jointly reveal that ratoon rice boasts superior processing quality and improved appearance compared to the main-season rice [43]. In addition, it has been reported that the use of biochar can somewhat enhance the processing quality of rice [44]. As the dosage of biochar increases, the head rice yield significantly improves, and biochar effectively reduces both the chalkiness degree and the chalky grain rate of rice [45], which aligns with our results.
In this study, we observed a significant increase in the activities of POD and CAT, along with an elevated MDA content, under no-tillage conditions compared with rotary tillage. Existing studies have shown that no-tillage treatments impose certain stresses on plants. In response to these stresses, plants regulate their antioxidant defense system, activating antioxidant enzymes including SOD, CAT, and POD. These enzymes play a crucial role in catalyzing the conversion of reactive oxygen species (ROS) and free radicals within the plant, thereby mitigating potential damage [25,46], which explains well the elevated activities of these enzymes. MDA serves as a prominent indicator of membrane lipid peroxidation, and it is well known as a significant biomarker reflecting the plants’ stress response to adverse conditions [47]. The elevated content of MDA under our no-tillage treatment could partially be attributed to the influence of no-tillage on soil structure. This impact primarily includes a reduction in nutrient availability (such as phosphorus and potassium) in the soil layer below 5 cm [48]. These no-tillage-induced alterations collectively impose mild stress conditions. In this study, the integration of no-tillage with biochar application further elevated antioxidant enzyme activity and MDA content, compared to the no-tillage alone, highlighting the role of biochar in increasing antioxidant enzyme activity and MDA content. Our results could be explained by some previous reports that the application of biochar can enhance the concentrations of gibberellins and auxins in rice plants, and that these crucial plant hormones can stimulate antioxidant enzyme activities [49,50]. Consequently, the utilization of biochar has the potential to relieve the yield losses caused by no-tillage. Furthermore, our data also showed that the application of biochar significantly decreased the chalkiness degree and chalky grain rate under both no-tillage and rotary tillage conditions, indicating that biochar application as an intervention measure could also effectively prevent the occurrence of chalkiness in rice grains.

5. Conclusions

This study investigated the role of biochar application as a compensatory strategy in mitigating the impact of no-tillage on rice yield and grain quality. The results indicated that the input of biochar significantly enhanced rice yield under no-tillage conditions, particularly for ratoon rice. The increase in yield of ratoon rice was mainly due to the simultaneous increase in panicle number, spikelet number per panicle, and grain filling rate. In addition, no-tillage + biochar application also effectively enhanced the antioxidant enzyme activity including POD, CAT, and SOD in rice plants, while the rice yield and protein content were significantly increased. Based on our findings, it can be concluded that the combination of no-tillage with biochar application can enhance stress resistance, overall yield, and rice quality. Our results provide strong support for the potential benefits of biochar application in the cultivation of main-season rice and ratoon rice. Future research is suggested to further determine the optimal dosage and types of biochar for enhancing the growth of rice plants.

Author Contributions

B.D. and W.Z. designed the experiments; B.D., Q.L. and X.D. analyzed the data; B.D. and W.Z. wrote the paper and revised the first draft; Q.L., Y.Y. and Y.W. were responsible for the execution of the experiments and the data collection; Y.Y. and Y.W. were responsible for the experimental records; X.Y. provided technical support; X.Y. and J.L. revised and improved the paper. All authors have read and agreed to the published version of the manuscript.

Funding

This word was supported by National Key Research and Development Program (2022YFD2301000), Chongqing Science and Technology Special Program—Smart Rice Field (KYLX20240500114).

Data Availability Statement

Upon reasonable request, the datasets utilized and analyzed in this study can be obtained from the corresponding author.

Conflicts of Interest

The authors declare no conflicts of interest.

References

  1. Van, H.P.; Chau, H.T.; Phi, N.T. In Vitro digestibility and in vivo glucose response of native and physically modified rice starches varying amylose contents. Food Chem. 2016, 191, 74–80. [Google Scholar]
  2. Lin, W.-x. Developmental status and problems of rice ratooning. J. Integr. Agric. 2019, 18, 246–247. [Google Scholar] [CrossRef]
  3. Lin, W.X.; Chen, H.F.; Zhang, Z.X.; Xu, Q.H.; Tu, N.M.; Fang, C.X.; Ren, W.J. Research and prospect on physio-ecological properties of ratoon rice yield formation its key cultivation technology. Chin. J. Eco-Agric. 2015, 23, 392–401, (In Chinese with English abstract). [Google Scholar]
  4. Deng, Q.J.; Cao, Z.G.; Li, C.F. Effects of different ratooning cultivation modes on greenhouse gas emissions and grain yields in paddy fields. J. Agro-Environ. Sci. 2019, 38, 1373–1380, (In Chinese with English abstract). [Google Scholar]
  5. Wu, Q.; Wang, Y.Z.; Chen, T.T.; Zheng, J.L.; Sun, Y.D.; Chi, D.C. Soil nitrogen regulation using clinoptilolite for grain filling and grain quality improvements in rice. Soil Tillage Res. 2020, 199, 104547. [Google Scholar] [CrossRef]
  6. Lemaire, G.; Franzluebbers, A.; de Faccio Carvalho, P.C.; Dedieu, B. Integrated crop–livestock systems: Strategies to achieve synergy between agricultural production and environmental quality. Agric. Ecosyst. Environ. 2014, 190, 4–8. [Google Scholar] [CrossRef]
  7. Liu, L.C.; Tong, H.N.; Xiao, Y.H.; Che, R.H.; Xu, F.; Hu, B.; Liang, C.Z.; Chu, J.F.; Li, J.Y.; Chu, C.C. Activation of Big Grain1 significantly improves grain size by regulating auxin transport in rice. Proc. Natl. Acad. Sci. USA 2015, 112, 11102–11107. [Google Scholar] [CrossRef] [PubMed]
  8. Xiao, J.; Liu, B.; Yao, Y.Y.; Guo, Z.F.; Jia, H.Y.; Kong, L.R.; Zhang, A.M.; Ma, W.J.; Ni, Z.F.; Xu, S.B. Wheat genomic study for genetic improvement of traits in China. Sci. China Life Sci. 2022, 65, 1718–1775. [Google Scholar] [CrossRef]
  9. Begum, M.K.; Hasan, K.M.; Hossain, S.M.A.; Hossain, M.A. Effect of culm cutting height and nitrogenous fertilizer on the yield of ratoon of late boro rice. Pak. J. Agron. 2002, 1, 136–138. [Google Scholar]
  10. Harrell, D.L.; Bond, J.A.; Blanche, S. Evaluation of main-crop stubble height on ratoon rice growth and development. Field Crops Res. 2009, 114, 396–403. [Google Scholar] [CrossRef]
  11. Clarke, P.J.; Lawes, M.J.; Midgley, J.J.; Lamont, B.B.; Ojeda, F.; Burrows, G.E.; Enright, N.J.; Knox, K.J.E. Resprouting as a key functional trait: How buds, protection and resources drive persistence after fire. New Phytol. 2013, 197, 19–35. [Google Scholar] [CrossRef]
  12. Xu, F.X.; Zhang, L.; Zhou, X.B.; Guo, X.Y.; Zhu, Y.C.; Liu, M.; Xiong, H.; Jiang, P. The ratoon rice system with high yield and high efficiency in China: Progress, trend of theory and technology. Field Crops Res. 2021, 272, 108282. [Google Scholar] [CrossRef]
  13. Kim, J.; Shon, J.; Lee, C.K.; Yang, W.; Yoon, Y.; Yang, W.H.; Kim, Y.G.; Lee, B.W. Relationship between grain filling duration and leaf senescence of temperate rice under high temperature. Field Crops Res. 2011, 122, 207–213. [Google Scholar] [CrossRef]
  14. Chen, Z.K.; Li, P.; Xiao, J.C.; Jiang, Y.; Cai, M.L.; Wang, J.P.; Li, C.F.; Zhan, M.; Cao, C.G. Dry cultivation with ratoon system impacts rice quality using rice flour physicochemical traits, fatty and amino acids contents. Food Res. Int. 2021, 150, 110764. [Google Scholar] [CrossRef] [PubMed]
  15. Zhang, L.; Tang, Q.Y.; Li, L.L.; Xu, H.Q.; Zheng, H.B.; Wang, J.L.; Hua, Y.J.; Ren, L.J.; Tang, J.W. Ratoon rice with direct seeding improves soil carbon sequestration in rice fields and increases grain quality. J. Environ. Manag. 2022, 317, 115374. [Google Scholar] [CrossRef] [PubMed]
  16. Wu, J.F.; Zeng, Y.H.; Zhao, X.F.; Fan, C.G.; Pan, X.H.; Shi, Q.H. Effects of tillage methods on yield of double cropping rice with machine-transplanted and soil physical-chemical properties. J. Hunan Agric. Univ. 2017, 43, 581–585. [Google Scholar]
  17. Xu, S.Q.; Zhang, M.Y.; Sun, G.F.; Shang, W.G.; Chen, F.; Zhang, H.L. Assessment of tillage effects on soil quality for double-rice paddy with tilth index. Sci. Agric. Sin. 2011, 44, 3999–4006. [Google Scholar]
  18. Quan, M.H.; Hu, A.S.; Ou, L.J.; Hu, D.Y.; Li, B.H. Effects of tillage mode on characteristics of photosynthesis and root growth of rice. Hybrid Rice 2012, 27, 71–75. [Google Scholar]
  19. Chen, D.G.; Zhou, X.Q.; Li, L.J.; Liu, C.G.; Zhang, X.; Chen, Y.D. Relationship between root morphological characteristics and yield components of major commercial Indica rice in South China. Acta Agron. Sin. 2013, 39, 1899–1908. [Google Scholar] [CrossRef]
  20. Yadav, K.; Jagadevan, S. Influence of process parameters on synthesis of biochar by pyrolysis of biomass: An alternative source of energy. In Recent Advances in Pyrolysis; IntechOpen: London, UK, 2019. [Google Scholar]
  21. Yang, Y.; Zuo, P.; Qu, S. Adjusting hydrophily and aromaticity strategy for pitch-based hierarchical porous carbon and its application in flexible supercapacitor. Fuel 2022, 311, 122514. [Google Scholar] [CrossRef]
  22. Kochanek, J.; Soo, R.M.; Martinez, C.; Dakuidreketi, A.; Mudge, A.M. Biochar for intensification of plant-related industries to meet productivity, sustainability and economic goals: A review. Resour. Conserv. Recycl. 2022, 179, 106109. [Google Scholar] [CrossRef]
  23. Oladele, S.O.; Adeyemo, A.J.; Awodun, M.A. Influence of rice husk biochar and inorganic fertilizer on soil nutrients availability and rain-fed rice yield in two contrasting soils. Geoderma 2019, 336, 1–11. [Google Scholar] [CrossRef]
  24. Zhang, H.; Yu, C.; Kong, X.S.; Hou, D.P.; Gu, J.F.; Liu, L.J.; Wang, Z.Q.; Yang, J.C. Progressive integrative crop managements increase grain yield, nitrogen use efficiency and irrigation water productivity in rice. Field Crops Res. 2018, 215, 1–11. [Google Scholar] [CrossRef]
  25. Mori, H.; Maruyama, F.; Kato, H.; Toyoda, A.; Dozono, A.; Ohtsubo, Y.; Nagata, Y.; Fujiyama, A.; Tsuda, M.; Kurokawa, K. Design and experimental application of a novel non-degenerate universal primer set that amplifies prokaryotic 16S rRNA genes with alow possibility to amplify eukaryotic rRNA genes. DNA Res. 2014, 21, 217–227. [Google Scholar] [CrossRef]
  26. Bolyen, E.; Rideout, J.R.; Dillon, M.R.; Bokulich, N.A.; Abnet, C.C.; Al-Ghalith, G.A.; Alexander, H.; Alm, E.J.; Arumugam, M.; Asnicar, F. Reproducible, interactive, scalable and extensible microbiome data science using QIIME 2. Nat. Biotechnol. 2019, 37, 852–857. [Google Scholar] [CrossRef]
  27. Kumari, R.; Kumar, S.; Kumar, R.; Das, A.; Kumari, R.; Choudhary, C.; Sharma, R. Effect of long-term integrated nutrient management on crop yield, nutrition and soil fertility under rice-wheat system. J. Appl. Nat. Sci. 2017, 9, 1801–1807. [Google Scholar] [CrossRef]
  28. Yang, C.; Dou, S.; Guo, D.; Zhao, H. The Application of Biochar Enhances Soil Organic Carbon and Rice Yields. Agronomy 2024, 14, 455. [Google Scholar] [CrossRef]
  29. Yang, D.; Wang, Y.N.; Wu, Q.X. Impact of Tillage and Straw Management on Soil Properties and Rice Yield in a Rice-Ratoon Rice System. Agronomy 2023, 13, 1762. [Google Scholar] [CrossRef]
  30. Cao, X.C.; Yuan, L.; Liu, X.X.; Zhu, L.F.; Zhu, C.Q.; Kong, Y.L.; Wu, L.L.; Tian, C.; Lu, R.H.; Zhang, J.H. Benefits of controlled-release/stable fertilizers plus biochar for rice grain yield and nitrogen utilization under alternating wet and dry irrigation. Eur. J. Agron. 2021, 129, 126338. [Google Scholar] [CrossRef]
  31. Liu, B.T.; Li, H.L.; Li, H.B.; Zhang, A.P.; Rengel, Z. Long-term biochar application promotes rice productivity by regulating root dynamic development and reducing nitrogen leaching. GCB Bioenergy 2021, 13, 257–268. [Google Scholar] [CrossRef]
  32. Sashidhar, P.; Kochar, M.; Singh, B.; Gupta, M.; Cahill, D.; Adholeya, A.; Dubey, M. Biochar for delivery of agri-inputs: Current status and future perspectives. Sci. Total Environ. 2020, 703, 134892. [Google Scholar] [CrossRef] [PubMed]
  33. Tilman, D.; Cassman, K.G.; Matson, P.A.; Naylor, R.; Polasky, S. Agricultural sustainability and intensive production practices. Nature 2002, 418, 671–677. [Google Scholar] [CrossRef] [PubMed]
  34. Liu, Y.; Li, H.; Hu, T.; Mahmoud, A.; Li, J.; Zhu, R.; Jiao, X.; Jing, P. A quantitative review of the effects of biochar application on rice yield and nitrogen use efficiency in paddy fields: A meta-analysis. Sci. Total Environ. 2022, 830, 154792. [Google Scholar] [CrossRef] [PubMed]
  35. Liu, Y.; Li, J.; Jiao, X.Y.; Li, H.D.; Hu, T.S.; Jiang, H.Z.; Mahmoud, A. Effects of biochar on water quality and rice productivity under straw returning condition in a rice-wheat rotation region. Sci. Total Environ. 2022, 819, 152063. [Google Scholar] [CrossRef] [PubMed]
  36. Wang, L.; Deng, F.; Ren, W.J. Shading tolerance in rice is related to better light harvesting and use efficiency and grain filling rate during grain filling period. Field Crops Res. 2015, 180, 54–62. [Google Scholar] [CrossRef]
  37. Si, L.L.; Xie, Y.N.; Ma, Q.X.; Wu, L.H. The short-term effects of rice straw biochar, nitrogen and phosphorus fertilizer on rice yield and soil properties in a cold waterlogged paddy field. Sustainability 2018, 10, 537. [Google Scholar] [CrossRef]
  38. Roy, P.; Ijiri, T.; Okadome, H.; Nei, D.; Orikasa, T.; Nakamura, N.; Shiina, T. Effect of processing conditions on overall energy consumption and quality of rice (Oryza sativa L.). J. Food Eng. 2008, 89, 343–348. [Google Scholar] [CrossRef]
  39. Deng, F.; Li, Q.P.; Chen, H.; Zeng, Y.L.; Li, B.; Zhong, X.Y.; Wang, L.; Ren, W.J. Relationship between chalkiness and the structural and thermal properties of rice starch after shading during grain-filling stage. Carbohydr. Polym. 2021, 252, 117212. [Google Scholar] [CrossRef] [PubMed]
  40. Peng, Y.; Mao, B.G.; Zhang, C.Q.; Shao, Y.; Wu, T.H.; Hu, L.M.; Hu, Y.Y.; Tang, L.; Li, Y.K.; Tang, W.B. Influence of physicochemical properties and starch fine structure on the eating quality of hybrid rice with similar apparent amylose content. Food Chem. 2021, 353, 129461. [Google Scholar] [CrossRef] [PubMed]
  41. Ruan, S.Y.; Luo, H.W.; Wu, F.D.; He, L.X.; Lai, R.F.; Tang, X.R. Organic cultivation induced regulation in yield formation, grain quality attributes, and volatile organic compounds of fragrant rice. Food Chem. 2023, 405, 134845. [Google Scholar] [CrossRef]
  42. Lin, F.F.; Rensing, C.; Pang, Z.Q.; Zou, J.N.; Lin, S.; Letuma, P.L.; Zhang, Z.X.; Lin, W.X. Metabolomic analysis reveals differential metabolites and pathways involved in grain chalkiness improvement under rice ratooning. Field Crops Res. 2022, 283, 108521. [Google Scholar] [CrossRef]
  43. Huang, J.W.; Pan, Y.P.; Chen, H.F.; Zhang, Z.X.; Fang, C.X.; Shao, C.H.; Amjad, H.; Lin, W.W.; Lin, W.X. Physiochemical mechanisms involved in the improvement of grain-filling, rice quality mediated by related enzyme activities in the ratoon cultivation system. Field Crops Res. 2020, 258, 107962. [Google Scholar] [CrossRef]
  44. Kizito, S.; Wu, S.B.; Kirui, W.K.; Lei, M.; Lu, Q.M.; Bah, H.; Dong, R.J. Evaluation of slow pyrolyzed wood and rice husks biochar for adsorption of ammonium nitrogen from piggery manure anaerobic digestate slurry. Sci. Total Environ. 2015, 505, 102–112. [Google Scholar] [CrossRef] [PubMed]
  45. Deng, F.; Zhang, C.; He, L.H.; Liao, S.; Li, Q.P.; Li, B.; Zhu, S.L.; Gao, Y.T.; Tao, Y.F.; Zhou, W. Delayed sowing date improves the quality of mechanically transplanted rice by optimizing temperature conditions during growth season. Field Crops Res. 2022, 281, 108493. [Google Scholar] [CrossRef]
  46. Gill, S.S.; Tuteja, N. Reactive oxygen species and antioxidant machinery in abiotic stress tolerance in crop plants. Plant Physiol. Biochem. 2010, 48, 909–930. [Google Scholar] [CrossRef] [PubMed]
  47. Deng, S.C.; Wu, Y.Z.; Yi, W.T.; Gu, Q.C.; Tang, X.R. Integrative Effect of Reduced Tillage and Shading Enhanced Yield and Grain Quality of Fragrant Rice. Agronomy 2023, 13, 2010. [Google Scholar] [CrossRef]
  48. Luo, Z.Z.; Gan, Y.T.; Niu, Y.N.; Zhang, R.Z.; Li, L.L.; Cai, L.Q.; Xie, J.H. Soil quality indicators and crop yield under long-term tillage systems. Exp. Agric. 2017, 53, 497–511. [Google Scholar] [CrossRef]
  49. French, E.; Iyer-Pascuzzi, A.S. A role for the gibberellin pathway in biochar-mediated growth promotion. Sci. Rep. 2018, 8, 5389. [Google Scholar] [CrossRef] [PubMed]
  50. Sharma, P.; Kumar, A.; Bhardwaj, R. Plant steroidal hormone epibrassinolide regulate–Heavy metal stress tolerance in Oryza sativa L. by modulating antioxidant defense expression. Environ. Exp. Bot. 2016, 122, 1–9. [Google Scholar] [CrossRef]
Figure 1. Daily temperature and precipitation in Jingzhou (study area) in 2020 (a) and 2021 (b).
Agriculture 14 01407 g001
Figure 2. Grain yield under four different tillage methods and biochar treatments in 2020 (a) and 2021 (b). Vertical bars indicate standard errors (n = 3). RTNC, rotary tillage with no biochar; RTC, rotary tillage + biochar; NTNC, no−tillage with no biochar; and NTC, no−tillage + biochar. In each column, means followed by the same letters are not significantly different according to LSD. Lowercase letters indicate significant differences at p < 0.05, ***, p < 0.001 and ns, not significant.
Agriculture 14 01407 g002
Figure 3. Yield components of main-season rice and ratoon-season rice under four different tillage methods and biochar treatments in 2020 (a,c,e,g) and 2021 (b,d,f,h). Vertical bars indicate standard errors (n = 3). RTNC, rotary tillage with no biochar; RTC, rotary tillage + biochar; NTNC, no-tillage with no biochar; and NTC, no-tillage + biochar. In each column, means followed by the same letters are not significantly different according to LSD. Lowercase letters indicate significant differences at p < 0.05, and *, p < 0.05; **, p < 0.01; ***, p < 0.001; and ns, not significant.
Agriculture 14 01407 g003
Figure 4. Activities of superoxide dismutase (SOD), peroxidase (POD), catalase (CAT), and malondialdehyde (MDA) content in rice leaves under different tillage methods and biochar treatments in 2020 (a,c,e,g) and 2021 (b,d,f,h). Different lowercase letters above the bars denote statistically significant differences among treatments at the level of p < 0.05 (n = 3). In each column, means followed by the same letters are not significantly different according to LSD. Lowercase letters indicate significant differences at p < 0.05, *, p < 0.05; **, p < 0.01; ***, p < 0.001; and ns, not significant.
Agriculture 14 01407 g004
Figure 5. The effects of different tillage methods and biochar treatments on rice yield, quality, and antioxidant activity were investigated by principal component analysis.
Agriculture 14 01407 g005
Figure 6. Correlation matrices between grain yield components and rice growth parameters. The dataset consisted of 72 samples. The size of the circle indicates the degree of correlation. The related parameters include grain yield (GY), panicle number (PN), spikelet number per panicle (GN), grain filling rate (GF), 1000−grain weight (GW), fine rice rate (MR), brown rice rate (BR), chalkiness degree (CD), chalky grain rate (CGR), amylose content (AC), and protein content (PC) (n = 48), the size of the circle indicates the degree of correlation.
Agriculture 14 01407 g006
Table 1. Effects of different tillage methods and biochar treatments on grain quality in 2020 and 2021 (n = 3).
YearSeasonTreatmentBrown Rice RateMilled Rice RateChalkiness DegreeChalk Grain RateAmylose ContentProtein Content
(%)(%)(%)(%)(%)(%)
2020Main seasonRTNC71.33 a63.79 b5.84 a20.83 a18.69 a8.00 bc
RTC73.63 a65.02 b5.22 b20.27 ab18.76 a9.24 a
NTNC73.03 a66.13 ab5.26 b19.58 b16.55 a7.58 c
NTC76.66 a70.53 a4.61 c16.60 c18.56 a8.65 ab
Mean73.66 C66.37 B5.23 A19.32 A18.14 B8.37 B
Ratoon seasonRTNC76.07 ab68.28 c4.91 a16.31 a18.63 a8.70 b
RTC73.68 b68.79 bc4.04 b14.39 ab20.49 a10.08 a
NTNC79.40 a70.72 b4.72 a14.59 ab17.97 a8.55 b
NTC76.53 ab72.99 a3.14 c14.04 b17.95 a9.68 a
Mean76.41 B70.19 A4.20 B14.83 B18.76 A9.25 A
2021Main seasonRTNC74.00 b70.28 ab5.27 a20.39 a17.86 a7.42 c
RTC78.11 a70.99 ab4.28 b16.34 c16.86 a8.64 b
NTNC75.44 ab69.24 b4.18 b18.49 b18.28 a8.70 b
NTC76.66 ab73.49 a3.09 c17.35 bc17.00 a10.23 a
Mean76.05 B71.00 A4.20 B18.14 A17.50 B8.74 B
Ratoon seasonRTNC80.75 a69.30 a4.57 a17.07 a17.66 a8.73 c
RTC79.86 a69.16 a3.28 b15.11 b17.06 a10.30 a
NTNC79.02 a71.62 a4.37 a13.11 c19.52 a9.51 b
NTC81.56 a73.09 a2.36 c14.02 bc18.04 a10.42 a
Mean80.30 A70.79 A3.64 C14.83 B18.07 B9.74 A
ANOVA Year (Y)17.6 ***16.8 ***289.5 ***5.9 *ns18.8 ***
Season (S)22 ***8.1 **289.1 ***256.9 ***ns88.8 ***
Treatment (T)ns10.4 ***280.4 ***30 ***ns55.6 ***
Y × Sns10 **25.1 ***5.8 *nsns
Y × Tnsns9.6 ***4.2 *5.5 **14.8 ***
S × Tnsns21.8 ***3.8 *nsns
Y × S × Tnsnsns6.4 **ns3.6 *
RTNC, rotary tillage with no biochar; RTC, rotary tillage + biochar; NTNC, no-tillage with no biochar; and NTC, no-tillage + biochar. In each column, means followed by the same letters are not significantly different according to LSD. Lowercase letters indicate significant differences at p < 0.05, and uppercase letters denote significant differences at p < 0.01 *, p < 0.05; **, p < 0.01; ***, p < 0.001; and ns, not significant.
Table 2. PCA loading table of rice yield, quality, and antioxidant activity by different tillage practices and biochar treatments.
LoadingsPC1PC2PC3
Panicle number−0.06101−0.155760.07535
Spikelet per panicle−0.299410.351130.05058
Grain filling rate−0.070080.43910.21072
1000-grain weight−0.202960.36358−0.21581
Brown rice rate0.21939−0.17473−0.46284
Milled rice rate0.308080.02451−0.36398
Chalkiness degree−0.15315−0.380560.25936
Chalk grain rate0.05584−0.462370.04858
Amylose content0.11225−0.126320.57625
Protein content0.31542−0.03356−0.11718
SOD0.38651−0.010620.06277
POD0.392450.215770.09373
CAT0.335710.171480.34234
MDA0.403370.211050.09347
Disclaimer/Publisher’s Note: The statements, opinions and data contained in all publications are solely those of the individual author(s) and contributor(s) and not of MDPI and/or the editor(s). MDPI and/or the editor(s) disclaim responsibility for any injury to people or property resulting from any ideas, methods, instructions or products referred to in the content.

