Article

Wind Vortex Target Control of a Plant Protection UAV Based on a Rice Wind Vortex–Flight Parameter Model

1
College of Engineering, South China Agricultural University, Guangzhou 510642, China
2
College of Mathematics and Informatics, South China Agricultural University, Guangzhou 510642, China
3
School of Software Engineering, South China University of Technology, Guangzhou 510006, China
*
Author to whom correspondence should be addressed.
Agriculture 2024, 14(8), 1413; https://doi.org/10.3390/agriculture14081413 (registering DOI)
Submission received: 7 June 2024 / Revised: 6 August 2024 / Accepted: 12 August 2024 / Published: 21 August 2024
(This article belongs to the Special Issue Application of UAVs in Precision Agriculture—2nd Edition)

Abstract

:
The strong airflow beneath a rotary drone generates a wind vortex within the rice canopy; precise control of the wind vortex distance and wind vortex area can improve pesticide utilization efficiency. This paper calculates the flight parameter curve based on the wind vortex target from the wind vortex target parameter control model of the four-rotor plant protection drone, designs a flight control system using a Cube Orange flight controller and a Jetson AGX Xavier onboard computer, and implements flight parameter control using both PID control and fuzzy control algorithms. Experimental results indicate that when using PID control and fuzzy control, the average deviation values of UAV flight altitude and speed are 0.08 m, 0.08 m/s, 0.06 m, and 0.08 m/s, respectively. When using PID control, the average distance and area errors of the target downwind and upwind are 0.17 m and 0.37 m2 and 0.20 m and 0.46 m2, respectively. The corresponding values for fuzzy control are 0.12 m, 0.38 m2, 0.09 m, and 0.31 m2. In the twelve voyage experiments, the target parameter variance using fuzzy control was relatively smaller for eight voyages compared to PID control, which had a smaller variance for four voyages. On the whole, the effect of fuzzy control is superior. The wind vortex control method proposed in this paper can effectively enable precise pesticide spraying by drones. This has significant implications for reducing agricultural production costs and safeguarding the natural environment.

1. Introduction

Pest and disease control are of paramount importance in rice production. A primary method of controlling pests and diseases involves the application of pesticides at various stages of rice growth. Multi-rotor plant protection drones, employed in spraying operations, demonstrate high efficiency, rapid operation speed, and effective prevention and control responses to sudden and explosive outbreaks of diseases and pests [1,2,3]. During a multi-rotor drone’s flight, a strong downwash airflow is generated beneath the rotor, which is a unique feature of plant protection drones compared to ground machinery. This characteristic significantly enhances the deposition and penetration of pesticide droplets on the rice canopy [4,5,6,7]. The downwash airflow will “stir” the flexible crops, causing them to deform to varying degrees. The deformed crop canopy forms a wind vortex, the range of which represents the action range of the rotor airflow when it reaches the rice canopy. Indirectly, this represents the deposition area of pesticide droplets in the airflow over the rice [8,9]. The mechanical characteristics of the rice plant, in conjunction with the force exerted by the wind, collectively determine the state of the wind vortex. When the mechanical characteristics of the rice remain relatively stable, factors such as rotor airflow primarily influence wind vortex parameters. The flight parameters of a UAV, including altitude and speed, can modify the rotor airflow pattern. This, in turn, affects wind vortex parameters and ultimately influences the deposition area of pesticide droplets [10,11].
In recent years, numerous scholars have conducted comprehensive research on the motion law of rotor downwash airflow, the deposition laws of droplets under airflow influence, and the impact of wind vortices on droplet penetration [12,13,14,15,16,17]. Yang et al. studied the influence of the downwash airflow of UAVs on the spray amplitude through fluid simulation and actual testing. The results showed that the velocity difference in the downwash airflow from the center to the outside can increase the spray amplitude, which is proportional to the flight height of the UAV, providing a reference basis for the design of the UAV spray system and the selection of aviation plant protection operation parameters [18]. Martin et al. conducted a study on the effective spray range of UAVs at different altitudes and speeds, and the results showed that flight speed had no effect on the spray range of MG-1 drones, and the maximum spray range was observed at altitudes of 2 m and 3 m [19]. Richardson et al. investigated the factors influencing the droplet deposition effect and found that the distribution of droplet deposition was affected by wind speed, nozzle position, spraying height, and droplet size. Accurate spraying by drones has not yet been achieved [20]. Tian et al. investigated the impact of plant protection drone downwash airflow on crop canopies, establishing a linear relationship between wind vortex lag distance and flight speed at a flight altitude of 2 m. They observed that a specific flight speed can effectively enhance the penetration of droplets; however, excessively high speeds may induce wind vortex instability, exacerbating pesticide drift and hindering effective pesticide droplet deposition. This research demonstrates that drone flight parameters markedly influence wind vortex parameters, subsequently impacting the dispersion of pesticides [21]. To obtain the corresponding relationship between wind vortices and flight parameters and control the effect of pesticide spraying, our team members carried out unmanned aerial vehicle (UAV) flight experiments in the field. Wind vortices were generated in the rice canopy by downwash airflow, and the parameters of wind vortices were obtained by identifying wind-vortex images using the inter-frame difference method. The wind vortex parameter control model was established, which can calculate the altitude and speed of the UAV when applying pesticide according to the target wind-vortex parameter [22]. Although these studies have analyzed the relationship between flight parameters and wind vortices, they have not controlled the flight parameters of drones to change the wind vortex parameters.
This paper analyzes the wind vortex characteristic-flight parameter control model of a multi-rotor UAV in rice spraying operations based on the previous work and constructs a high-performance and programmable flight control platform. Based on the wind vortex-flight parameter model, flight parameters are adjusted through control algorithms to fine-tune the wind vortex parameters, including wind vortex distance and wind vortex area, to precisely control the wind vortex. This work lays the groundwork for accurately spraying pesticides on rice using drones.

2. Materials and Methods

2.1. Rice Wind Vortex-Flight Parameter Model

The plant protection drone rice wind vortex-flight parameter acquisition system uses an E410 plant protection UAV (Hefei Yifeite Electronic Technology Co., Ltd., Hefei, China) to generate a rice field wind vortex while using a Mavic 2 aerial photography UAV (Shenzhen DJI Technology Co., Ltd. Shenzhen, China) to capture wind vortex images. Through image data, the parameters of rice wind vortices will be obtained. The flight parameters of the plant protection drone are collected using a high-precision Beidou differential positioning system with a K705 board (Shanghai Sinan Satellite Navigation Technology Co., Ltd., Shanghai, China). The natural wind speed, direction, temperature, and humidity, which may affect the experimental results, are obtained from a Kestrel 5500 mini weather station. A wireless connection between the drone and the ground control station is established using the Microhard P900 ground-air integrated data transmission module (Hunan AVIC Yiyun Technology Co., Ltd., Changsha, China). Data on the drone’s flight status is transmitted to the Mission Planner ground station via a Microhard P900, and the ground station receives real-time information on drone speed, position, battery voltage, flight attitude, satellite status, etc. [22].
Treating the wind vortex as a target for pesticide spraying and controlling the target can help improve the accuracy of pesticide spraying. The parameters that delineate the morphology of a wind vortex primarily encompass its distance and area.
The “wind vortex distance” pertains to the horizontal relative position between the center position of the wind vortex and the drone. Typically, the wind vortex forms behind the drone’s forward direction, making the wind vortex distance crucial for accurate pesticide spraying. An exploration into the correlation between this distance and flight parameters is instrumental in controlling the spraying position. The “wind vortex area” denotes the size of the region where the downwash airflow significantly rocks the rice canopy. When modeling, the wind vortex area is accurately obtained through image processing. The wind vortex area controlled by adjusting flight parameters can be considered a circular area centered on the center of the wind vortex. The larger the wind vortex area, the more dispersed the airflow, leading to a larger deposition range of pesticide droplets. As a result, the spraying density of pesticides becomes lower. Conversely, the smaller the wind vortex area, the more concentrated the airflow, resulting in a smaller distribution range of droplets and a higher spraying density of pesticides at this time.
We have established the relationship function model between flight parameters (flight speed v, flight altitude h) and wind vortex target parameters in our preliminary work and verified the accuracy of the model [22]. This model is responsible for calculating the forward process from flight parameters to wind vortex target parameters. In order to effectively control the wind vortex target, it is imperative to accurately determine the flight parameters that correspond with the wind vortex target parameters. This involves executing the reverse process of converting wind vortex target parameters into flight parameters.
By defining the functions of wind vortex distance and wind vortex area as FD(h,v) and FS(h,v), respectively, and assigning the parameter values for these two wind vortex targets as D0 and S0, respectively, the following equation system can be obtained:
D 0 = F D ( h , v ) S 0 = F S ( h , v )
Equation (1) presents two equations with two variables, namely flight altitude h and flight speed v. Consequently, when the parameters under control are wind vortex distance and wind vortex area, the fixed flight altitude and speed necessary for controlling these two parameters can be derived from Equation (1). The drone is required to maintain a consistent altitude and speed. In scenarios where only one target parameter is manipulated, it is assumed that this parameter is the wind vortex distance. The equation is then derived from the relationship function of wind vortex distance FD(h,v). When the wind vortex distance is defined as D0, the implicit function representing the relationship between height and speed can be articulated as follows:
h = F D 1 ( D 0 , v )
Equation (2) demonstrates that the flight altitude changes with the flight speed, and it is imperative that the flight parameters satisfy the conditions of the implicit function to ensure that the designated single wind vortex target parameters remain unchanged.
Based on the flight parameter–wind vortex parameter function model, some parameter curves are derived as reference data for studying control methods and model curves for verifying control effects. Firstly, the range of wind vortex parameters is calculated according to the domain definition of each model function. Within the value range, three parameter values are set at equal intervals. Correspondingly, three curves are generated for each model function to study control methods and verify wind vortex control effects. Taking the wind vortex distance function model under adverse wind conditions as an example, due to the previous experimental results indicating that when the flight speed reaches 3.5 m/s or the flight altitude reaches 3.5 m, the downwash airflow can hardly generate a wind vortex when it reaches the rice canopy. Therefore, the maximum flight speed and altitude set in this paper and in the previous paper are 3.5 m/s and 3.5 m, respectively. In the test, 36 groups of flight parameters were set according to the flight altitude and speed, and then we obtained a range of wind vortex distance between 0 and 7.25 m (as shown in Figure 7 of reference [22]). We selected three equidistant distances (2.35 m, 3.62 m, and 4.90 m) in the middle section as representatives to verify the control effectiveness of the control algorithm. These three equally spaced horizontal surfaces intersect with the model function surface to obtain three curves, as shown in Figure 1.
Under downwind and upwind conditions, with the wind vortex distance and wind vortex area as control targets, The analysis focused on target flight parameter curves with downwind distances of −1.06 m, −0.06 m, and 0.94 m, downwind areas of 10.25 m2, 12.69 m2, and 15.12 m2, upwind distances of 2.35 m, 3.62 m, and 4.90 m, and upwind areas of 4.27 m2, 8.57 m2, and 12.86 m2, as shown in Figure 2. A total of 12 flight parameter curves are examined, each constraining the drone’s altitude and speed based on the environmental wind direction and wind vortex target parameters. This paper will explore the control of UAV flight parameters using these 12 flight parameter curves as objectives.

2.2. UAV Flight Control System and Simulation System

Controlling the wind vortex parameters requires ensuring that the flight altitude and speed of the UAV meet the requirements of the function curve. This paper uses an external auxiliary airborne computer to control the UAV’s flight [23]. The airborne computer is an NVIDIA Jetson AGX Xavier high-performance computer. The computer uses the Robot Operating System for computing and message transmission [24]. The “Control_node” in the ROS is the automatic control algorithm node developed in this paper. The acceleration, speed, and position control commands are converted into MavLink protocol information through the “MAVROS” node [25,26] and communicate with the drone flight controller Cube Orange, which is paired with the Ardupilot flight controller firmware to achieve corresponding flight control. The ground station receives the UAV’s flight mode, flight position, and other flight data in real time. The basic framework diagram of the entire control system is shown in Figure 3.
To study the effect of autonomous control of flight parameters, a software-in-the-loop (SITL) simulation system with Ardupilot firmware was built using Gazebo simulation software (https://gazebosim.org/home). The system uses the aircraft’s flight dynamics model to simulate the physical environment related to the movement of the aircraft. The simulation system runs on a virtual machine running Ubuntu 18.04 using VMware Workstation 16 Pro virtualization software. A quadcopter drone using Ardupilot (https://ardupilot.org/) is simulated in the simulation software, and the drone establishes communication with the ROS system through MavLink.

2.3. Simulation of UAV Flight Parameter Control

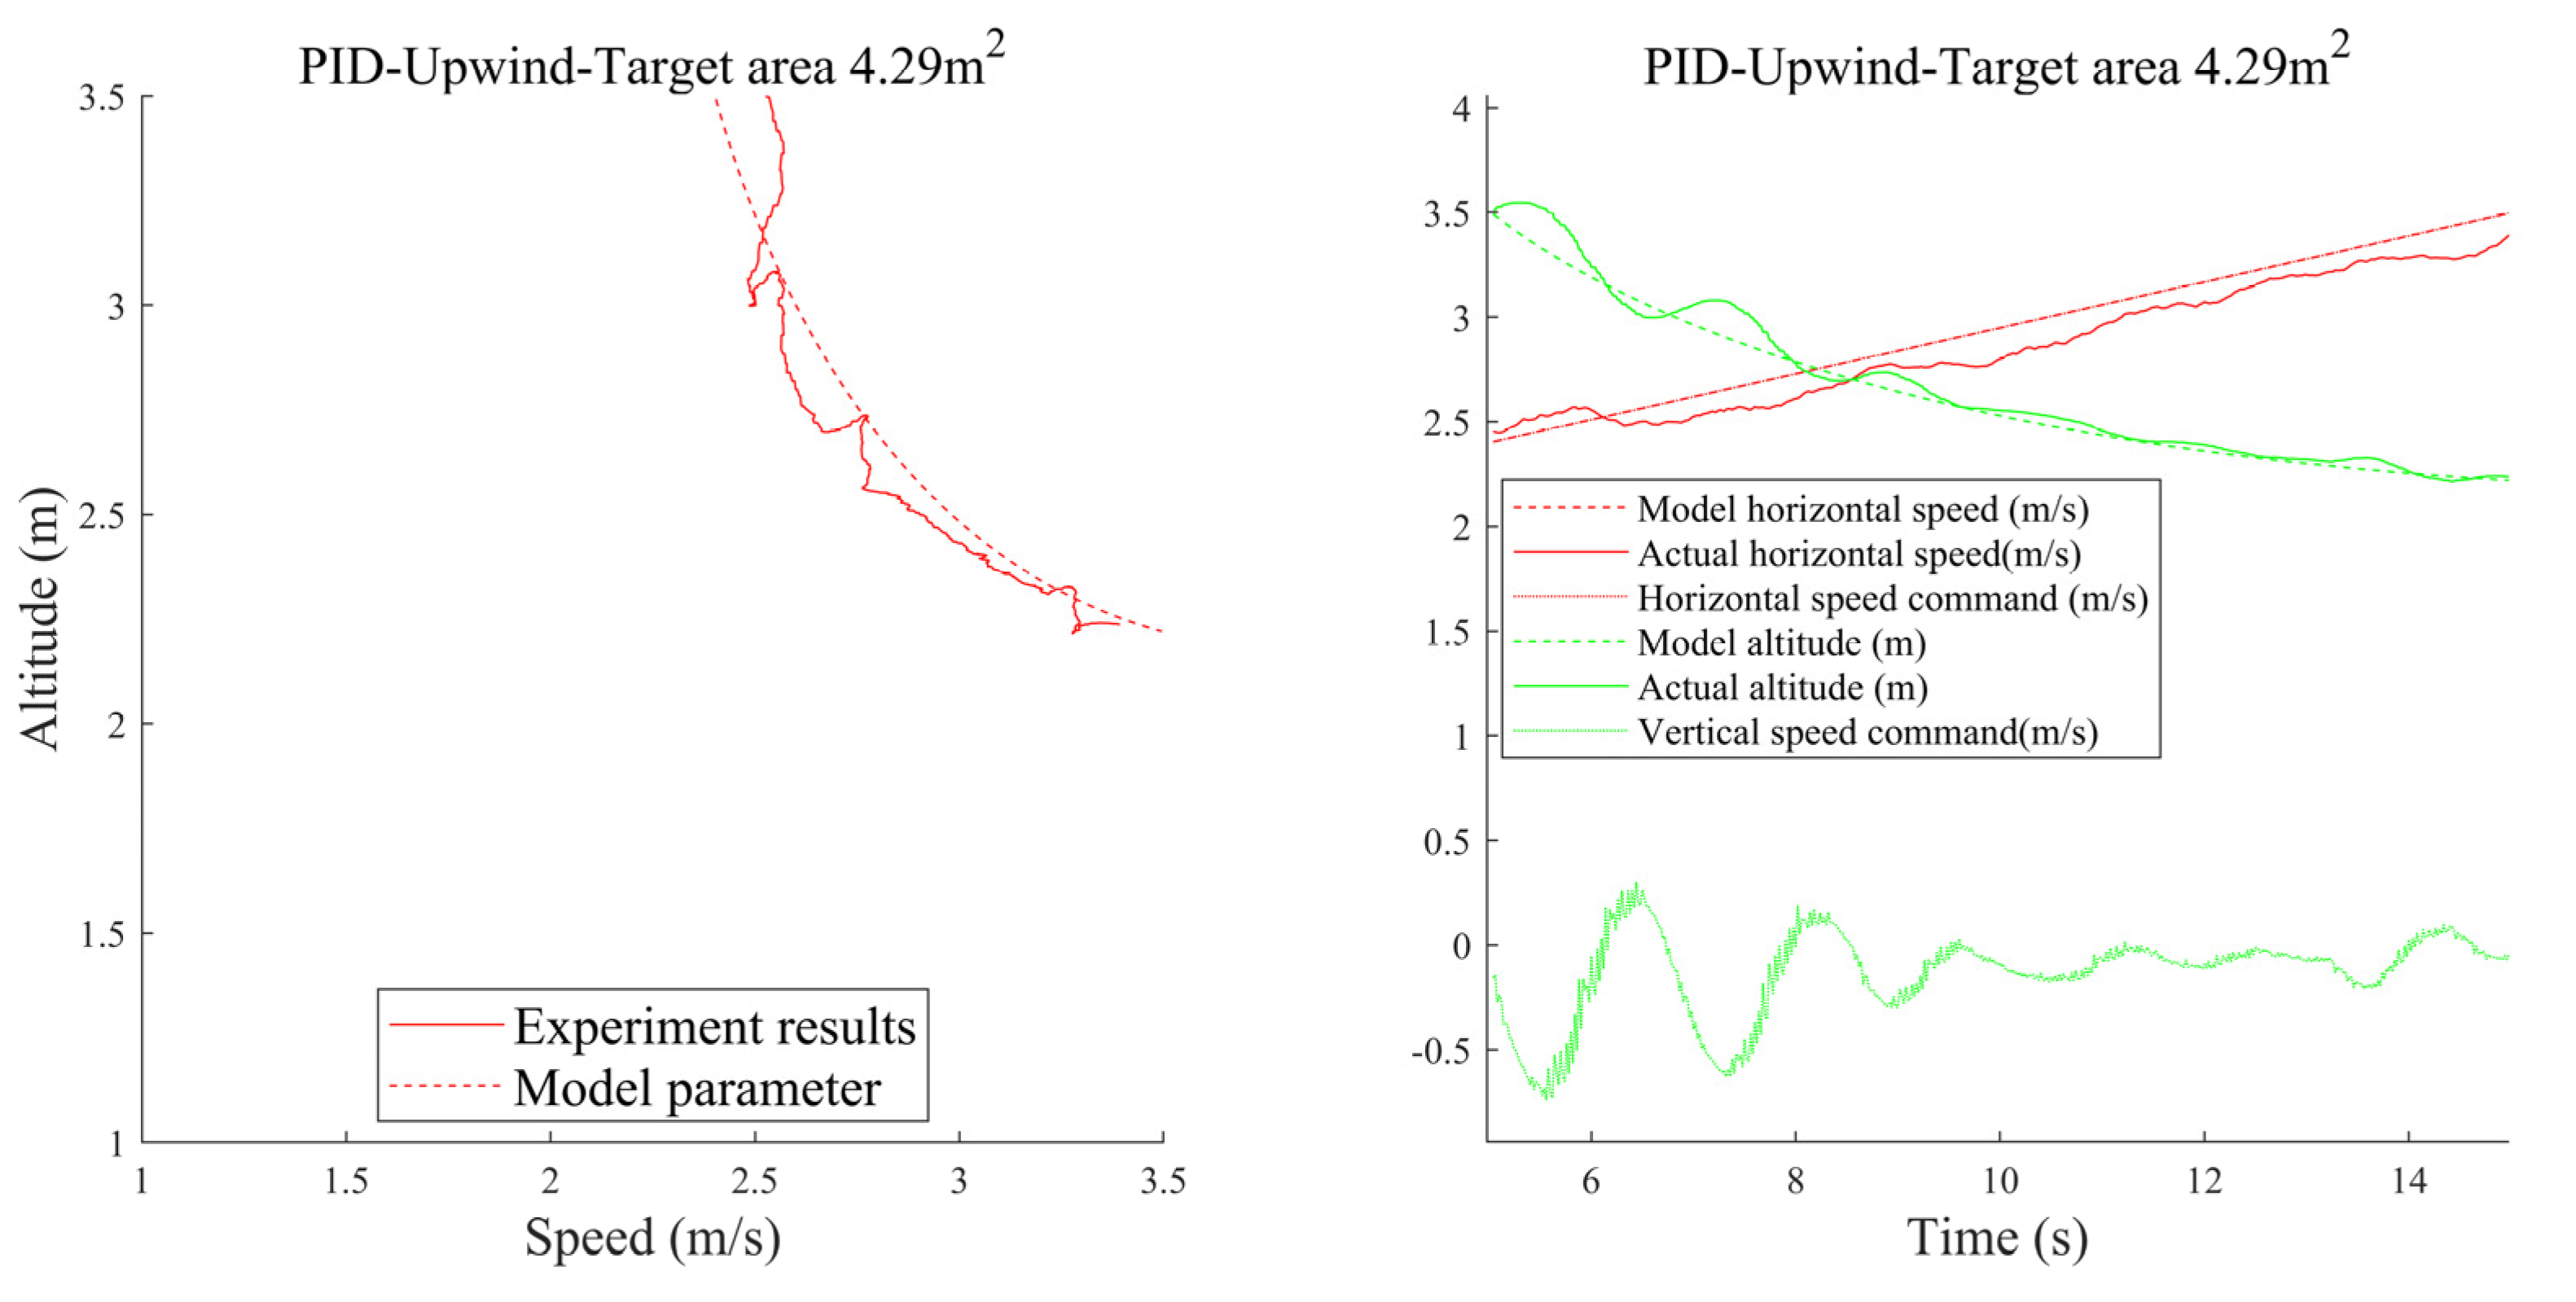
2.3.1. PID Controller

The proportional integral derivative (PID) controller is employed to regulate the flight parameters of the UAV and indirectly manipulate the parameters of the wind vortex targets. The PID controller’s workflow is depicted in Figure 4.
The discrete representation of the control algorithm can be expressed as the following equation:
u ( k ) = K P e ( k ) + K I e ( k ) + K D ( e k   e ( k 1 ) )
In Equation (3), e represents the system error, while KP, KI, and KD denote the proportional coefficient, integral coefficient, and differential coefficient, respectively. The efficacy of the control system is contingent upon the tuning of these coefficients.
For effective drone flight control, it is imperative that the drone’s flight parameters align with the target flight parameter curve model. An online software simulation is conducted utilizing the target curve, which is characterized by the most extensive speed range. Specifically, this involved a parameter curve with a wind vortex distance of 3.62 m under upwind conditions. The drone’s speed range spans from 1 m/s to 3.5 m/s, and its uniform acceleration time is 10 s. To evaluate the efficacy of the control, the distance between the instantaneous height and speed data points and the model curve serve as the primary evaluation metrics for the control effect. The equation is:
e = i = 1 n d i i
In Equation (4), di represents the distance between each point of flight result instantaneous data and model curve, and e denotes the average error.
Through the software loop simulation, the optimal parameter value is sought. Initially, both the differential and integral terms are set to zero, and the optimal KP value is identified. The range of KP values is set from 0.1 to 5 in increments of 0.1, with each value used in the software loop simulation to calculate the average error. A minimum error value of 0.020 is achieved when KP equals 3.5. We then set KP to 3.5 and proceeded with this step to identify the optimal values for KD and KI sequentially. When KD and KI are, respectively, set to 0.1 and 0, a minimal error of 0.011 is obtained. The results of the simulation are presented in Figure 5.

2.3.2. Fuzzy Controller

A fuzzy controller is also used to autonomously adjust the UAV flight parameters. The structural diagram of the fuzzy controller is shown in Figure 6.
Utilizing the height differential between the drone’s instantaneous altitude and the model curve’s height, along with the rate of change in this differential, we establish a dual-input, single-output fuzzy controller. The controller uses vertical speed as its output parameter. We categorize the input and output parameters into five fuzzy sets: positive large, positive small, zero, negative small, and negative large, represented as PB, PS, O, NS, and NB, respectively. For defuzzification, we employ the triangle membership function in conjunction with the centroid method. The fuzzy rules are delineated in Table 1.
The smaller the input domain setting, the more sensitive the system’s response to input; the smaller the output domain setting, the smaller the system’s output. The software in-the-loop simulation uses a parameter curve with a wind vortex distance of 3.62 m under upwind conditions. The output domain range is set from [−0.1,0.1] to [−2,2], and every interval of 0.1 in the domain range is simulated. When the domain is [−0.8,0.8], the minimum average error obtained is 0.023. Using this method, flight tests are then conducted sequentially on the altitude difference domain and the altitude difference change rate domain. Finally, the minimum average error obtained at the altitude difference domain is [−0.3,0.3] and altitude difference change rate domain is [−0.6,0.6] is 0.011. The results of the flight parameter control are shown in Figure 7. As can be seen from Figure 7, changes in flight parameters essentially follow the model curve, and good control effects are achieved under this model curve.
The control effects of both the PID and fuzzy control algorithms are fundamentally identical. To confirm the efficacy of these algorithms on UAVs, further real-world flight tests will be undertaken.

3. Results and Discussions

3.1. Experimental Results of UAV Flight Control

During the autonomous flight of a UAV, the flight altitude and speed are controlled by either a PID controller or a fuzzy controller, utilizing three-dimensional velocity commands based on real-time feedback information. The control wind vortex target area of 4.29 m2 under upwind conditions was selected to obtain the flight parameter curve. The control effects of both PID and fuzzy controllers on these flight parameters were analyzed, as depicted in Figure 8 and Figure 9, respectively.
Figure 8 and Figure 9 show that the horizontal speed command of the drone during autonomous flight basically overlaps the model’s horizontal speed, and the change in the horizontal speed command over time is basically a straight line, indicating that the horizontal speed command basically conforms to the law of uniform acceleration, which can ensure the uniformity of the drone’s acceleration. The vertical speed command is output by the controller. Figure 8 and Figure 9 also show that the vertical speed command can automatically adjust according to the height change in the drone. The direction of the speed command is opposite to the direction of the height difference, indicating that the controller tends to reduce the height difference. The PID controller in this paper mainly relies on proportional parameter adjustment. Figure 8 shows that the vertical speed command mainly follows the change in height deviation, and the error change rate has little impact on the vertical speed command. The height difference and height difference changes in the fuzzy controller have a significant impact on the output of the controller. It can be seen from Figure 9 that the vertical speed command changes at adjacent times have a large span and can effectively reduce overshoot. There are fluctuations and errors in both flight altitude and flight speed, resulting in deviations between the actual flight parameters and the model curve parameters. We calculate the altitude and speed differences at each time for average processing. The equation is:
e = i = 1 n r i i
In Equation (5), r i is the difference between the flight parameters (altitude or speed) and the model parameters at that time, and i is the total number of data points. The altitude and speed deviations for each cruise are shown in Table 2.
From Table 2, it can be seen that the effects of PID control and fuzzy control are not significantly different. The deviation of height control in fuzzy control is smaller than that of speed control, mainly because the horizontal speed control method in this control system is open-loop control, and the horizontal speed command is proportional to time. However, height control uses closed-loop control, which will be adjusted based on real-time speed feedback.
The above analysis conclusions were obtained under upwind conditions; the same conclusions were obtained under downwind conditions using the same analysis method.

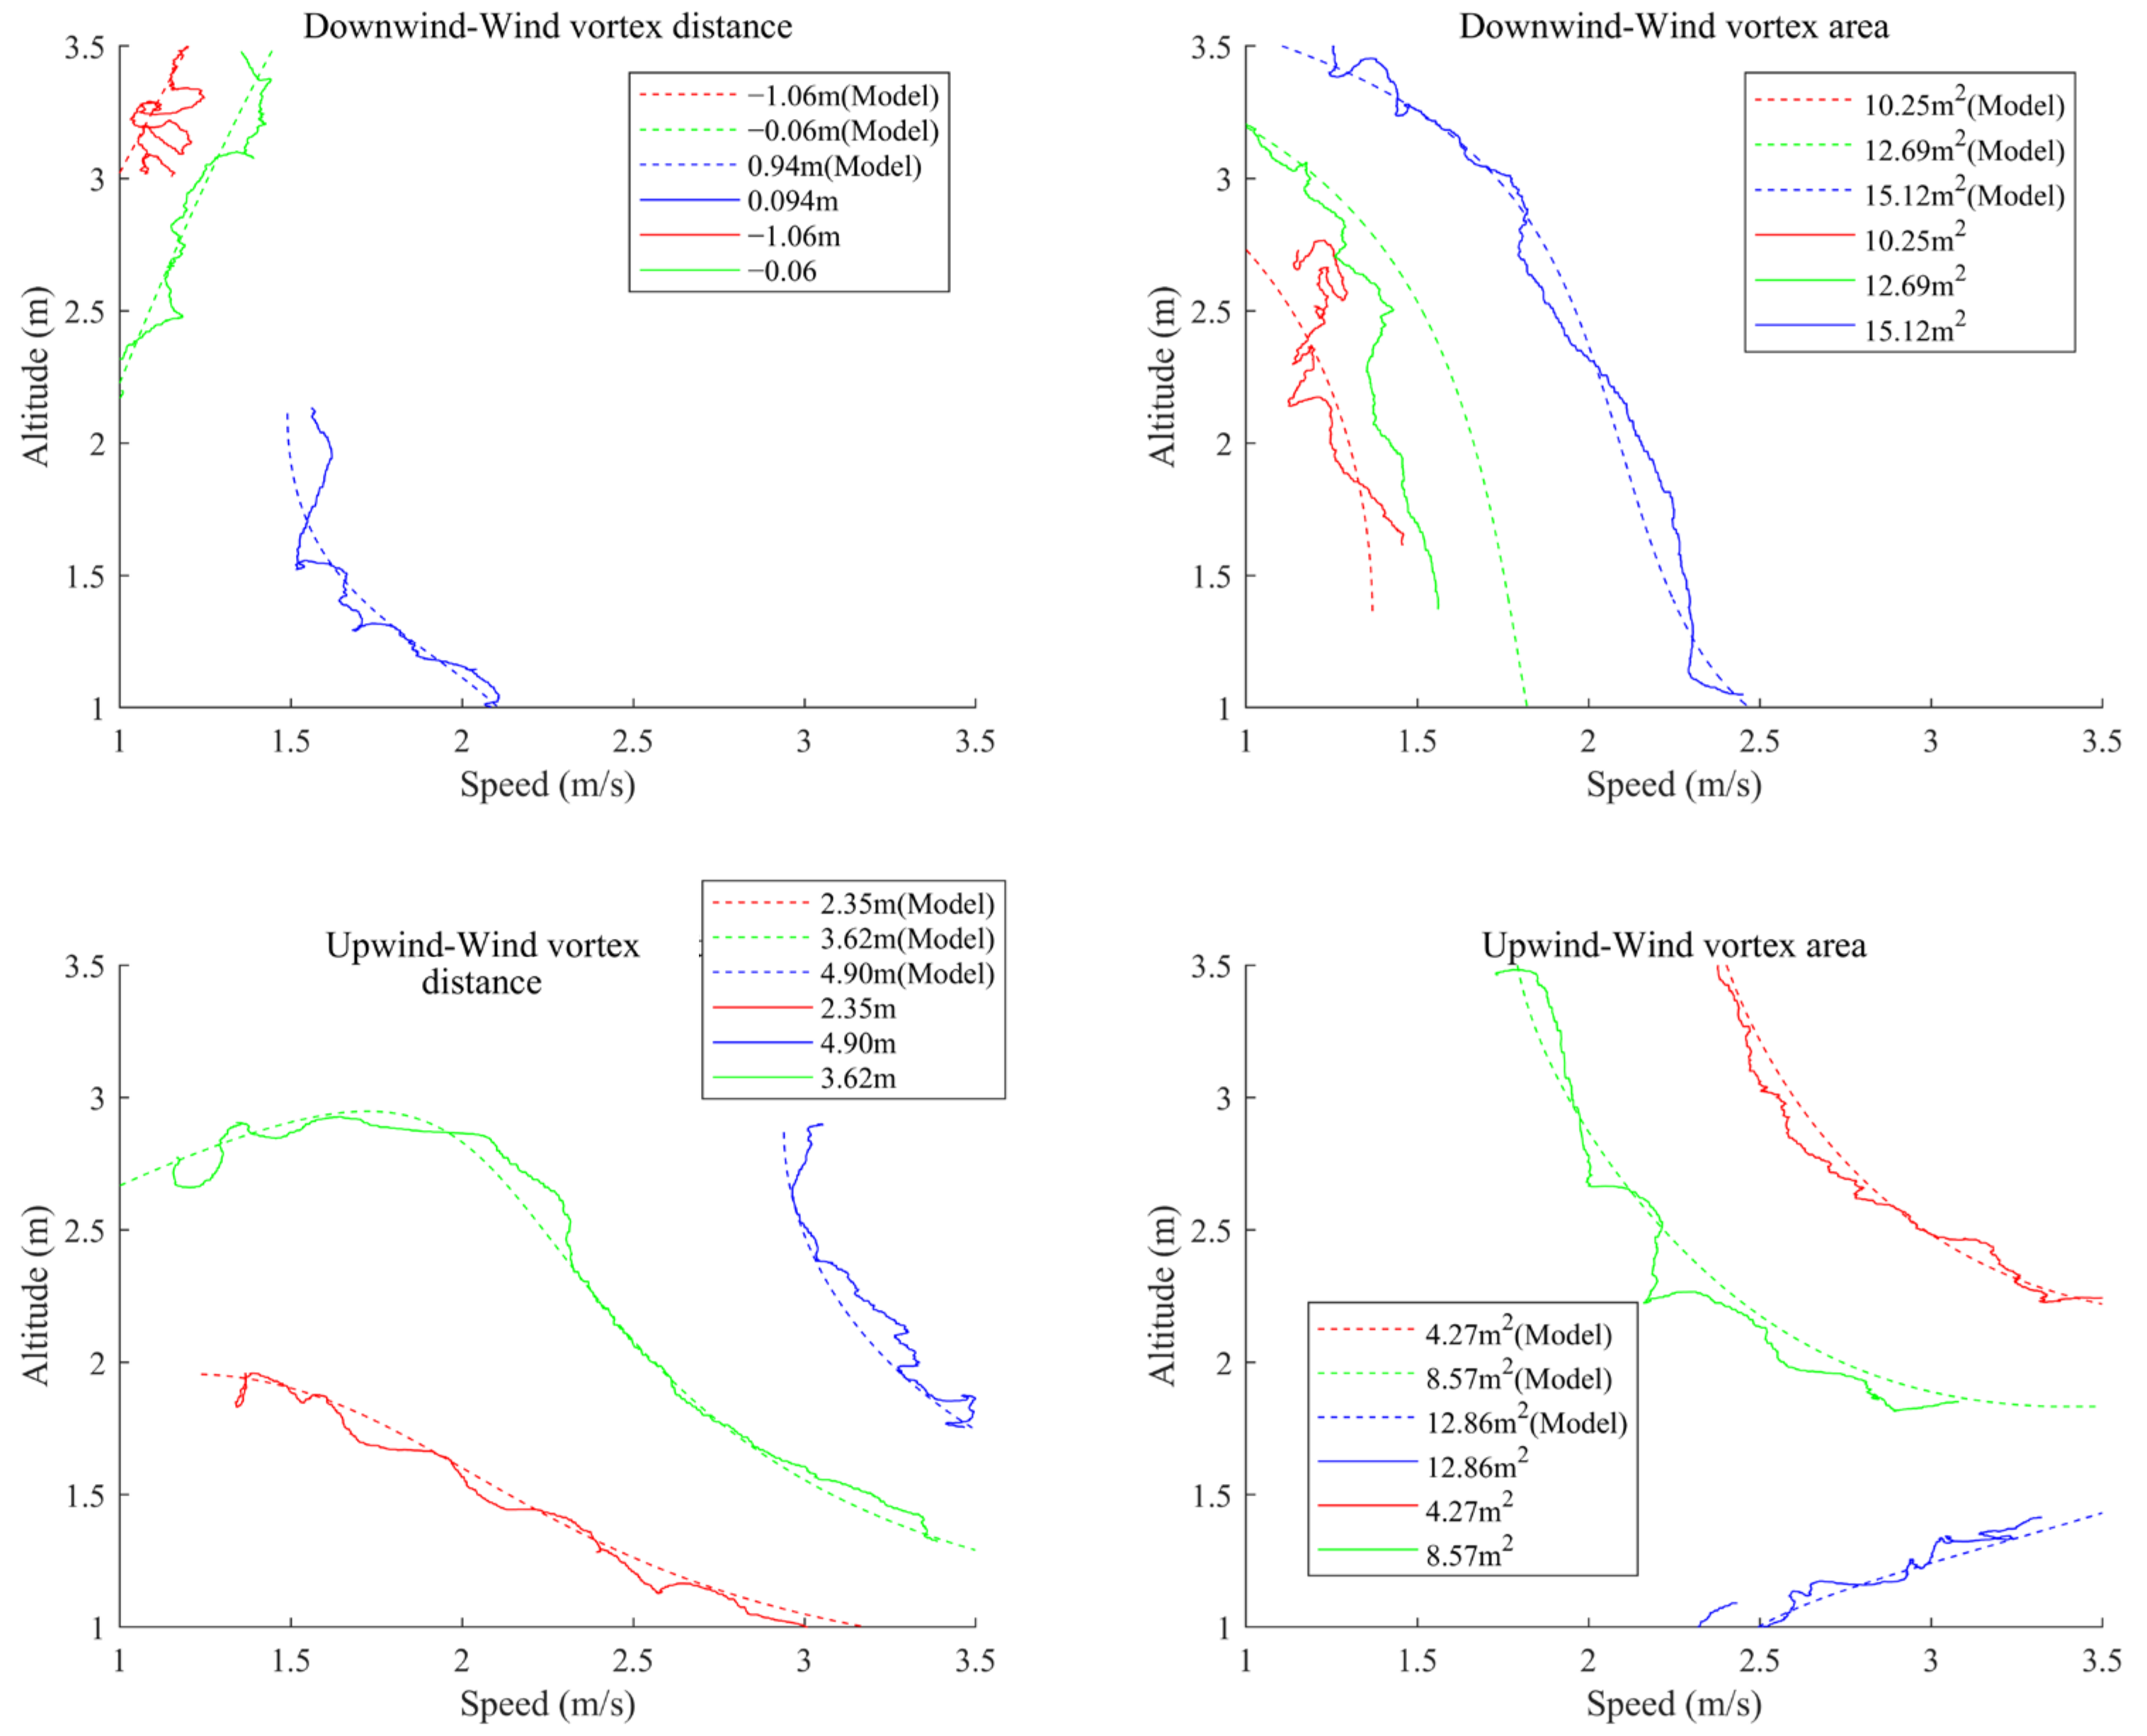
3.2. Experimental Results of Wind Vortex Target Parameter Control

The flight experiment was conducted at Huashan District, South China Agricultural University (113°20.38′ E, 23°9.76′ N). The test site is open and unobstructed, with weak natural wind and good signal reception.
The control target was the 12 flight parameter curves shown in Figure 2. The PID control algorithm and fuzzy control algorithm were used to conduct automatic flight tests on each curve. The drone starts flying at the lowest speed on the curve and accelerates to the highest speed within 10 s. After completing the experiment, 24 sets of data were collected, and the actual flight parameter test results are shown in Figure 10 and Figure 11.
Comparing the effectiveness of the two control methods, it can be seen that the actual flight parameter curve is closer to the ideal flight curve parameters when using fuzzy control. The control deviation under the two control methods was calculated, and the results are shown in Table 3.
The experimental findings indicate that the average error under fuzzy control is 0.053, which is smaller than the error of 0.07 under PID control, indicating a better control effect.

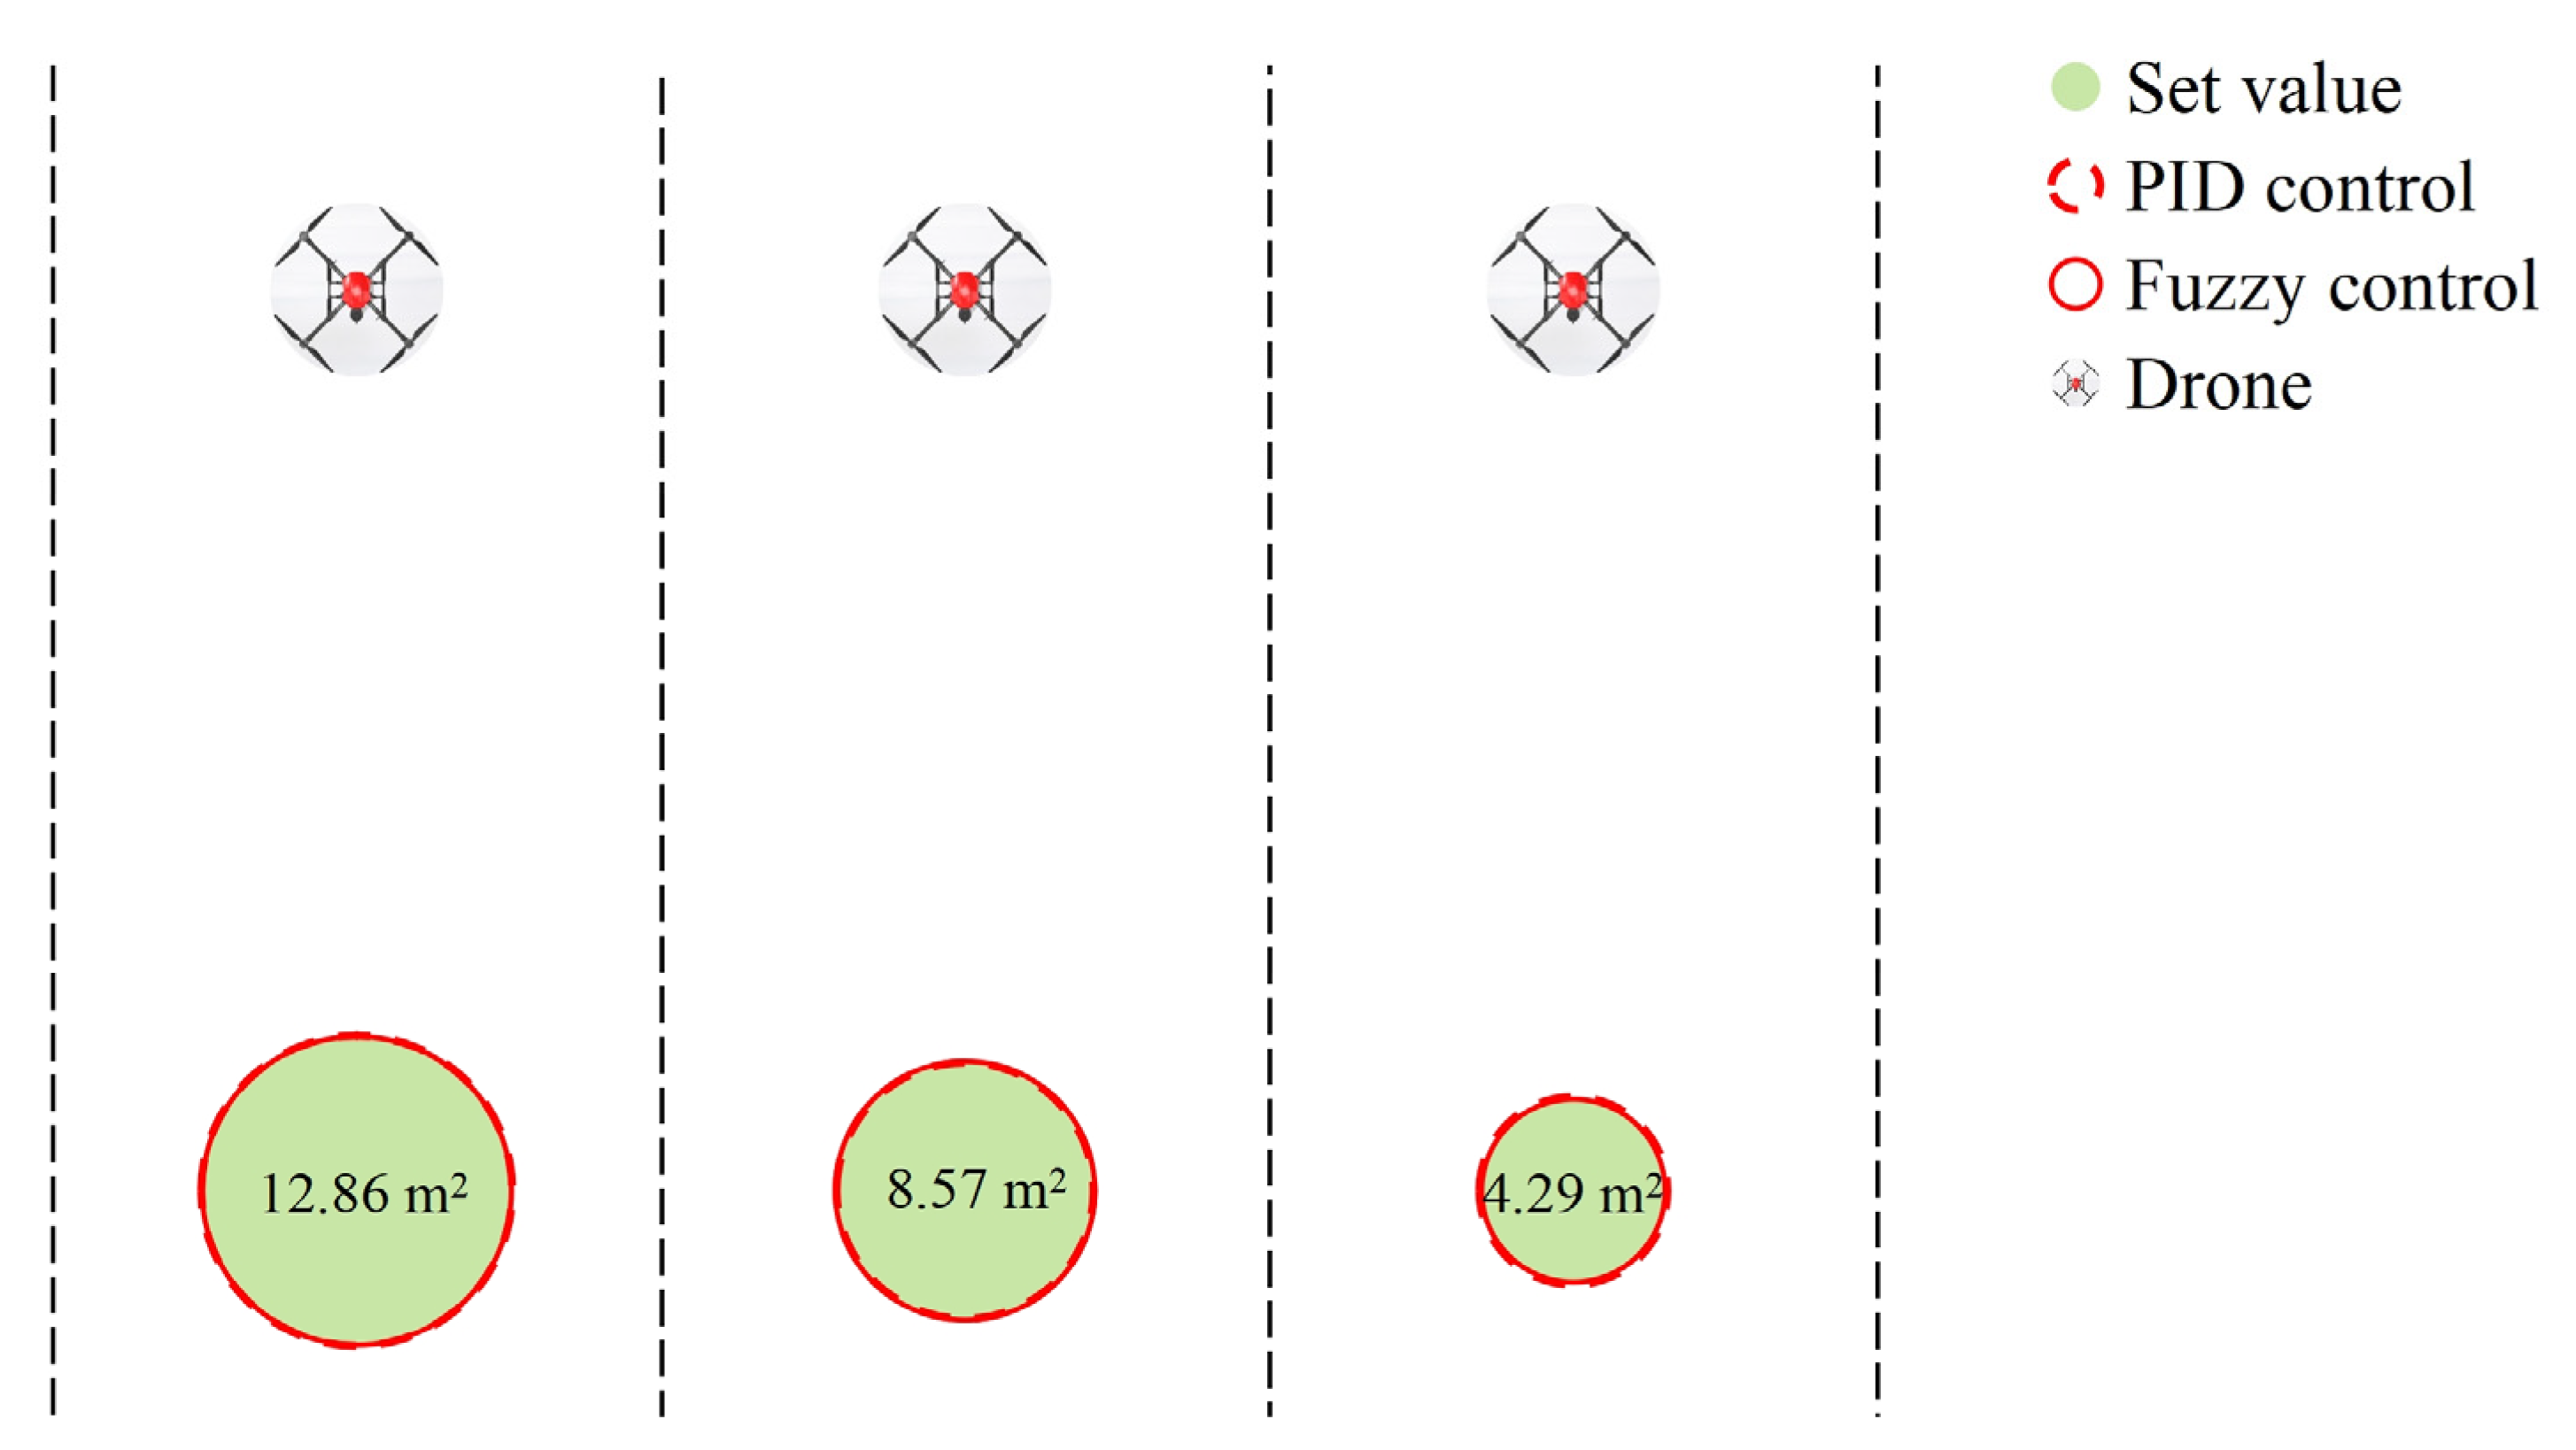
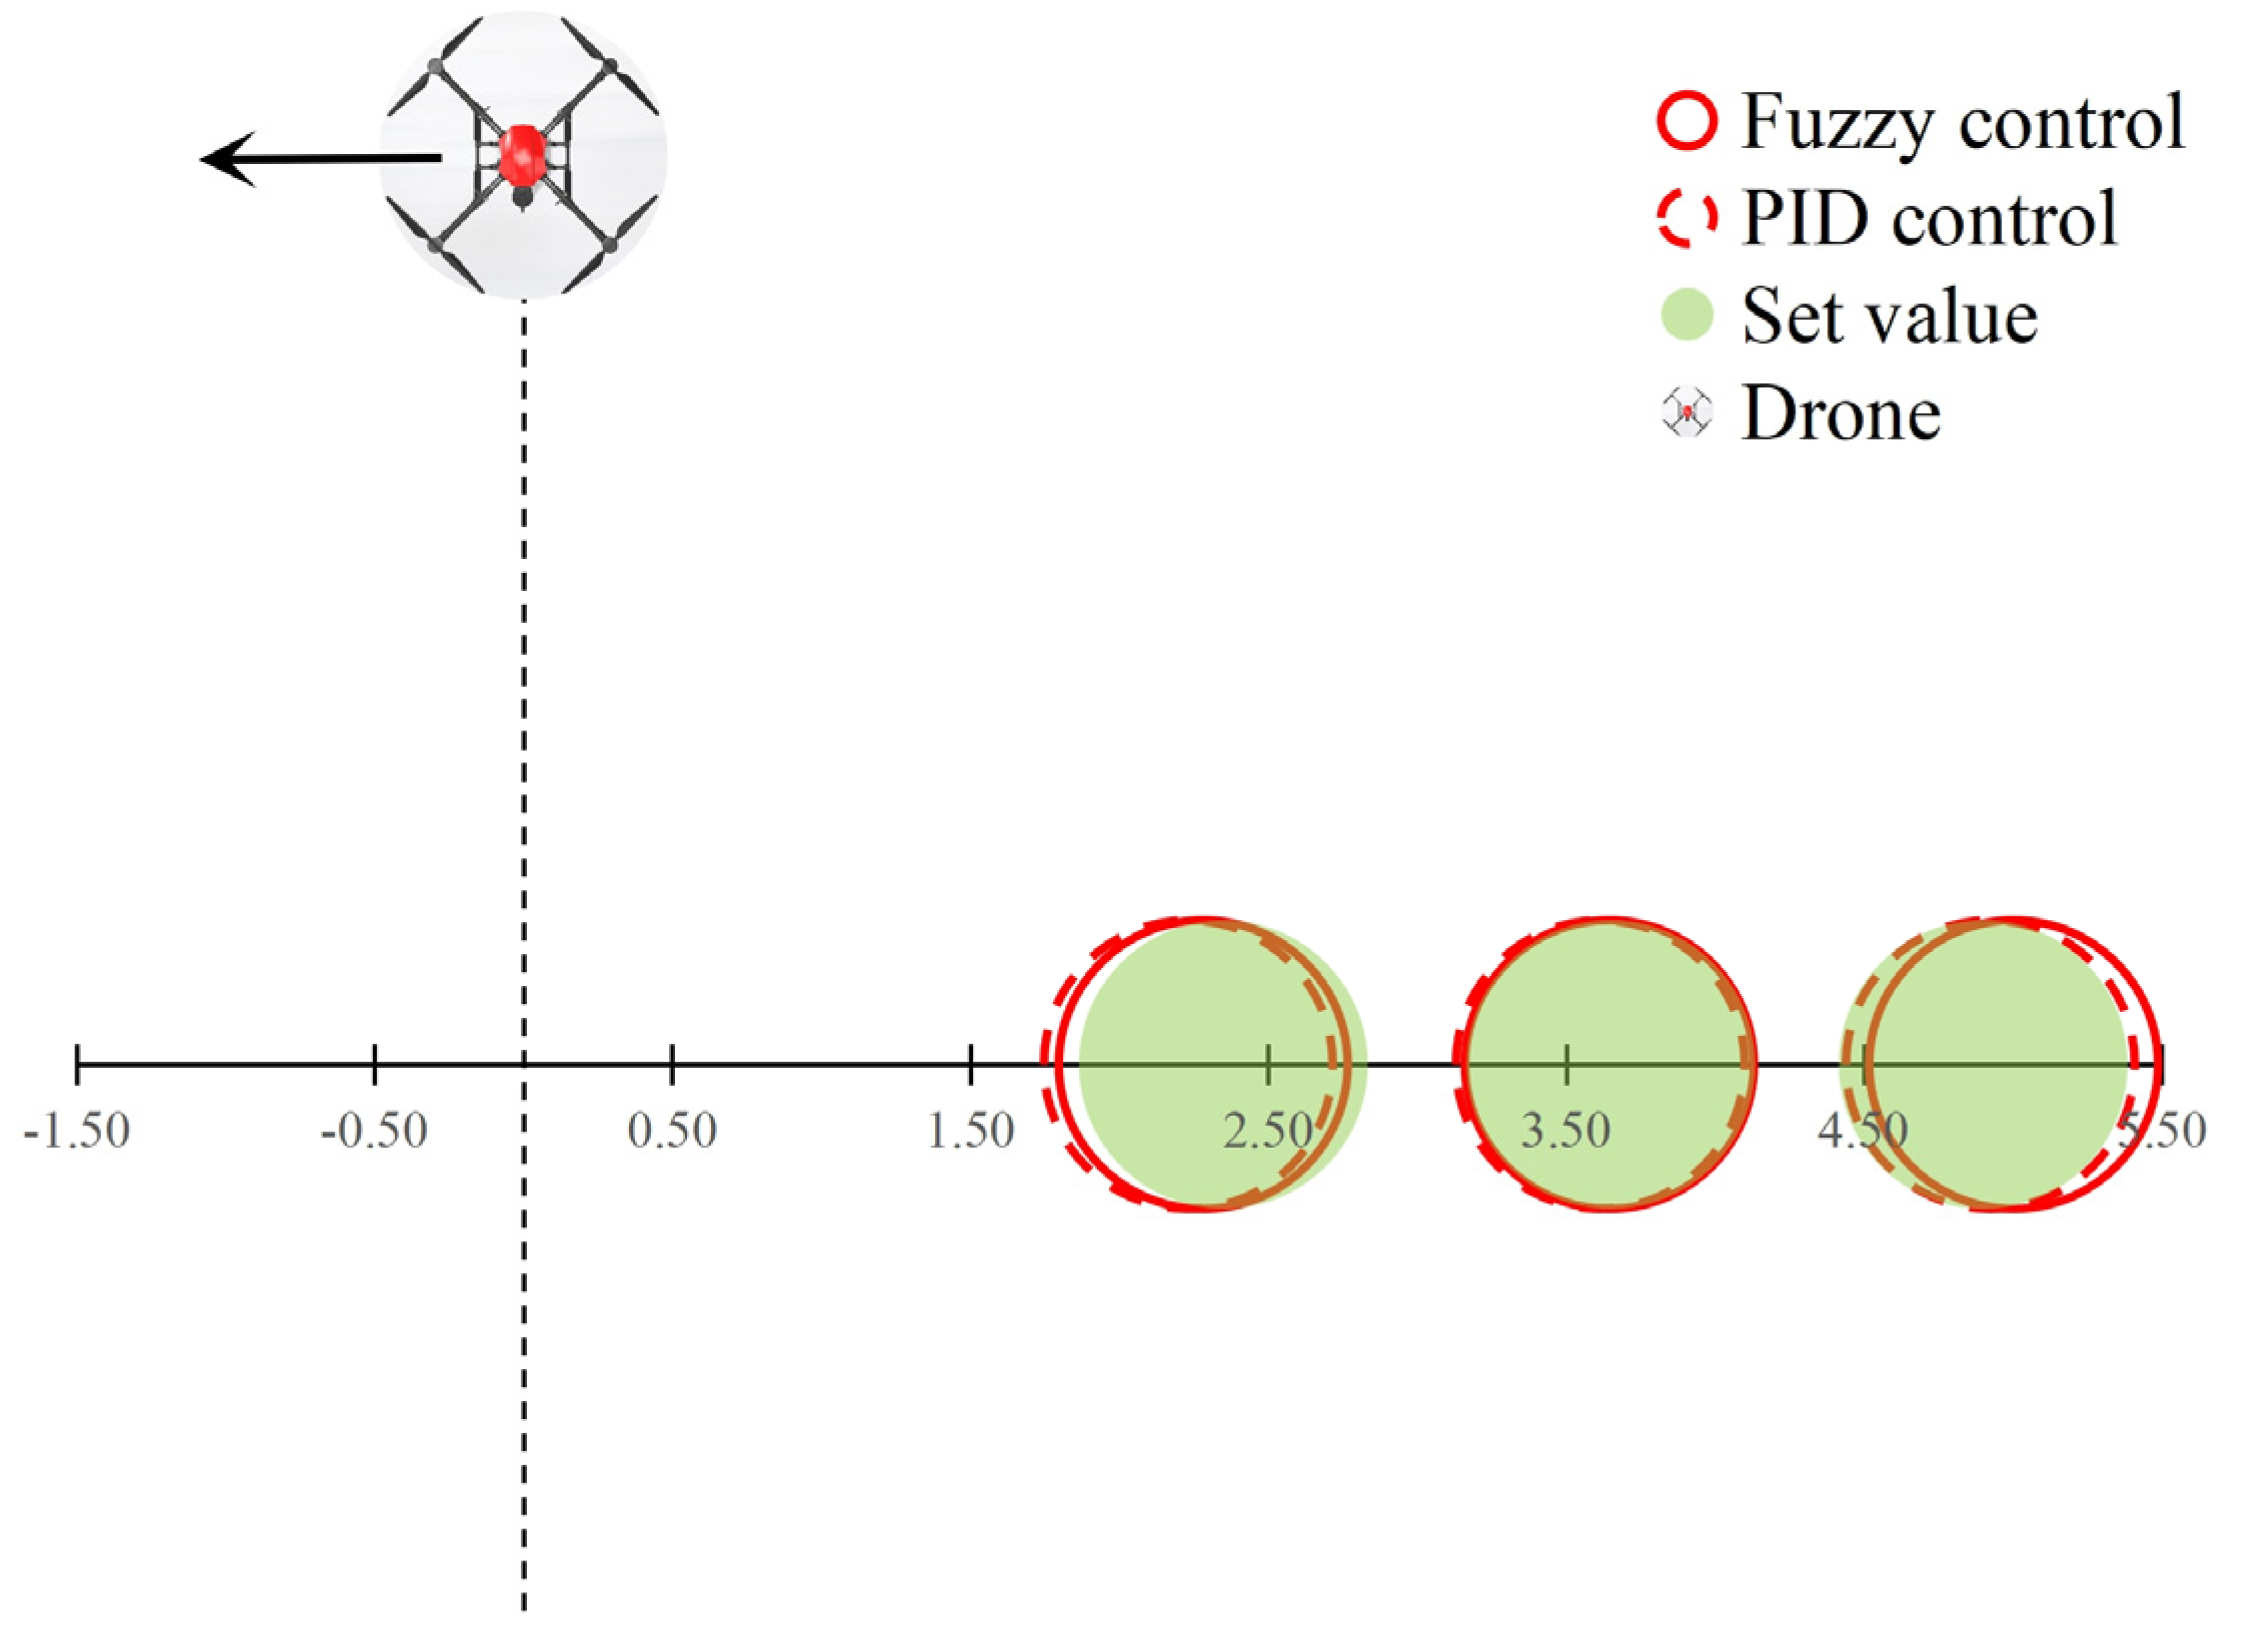
3.3. Control Effect of Wind Vortex Target Parameters

The primary objective of controlling flight parameters is to regulate the wind vortex target parameters. A model function for wind vortex parameter control was proposed in the previous work [22]. The input to this function is the flight parameters, and the output is the wind vortex parameters. Using the relationship function and experimental data on flight parameters, we can compute the corresponding wind vortex parameter values. The equation for calculating ideal target parameters is as follows:
S = F S ( h , v ) D = F d ( h , v )
In Equation (6), F S and F d are the target area function and target distance function, respectively, and h and v are the flight altitude and speed obtained from the experiment. According to the flight results and the relationship function, the wind vortex target area and distance were calculated. The control effects of the target area and distance are shown in Figure 12, Figure 13, Figure 14 and Figure 15.
The size of the circle in Figure 12 and Figure 13 represents the area of the wind vortex. It can be seen from the figure that PID control and fuzzy control have similar effects, indicating that the area control effect is good. The horizontal coordinate position of the circle in Figure 14 and Figure 15 represents the distance of the wind vortex target. It can be seen that the target position can effectively follow the set position under both control methods, and the target distance control effect is good.
We calculated the average value of the wind vortex target parameter value during the flight process and compared it with the set target value to obtain the control effect of the target and the direction and value of the target parameter offset. The results are shown in Table 4.
Table 4 shows that the test values of the target parameters are basically consistent with the target values. The test target values show positive and negative deviations under different wind directions and parameters. When the wind vortex target area is set to 12.69 m2 under downwind conditions, the maximum deviation of the target parameters is 0.69 m2, and the other target parameters show relatively small deviations, which achieves a good control effect.
Ideally, the computed value of the wind vortex target parameter should align perfectly with the predetermined target value. However, in real-world scenarios, variations in flight parameters at different times can introduce minor discrepancies. Additionally, inaccuracies in the target parameters may occur. To quantify these deviations, the absolute error between the actual target parameter values and the set target values is determined as follows:
e = i = 1 n F ( h i , v i ) A i
In Equation (7), A is the set value of the wind vortex target, and F ( h i , v i ) is the wind vortex target calculation result calculated based on the model function and flight parameters obtained from experiments. The control effect of 12 wind vortex target parameters in the experiment is shown in Table 5.
From Table 5, it can be seen that the absolute error of the target parameters under fuzzy control is smaller, and the control effect is better than that under PID control.
During the flight process, the flight parameters of the drone change in real time, and the theoretical target parameters obtained from the flight parameters also fluctuate around the set values. To compare the target control stability of different parameters and control methods, the variance of target parameters under each voyage was calculated. The results are shown in Table 6.
Horizontally comparing the target parameter variances of the two methods, the values with smaller variances are marked with “*” in Table 6. From Table 6, it can be seen that the variance under fuzzy control was smaller for eight voyages, while the variance under PID control was smaller for the remaining four voyages. Therefore, the target parameter statistical dispersion under fuzzy control is smaller than that under PID control.

4. Conclusions

This paper conducted research on the wind vortex target control of plant protection UAVs based on the rice wind vortex–flight parameter model. The flight parameter curve was calculated based on the wind vortex target parameter control model; a PID controller and fuzzy controller were designed using a Cube Orange flight controller and Jetson AGX Xavier onboard computer to control wind vortex target parameters; drone flight control tests were conducted, where under fuzzy control, the average deviation values of UAV flight altitude and speed were 0.06 and 0.08, respectively, which was better than the values under PID control; wind vortex target-flight parameter curve control tests were conducted, where the average error of the flight curve under fuzzy control was 0.053, which was better than that of PID control; wind vortex target control effectiveness tests were conducted where the deviation of the target parameters under both downwind and upwind conditions was small, and the control effect was good, under fuzzy control, the average values of target distance and area errors under downwind and upwind conditions were 0.12 m and 0.38 m2 and 0.09 m and 0.31 m2, respectively, indicating that the absolute error of the target parameters was smaller than that of PID control, in the twelve voyage experiment, the variance of target parameters under fuzzy control was smaller in eight voyages, and the variance of PID control was smaller in four voyages. Overall, the fuzzy controller designed in this paper has a better control effect than the PID controller.
The control of wind vortex distance and area in the rice canopy studied in this paper directly affects the specific location, density, and uniformity of pesticide spraying. It can effectively enable drones to accurately spray pesticides on targets, reduce pesticide deposition in nontarget areas, improve pesticide utilization efficiency, and reduce agricultural production costs. It is of great significance for protecting the natural environment. The research conducted in this paper is the first to control the airflow wind vortex generated in the rice canopy during the operation of plant protection drones. This control method can effectively combine the control of the drone body with the effectiveness of field operations and improve the quality of field operations.

5. Prospect

Despite the substantial contributions of this paper, several areas warrant further exploration in subsequent research endeavors.
(1)
The data collection for this paper was conducted under conditions of a relatively stable meteorological environment and minimal natural wind, neglecting the potential impact of environmental wind. Future research will incorporate real-time environmental wind information to improve the model’s applicability.
(2)
The models for different crops will differ, mainly due to the unique mechanical properties of their canopies. Future research should focus on analyzing the mechanical characteristics of the main targets for drone operations and incorporating these mechanical properties into the models. This will help enhance the generalization ability of the models.
(3)
While the flight parameter control method examined in this paper effectively modulates the drone’s flight speed and altitude, ensuring minimal error in wind vortex target parameters, there is potential for further enhancement of wind vortex target control through the exploration of more fundamental flight control algorithms.

Author Contributions

Conceptualization: H.X. and F.T.; data curation: Z.L.; software: Z.L. and T.H.; formal analysis: Z.L.; resources: J.L. and F.T.; supervision: H.X. and F.T.; validation: Z.L. and M.D.; funding acquisition: J.L.; investigation: H.X., Z.L., J.L., T.H. and M.D.; visualization: Z.L. and T.H.; methodology: H.X., J.L. and F.T.; writing—original draft: H.X. and J.L; project administration: J.L. and F.T.; writing—review and editing: H.X. and J.L. All authors have read and agreed to the published version of the manuscript.

Funding

This research was funded by the Natural Science Foundation of Guangdong Province (2023A1515011932) and the Guangzhou Key Research and Development Project (202206010164 and 2023B03J1323).

Institutional Review Board Statement

Not applicable.

Data Availability Statement

The data presented in this study are available on request from the corresponding authors.

Conflicts of Interest

The authors declare no conflicts of interest.

References

  1. Li, J.; Lan, Y.; Shi, Y. Research progress on airflow characteristics and field pesticide application system of rotary-wing UAV. Trans. CSAE 2018, 34, 104–118. [Google Scholar] [CrossRef]
  2. Qin, W.C.; Qiu, B.J.; Xue, X.Y.; Chen, Z.F.; Zhou, Q.Q. Droplet deposition and control effect of insecticides sprayed with an unmanned aerial vehicle against plant hoppers. Crop Prot. 2016, 85, 79–88. [Google Scholar] [CrossRef]
  3. Velusamy, P.; Rajendran, S.; Mahendran, R.K.; Naseer, S.; Shafiq, M.; Choi, J.-G. Unmanned Aerial Vehicles (UAV) in precision agriculture: Applications and challenges. Energies 2021, 15, 217. [Google Scholar] [CrossRef]
  4. Chen, S.; Lan, Y.; Li, J.; Zhou, Z.; Liu, A.; Xu, X. Comparison of the pesticide effects of aerial and artificial spray applications for rice. J. South China Agric. Univ. 2017, 38, 103–109. [Google Scholar] [CrossRef]
  5. Zhan, Y.; Chen, P.; Xu, W.; Chen, S.; Han, Y.; Lan, Y.; Wang, G. Influence of the downwash airflow distribution characteristics of a plant protection UAV on spray deposit distribution. Biosyst. Eng. 2022, 216, 32–45. [Google Scholar] [CrossRef]
  6. Shi, Q.; Liu, D.; Mao, H.; Shen, B.; Li, M. Wind-induced response of rice under the action of the downwash flow field of a multi-rotor UAV. Biosyst. Eng. 2021, 203, 60–69. [Google Scholar] [CrossRef]
  7. Shouji, C.; Dafsari, R.A.; Yu, S.H.; Choi, Y.; Lee, J. Mean and turbulent flow characteristics of downwash air flow generated by a single rotor blade in agricultural drones. Comput. Electron. Agric. 2021, 190, 106471. [Google Scholar] [CrossRef]
  8. Li, J.; Shi, Y.; Lan, Y.; Guo, S. Vertical distribution and vortex structure of rotor wind field under the influence of rice canopy. Comput. Electron. Agric. 2019, 159, 140–146. [Google Scholar] [CrossRef]
  9. Yang, S.; Xu, P.; Jiang, S.; Zheng, Y. Downwash characteristics and analysis from a six-rotor unmanned aerial vehicle conFigured for plant protection. Pest Manag. Sci. 2022, 78, 1707–1720. [Google Scholar] [CrossRef]
  10. Guo, S.; Li, J.; Yao, W.; Zhan, Y.; Li, Y.; Shi, Y. Distribution characteristics on droplet deposition of wind field vortex formed by multi-rotor UAV. PLoS ONE 2019, 14, e0220024. [Google Scholar] [CrossRef]
  11. Zhu, Y.; Guo, Q.; Tang, Y.; Zhu, X.; He, Y.; Huang, H.; Luo, S. CFD simulation and measurement of the downwash airflow of a quadrotor plant protection UAV during operation. Comput. Electron. Agric. 2022, 201, 107286. [Google Scholar] [CrossRef]
  12. He, L.; Wang, G.; Hu, T.; Meng, Y.; Yan, X.; Yuan, H. Influences of spray adjuvants and spray volume on the droplet deposition distribution with unmanned aerial vehicle (UAV) spraying on rice. J. Plant Prot. 2017, 44, 1046–1052. [Google Scholar] [CrossRef]
  13. Wang, C.; Song, J.; He, X.; Wang, Z.; Wang, S.; Meng, Y. Effect of flight parameters on distribution characteristics of pesticide spraying droplets deposition of plant-protection unmanned aerial vehicle. Trans. Chin. Soc. Agric. Eng. 2017, 33, 109–116. [Google Scholar] [CrossRef]
  14. Xu, T.; Yu, F.; Cao, L.; Du, W.; Ma, M. Vertical distribution of spray droplet deposition of plant protection multi rotor UAV for japonica rice. Trans. Chin. Soc. Agric. Mach. 2017, 48, 101–107. [Google Scholar] [CrossRef]
  15. Guo, S.; Li, J.; Yao, W.; Hu, X.; Wei, X.; Long, B.; Wu, H.; Li, H. Optimization of the factors affecting droplet deposition in rice fields by rotary unmanned aerial vehicles (UAVs). Precis. Agric. 2021, 22, 1918–1935. [Google Scholar] [CrossRef]
  16. Lan, Y.; Qian, S.; Chen, S.; Zhao, Y.; Deng, X.; Wang, G.; Zang, Y.; Wang, J.; Qiu, X. Influence of the downwash wind field of plant protection UAV on droplet deposition distribution characteristics at different flight heights. Agronomy 2021, 11, 2399. [Google Scholar] [CrossRef]
  17. Yallappa, D.; Kavitha, R.; Surendrakumar, A.; Suthakar, B.; Kumar, A.P.M.; Kannan, B.; Kalarani, M.K. Influence of the downwash airflow in Hexacopter Drone on the spray distribution pattern of boom sprayer. J. Appl. Nat. Sci. 2023, 15, 391–400. [Google Scholar] [CrossRef]
  18. Yang, Z.; Ge, L.; Qi, L.; Chen, Y.; Wu, Y. Influence of UAV Rotor Down-wash Airflow on Spray Width. Trans. Chin. Soc. Agric. Mach. 2018, 49, 116–122. [Google Scholar] [CrossRef]
  19. Martin, D.E.; Woldt, W.E.; Latheef, M.A. Effect of application height and ground speed on spray pattern and droplet spectra from remotely piloted aerial application systems. Drones 2019, 3, 83. [Google Scholar] [CrossRef]
  20. Richardson, B.; Rolando, C.A.; Somchit, C.; Dunker, C.; Strand, T.M.; Kimberley, M.O. Swath pattern analysis from a multi-rotor unmanned aerial vehicle configured for pesticide application. Pest Manag. Sci. 2020, 76, 1282–1290. [Google Scholar] [CrossRef]
  21. Tian, Z.; Xu, X.; Xu, Y.; Yang, F.; Sun, Z. Effect of Plant Protection UAVs Downwash on Crop Canopy. Trans. Chin. Soc. Agric. Mach. 2021, 52, 40–48. [Google Scholar] [CrossRef]
  22. Liu, Z.; Fan, G.; Ye, S.; Zhang, Z.; Wu, H.; Long, B.; Li, H.F.; Chen, H.; Wu, L.; Li, J. Flight Parameter-Wind Vortex Characteristic Control Model of a Four-Multirotor Unmanned Aerial Vehicle Operating in Pesticide Spraying of Rice. Agriculture 2023, 13, 892. [Google Scholar] [CrossRef]
  23. Andrade, F.A.; Guedes, I.P.; Carvalho, G.F.; Zachi, A.R.; Haddad, D.B.; Almeida, L.F.; de Melo, A.G.; Pinto, M.F. Unmanned aerial vehicles motion control with fuzzy tuning of cascaded-pid gains. Machines 2021, 10, 12. [Google Scholar] [CrossRef]
  24. Hajjaj, S.S.H.; Sahari, K.S.M. Developing a Portable Human-Robot Interaction (HRI) Framework for Outdoor Robots Through Selective Compartmentalization: Effective Integration of the Robot Operating System (ROS) and Android for Outdoor Robots. Arab. J. Sci. Eng. 2019, 44, 9779–9786. [Google Scholar] [CrossRef]
  25. Khan, N.A.; Jhanjhi, N.Z.; Brohi, S.N.; Almazroi, A.A.; Almazroi, A.A. A secure communication protocol for unmanned aerial vehicles. Comput. Mater. Contin. 2021, 70, 601–618. [Google Scholar] [CrossRef]
  26. Madridano, Á.; Al-Kaff, A.; Martín, D.; de la Escalera, A. 3D trajectory planning method for uavs swarm in building emergencies. Sensors 2020, 20, 642. [Google Scholar] [CrossRef] [PubMed]
Figure 1. Target parameter curves.
Agriculture 14 01413 g001
Figure 2. Target flight parameter curve.
Agriculture 14 01413 g002
Figure 3. Framework diagram of the entire control system.
Agriculture 14 01413 g003
Figure 4. PID controller workflow.
Agriculture 14 01413 g004
Figure 5. Simulation effect of PID control optimal parameters.
Agriculture 14 01413 g005
Figure 6. Structural diagram of the fuzzy controller.
Agriculture 14 01413 g006
Figure 7. Simulation effect of fuzzy control optimal parameters.
Agriculture 14 01413 g007
Figure 8. Flight effect of PID control-upwind-target area 4.29 m2.
Agriculture 14 01413 g008
Figure 9. Flight effect of fuzzy control-upwind-target area 4.29 m2.
Agriculture 14 01413 g009
Figure 10. PID control actual flight results.
Agriculture 14 01413 g010
Figure 11. Fuzzy control actual flight results.
Agriculture 14 01413 g011
Figure 12. Control effect of target area (downwind).
Agriculture 14 01413 g012
Figure 13. Control effect of target area (upwind).
Agriculture 14 01413 g013
Figure 14. Control effect of target distance (downwind).
Agriculture 14 01413 g014
Figure 15. Control effect of target distance (upwind).
Agriculture 14 01413 g015
Table 1. Fuzzy control rule.
PBPSONSNB
PBNBNBNBOO
PSNBNSNSPSPS
ONSNSOPSPS
NSNSNSPSPSPB
NBOOPBPBPB
Table 2. Comparison of height deviation and speed deviation between two control methods.
Wind DirectionTargetTarget
Value
PID ControlFuzzy Control
Height Deviation (m)Speed Deviation (m/s)Height Deviation (m)Speed Deviation (m/s)
DownwindArea (m2)15.120.070.040.110.06
12.690.070.060.090.14
10.250.050.080.050.10
Distance (m)0.940.140.130.040.04
−0.060.040.060.040.04
−1.060.040.050.030.05
UpwindArea (m2)12.860.080.080.030.13
8.570.070.090.050.06
4.290.050.100.090.18
Distance (m)4.900.220.050.040.05
3.650.070.070.070.07
2.350.040.190.030.10
Average 0.080.080.060.08
Table 3. Deviation of different control methods and model curves.
Wind DirectionTargetTarget
Value
PID Control ErrorFuzzy Control Error
DownwindArea (m2)15.120.0290.041
12.690.0640.105
10.250.0720.088
Distance (m)0.940.1060.042
−0.060.0610.041
−1.060.0490.046
UpwindArea (m2)12.860.0840.048
8.570.0490.071
4.290.0540.036
Distance (m)4.900.1430.048
3.650.0600.037
2.350.0700.039
Average 0.0700.053
Table 4. Wind vortex target control effect.
Wind DirectionTargetTarget
Value
Test ValueTarget Parameter Offset
PID
Control
Fuzzy
Control
PID
Control
Fuzzy
Control
DownwindArea (m2)15.1215.1515.170.030.05
12.6912.7512.000.06−0.69
10.259.9210.57−0.330.32
Distance (m)0.940.870.94−0.07−0.00
−0.06−0.030.020.030.08
−1.06−1.09−0.91−0.030.15
UpwindArea (m2)12.8612.8012.65−0.06−0.21
8.578.748.910.170.34
4.294.684.450.390.16
Distance (m)4.904.925.000.020.10
3.653.623.65−0.03−0.00
2.352.232.28−0.12−0.07
Table 5. Comparison of the absolute error of the target.
Wind DirectionTargetTarget ValueAbsolute Error
PID ControlFuzzy Control
DownwindArea (m2)15.120.160.22
12.690.430.70
10.250.530.22
Average (m2) 0.370.38
Distance (m)0.940.090.04
−0.060.200.13
−1.060.210.21
Average (m) 0.170.12
UpwindArea (m2)12.860.600.23
8.570.260.38
4.290.520.32
Average (m2) 0.460.31
Distance (m)4.900.130.12
3.650.110.06
2.350.370.08
Average (m) 0.200.09
Table 6. Variance of target parameter control.
Wind DirectionTargetTarget ValueVariance
PID ControlFuzzy Control
DownwindArea (m2)15.120.038 *0.074
12.690.252 *0.313
10.250.294 *0.471
Distance (m)0.940.0070.002 *
−0.060.0560.018 *
−1.060.0640.055 *
UpwindArea (m2)12.860.8360.035 *
8.570.070 *0.088
4.290.1970.115 *
Distance (m)4.900.2080.010 *
3.650.0260.007 *
2.350.0100.004 *
Disclaimer/Publisher’s Note: The statements, opinions and data contained in all publications are solely those of the individual author(s) and contributor(s) and not of MDPI and/or the editor(s). MDPI and/or the editor(s) disclaim responsibility for any injury to people or property resulting from any ideas, methods, instructions or products referred to in the content.

