Article

Fatigue Analysis of PTO Gearboxes in Paddy Power Chassis Using Measured Loads

1
Key Laboratory of Key Technology on Agricultural Machine and Equipment, South China Agricultural University, Ministry of Education, Guangzhou 510642, China
2
State Key Laboratory of Agricultural Equipment Technology, Guangzhou 510642, China
*
Author to whom correspondence should be addressed.
Agriculture 2024, 14(9), 1436; https://doi.org/10.3390/agriculture14091436
Submission received: 31 July 2024 / Revised: 20 August 2024 / Accepted: 20 August 2024 / Published: 23 August 2024
(This article belongs to the Section Agricultural Technology)

Abstract

:
This study aims to analyze the fatigue life of a PTO (power take-off) gearbox used in a paddy field power chassis. The analysis considers factors such as stress concentration, dimensions, surface quality, and load characteristics affecting fatigue life. A finite element simulation was conducted using the Ansys 2022 software to identify the critical point of the PTO shell. The modified nominal stress fatigue analysis method, incorporating a stress adjustment coefficient, was employed to derive the modified S-N curve. Combined with the measured load data of the PTO bench operation, the load data and the 3D model of the PTO shell were imported into the fatigue analysis software n-code to analyze the fatigue life of the PTO gearbox of a paddy field power chassis and compare it with the prediction results from the traditional stress field strength method. The findings indicate that the optimized stress adjustment coefficient method predicts a fatigue life (31,699 h) closer to the actual operational life (20,000 h) compared to the traditional method (39,151 h). This research contributes to the advancement of the analytical techniques for predicting fatigue life in critical components of agricultural machinery.

1. Introduction

The rapid advancement of agricultural mechanization has made the paddy power chassis a vital machine in mechanized rice cultivation. Central to its operation is the power take-off (PTO), which connects the power chassis to the operating machinery, influencing the quality of field operations significantly [1,2,3]. The PTO shell undergoes repetitive impacts over its operational lifespan, necessitating a thorough analysis of its fatigue life prediction. This analysis is critical to ensure that the paddy power chassis maintains optimal performance under real-world field conditions. It should address both the structural integrity of the chassis and its reliability across diverse loading scenarios, thereby ensuring its durability and operational dependability in field operations [4,5].
Fatigue life research has been a longstanding focus across various academic and professional domains, driving continual advancements. Zheng Jianqiang and Pei Bin utilized the M + P Analyzer dynamic analysis system and force hammer excitation to conduct modal tests on the gearbox shell and drive axle shell, respectively, comparing findings with finite element analysis for validation [6,7]. Zhang Lixiang et al. [8] characterized loads as random variables following a Gaussian distribution, exploring how variability in design parameters affects structural fatigue reliability. Feng Feiyan et al. used the reliability theory to establish the fault tree of PTO failure and analyzed the factors affecting the reliability of PTO [9]. Zhang Huaping explored a PTO design method dedicated to fire trucks through power matching and speed ratio selection [10]. Zhang Xiaomei employed external dry pneumatic friction technology to enhance the power take-off on the sprinkler, effectively resolving the issue of gears striking teeth when activating the sunlighters during travel [11]. In modern agricultural production, agricultural PTO shafts play a pivotal role in ensuring agricultural productivity. Their primary function is to efficiently transfer the torque from the tractor to a range of agricultural equipment. A significant proportion of this equipment, including seeders, presses, and mineral fertilizer distributors, relies on the transmission of torque and power to the operational components through mechanical transmissions via the PTO shafts and subsequent cardan shafts to ensure their optimal functionality. The PTO gearboxes, as well as the cardan joint gearboxes, are powered by the transmission of power via dual agricultural cardan shafts, etc., which, due to their inherent characteristics, exhibit a markedly low level of reliability [12]. Established fatigue life analysis methods include the nominal stress method (S-N method), the local stress–strain method (ε-N method), and the stress field strength method. The nominal stress and local stress–strain methods are straightforward to apply but rely on empirical formulas that offer limited insights into fatigue damage mechanisms [13]. The nominal stress method calculates fatigue life based on the nominal stress, stress concentration coefficient, S-N curve, and fatigue damage accumulation theory [14,15,16]. However, it overlooks actual stress–strain conditions in stress concentration areas, necessitating a stress adjustment factor to rectify these limitations.
This paper introduces a methodology for predicting the fatigue life of the PTO shell, utilizing a modified nominal stress–fatigue analysis approach incorporating a stress adjustment factor. Initially, a finite element simulation of the PTO shell identifies critical points prone to fatigue damage. Subsequently, the actual loads at these points are measured to establish a load–time history during operational conditions. The fatigue life analysis employs measured data and integrates the nominal stress fatigue analysis method with a stress adjustment coefficient, facilitated by the nCode 12.0 fatigue analysis software. A comparative evaluation with the results from the traditional stress field strength method and actual fatigue life validates the accuracy of the proposed fatigue life analysis approach. The innovation of this study is to combine the stress-adjustment-coefficient-modified nominal stress fatigue analysis method with the fatigue analysis software nCode to predict the fatigue life of the PTO shell portion, a key component of the paddy power chassis, and to provide a basis for the service life of the PTO and the direction in which it can be optimized.

2. Simulation Analysis

The finite element analysis of the gearbox structural dynamics was conducted, and the simulation results were subsequently analyzed. This was done in order to establish the simulation evaluation indexes. The flow chart of the simulation process is shown in Figure 1.

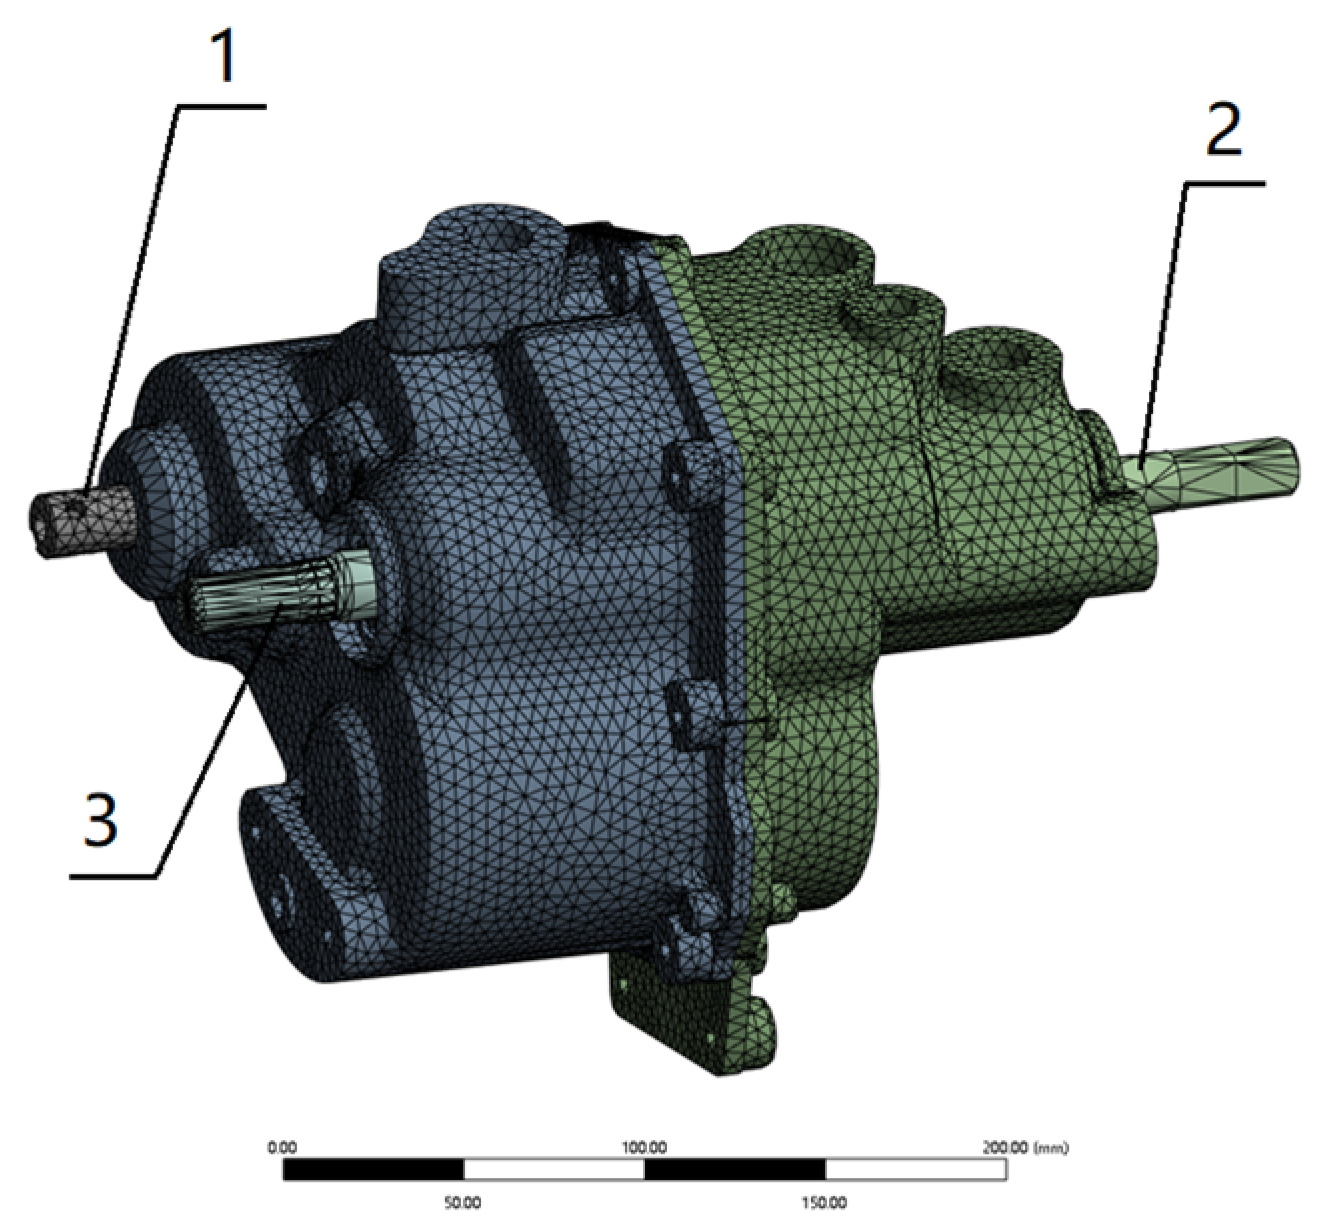
2.1. Finite Element Modelling

The SolidWorks 2018 software was employed for the creation of three-dimensional geometric models and the assembly of the shift rotor shaft, shift fork, and PTO gear case body. The 3D models were imported into the geometry module of ANSYS Workbench in the Parasolid format. The initial structural simplification of the geometric model was conducted using the space claim (SC) tool. Subsequently, meshing operations were conducted in the Model module with the objective of refining the mesh in order to focus on areas susceptible to stress concentration and contact nodes [17]. In accordance with the findings of the finite element analysis of structural dynamics, the finite element model of the PTO gearbox body was subdivided into 18,927 nodes and 96,982 cells, with a mesh size of 5 mm. The resulting model is illustrated in Figure 2.

2.2. Parametric and Simulation Design of Experiments

After completing the design of the gearbox body, according to the analysis of the needs of its actual structure, it was necessary to focus on the key performance indicators such as wear resistance, light weight, and high stiffness. For this reason, the 6061-T6 aluminum alloy was chosen as the material for this study. This material has a significant wear resistance and excellent rigidity characteristics, which fully meet our performance requirements for gearbox materials. The simulation parameters of the gearbox body are shown in Table 1.
The transmission body directly affects how reliably the gears shift, so we conducted a simulation test focusing on its structure to understand its dynamics [18,19]. The conditions for the test were:
(1) According to the above analysis, the input shaft torque range of the shift fork system was 0–30 N·m, and the input function is shown in Figure 3;
(2) Selection of the shift process 1-2-3-4-5-6 positive shift gear, setting of the input shaft speed of the transmission body to 700 rad/min, and setting of the boundary conditions as shown in Table 2 to perform simulation tests [20].

2.3. Simulation Evaluation Indicators and Analysis of Results

The simulation evaluated the total structural deformation and stress distribution, considering the response of the paddy power chassis PTO gearbox to its operational vibrations. The analysis assumed free vibration without damping, as described by the equations:
[ M ] { d ( d u d t ) d t } + [ K ] { μ } = { 0 }
where [M] is the mass matrix, [K] is the stiffness matrix, {μ} is the vibration mode at the intrinsic frequency, and {d(du/dt)/dt} is the acceleration under vibration deformation, m/s2.
A modal analysis determined the natural frequencies of the gearbox during shifting, crucial for establishing appropriate time steps in transient dynamic analysis [21]. The equation for the intrinsic frequency of the structure with respect to the natural frequency is as follows:
f = w 2 π
where W is the intrinsic frequency of the structure, Hz, and f is the natural frequency, Hz.
The equations for the transient kinetics are as follows:
[ M ] { d ( d s d t ) d t } + [ C ] { d s d t } + [ K ] { s } = { F ( t ) }
where [C] is the damping matrix, {s} is the displacement vector, m, {ds/dt} is the velocity vector, m/s, d(ds/dt) is the acceleration vector, m/s2, and {F(t)} is the input force vector, N.
The results of the modal superposition transient dynamics analysis are shown in Figure 4. The maximum deformation of the gearbox body was  5.35 × 10 3  mm, and the maximum equivalent stress was 779 Pa, which was set to an equivalent value of 50 N in this simulation test, although the effect of this magnitude on the purpose and results of this simulation test was negligible.
The total deformation and equivalent stress distribution maps of the PTO gearbox body in the paddy field power chassis were analyzed. Critical stress concentrations were identified primarily along the outer walls of the shift rotor, input shaft, and intermediate shaft. These components serve to bear and constrain loads, restricting lateral movements and enduring impacts from gear meshing and friction during power transmission, leading to maximal stress concentrations. The results from the finite element dynamic simulations aligned closely with the anticipated outcomes.
Following the analysis, six critical nodes on the gearbox body (depicted in Figure 5) were selected for strain testing using the MCC-DAQ system to acquire fatigue load spectra from prototype gearshifts. The test results were analyzed to validate the accuracy of the simulation findings.

3. Experiment and Analysis

In ANASYS Workbench, the modal superposition transient dynamics method was employed to simulate and evaluate the finite element model of the gearbox body, with the objective of identifying potential hazardous points. Subsequently, the MCC-DAQ strain gauge test device was utilized to assess the identified hazardous points, thereby obtaining the nominal stress load spectrum. Lastly, a fatigue life analysis was conducted in the nCode GlyphWorks 12.0 software. The results demonstrate that the correction factor method is more effective than the other methods, namely the correction factor nominal stress method, the nominal stress method, and the traditional stress field strength method. These methods were employed for comparison with the actual fatigue life.

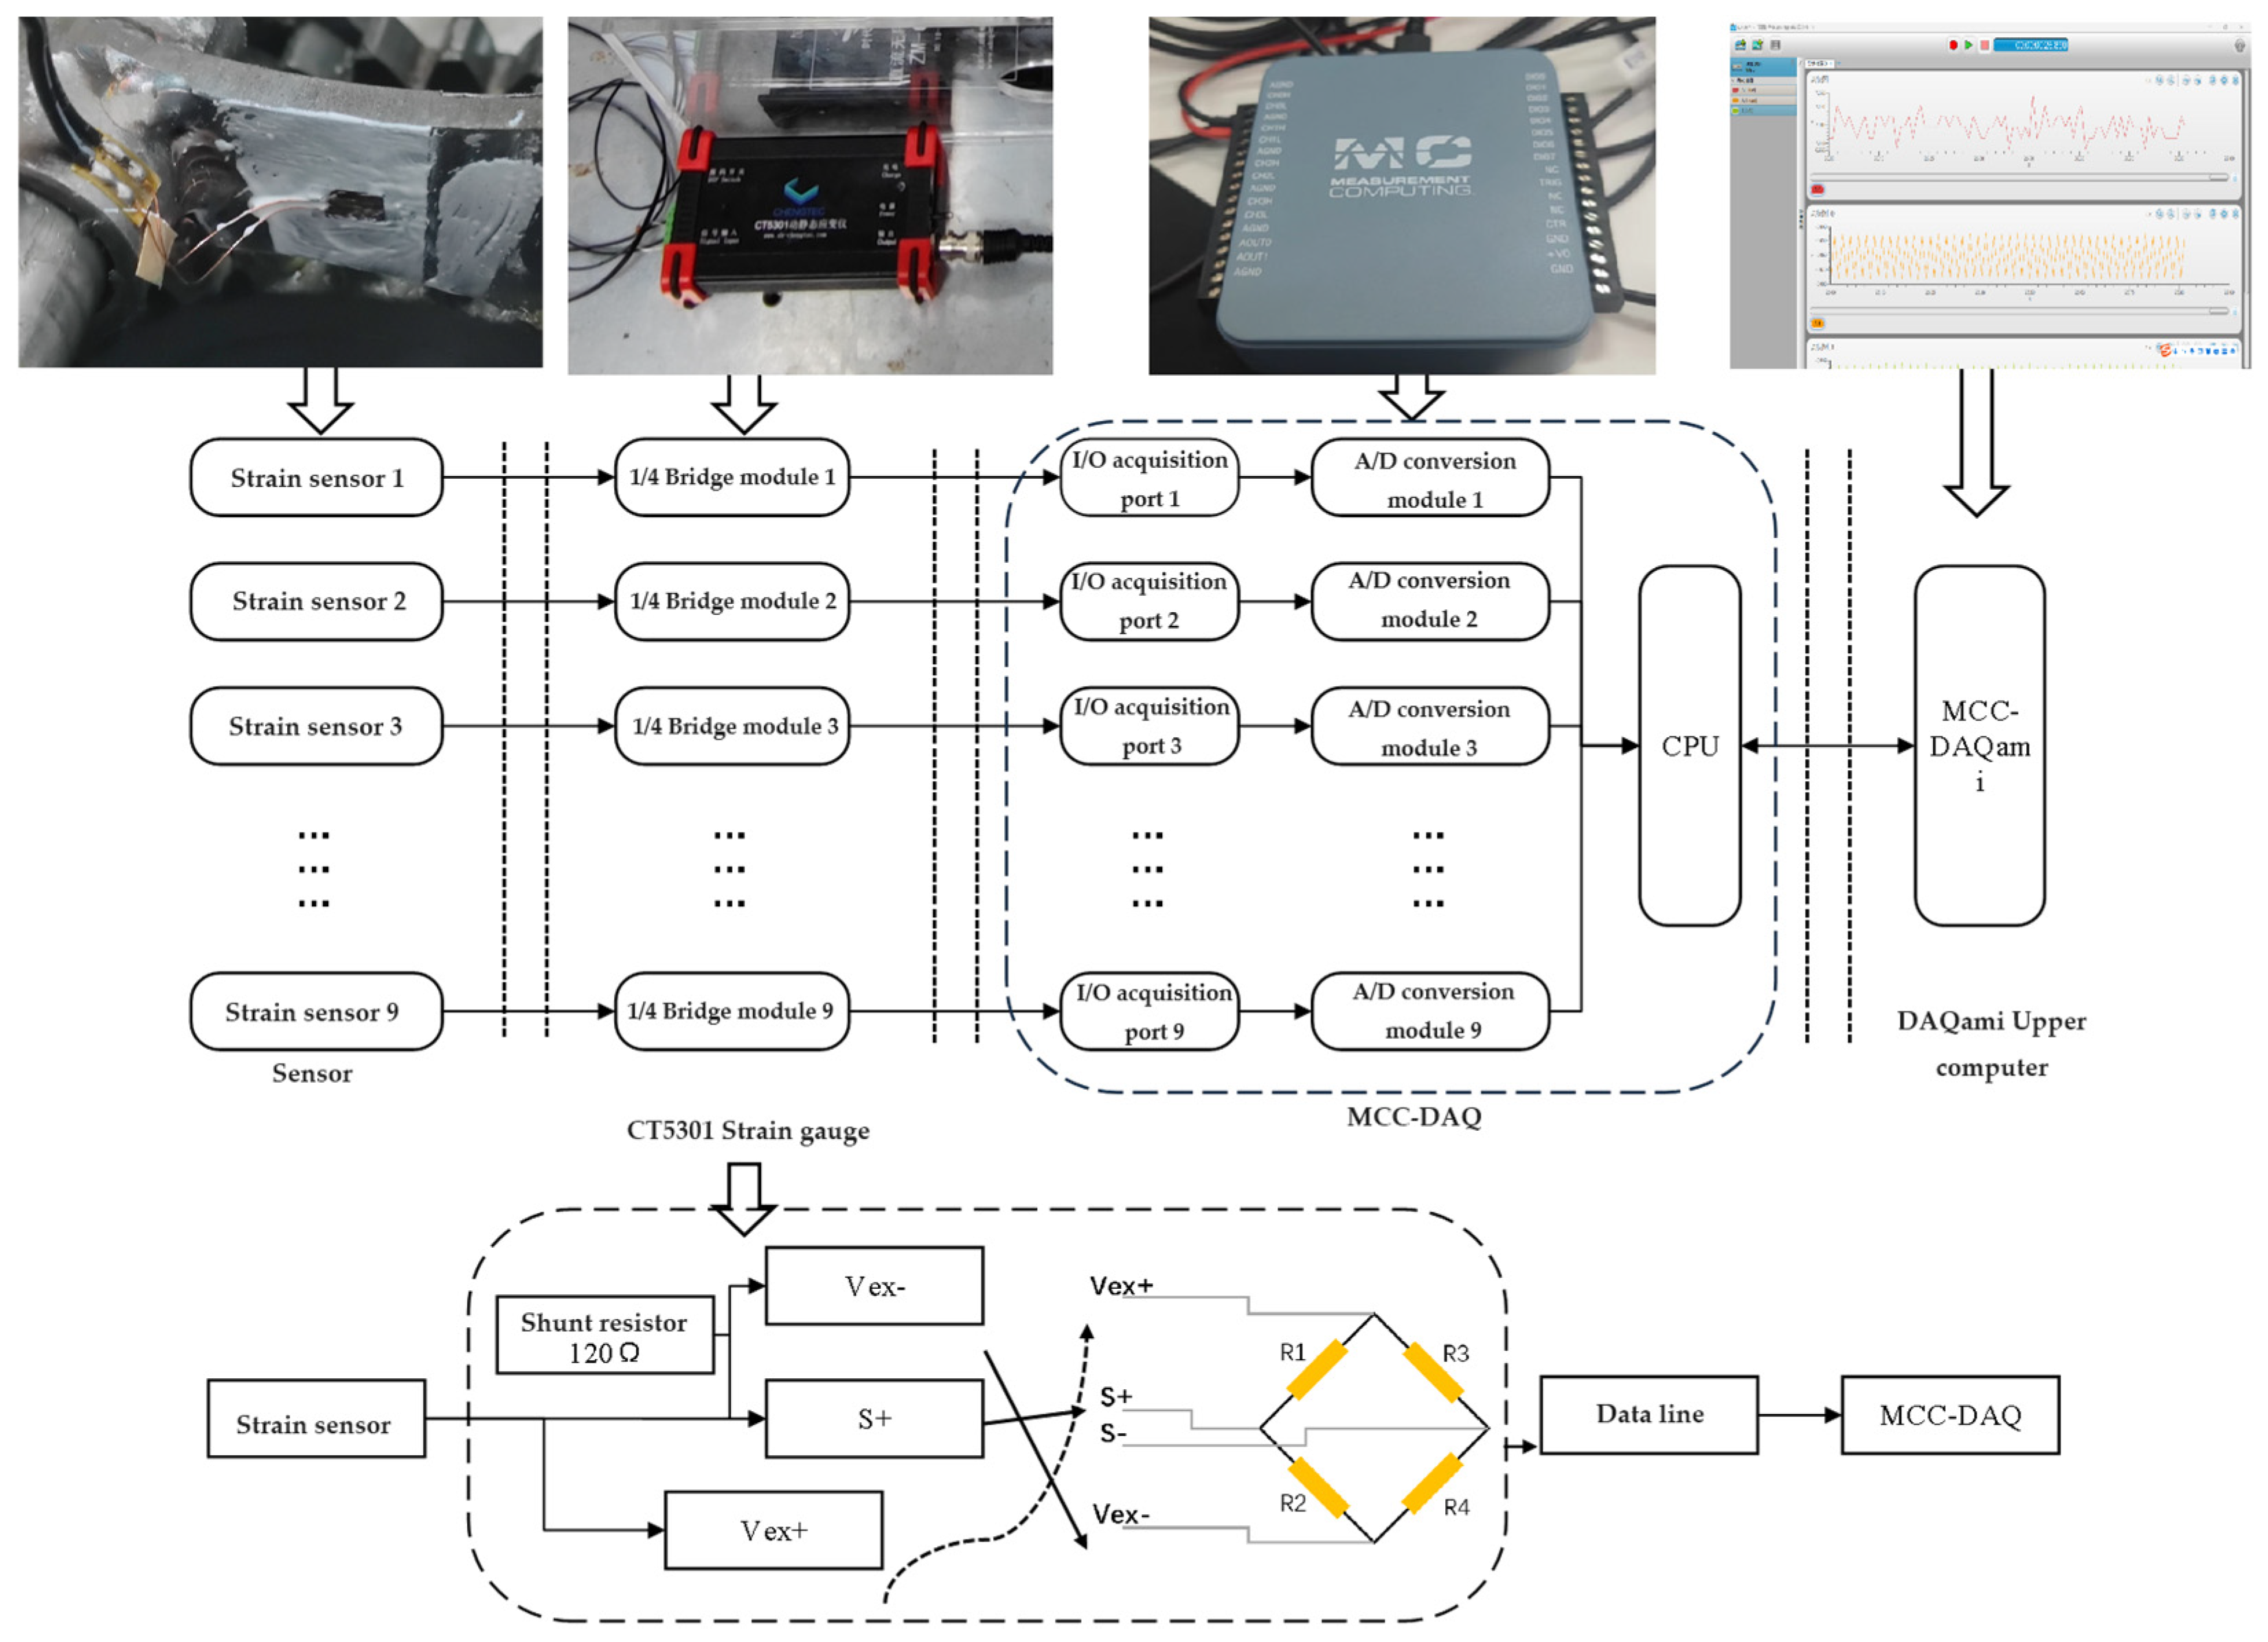
3.1. Test Instruments and Equipment

The gearbox body functions as a supporting and limiting structure for the gearbox drive shaft. During frequent shift tests, impacts and hysteresis introduce local stress concentrations and affect the overall smoothness of gearbox transmission, necessitating the collection of actual fatigue load data from the gearbox body. The fatigue load acquisition system comprises strain sensors, CT5301 dynamic and static strain gauges, an MCC data acquisition card, and an MCC-DAQami host computer software, illustrated in Figure 6. The CT5301 gauges operate by providing strain measurements in a bridge circuit configuration, with a 1/4 bridge circuit chosen for this specific test. Data collected by the CT5301 gauges are transmitted to the MCC data acquisition card, where signals undergo amplification, filtering, and computational processing using the MCC-DAQami v1 software for subsequent data analysis and export.
According to Nyquist’s sampling theorem, the sampling frequency during testing should be at least twice the highest frequency of the signal being analyzed. In this study, a sampling frequency of 1000 Hz was selected based on the equipment’s highest operational characteristics. The principal stresses at the nine strain test points were accurately determined and, therefore, the Model 120-3AA uniaxial strain transducer was employed for testing. These strain transducers were applied at six specific points on the PTO gearbox body, as illustrated in Figure 7, utilizing a sensor patch for optimal contact.

3.2. Measured Load Collection for Shift Operations

The testing was conducted at the Teaching and Research Base of South China Agricultural University, Guangzhou, China, in February 2024, with an average temperature of 25 °C. The prototype underwent fatigue load acquisition tests primarily under three gradual shift conditions, two inter-gear shifts and one full-gear shift, all at a gearbox input speed of 500 rpm. These tests simulated real sowing conditions by applying a load equivalent to that of a perforated planter and 2 kg of rice seeds across six shift scenarios. Figure 8 displays signals collected from select test points during each testing condition.

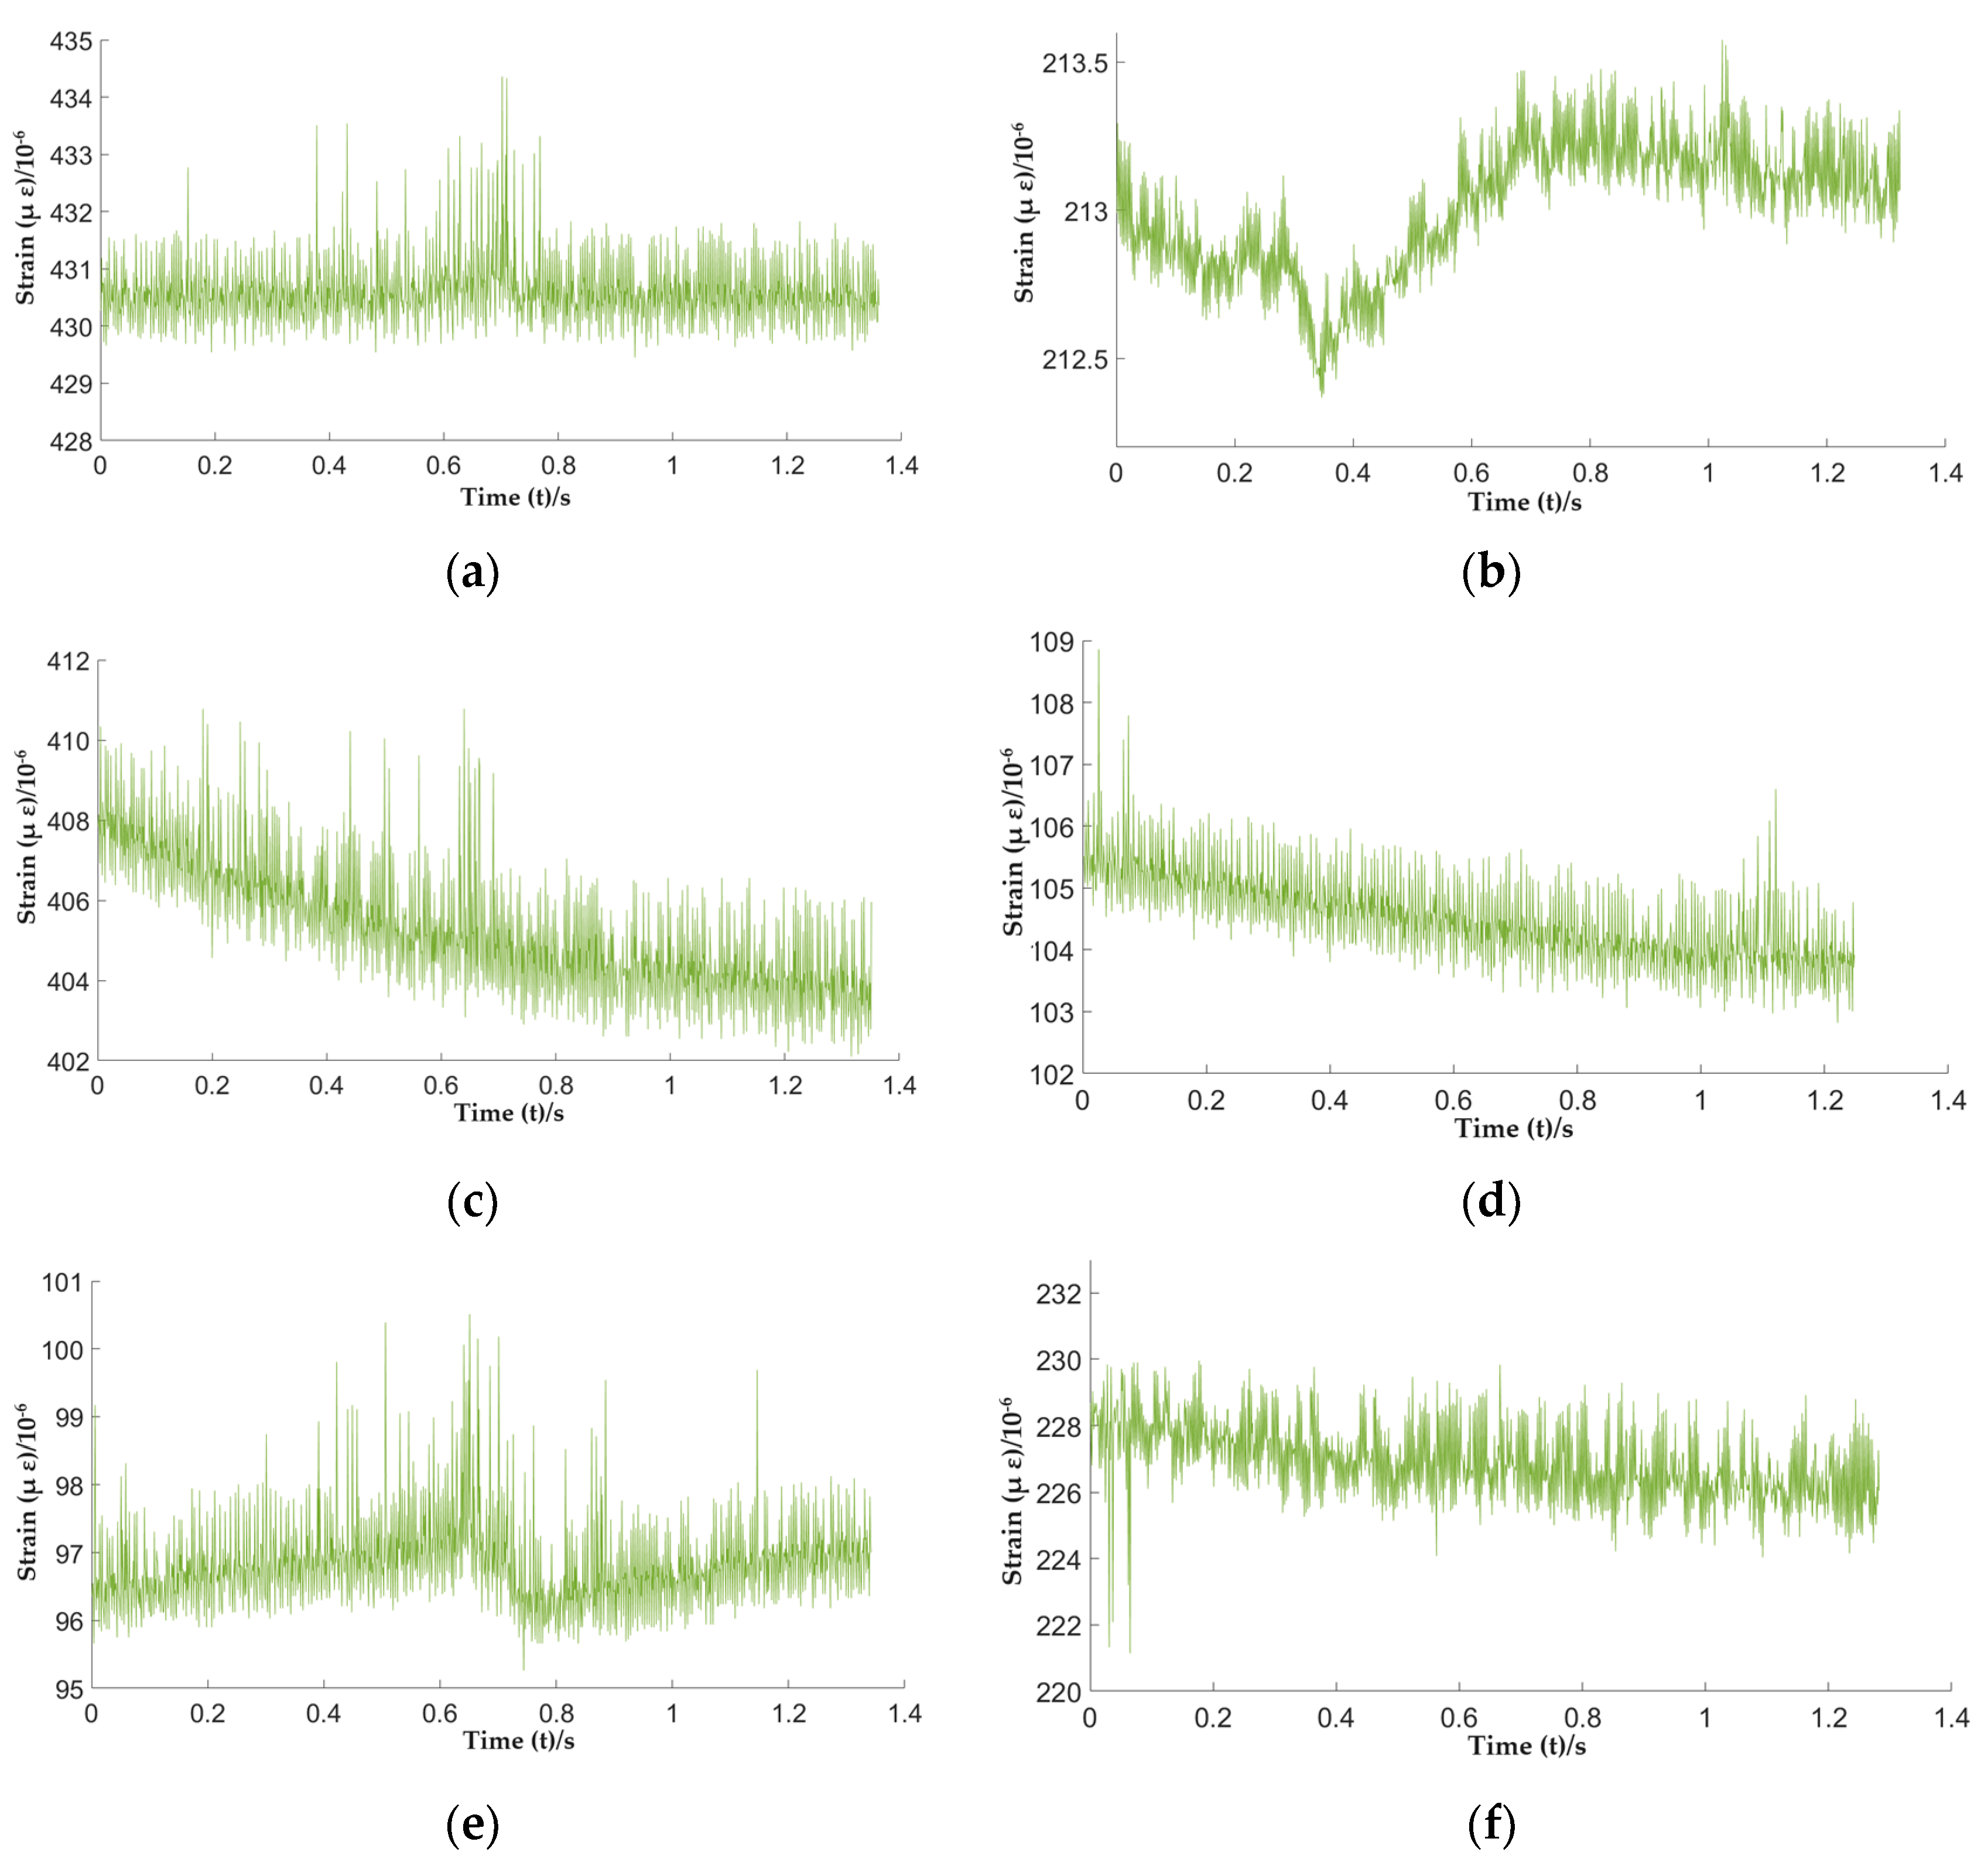
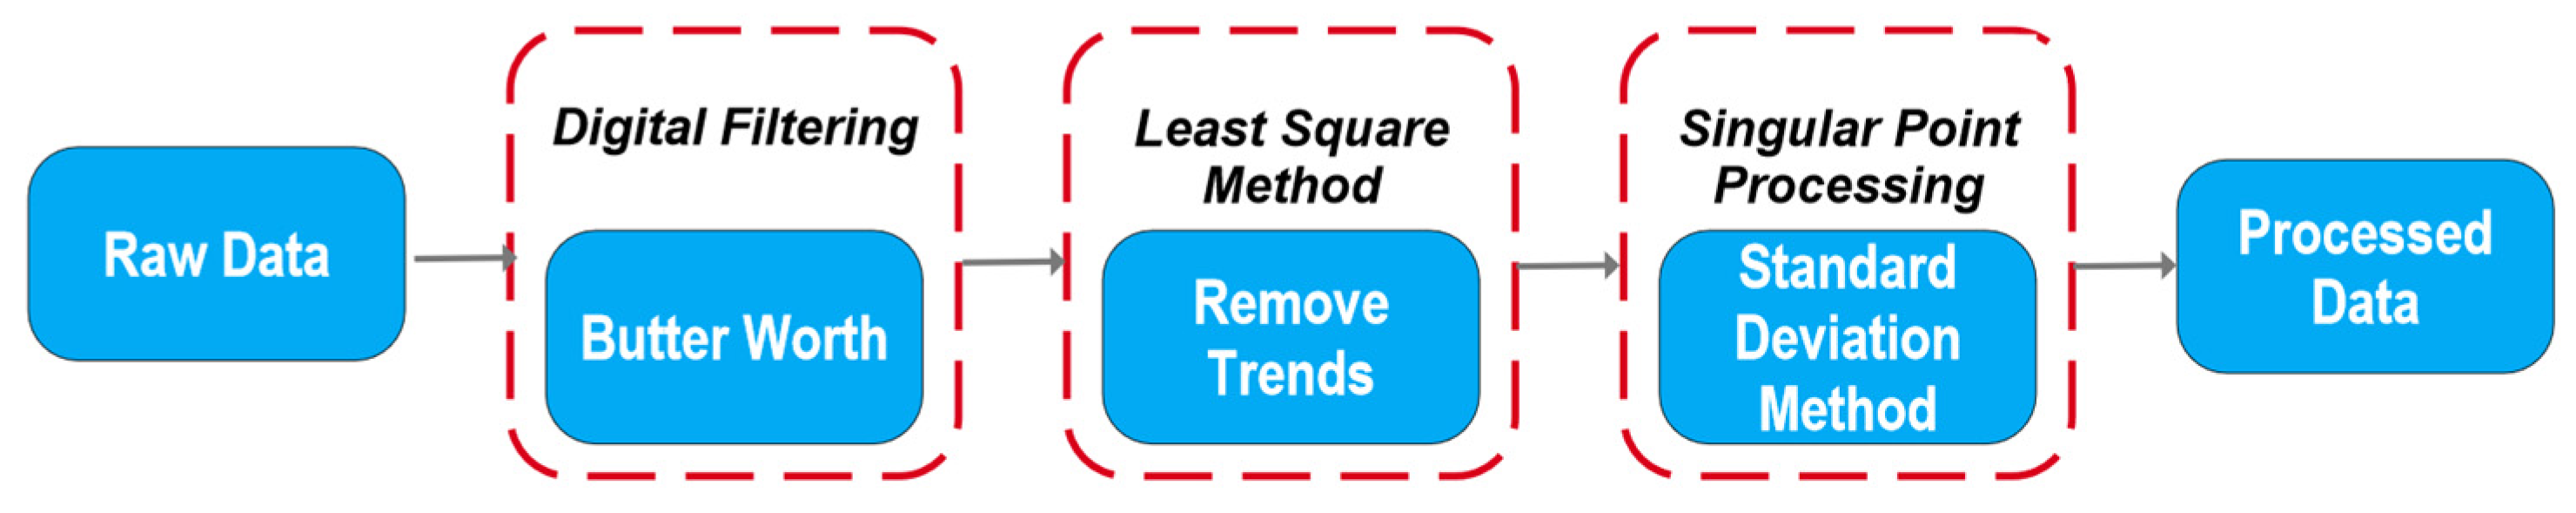
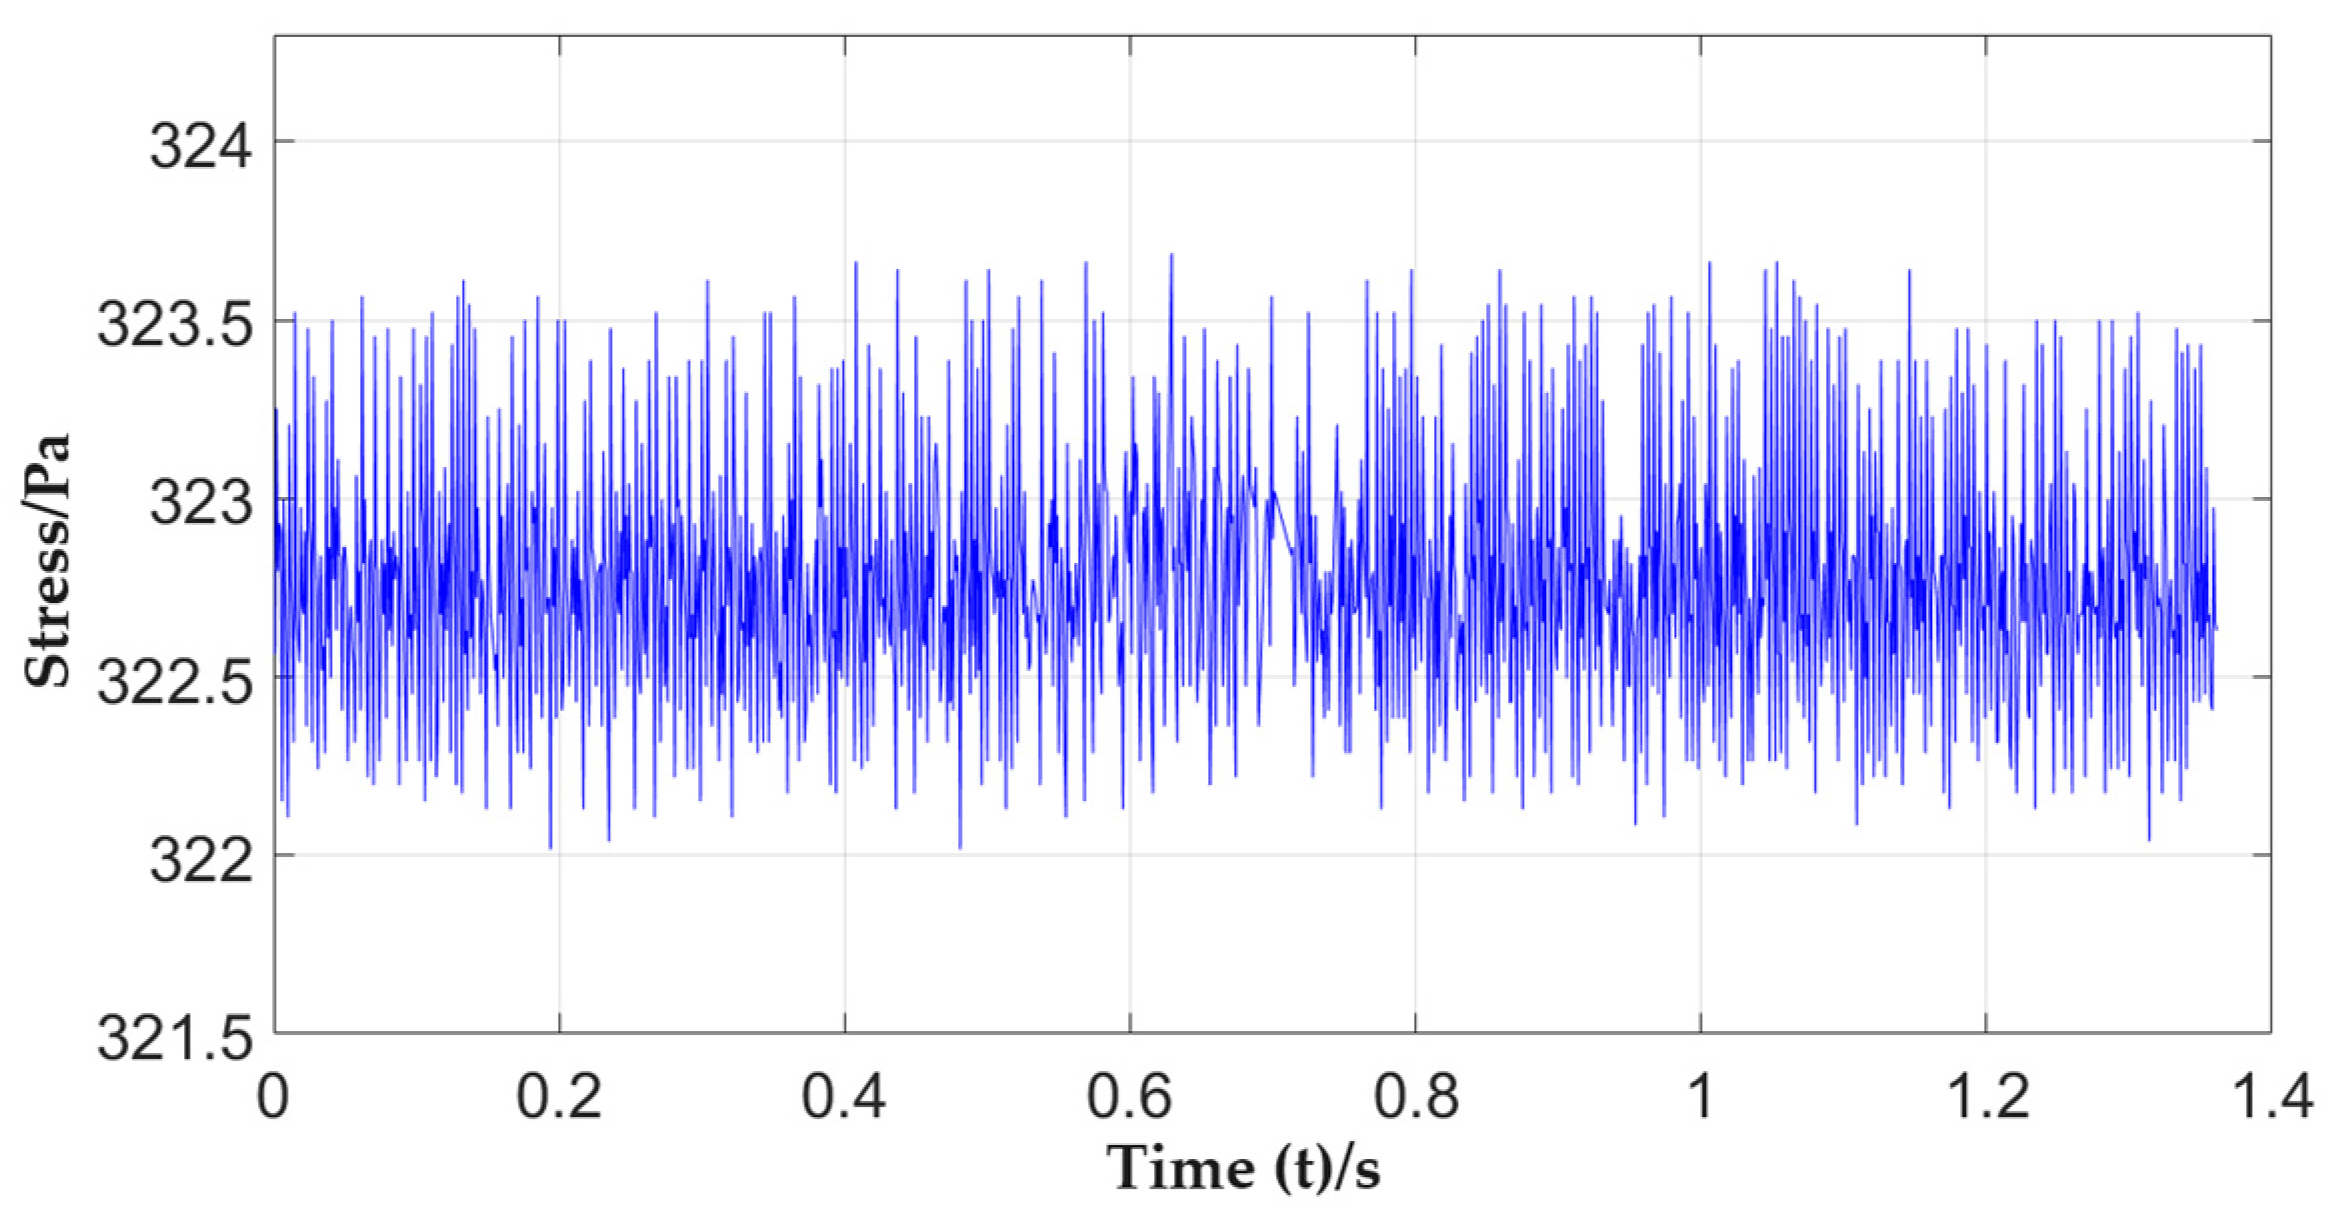
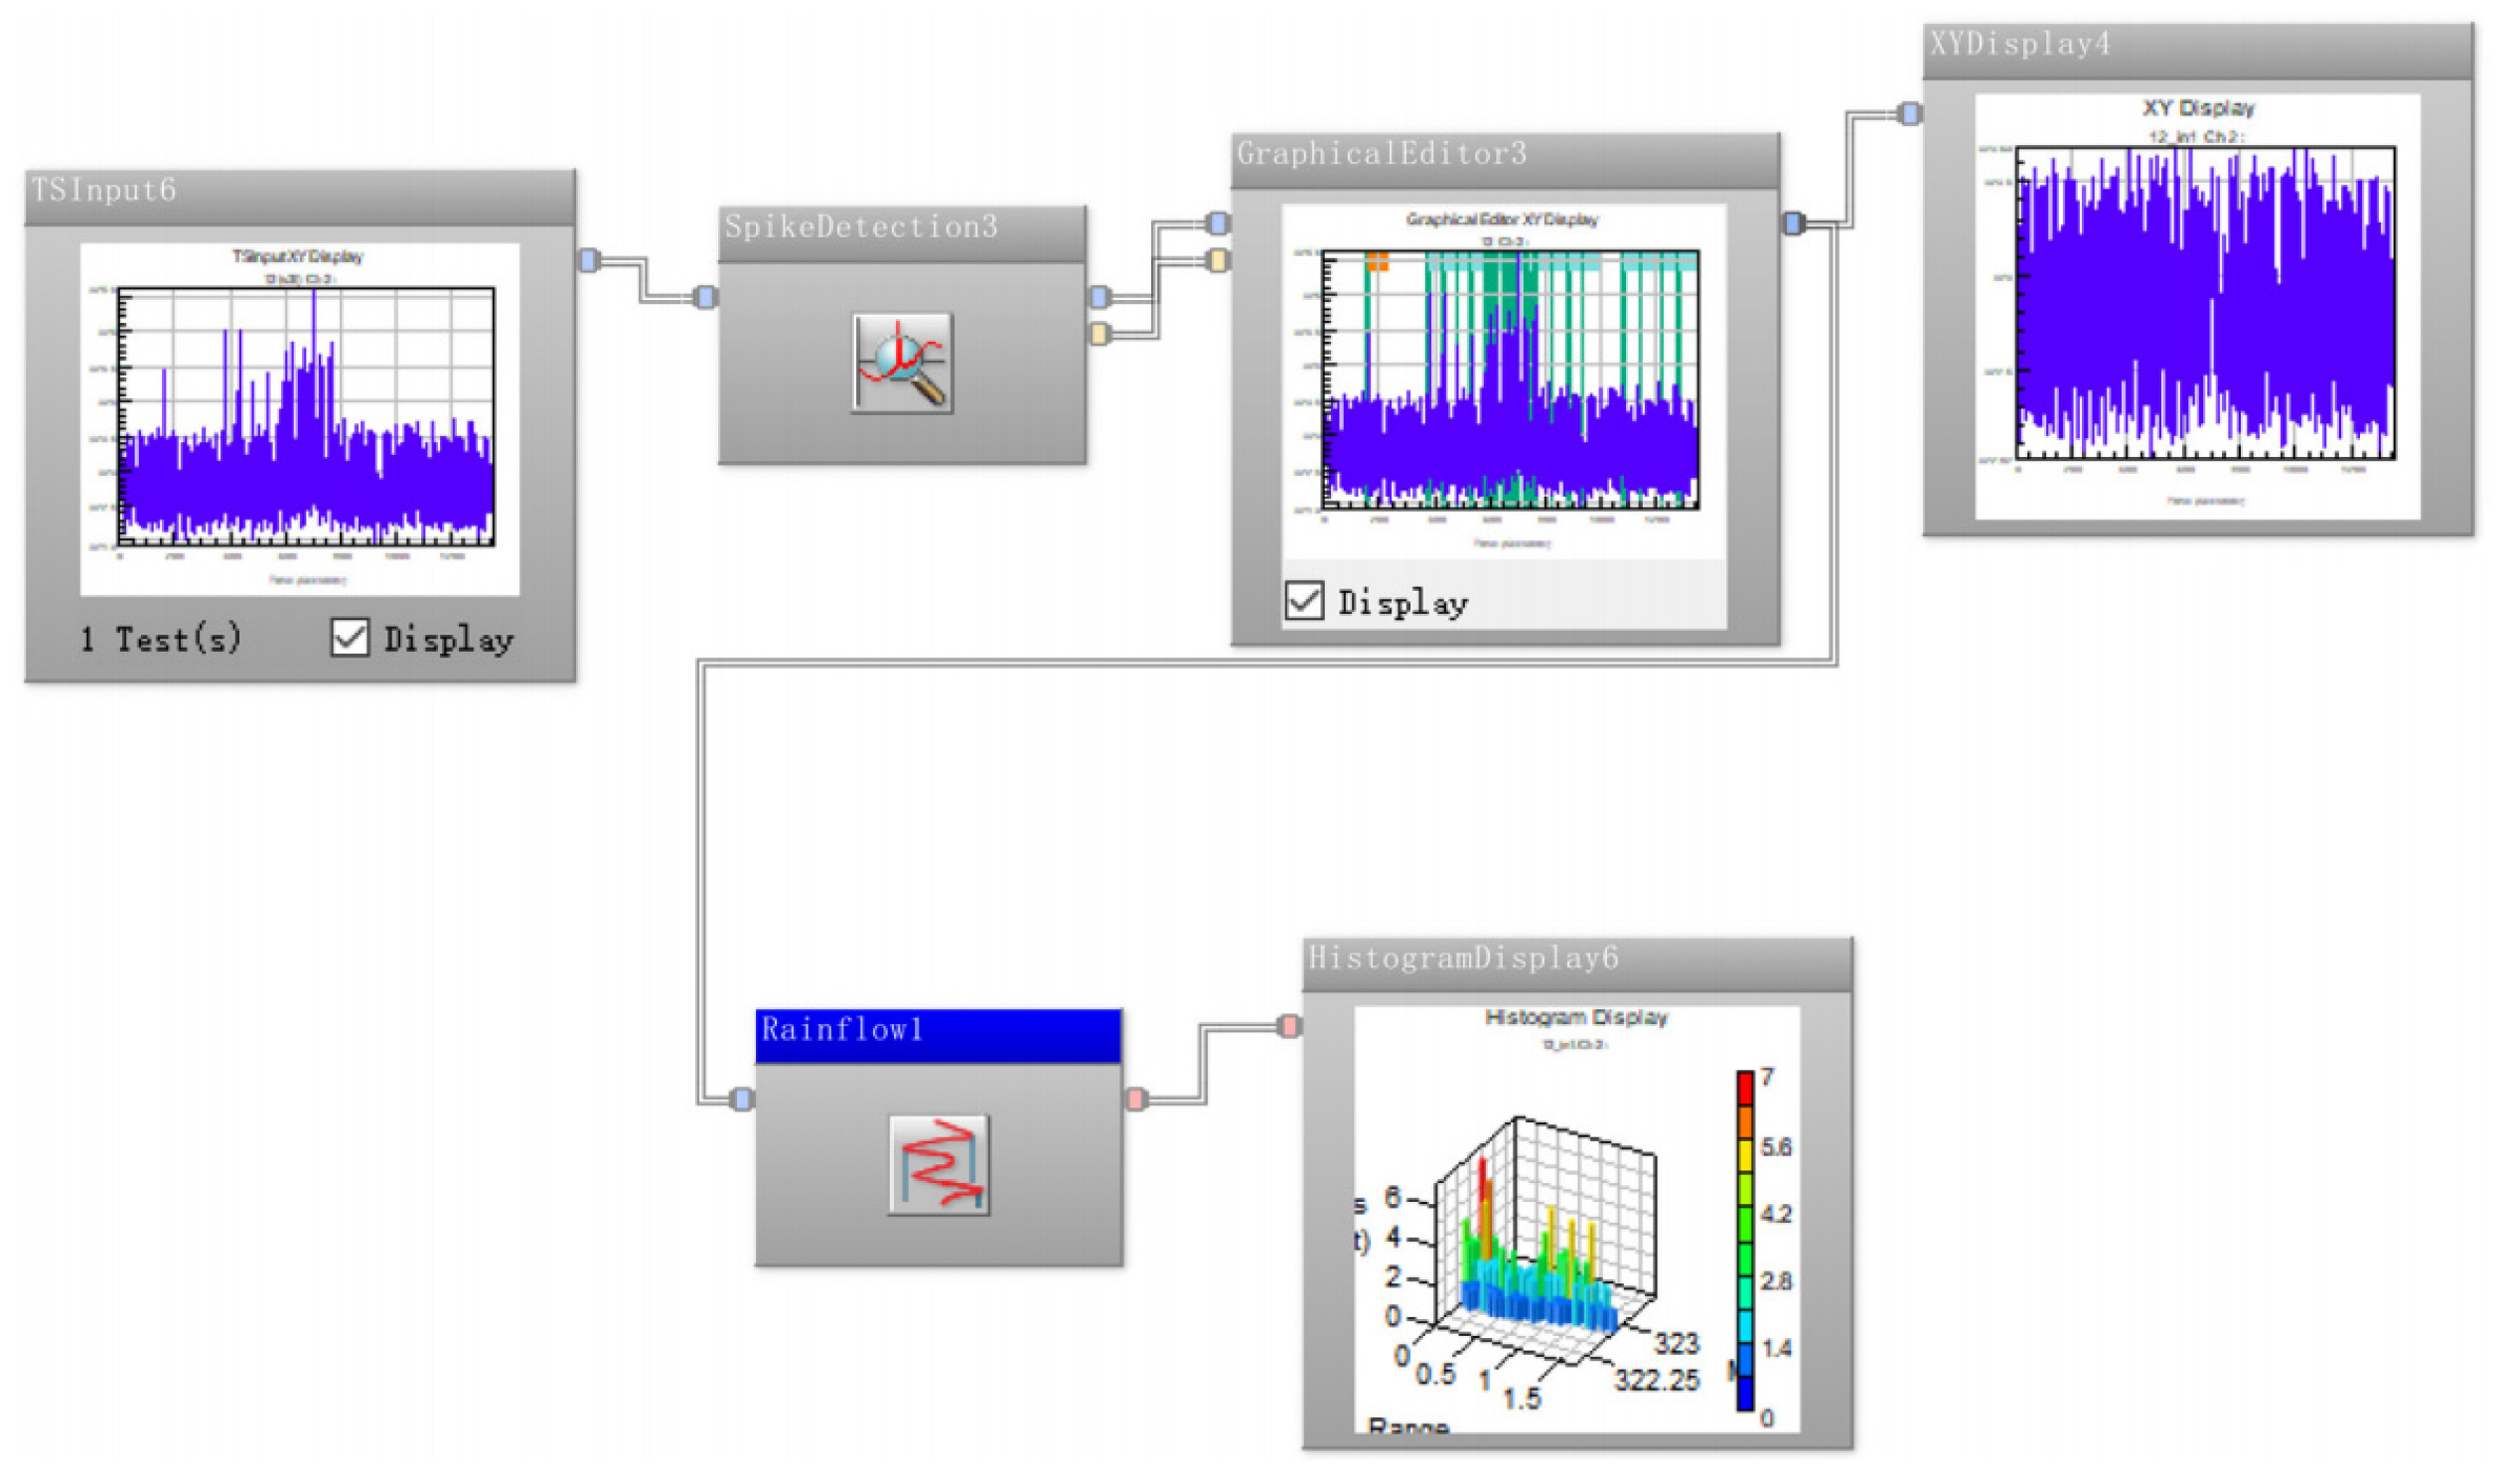
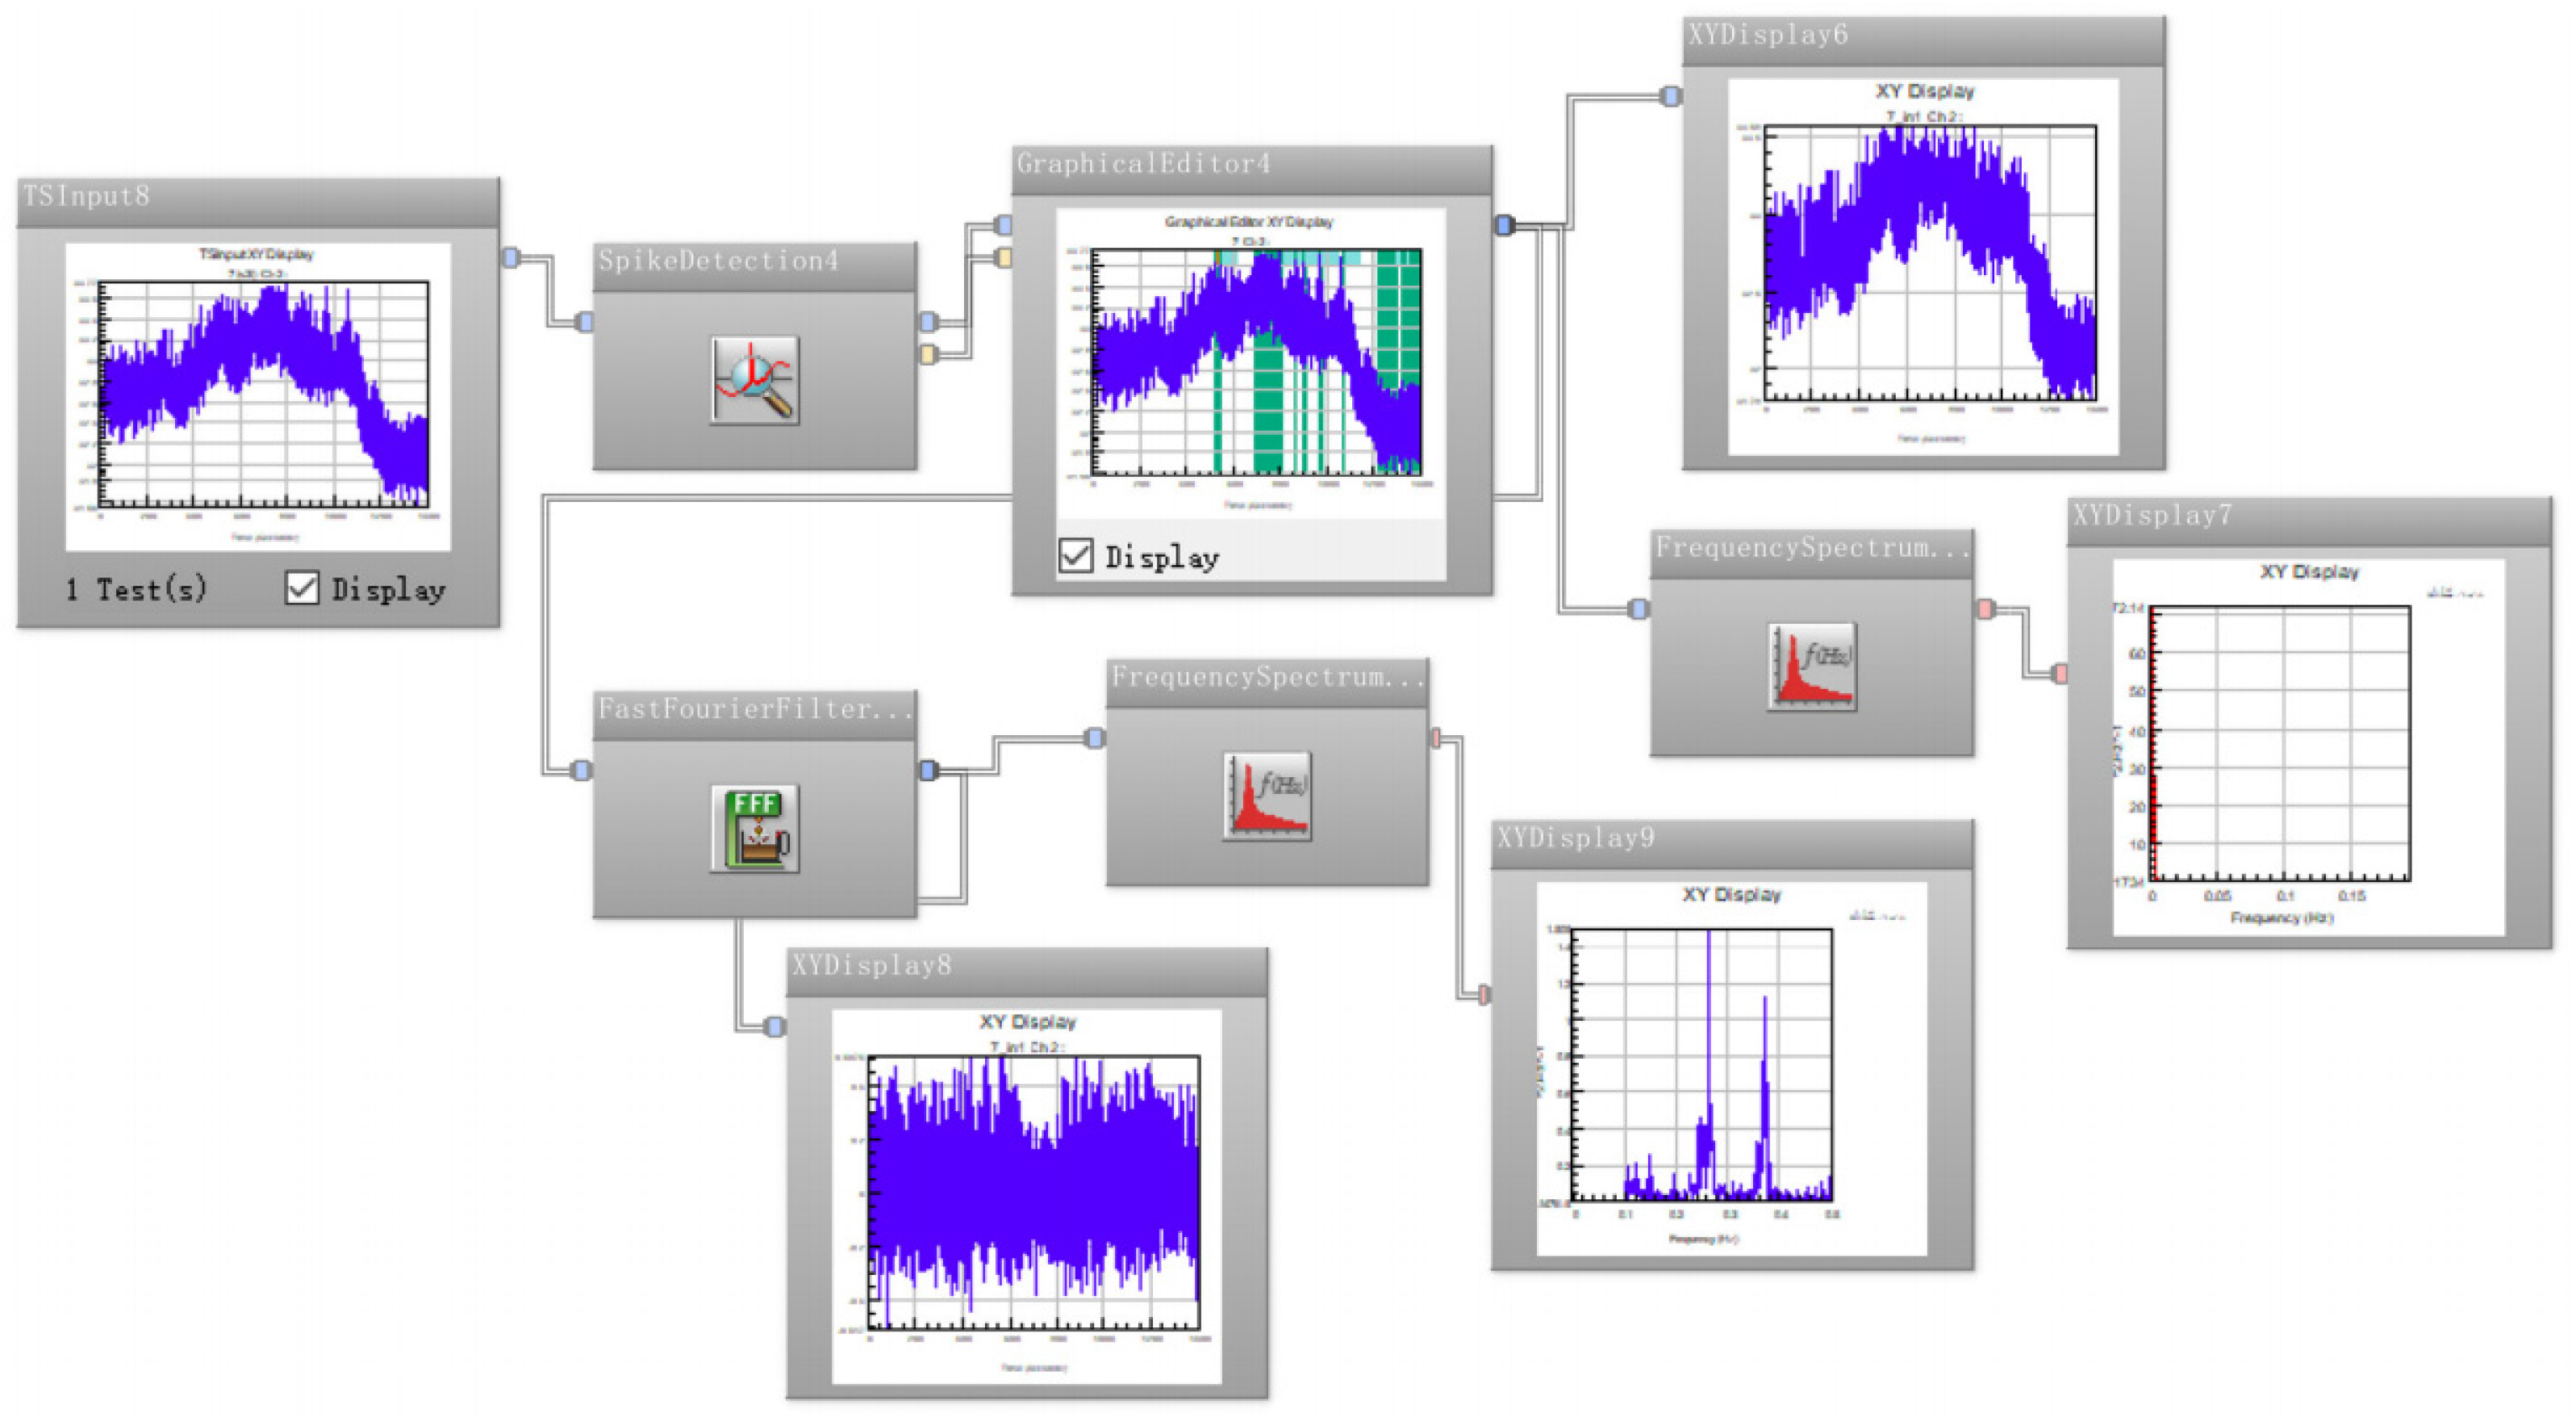
3.3. Analyzing and Calculating Measured Load Data

Based on the relationship between nominal and measured stresses, the measured stresses under linear elastic deformation were calculated in conjunction with Hooke’s law and the data were characterized. The strain is proportional to the stress at the initial stage of deformation for both the rotor fork system and the PTO gearbox body by the coefficient of elasticity E of the material, and the nominal stress  σ a  is:
σ a = E ε e ε
where  σ a  is the nominal stress, MPa or Pa,  ε  is the measured strain, and E is the modulus of elasticity of the material, MPa or Pa.
The accuracy and usability of the measured load of each measurement point of the PTO gearbox body were analyzed, and the eigenvalues of the maximum nominal stress, minimum nominal stress, equivalent average stress, standard deviation, variance and so on of each measurement point under six typical working conditions, alongside the eigenvalues of the load of each measurement point of the PTO gearbox body, are shown in Table 3. The results from the PTO gearbox body load test were used to determine the average nominal stress of the largest measurement point data as the fatigue analysis and fatigue life prediction of the measured data basis.
This test rigorously replicates the operational conditions of the power take-off transmission in paddy power chassis during field operations. The shifting process adheres seamlessly to the control logic programmed, ensuring smooth transitions within specified timeframes. The strain load data collected during testing exhibited characteristics such as large amplitude, time variation, and randomness. Thus, this test holds significant importance for the comprehensive fatigue analysis of the multicomponent transmission system.
Based on the test results, the data from patch 1 stand out as particularly noteworthy, generally corroborating the findings from the simulations. Located at the far end of the fixed section of the PTO gearbox, on the outer wall of the shift rotor shaft, patch 1 primarily supported, secured, and restricted the movement of the shaft in all directions. It bore the brunt of the shift rotor shaft’s forces during operation, resulting in the highest stress levels and deformation, as depicted in Figure 9. Consequently, subsequent fatigue analyses of the PTO gearbox body in the paddy field power chassis focused primarily on the measured load data from patch 1.

4. High Frequency PTO Gearbox Fatigue Analysis Method

4.1. Fatigue Analysis Theory

The PTO electronically controlled shift control mechanism is mainly driven by the shift motor, with the shift rotor shaft and shift fork subjected to a small shift force, and the fatigue problem of the rotor shaft type mechanism under small shift force belongs to the category of high cycle fatigue analysis (the number of cycles is greater than  10 6 ). High cycle fatigue analysis mainly solves the uniaxial stress fatigue and multiaxial stress fatigue of the components. Since the magnitude and direction of the cyclic load on the core components of the electronically controlled shifting mechanism can be determined, the fatigue analysis of the core components of the PTO shifting mechanism is based on the uniaxial stress fatigue theory, which is the most mature amongst the current developments, for predicting the service life.
The nominal stress spectrum of the dangerous nodes of the component under the measured fatigue load is compiled by the rain flow counting method, combined with the S-N curve of the component, and the life of the component is estimated according to the fatigue life prediction method; the fatigue life prediction process is shown in Figure 10 [22].
Several primary methods are employed in the study of high-cycle fatigue in structures, including the stress field strength method, local stress–strain method, damage tolerance method, and nominal stress method. The nominal stress method assesses structural fatigue life by analyzing stress amplitudes and average stresses, relying on nominal stress values. This approach offers high reliability and ease of application, making it particularly suitable for uniaxial load fatigue analysis of different components [23].
The expression equation of the nominal stress method is:
σ = σ a ( 1 + ε a )
where  σ  is the measured stress of the component, Pa,  σ a  is the nominal stress, Pa, and  ε a  is the nominal strain.
Within the uniaxial stress state range, the relation between the component strain  ε  and the nominal strain  ε a  under the applied load F can be expressed as follows:
ε a = e ε 1
where l is the deformed length of the material test piece under a load F, mm, and l0 is the initial length, mm.
Within the range of linear elastic limit deformation, the stress–strain relationship of the material follows Hooke’s law, i.e.,:
σ = E ε
where E is the intrinsic modulus of elasticity of the material which can be obtained from the relevant material manuals.
From the nominal stress expression equation, the nominal stress  σ a  at this time is:
σ a = E ε e ε
At this time, the relation between nominal stress  σ a  and strain  ε  of the components under the fatigue load is established, and the nominal stress spectrum of the dangerous nodes of the components under the fatigue load is prepared by rain flow counting method [24].

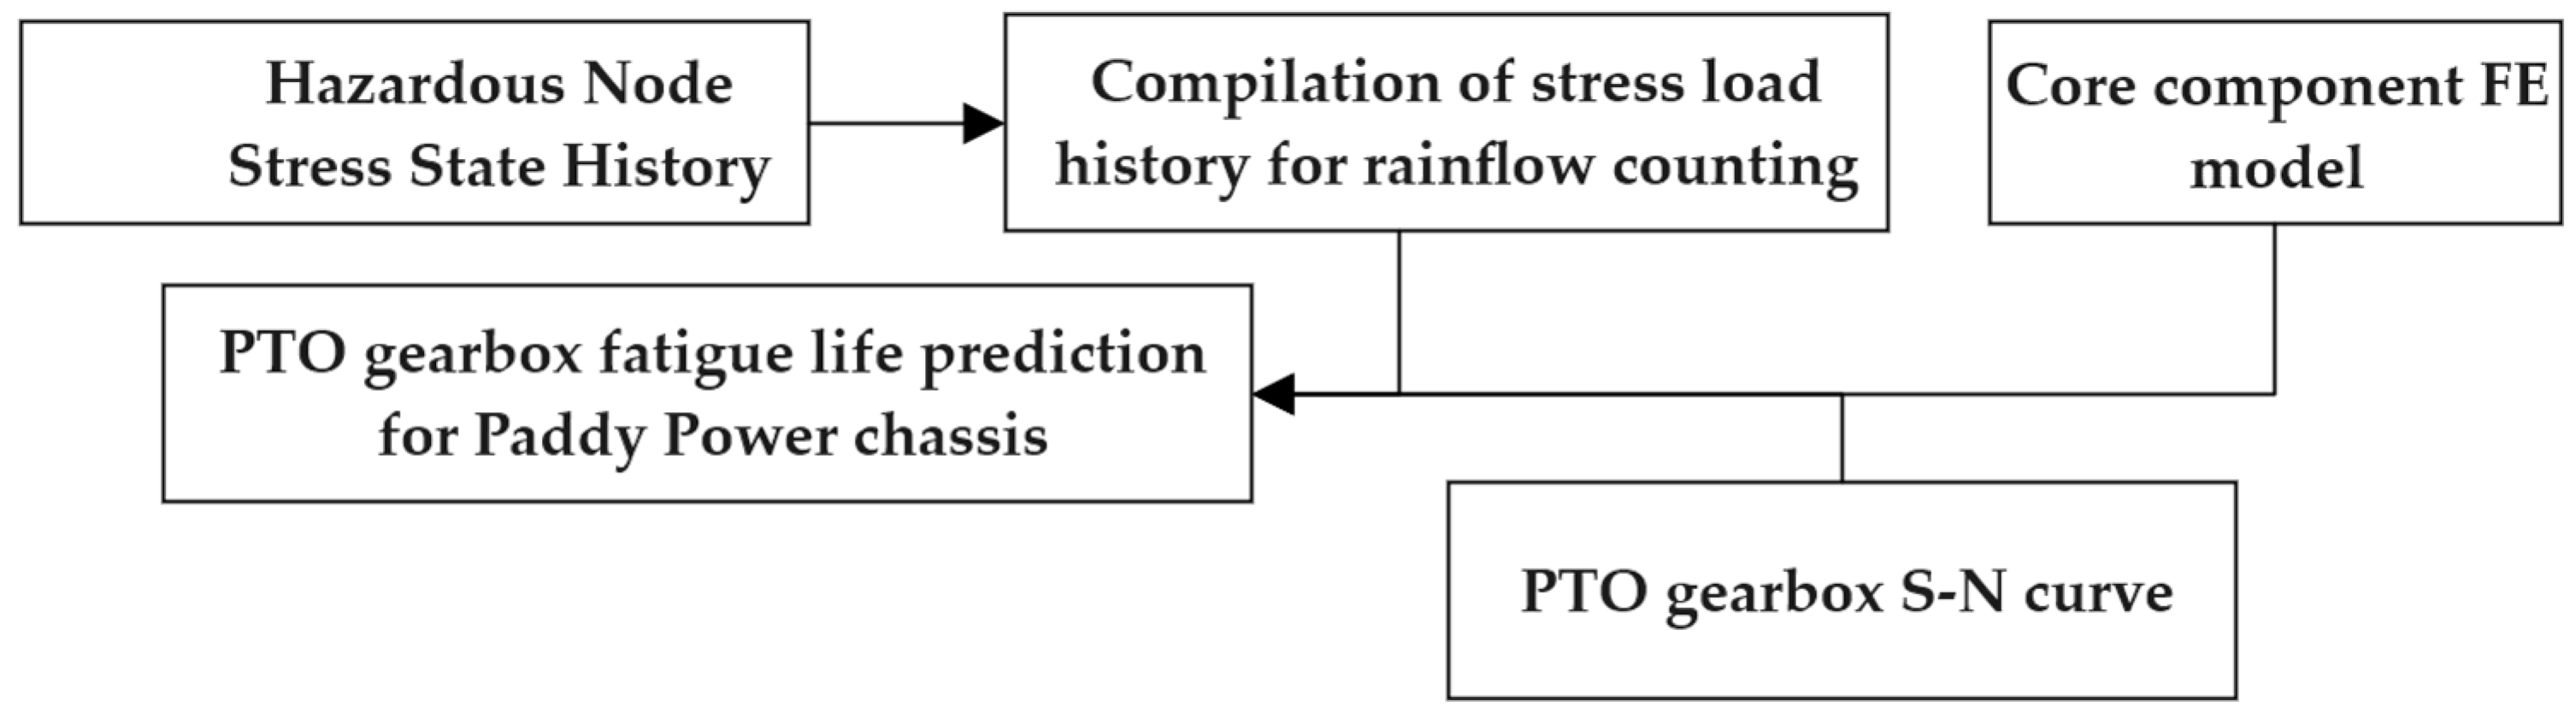
4.2. Methods for Predicting Fatigue Life

The shift control logic of the power take-off (PTO) of the power chassis determines the magnitude and direction of the cyclic loads to which the shift spindle is subjected. In most cases, the cyclic loads on the shift spindle and shift fork are of variable amplitude, which is more akin to random loads, but it is certain that the stresses on the shift spindle and shift fork during a shift stroke are predictable, including the magnitude and direction of the load. At this time, if the components are subjected to loads higher than the fatigue limit of the material, each cyclic load will cause damage to the parts, and this damage can be cumulative, so the fatigue life prediction of the shift spindle and shift fork can still use the linear fatigue damage accumulation law.
The stress amplitude of each segment of a four-step variable-amplitude stress spectrum is  σ n 1 σ n 2 σ n 3 , and  σ n 4 , and the fatigue life of the part corresponding to the cyclic loading at different stress amplitudes in each segment is  N f 1 N f 2 N f 3 , and  N f 4 , respectively:
N f 1 + N f 2 + N f 3 + N f 4 = N
where N is the fatigue life of the component.
However, since the relationship between the fatigue life of the component and the stress amplitude under each stress amplitude is not necessarily linear, so that the actual number of cycles of the cyclic loading of the component under each stress amplitude is different from the fatigue life of the component for  N 1 N 2 N 3 N 4 , then the fatigue damage degree of the corresponding component under each stress amplitude is N/Nf and  N / N 3 , respectively. They do not affect each other  N 1 / N f 1 N 2 / N f 2 N 3 / N f 3 ,  and  N 4 / N f 4 , respectively, and have their own fatigue life.
According to the assumption of Miner’s fatigue damage theory, the fatigue damage degree of a component subjected to cyclic loading with variable stress amplitude until fatigue damage occurs is equal to 1, i.e.,:
N 1 N f 1 + N 2 N f 2 + N 3 N f 3 + N 4 N f 4 = 1
In general, if the variable amplitude stress cycles are loaded as a series of stress amplitudes  σ n 1 σ n 2 σ n 3 , …, and the corresponding fatigue life of the part is  N f 1 N f 2 N f 3 , …, and the actual number of cycles is  N 1 N 2 N 3 , …, then there is a fatigue damage ratio:
j = 1 n N j N f j = 1
The fatigue damage increases linearly with the number of cycles at each stress level, and the fatigue damage ratio is 1, which is the Miner’s fatigue damage accumulation criterion.
For predicting and evaluating the single-axis high cycle fatigue life N of the shift core component of the power take-off gear, it can be obtained by the measured load experiment and the calculation of Miner’s linear damage theory, which indicates that the damage ratio D at the time of fatigue damage is:
D = j = 1 n N j N f j = N 1 N f j N j N = 1
where Nj is the number of cycles under the jth load and Nfj is the number of cycles in which the part is damaged under the measured stress.
Through the DAQ strain test system of the dangerous node load collection experimental strain spectrum to the stress spectrum translation to get the measured stress load spectrum, the value of Nj/N can be determined and Nfj can be derived from the PTO gearbox core parts material S-N curve. Therefore, Miner’s fatigue damage accumulation theory can yield a more accurate prediction of the PTO gearbox key core component structure fatigue life [25,26].

5. PTO Gearbox Fatigue Life Prediction

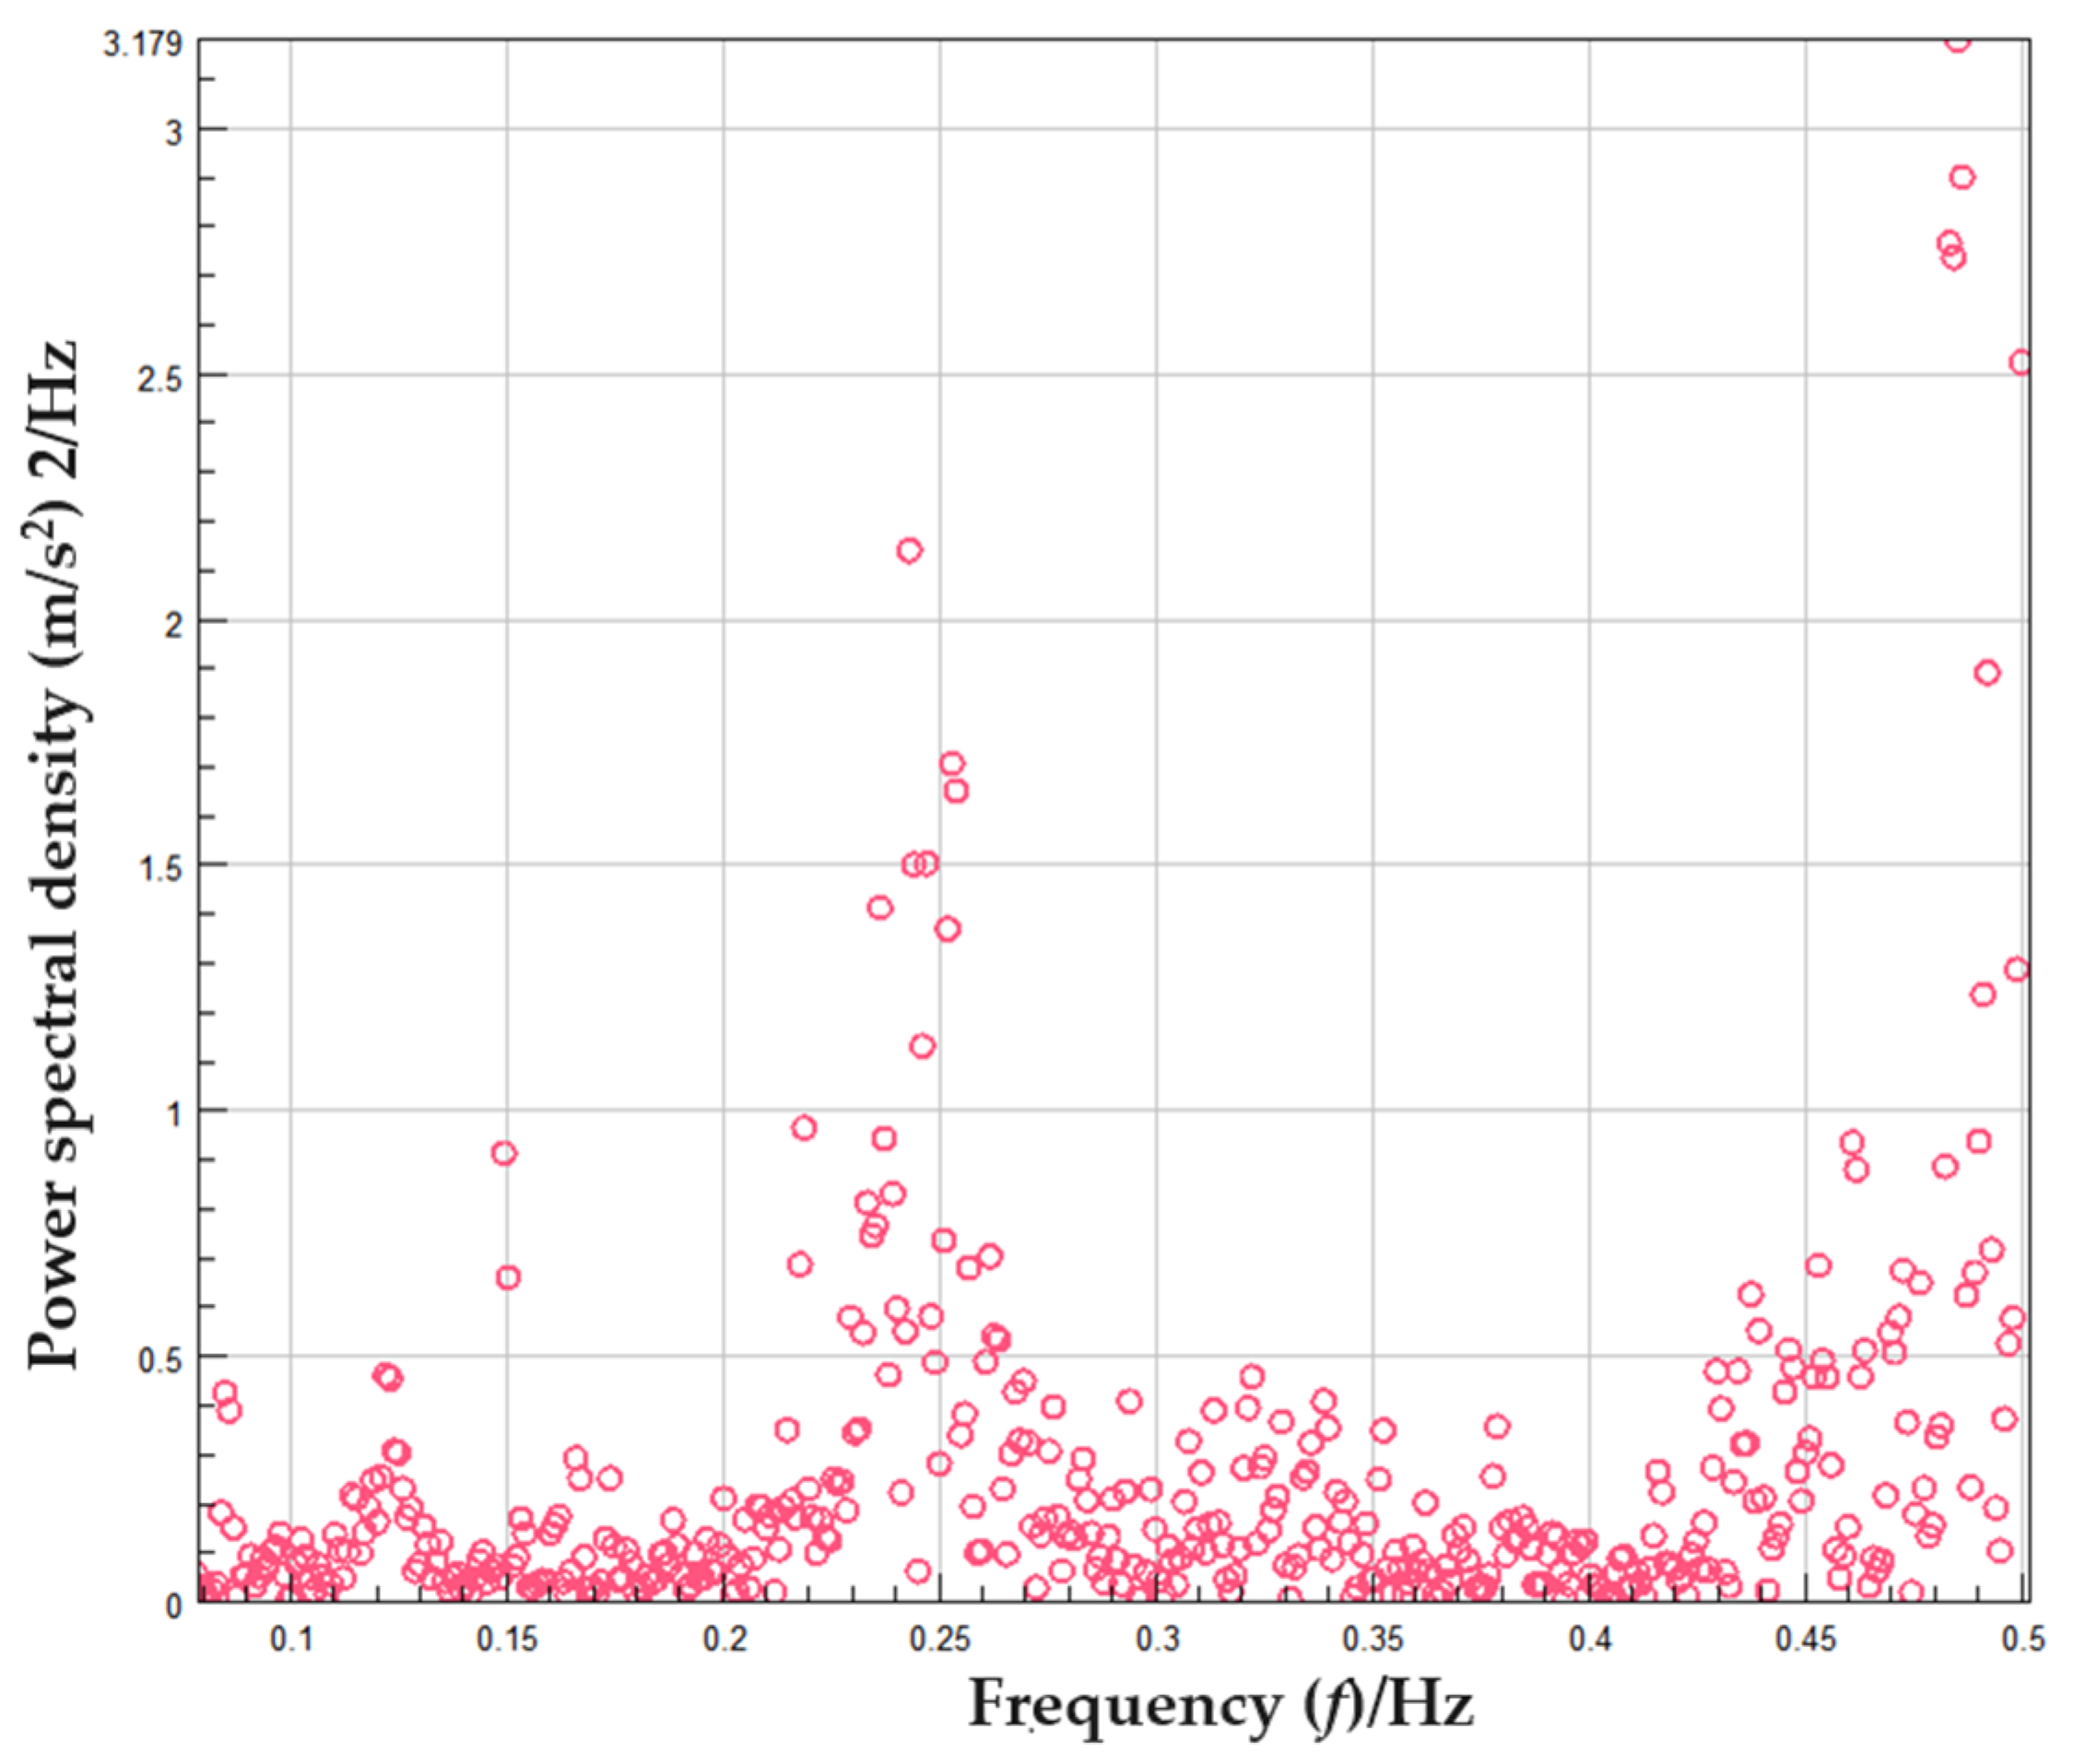
5.1. Spectroscopy of Fatigue Loading

The fatigue analysis and fatigue life prediction of the PTO gearbox body of the paddy power chassis were carried out after more than 200 forward and reverse smooth shift tests. After processing and calculating the measured strain data of the core components of the paddy power chassis PTO, the nominal stress curve of the gearbox body was obtained, as shown in Figure 8. By observing the measured load data in patch 1, the amount of data burrs more: in the nCode GlyphWorks environment, the data are first processed through a Butterworth digital filter to remove extraneous frequency components. This is immediately followed by a detrending operation to further remove long term trends and periodic distortions present in the data. Finally, the standard variance method was used to identify and remove singularities, thereby optimizing the statistical properties and analytical accuracy of the dataset [27]. The calculation process is shown in Figure 11, and the results of the processing are shown in Figure 12.
According to the load distribution histogram shown in Figure 13, the processing method can clearly reflect the relationship between amplitude and frequency of the processed measured load with 99.9% reliability. By analyzing and comparing it with the original collected data, the processed measured stress load shows that the average value of the cyclical fatigue stress of the gearbox body was 322.78 Pa.
However, at this stage, the stress curve after rejection and filtering still presented irregularity and randomness in the time domain, and it was still not possible to make a more accurate fatigue life assessment of the PTO gearbox based on this measured load [28,29]. To overcome this problem, the most commonly used method is to transform the irregular load-time history into multiple cyclic loads using the rainflow counting method, which consists of a variable-amplitude cyclic load-time history [30], and then finally use Miner’s linear theory to predict the fatigue life of PTO gearboxes.
The rainflow counting method removes and recounts several full cycles of random loads in sequence to obtain variable-amplitude cyclic load-time history curves for fatigue analysis.
The measured nominal stress vs. time of random loads using the rainflow counting method for fatigue load spectrum preparation, data processing, and rainflow counting calculation flow from the nCode GlyphWorks software for patch 1 are shown in Figure 14. The compiled fatigue load vs. time of counting results on the average value of the load, amplitude, and frequency of the cycle are shown in Figure 15.
In order to further verify the accuracy of the nominal stress method under the stress adjustment factor (K) correction for single-axis high-cycle fatigue analysis, this paper again applies the traditional stress field strength method to predict the fatigue life of the core components of the power take-off gearbox of the paddy power chassis. The nCode GlyphWorks software was used to solve the power spectral density of the measured stress–time history data, and the bandpass filtering algorithm as well as the least squares method were applied to filter and ramp the measured fatigue load amplitude ramp of the processed data of patch 1. The bandpass filtering frequency range of patch 1 was set to 0.01–0.5 Hz, and the processing is shown in Figure 16. The measured power spectral density of the PTO gearbox case patch 1 is shown in Figure 17.

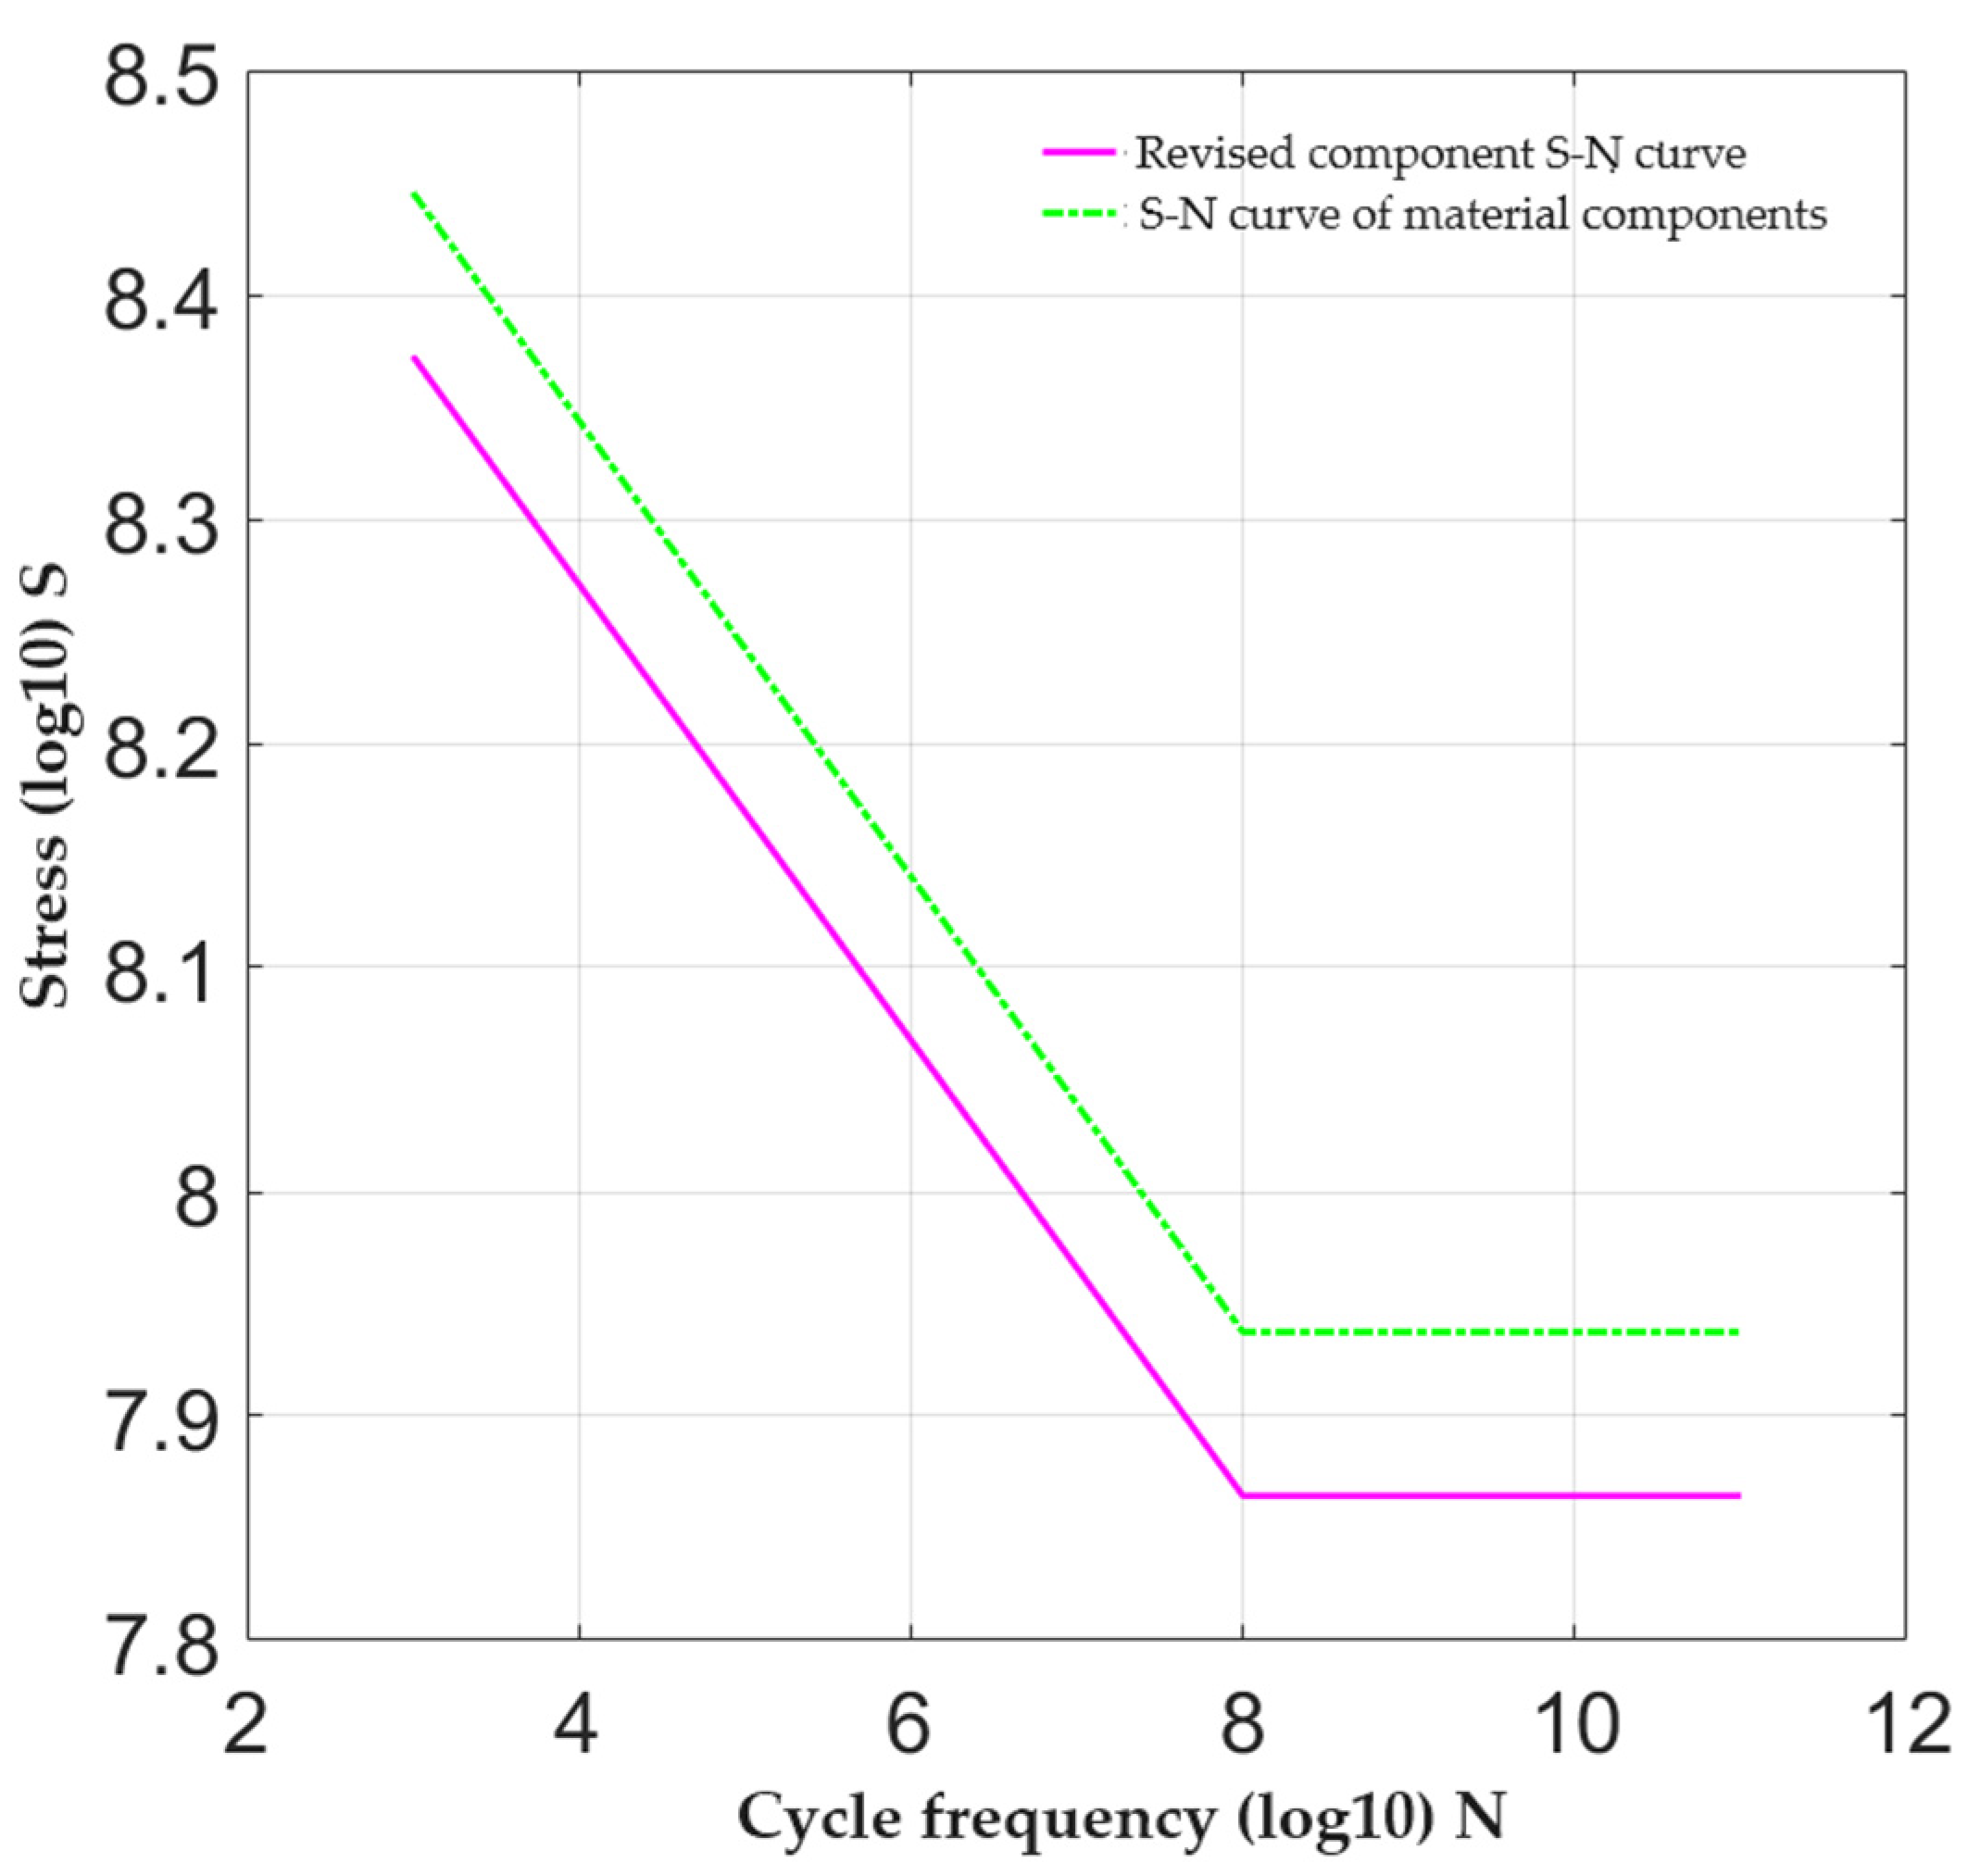
5.2. Component S-N Curve Correction

The body of the electronically controlled auto-shift PTO was made from 6061-T6 aluminum alloy, which satisfies the S-N curve of the material:
log 10 S = C m × log 10 N
Therefore, the S-N curve of the material, its cycle frequency, and the common logarithmic relationship of stress is approximately linear [31]. The use of the interpolation method of the aluminum alloy 6061-T6 in the two points (103, Sc) and (108, Sd) of the solution to the S-N curve of the 6061-T6 material needs to satisfy the following:
log 10 S = 0.1016 × log 10 N
The method of correcting the S-N curve of the component introduces the stress adjustment factor K, which takes into account the effect of the stress concentration factor and the average stress:
K = 1 + q r ( K t 1 ) σ m σ b β ε C L
According to the fatigue design manual, the theoretical stress concentration factor  K t  of the 6061-T6 material is 2, the tensile strength  σ b  is 310 MPa, the surface finish quality factor  β  is 0.9, the component size factor  ε  is 0.8, the loading mode factor  C L  is 0.95, the sensitivity coefficient  q r  is 0.00105, and the mean stress  σ m  is 0.323 MPa [32].
At this point, the modified S-N curve of the component satisfies the following form:
log 10 S = C m × log 10 N log 10 K
The S-N curve of the gearbox body is satisfied:
log 10 S = 0.1016 × log 10 N + 0.073
The results of the S-N curve corrected by the stress adjustment factor of the shift core component are shown in Figure 18, where S is the nominal stress applied when the cycle frequency is N, i.e., the fatigue life of the component under the action of the nominal stress S is N. As it can be seen from Figure 18, the integrated stress adjustment factor corrects the S-N curve of the material to a greater extent and the fatigue limit strength of the component has a more pronounced decrease.

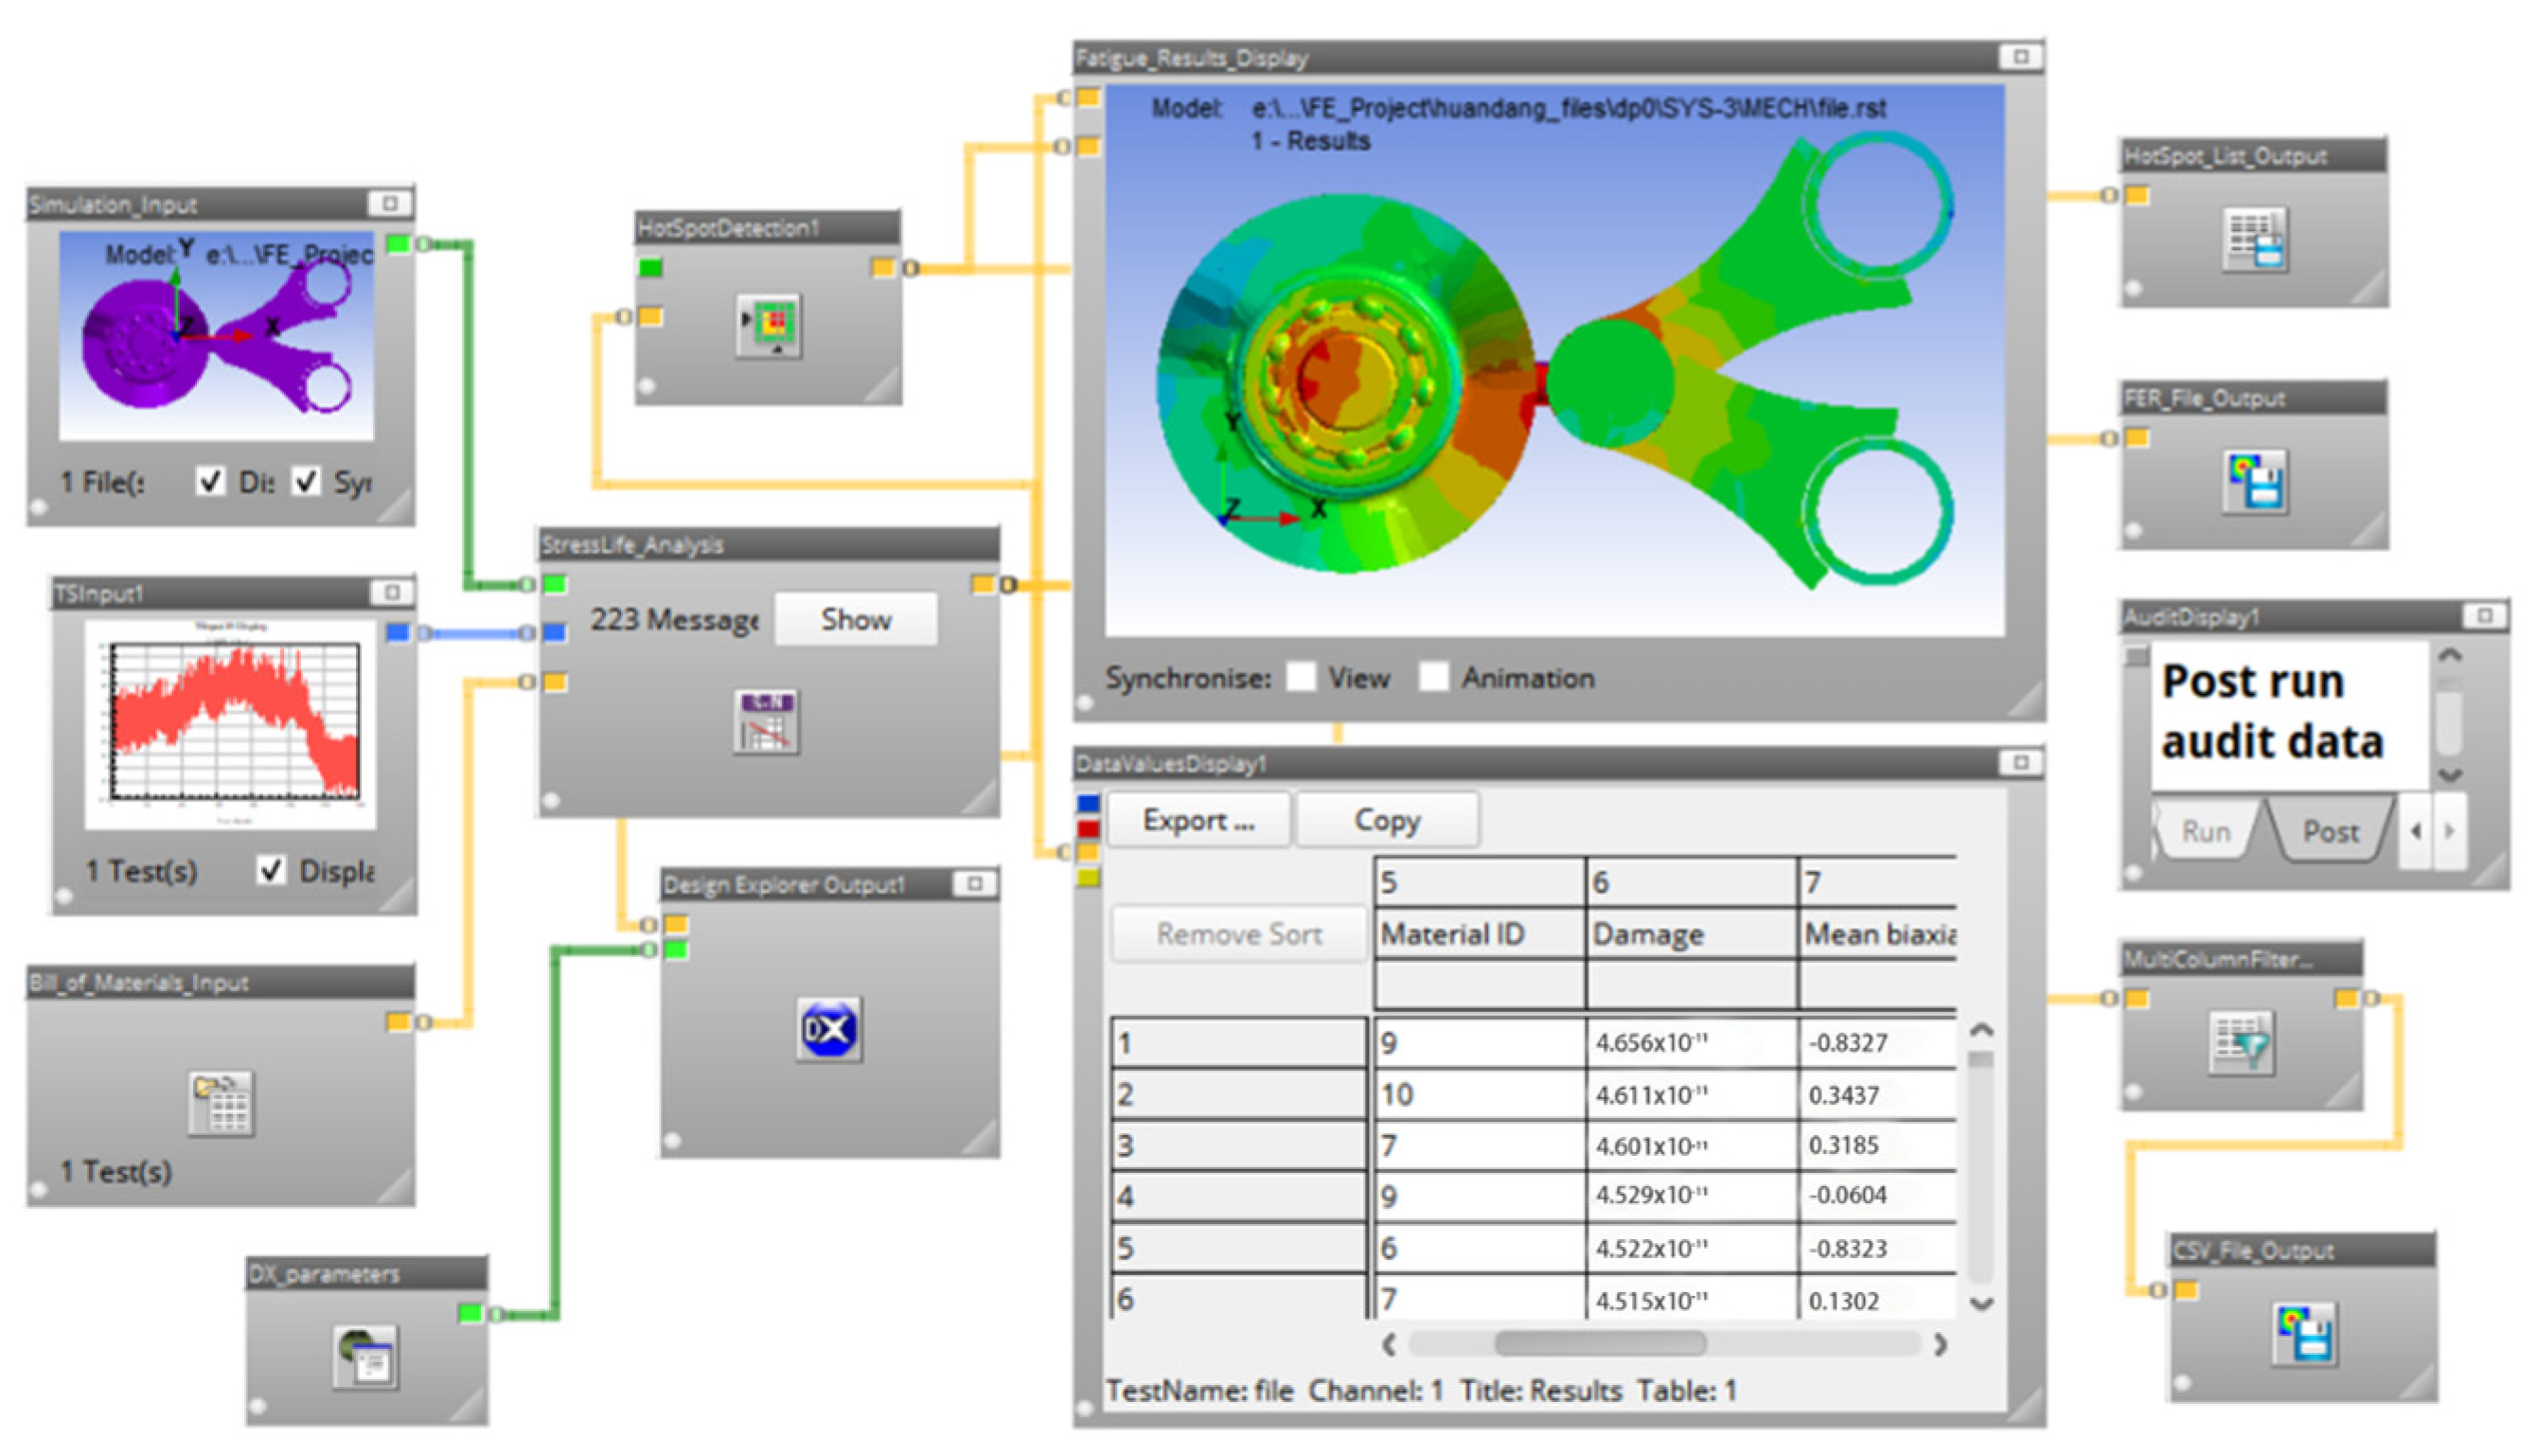
5.3. Fatigue Life Prediction

According to the fatigue life prediction analysis process shown in Figure 10, the FE model of the fatigue analysis is imported in the nCode DesignLife module for the fatigue life prediction calculation of the gearbox body, and the calculation process is shown in Figure 19.
Combining the fatigue analysis FE model, the modified component S-N curve, and Miner’s linear damage accumulation theory, the fatigue cumulative damage of the gearbox body was solved in the SN TimeSeries solving module and SN VibrationPSD solving module [33] in the nCode software, corresponding to the stress adjustment coefficient corrected nominal stress method. The fatigue cumulative damage of the gearbox was solved by the traditional stress field strength method, and the fatigue cumulative damage of patch 1 was  D σ 2 = 1.314 × 10 8  under the stress adjustment coefficient corrected nominal stress method,  D σ 22 = 1.015 × 10 8  under the traditional nominal stress method, and  D ε 2 = 1.064 × 10 8  under the traditional stress field strength method in the shift operation of patch 1. Finally, the fatigue life of the gear unit body was calculated as  N 2 = ( 1 / D σ 2 ) × 1.5 = 1.141 × 10 8   s = 31,699   h  under the coefficient-corrected nominal stress method, and the remaining calculation results are shown in Table 4.
Based on the literature, experience, and research findings, the gearbox of paddy power chassis implements typically have a service life of approximately 20,000 h before experiencing fatigue failure. Table 4 clearly illustrates that the fatigue life predicted by the modified nominal stress method closely approximates the actual value compared to predictions from the traditional nominal stress method. Furthermore, when compared to the traditional stress field strength method, the modified nominal stress method incorporating stress adjustment factors provides a more accurate prediction of fatigue life for core gear components, with results closely aligning with the actual service life of 20,000 h.

6. Results and Discussion

(1) Transient dynamic simulation analysis using modal superposition was conducted on the PTO gearbox of the paddy power chassis. Additionally, an MCC_DAQ fatigue load real-time acquisition test was performed based on identified critical nodes. The resulting fatigue load history of the gearbox body, characterized by an equivalent average stress of 322.81 Pa, was crucial for predicting the fatigue life of the electrically controlled auto-shift PTO gearbox.
(2) The fatigue life of the PTO gearbox body was assessed using the nominal stress method corrected with stress adjustment coefficients, considering the impacts of stress concentration and average stress on component fatigue life.
(3) Preparation of the fatigue load spectrum and correction of component S-N curves led to a fatigue life calculation and evaluation using the stress adjustment coefficient corrected nominal stress method. The calculated fatigue life of the gearbox body was 31,699 h, closer to the actual operational life (20,000 h) compared to other fatigue analysis methods.
The stress adjustment coefficient modified nominal stress method used in this paper is more suitable for the fatigue life prediction analysis of key mechanical components under random fatigue loading conditions, and many key components (e.g., bearings and gear shafts, etc.) can be used to calculate the fatigue life by the modified nominal stress method. At the same time, this method can also be combined with artificial intelligence data analysis to make the predicted fatigue life closer to the real value, so as to more effectively verify the fatigue strength and reliability of the key component structure of the transmission under actual transmission conditions and provide a reference for further optimization of the power take-off transmission of the paddy power chassis.

Author Contributions

Conceptualization, J.H., D.Y., B.G., Z.W., Y.M., W.Z., Z.Z., Z.G. and J.W.; methodology, Z.W. and J.H.; software, B.G. and J.H.; validation, Y.M., W.Z. and Z.Z.; investigation, D.Y. and J.H.; writing—original draft preparation, J.W. and J.H.; writing—review and editing, D.Y., Z.G., B.G. and Z.W.; formal analysis, J.H. and Y.M.; investigation, W.Z.; supervision, Z.Z., J.H. and J.W.; project administration, J.W. and J.H.; funding acquisition, J.H. All authors have read and agreed to the published version of the manuscript.

Funding

National Natural Science Foundation of China (Grant No. 32171903), Guangdong Basic and Applied Basic Research Foundation (Grant No. 2020B1515020034), supported by the earmarked fund for CARS (Grant No. CARS-01), the Science and Technology Development Programs for Huangpu Innovation Research Institute of SCAU (2023GG00X).

Institutional Review Board Statement

Not applicable.

Data Availability Statement

The data reported in this study are contained within the article.

Conflicts of Interest

The authors declare no conflicts of interest.

References

  1. Xie, B.; Wu, Z.B.; Mao, E.R. Development and prospect of key technologies on agricultural tractor. Trans. Chin. Soc. Agric. Mach. 2018, 49, 1–17. [Google Scholar]
  2. Liang, J.T.; Yang, G.T.; Zhu, C.X.; Yang, M.B. Present situation and development trend of PTO for agricultural tractor. Agric. Technol. Equip. 2021, 12, 55–58. [Google Scholar]
  3. Zhu, T.L. Research and Design of Tractor Power Take-Off Test Bench. Bachelor’s Thesis, Jilin University: Changchun, China, 2017. [Google Scholar]
  4. Pan, H.L.; Yang, Q.W.; Liu, J.H. On-line running-in filtration and dialysis mode of tractor transmission system. Agric. Eng. 2022, 12, 90–93. [Google Scholar]
  5. Wang, N.Y.; Yuan, W.; Chen, J.J.; Liu, K.; Pan, H.L. Development of FHC-200 power wagon for tractor. Tract. Farm Transp. 2017, 44, 52–54. [Google Scholar]
  6. Zheng, J.Q. Finite Element Analysis and Optimum Structural Design of Shell of a High-Power Tractor Transmission. Bachelor’s Thesis, Shandong University of Technology, Zibo, China, 2018. [Google Scholar]
  7. Pei, B. Finite Element Analysis and Lightweight Optimization Study on Rear Axle Housing of High-Powered Tractor. Bachelor’s Thesis, Shandong University of Technology, Zibo, China, 2018. [Google Scholar]
  8. Zhang, L.; Liu, S.; Mao, E.; Xie, B.; Li, F. Reliability analysis of agricultural machinery chassis drive axle housing based on ANSYS. Trans. CSAE 2013, 29, 37–44. [Google Scholar]
  9. Feng, F.Y.; Hou, J.J. Reliability Analysis on Power Take-off of Refrigerating Cooling Vehicle. Mech. Eng. Autom. 2018, 6, 135–136. [Google Scholar]
  10. Zhang, H.P.; Liu, L.R.; Li, B.; Deng, N.J. Design Method of Power Takeoff in Fire Truck. Spec. Purp. Veh. 2018, 10, 79–81. [Google Scholar]
  11. Zhang, X.M. Drive like a normal truck new sprinkler extractor developed successfully. Spec. Purp. Veh. 2018, 6, 66–68. [Google Scholar]
  12. Asonja, A.; Adamovic, Z.; Jevtic, N. Analysis of Reliability of Cardan Shafts Based on Condition Diagnostics of Bearing Assembly in Cardan Joints. Metal. Int. 2013, 18, 216–221. [Google Scholar]
  13. Wang, Y.W.; Luo, J.W.; Ye, J.; Chen, L.P. EFA based fatigue and its application. Mach. Des. Manuf. 2008, 1, 22–24. [Google Scholar]
  14. Zhang, L.X. Reliability Analysis and Evaluation Method Research on Combine Harvester Chassis. Ph.D. Thesis, China Agricultural University, Beijing, China, 2014. [Google Scholar]
  15. Wen, C.K.; Xie, B.; Yang, Z.H.; Dong, N.X.; Song, Z.H. Fatigue analysis of gearbox shell of high horsepower tractor based on power density. Trans. Chin. Soc. Agric. Mach. 2019, 50, 389–396. [Google Scholar]
  16. Song, Q.C. Study on Measured Load Spectrum for Steering Drive Axle of High-Horsepower Tractor. Ph.D. Thesis, China Agricultural University, Beijing, China, 2019. [Google Scholar]
  17. Dong, Z.; Wang, X.; Lou, W.; Huang, Y.; Zhong, M.; Fan, H.; Peng, L. Simulation of the Spindle Coupled Multi-Axial Loading Fatigue Test of a Minivan Rear Axle. Strength Mater. 2017, 49, 872–896. [Google Scholar] [CrossRef]
  18. Feng, W.; Pang, Y.; Li, P.; Cui, J.; Zhang, X.; Zhan, X. Lightweight design for rack of small harvester based on ISIGHT. Southwest China J. Agric. Sci. 2019, 32, 174–178. [Google Scholar]
  19. Li, X.; Zhang, D.; Wang, W.; Tao, C.; Tang, M. Performance parameter optimization and experiment of forced-vibration subsoiler. Trans. CSAE 2015, 31, 17–24. [Google Scholar]
  20. Zhang, Z.Y.; Xie, S.S.; Wang, K.; Zhang, Y.; Bing, T.; Sun, S. Fatigue Study of Tractor Frame Based on Complex Boundary. Automot. Eng. 2023, 25, 873–879. [Google Scholar]
  21. Xiang, C.L.; He, W.; Liu, H. Transient Dynamic Analysis of Tracked Vehicle Transmission during Gear Shift Process. Trans. Chin. Soc. Agric. Mach. 2016, 47, 288–293. [Google Scholar]
  22. Liu, H.Y.; Hu, Y.; Huang, X.H.; Yuan, T.P.; Wang, S.M.; Chen, M.Q.; Guo, G.X. Failure and fatigue analysis of floating structure of offshore cage. Trans. Chin. Soc. Agric. Eng. 2020, 36, 46–54. [Google Scholar]
  23. Zhang, J.; Adamu, A.; Su, X.C.; Guo, Z.H.; Gao, G.J. Effect of simplifying bogie regions on aerodynamic performance of high-speed train. J. Cent. South Univ. 2022, 29, 1717–1734. [Google Scholar] [CrossRef]
  24. Wang, M.Z. Research on Life Analysis Method for Structure Vibration Fatigue; Nanjing University of Aeronautics and Astronautics: Nanjing, China, 2009. [Google Scholar]
  25. Wang, L.; Zhang, X.; Leng, J.; Zhao, G.; Jiao, Z.; Qin, Y. Fatigue Life Analysis of Grain Combine Harvester Cleaning Device. Trans. Chin. Soc. Agric. Mach. 2018, 24, 282–287. [Google Scholar]
  26. Zheng, S. Failure Analysis and Fatigue Life Prediction on the off-Highway Wide-Body Mine Dump Truck Frame Structure. Ph.D. Thesis, Jilin University, Changchun, China, 2015. [Google Scholar]
  27. Song, Q.C.; Song, Z.H.; Du, Y.F. Load spectrum and fatigue life analysis of frame based on non-parametric rainflow extrapolation method. J. China Agric. Univ. 2019, 24, 154–160. [Google Scholar]
  28. Wang, Y.; Wang, L.; Wen, C.; Lv, D.; Wang, S. Extrapolation of tractor PTO torque load spectrum based on automated threshold selection with FDR. Trans. Chin. Soc. Agric. Mach. 2021, 52, 364–372. [Google Scholar]
  29. Wang, L.; Zong, J.H.; Wang, Y.; Fu, L.; Mao, X.; Wang, S. Compilation and bench test of traction force load spectrum of tractor three-point hitch based on optimal distribution fitting. Trans. Chin. Soc. Agric. Eng. 2022, 38, 41–49. [Google Scholar]
  30. Yang, Z.H.; Song, Z.H.; Yin, Y.Y.; Zhao, X.Y.; Liu, J.H.; Han, J.G. Time domain extrapolation method for load of drive shaft of high-power tractor based on POT mode. Trans. Chin. Soc. Agric. Eng. 2019, 35, 40–47. [Google Scholar]
  31. Feng, Z.H.; Ma, Q.; An, Z.; Ma, H.; Bai, X. New fatigue life prediction model for composite materials considering load interaction effects. Int. J. Appl. Mech. 2023, 15, 235007609. [Google Scholar] [CrossRef]
  32. Xi, S.J. Study on Virtual Fatigue Test Method of Electric Vehicle Reducer Based on Actual Load Spectrum. Bachelor’s Thesis, Chongqing University of Technology, Chongqing, China, 2021. [Google Scholar]
  33. Liu, H.N. Dynamic Performance Simulation and Fatigue Life Prediction of Eccentric Roll Crusher. Bachelor’s Thesis, Jilin University, Changchun, China, 2023. [Google Scholar]
Figure 1. Simulation flowchart.
Agriculture 14 01436 g001
Figure 2. Finite element modelling of the PTO gearbox for the paddy power chassis. 1. Gearshift rotating shaft. 2. Output shaft. 3. Input shaft.
Agriculture 14 01436 g002
Figure 3. Modal superposition transient dynamics analysis method.
Agriculture 14 01436 g003
Figure 4. Calculation of the modal transient dynamics of the PTO gearbox body: (a) total deformation cloud map; (b) equivalent force cloud map.
Agriculture 14 01436 g004
Figure 5. PTO gearbox body sensor patch point position indicator chart: (a) right view; (b) left view.
Agriculture 14 01436 g005
Figure 6. MCC-DAQ dynamic load acquisition system.
Agriculture 14 01436 g006
Figure 7. PTO gearbox body part strain transducer paste diagram.
Agriculture 14 01436 g007
Figure 8. Load data for each test point of the PTO gearbox body: (a) patch 1; (b) patch 2; (c) patch 3; (d) patch 4; (e) patch 5; (f) patch 6.
Agriculture 14 01436 g008
Figure 9. Nominal stress load time course curve for patch 1.
Agriculture 14 01436 g009
Figure 10. Fatigue life prediction process.
Agriculture 14 01436 g010
Figure 11. Data processing.
Agriculture 14 01436 g011
Figure 12. PTO gear body fatigue load amplitude slope processing results.
Agriculture 14 01436 g012
Figure 13. Histogram of fatigue load spectral density of PTO gearbox body.
Agriculture 14 01436 g013
Figure 14. Data processing and rainwater flow counting calculation.
Agriculture 14 01436 g014
Figure 15. PTO gear body fatigue load vs. time rainflow count results.
Agriculture 14 01436 g015
Figure 16. Data processing and power spectral density calculation.
Agriculture 14 01436 g016
Figure 17. PTO gear body patch 1 stress power spectral density curve.
Agriculture 14 01436 g017
Figure 18. Stress adjustment factor Corrected S-N curve for gearbox body.
Agriculture 14 01436 g018
Figure 19. Prediction of n-Code Fatigue Life of Shift Core Components.
Agriculture 14 01436 g019
Table 1. Material parameters.
Experimental MaterialsExperimental ParametersExperimental Values
Aluminum alloy 6061Poisson’s ratio0.3
Young’s modulus (Pa)   2.06 × 10 11
Density (kg · m−3)7850
Ultimate tensile strength (Pa)   3.75 × 10 8
Table 2. Boundary condition setting.
Working ConditionPTO Gearbox Shift ProcessCondition Setting
Restrictive ConditionLoading Conditions
Gearbox body1-2-3-4-5-6Box bolt hole mounting bracket   x , y , z , x ^ , y ^ , z ^ ;
Gearshift spindle  x , y , z , x ^ , y ^ ;
Input shaft  x , y , z , x ^ , y ^ ;
Output shaft  x , y , z , x ^ , y ^ .
Fork 1 counterforce 50 N, fork 2 counterforce 50 N;
Shift rotary shaft torque 2.5, speed 20 r/min;
Input shaft motor speed 700 r/min.
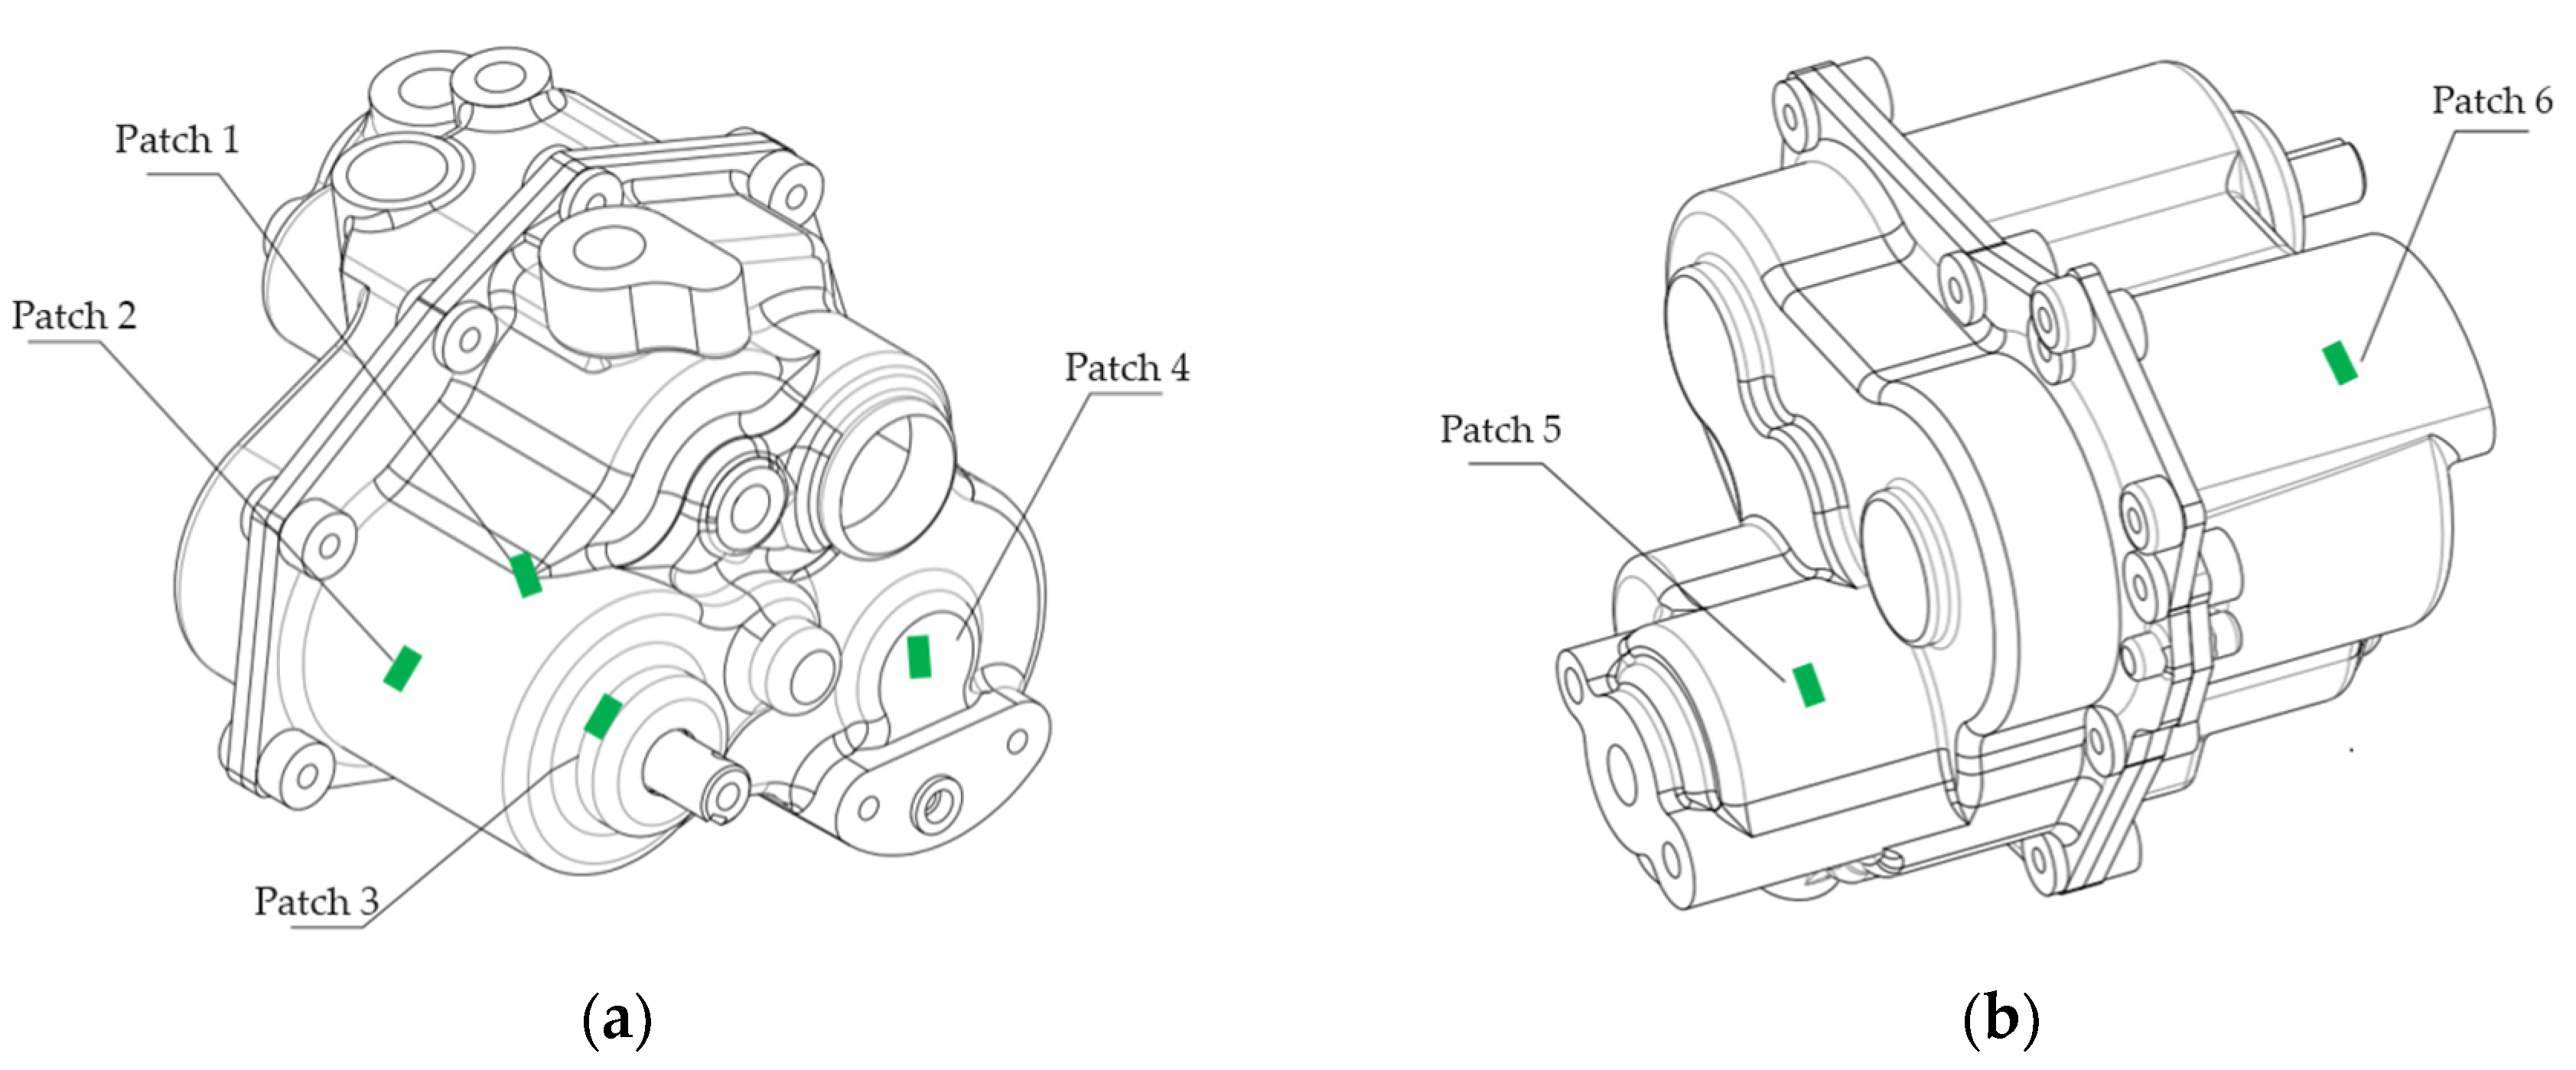
Note:  x , y , z  is the translational degree of freedom along the x, y, z axes, respectively;  x ^ , y ^ , z ^  is the rotational degree of freedom around the x, y, z axes, respectively.
Table 3. Nominal stress eigenvalue of PTO gearbox under typical gearshift conditions.
Test PointMaximum Nominal Stress (Pa)Minimum Nominal Stress (Pa)Equivalent Mean Stress (Pa)Standard Deviation (Pa)Variance (Pa)
Patch 1325.63321.95322.810.4360.190
Patch 2160.15159.24159.720.1660.028
Patch 3307.96301.45303.851.1981.434
Patch 481.6477.1178.370.5310.282
Patch 575.3771.4472.620.4890.239
Patch 6172.43165.82170.120.8650.748
Table 4. Fatigue life prediction results.
Object of AnalysisExperience and Knowledge Fatigue LifeFatigue Life Prediction by Nominal Stress Method Modified by Stress Adjustment FactorNominal Stress MethodFatigue Life Prediction Using Conventional Stress Field Strength Method
PTO housing20,000 h31,699 h41,053 h39,151 h
Disclaimer/Publisher’s Note: The statements, opinions and data contained in all publications are solely those of the individual author(s) and contributor(s) and not of MDPI and/or the editor(s). MDPI and/or the editor(s) disclaim responsibility for any injury to people or property resulting from any ideas, methods, instructions or products referred to in the content.

