Abstract
This study analyzed temperature and yield data from 34 meteorological stations in Heilongjiang Province during 1961–2020. Four climate averages (P1, P2, P3, and P4) were determined based on their respective time distributions (1961–1990, 1971–2000, 1981–2010, and 1991–2020). The national standard temperature anomaly index was used to identify delayed chilling damage in rice cultivation compared to these climate averages. Climate tendency rate analysis, Mann–Kendall detection, and linear regression methods were employed to examine the relationship between temperature anomaly and rice yield from May to September. The results showed that there were noticeable differences in recognizing delayed chilling damage across different climate averages from 1961 to 2020. The average duration of chilling damage under P1, P2, P3, and P4 was, respectively, estimated as 8.5 years, 13.3 years, 21.4 years, and 30.9 years, with severe cold damage accounting for a significant portion (68.2–76.0%) of the total chilling damage period. The occurrence of severe cold damage increased significantly over time while light and moderate cold damage did not show a clear increasing or decreasing trend. Based on the test results, P3 was found to be the most suitable climate average for identifying delayed chilling damage in rice cultivation from 1961 to 2020. Moreover, the incidence of chilling damage revealed declining trend over time. There was a high incidence of chilling damage in the 1960s and 1970s, followed by a decrease from the 1980s to the mid 1990s, and finally a low-incidence period after the mid-1990s. Spatially, the western regions experienced greater occurrence of chilling damage than the eastern regions. Additionally, there was a highly significant positive correlation (p < 0.01) between temperature anomalies from May to September and relative meteorological yield of rice. As temperature anomalies decreased during this period, there was an observed downward trend in relative meteorological yield of rice, indicating that delayed cold injury had a negative impact on rice production.
1. Introduction
The agro-ecological field has garnered significant international attention due to the profound impact of global climate change and its associated extreme weather events and meteorological disasters [1,2,3,4,5]. These calamities have resulted in diminished crop yield and quality, thereby posing a threat to food security [6,7,8,9]. The rice crop is highly sensitive to temperature, and its growth and development can be adversely affected by cold temperatures, leading to a reduction in yield [10,11,12]. Heilongjiang Province, as a significant rice-producing region in China, plays a crucial role in ensuring food security with its annual planting area and total output, accounting for over 13% of the country’s rice production. However, being situated in a mid-high-latitude region, Heilongjiang province faces challenges such as limited heat resources, substantial temperature variability, and frequent occurrences of chilling damage [13,14]. Moreover, the ongoing climate warming has led to a northward shift in the rice planting belt [15], exacerbating the existing contradiction between heat conditions and rice demand. The combination of chilling damage and this northward shift significantly amplifies risks to rice production safety while posing an imminent threat to national food security. Therefore, studying the identification of rice cold damage and its impact on rice in cold regions against the backdrop of climate change holds immense practical significance for the variety selection and climate resource utilization of rice cultivation, risk mitigation, and enhancing yield and income.
Climate change and meteorological disasters have a close relationship with food security [16,17]. In recent years, experts and scholars in relevant fields both domestically and internationally have conducted extensive research, resulting in significant progress in this area [18,19,20]. Research on family farms and small-scale farmers has also been carried out in Brazil and Ethiopia [21,22]. In China, extensive research has been conducted on various aspects of rice chilling damage, including testing methods [23], index construction [24], monitoring and forecasting techniques [25], crop model enhancement [26], identification of cold tolerance [27], and assessment of the impact caused by cold damage. However, limited attention has been given to utilizing long-term data series for identifying rice chilling damage based on different climatic averages. As widely acknowledged, within the realm of climate change, long-term data series prove invaluable in discerning the historical patterns of disasters and significantly contribute to a comprehensive understanding of their characteristics for effective disaster prevention. In the identification of delayed cold damage in rice, the identification index should utilize the climatic mean value. This refers to the multi-year average value of a specific meteorological element during a certain historical period and represents the average climate state within that period. As per the guidelines provided by the World Meteorological Organization (WMO), the climatic mean value for meteorological elements is calculated as an average or statistical value over three complete decades. It is necessary to update this value every 10 years [28], indicating that changes occur in the average climate state, which consequently leads to different outcomes in disaster identification. How will the identification results of rice chilling damage vary across different climate averages? Which climate average state is more conducive to the accurate identification of chilling damage? Is there any correlation between the index factors of chilling damage and rice yield? These inquiries merit further exploration. Based on 60 years of historical meteorological data, chilling damage was identified, its change characteristics were analyzed based on different climatic averages, and the influence of low-temperature chilling damage on rice yield was studied, providing meteorological reference for rice production safety, agricultural disaster prevention and reduction, and food security.
2. Data and Methods
2.1. The Source of Data
The primary rice-producing region of Heilongjiang Province in Northeast China is situated mainly south of 48° N. For this study, we selected 34 meteorological stations that are evenly distributed throughout the main rice-producing area and can accurately represent actual rice production in Heilongjiang Province. The selection of the 34 weather stations was based on their national significance, annual monitoring requirements for measurement instruments, and data quality control measures, ensuring a more precise depiction of objective facts. These stations also provide a reliable reflection of heat distribution trends, ensuring objectivity in our analysis. Please refer to Figure 1 for further details. The dataset comprised the daily average temperature, precipitation, and sunshine duration recorded at 34 meteorological stations from 1961 to 2020. These data were compiled by the Heilongjiang Meteorological Bureau. The rice yield data for these 34 stations were obtained from the Heilongjiang Provincial Bureau of Statistics.

Figure 1.
Spatial distribution of the stations in the research area.
2.2. Research Methods
2.2.1. Identification of Delayed Chilling Damage in Rice
The national standard of the People’s Republic of China, “GB/T 34967-2017 Grade of rice cold damage in northern China” [29], specifies the criteria for identifying low-temperature cold damage, grading chilling damage, and quantifying yield reduction rate in rice. The specific development of the standard and thresholds have been consistently demonstrated by multiple experts and achieved industry consensus. Therefore, this study employs the threshold value from this standard to assess cold damage. According to this standard, light chilling damage is defined as 10% ≤≤ 55%, moderate chilling damage as 10% < ≤ 15%, and severe chilling damage as 15% < ≤ 100%. In accordance with the national standard, this study employed the temperature anomaly index from May to September, which is calculated as the sum of monthly average temperatures and serves as an identification criterion for delayed chilling damage in rice. The different maturing areas of rice were categorized as I, II, III, IV, V, and VI based on Table 1.

Table 1.
Indicators of anomalies of temperature for delayed growth-type rice delayed chilling damage from May to September.
In this study, the cold damage identification index used the deviation of climate averages from the norm to analyze cold damage. The World Meteorological Organization typically defines a 30-year period as the climatic average. In daily operations at the China Meteorological Administration and other relevant units, the most recent climatic average spans nearly 30 years. For instance, before 2020, we used data from 1980–2010, and after that, we switched to data from 1990–2020. In the identification of delayed cold damage in rice, the identification index should utilize the climatic mean value. This refers to the multi-year average value of a specific meteorological element during a certain historical period and represents the average climate state within that period. As per the guidelines provided by the World Meteorological Organization (WMO), the climatic mean value for meteorological elements is calculated as an average or statistical value over three complete decades. It is necessary to update this value every 10 years, indicating that changes occur in the average climate state, which consequently leads to different outcomes in disaster identification.
The delayed chilling damage in rice is an agricultural natural disaster caused by prolonged periods of low temperatures, resulting in stunted growth and reduced tillering, decreased grain weight, or impaired maturation and subsequent yield reduction. The method uses the anomaly values of the sum of average temperatures from May to September over the past 30 years and yield reduction rate as indicators for delayed chilling damage identification. The higher the temperature and lower the anomaly value, the higher the yield reduction rate, indicating the higher the level of cold damage. Additionally, different rice varieties have varying indicators, including early mature, middle mature, and late mature.
Four climate averages (i.e., the sum of four annual average temperatures from May to September) were set to identify the delayed chilling damage of rice, respectively. Denoted as Pj, the initial climate mean represents the 30-year average value of the sum of monthly average temperatures from May to September between 1961 and 1990, denoted as . The average value of P2 during the period 1971–2000 is determined to be 30a; thus, it is denoted as =P2. Similarly, this identification process applies to P3 (1981–2010) and P4 (1991–2020). To identify the delayed chilling damage of rice, the sum of monthly average temperature from May to September was calculated:
In Equation (1), represents the summation of the average monthly temperatures from May to September in year i at a given station, where to denote the average temperatures for May, June, July, August, and September in year i at that station. Here, n = 60. Pj is calculated as follows:
In Equation (2), for , the summation of 30a from 1961 to 1990 is considered for calculation; for , the summation of 30a from 1971 to 2000 is considered for calculation, and so forth. The formula for calculating the temperature anomaly from May to September in the year i of a station using the J-th climate average is as follows:
Based on the calculated , rice chilling damage occurrences between 1961 and 2020 under different climate mean values (P1, P2, P3, or P4) can be identified by applying the index threshold from Table 1 to their respective values.
2.2.2. Yield Analysis Method
The actual rice yield was decomposed to enhance the analysis of the relationship between catastrophic climate factors and crop productivity [30,31].
In Equation (4), Y represents the actual rice yield per unit area (kg•ha−1); Yt denotes the trend yield (kg•ha−1); Yw signifies the meteorological yield (kg•ha−1); and ε is a random error, representing the negligible contribution of stochastic factors to the overall yield component. The linear moving average method is employed to decompose the trend component and compute the meteorological yield (Equation (5)).
Previous studies have demonstrated that the relative meteorological yield exhibits temporal and regional comparability [31]. Meanwhile, to enhance the analysis of delayed chilling damage effects on rice yield, this study examined the relative meteorological yield as follows:
In Equation (6), represents the relative meteorological yield (%). When < 0, this paper defines as the rate of reduction in rice yield.
2.2.3. Data Processing and Analysis Methods
The frequency of cold damage occurrence at a specific station is quantified by the ratio between the number of years experiencing chilling damage under a particular climate average and the total number of years. The ratio of the number of cold damage stations in a year to the total number of stations in the study area was used to express the extent of chilling damage in that year, expressed in IOC. The climate tendency rate, standard deviation, and Mann–Kendall test were employed to examine the temperature trend during the period from May to September. To mitigate the influence of dimensions, we employed the Min–Max normalization method [32] to standardize the temperature anomaly (∆T) and rice relative meteorological yield (Yr) data for the period from May.
In Equation (7), x represents or original data, xmin and xmax are the minimum and maximum values in the original data, respectively, and represents the data after normalization of or , expressed by and , respectively. Meteorological data were stored in Access2016, mean analysis was performed in excel, and trend analysis was performed by SPSS.
3. Result and Analysis
3.1. Revealing Delayed Chilling Damage in Rice through Diverse Climate Averages
3.1.1. Revealing Profile
From 1961 to 2020, significant variations were observed in the identification of delayed chilling damage in rice based on the four climate averages (Figure 2). Under the P1, P2, P3, and P4 scenarios, the average number of chilling damage years in the study area was found to be 8.5a, 13.3a, 21.4a, and 30.9a respectively, indicating an increasing trend in identified chilling damage years as we moved back along the climate average timeline. Under the same average climate conditions, there was less light and moderate chilling damage, while severe chilling damage accounted for 68.2% to 76.0% of the total cold damage years. Under different average climate conditions, as P1 to P4 shifted backward, the number of light and moderate cold damage years fluctuated without a discernible increasing or decreasing pattern; however, there was a significant increase in the number of severe chilling damage years, with an average increase of 4.3 to 8.1a.

Figure 2.
Numbers of cold damage years in different degrees under different average climatic states in the study area from 1961 to 2020. (a–d) are the number of cold damage years in different degrees under the average climatic state of P1, P2, P3 and P4 in the study area.
After analysis, it was found that the delayed chilling damage of rice identified by the four climate averages was generally concentrated before the mid-1990s. The number of years of chilling damage recorded by each station accounted for 100.0% in P1, 87.5% to 100.0% in P2, 84.2% to 100.0% in P3, and 77.3% to 96.0% in P4. It can be observed that since 1995, there has been a significant decrease in occurrences of chilling damage events. In terms of spatial variation, the distribution of chilling damage years exhibits a consistent pattern, characterized by a higher frequency in western regions and a lower occurrence in eastern areas.
3.1.2. Differences in Revealing Range
The four climate averages exhibit distinct identification ranges for varying degrees of chilling damage (Figure 3). The IOC (index of cold hardiness) refers to the ratio of the number of sites experiencing low-temperature cold damage in a given year to the total number of sites in the region. The IOC value demonstrates fluctuation patterns characterized by “bounce”. The IOC for light chilling damage ranged from 0.12 to 0.29 under P1 during the years 1962, 1965–1966, 1968, 1974, 1976, 1987, and 1992. The highest value was observed in the year of 1992, while the remaining seven years exhibited localized chilling damage. Under P2, the IOC of 1965, 1968, 1974, 1989, and 1993 ranged from 0.12 to 0.23, with the highest IOC observed in 1993, whereas the remaining 15 years exhibited an IOC lower than 0.09, indicating a prevalence of local cold injury. The IOC under P3 exceeded 0.12 for a span of 11 years, with the highest value recorded in 1995 (0.32), while the remaining 16 years exhibited localized occurrences. The IOC under P4 exceeded 0.12 for a span of 13 years, with the highest occurrence observed in 1988 (0.32), while the remaining 19 years exhibited localized incidents. The trend of IOC variation in moderate chilling damage is similar to that observed in light chilling damage. The highest IOC value, identified by P1, was recorded in 1974 (0.21), while the maximum IOC value identified by P2 occurred in 1987 (0.29). Notably, the IOC values ranged from 0.12 to 0.23 during the years 1962, 1965–1966, 1968, 1974, and 1976. The maximum value of the IOC for P3 was 0.32 in 1993, while the IOC values for 10a ranged from 0.12 to 0.26 in the years 1962, 1966, and 1989. The revealing range of P4 for 19a varied from 0.12 to 0.32 in the years 1973, 1978, and between 1984 and 1986, as well as in 1991, 1995, 1999, and 2009, with the highest value observed in 1991. The IOCs of severe chilling damage in 1964, 1969, 1971, 1972, 1976, 1981, and 1983 were 0.56~1.00 under the four climate averages. In P2–P4, the IOC values in 1965, 1974, 1987, and 1992 ranged from 0.41 to 1.00, whereas in P3–P4, IOC values in 1962, 1966, 1968, 1989, and 1993 ranged from 0.47 to 0.97. In the remaining years, there was significant variability observed among the four climate averages.
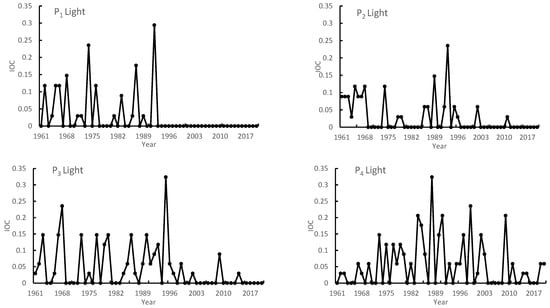
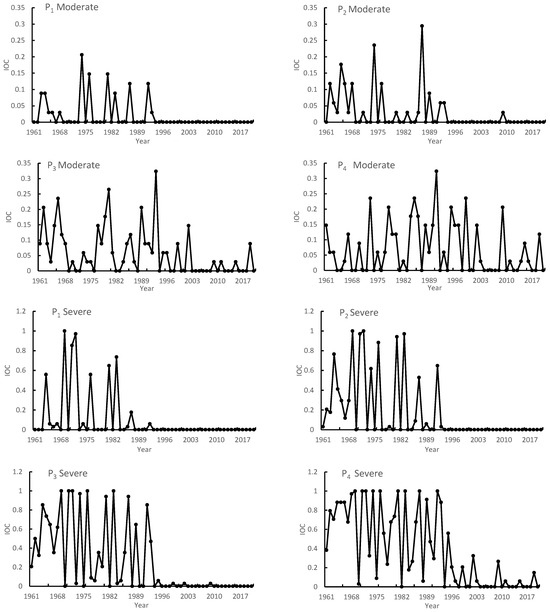
Figure 3.
IOC change curve of cold damage in different degrees under different average climatic states in the study area from 1961 to 2020.
3.2. Verification and Analysis of Delayed Chilling Damage of Rice under Different Climate Averages
The analysis reveals that the climate’s average state is undergoing a notable transformation, characterized by an augmentation of thermal resources. This phenomenon is exemplified by the northward shift in China’s double-cropping rice cultivation boundary and the gradual expansion of suitable rice-growing areas towards the north, with a remarkable increase of 4%. Notably, this expansion is most pronounced in Northeast China [33,34,35]. In certain regions of Northeast China, there has been a transition from single-cropping to double-cropping. Moreover, the average northern boundary for safeguarding against chilling damage in rice cultivation has shifted 121 km northward, with the maximum northerly extent reaching 216 km. Consequently, the total area dedicated to rice cultivation has expanded by approximately 3.3 million hectares. Based on the relative meteorological yield, an analysis was conducted on the years of rice yield decrease in the study area (excluding drought, flood, frost, and other disaster-affected years). Referring to the classification of rice chilling damage and its corresponding yield-decrease rate as described in Section 2.2.1 and the Encyclopedia of Meteorological Disasters in China—Heilongjiang [36], varying degrees of low-temperature cold injury were observed in the study area for a period of 15 years (Table 2). The mild chilling damage years were 1962, 1987, 1992, and 1993; the moderate chilling damage years were 1965, 1977, and 1989; and the severe chilling damage years included 1961, 1964, 1969, 1971, 1972, 1976, 1981, and 1983. The identification results were basically consistent with the research results of Du Chunying et al. [25]. The comparison of the above IOC values for different degrees of chilling damage, calculated based on the four climate averages, reveals that under these conditions, P1 = P2 = P3 = P4 (IOC ≥ 0.50) represents the number of years where IOC strongly reflects rice yield reduction characteristics; P3 > P1 = P2 > P4 (0.15 ≤ IOC < 0.50) indicates the number of years where IOC weakly reflects such characteristics; and P4 > P1 = P2 > P3 (IOC < 0.15) signifies the number of years where IOC either does not reflect or only weakly reflects these characteristics. Ji Ruipeng et al.’s research conclusion [37] showed that the results of using climate mean value (P3) from 1981 to 2010 to assess the delayed type of chilling damage of rice in Liaoning Province were more consistent with the actual situation, and this paper is consistent with the conclusions of the study.
Table 2.
Verification of delayed growth-type rice cold damage identification under different average climatic states.
3.3. Evolutionary Patterns of Rice Delayed Cold Damage Based on P3 Climatic Mean
3.3.1. Time Variation Characteristic
From 1961 to 2020, there was a declining trend observed in delayed chilling damage of rice based on P3 identification. Severe chilling damage constituted the predominant type, accounting for 71.8%, followed by moderate chilling damage at 16.1% and light hilling damage at 12.1%. The duration of chilling damage at each research station ranged from 13 to 30 years, with severe chilling damage lasting between 9 and 25 years, moderate chilling damage lasting between 1 and 7 years, and light chilling damage ranging from 0 to 7 years. Notably, Nehe and Tangyuan stations did not report any cases of mild chilling damage.
The main rice-producing counties (cities) in Heilongjiang Province, namely, Bei’an, Tailai, Qing’an, Wuchang, and Hulin, exhibit a significant representation of large rice planting areas distributed across the north, west, middle, south, and east regions within the study area. Taking the aforementioned five stations as an example, Figure 4 illustrates that the negative temperature anomaly () of each station during May to September is predominantly concentrated prior to the mid-1990s, with most years falling below the indicator threshold and resulting in cold damage. The temporal variation characteristics can be summarized as follows: the 1960s–1970s witnessed a high occurrence period of cold damage, followed by a decreasing trend from the 1980s to mid-1990s, and finally transitioning into a low occurrence period from the mid-1990s. From the interdecadal changes (Table 3), a consistent overall decrease in the frequency of chilling damage of varying degrees was observed during the study period. Notably, this frequency was relatively high in the 1960s–1980s but significantly decreased after the 1990s, particularly dropping below 2.0% since the onset of the 21st century. While mild and moderate chilling damage exhibited a slight increase in occurrence during the 1980s–1990s, severe chilling injury continued to exhibit a significant decline and remained absent until the 2010s.
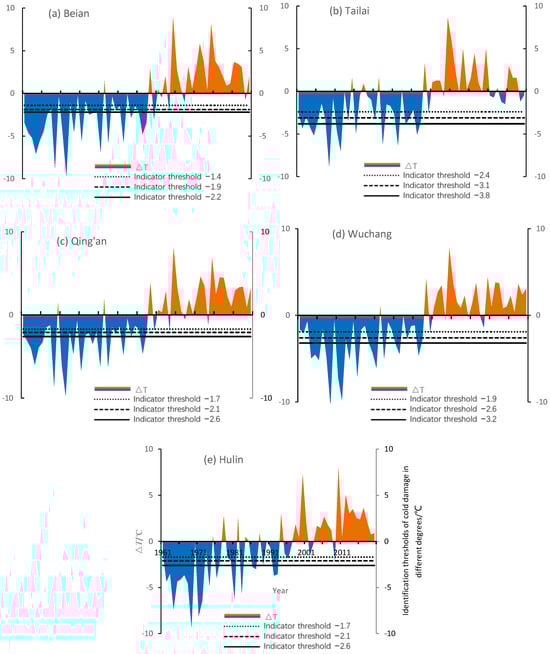
Figure 4.
Interannual variation of in Beian (a), Tailai (b), Qing’an (c), Wuchang (d), and Hulin (e) under from 1961 to 2020.
Table 3.
Interdecadal changes of frequency of delayed growth-type rice cold damage under in the study area.
3.3.2. Spatial Variation Characteristics
The frequency of delayed chilling damage in rice under P3 was generally higher in the western region compared to the eastern region. The occurrence of chilling damage varied between 21.7% and 50.0% across different stations within the study area. A cluster of high-frequency occurrences was observed in the northern and western regions, where approximately 26.5% of stations reported a chilling damage frequency exceeding 40.0%. Conversely, a low-frequency center was identified in the eastern and southeastern regions, with around 17.6% of stations reporting a chilling damage frequency below 30.0%, while approximately 55.9% of stations exhibited a cold injury frequency ranging from 31.7% to 38.3% (Figure 5).
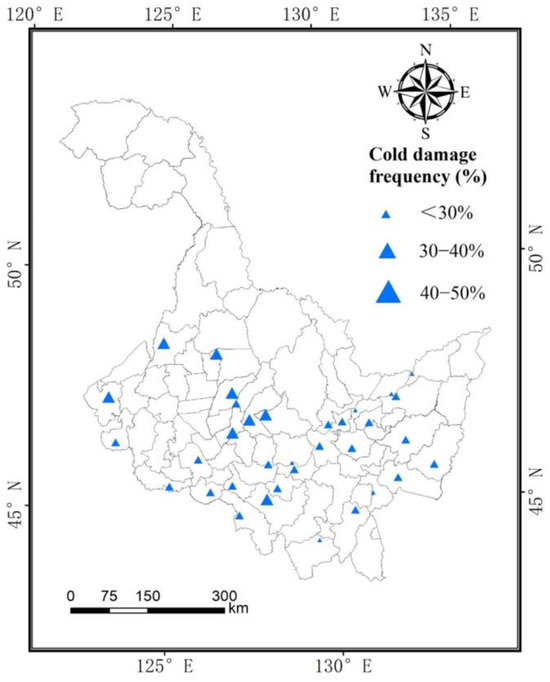
Figure 5.
Spatial distribution of frequency of delayed growth-type rice cold damage under in the study area from 1961 to 2020.
3.4. The Relationship between Temperature Difference and Relative Meteorological Yield of Rice
Utilizing the linear regression method, we eliminated years affected by droughts, floods, and frosts. Our analysis revealed a significantly positive correlation (p < 0.01) between these rice temperature anomalies from May to September at each station and its relative meteorological yield. This result showed that within a specific temperature range, a decrease in temperature anomalies during this period is associated with a decline in the relative meteorological yield of rice. Furthermore, it was observed that greater reductions in temperature anomalies from May to September corresponded to higher rice yields (Table 4). Within a specific temperature range, there exists a negative trend in relative meteorological yield of rice as temperature anomalies decrease from May to September. When these temperature anomalies reach the threshold index for delayed chilling damage, greater reductions in temperature anomalies during this period (indicating more severe chilling damage) result in higher decreases in rice yield.
Table 4.
The correlation between the anomalies of temperature during May to September and the relative meteorological yield of rice in the research area.
3.5. The Relationship between Temperature Difference and Maturity Zone
During the study period, under different climate averages showed a significantly increasing trend (p < 0.01), with an increase of 1.3 °C/10a, which expressed the climate warming characteristics in the study area. This index has the dual functions of identifying delayed chilling damage of rice and evaluating the trend of climate warming, and it is more reliable for the identification of chilling damage in rice. The number of chilling damage years in the study area under P1 and P4 is less or increased. The main reason is that the in the study area under the four climate averages shows a continuous increasing trend; the adjacent two climate averages increase by 1.2 °C, 1.7 °C, and 1.4 °C, respectively, with the climate averages moving backward; and increases from low to high, resulting in the of most years at each station in the study area increasing from large to small. For example, under P1, the is large, no chilling damage is identified, and the number of chilling damage years is less, while P4 is just the opposite—more chilling damage years are identified. The correlation between and the relative meteorological yield of rice reflects the variation trend of chilling damage index factor, thereby indicating the yield variation trend. This correlation also signifies the mutual influence among climate, rice, and chilling damage in both temporal and regional contexts. Based on research findings, temperature conditions during the growing season from May to September emerge as key factors limiting rice production in the study area, with temperature directly impacting rice yield.
With the continued warming, the ripening zones of rice belonging to the research stations under different climate averages changed (Table 5). Although the ripening zones of 20.6% of stations remained unchanged, ∆T under different climate averages was different, which led to the deviation in the identification of cold damage in some years. The Mann–Kendall test was used to test the mutation of average temperature and in the study area from May to September from 1961 to 2020, which showed that had a mutation in 1993. After the mutation, increased by 4.8 °C, and the standard deviation of before the mutation was greater than that after the mutation, indicating that the temperature significantly increased after the mutation, the temperature dispersion was weak, and the warming change was relatively stable. However, the P4 period primarily occurs after the mutation climatic shift, indicating its significant susceptibility to climate warming. This factor also contributes to the notable surge in the frequency of chilling damage years observed under P4. By considering 1993 as a demarcation point, further analysis of cold damage occurrences during the period from 1994 to 2020 under P4 reveals a substantial reduction in such events at each station, with only 2~6 years experiencing chilling damage.
Table 5.
Changes in the maturity zone of each station under different average climatic states in the study area.
4. Conclusions and Discussion
After detection and analysis, different climate averages exhibit significant disparities in the identification of delayed chilling damage in rice. This paper determines that P3 (30-year average from 1981 to 2010) is closer to the actual situation in the identification of delayed chilling damage of rice during 1961–2020, and it is more accurate in the identification of typical low-temperature chilling damage years such as 1964, 1969, 1972, 1976, 1983, 1987, 1989, and 1992. The temperature anomaly between May and September had a significant impact on the relative meteorological yield of rice in the study area (p < 0.01). As the temperature anomaly decreased from May to September, there was a corresponding decrease in the relative meteorological yield of rice.
This paper utilizes the temperature anomaly from May to September, as stipulated in the latest national standard [29], as the identification index for delayed chilling damage in rice. The threshold for this index is determined based on the ripening area of rice, taking into consideration both the effects of different ripening planting areas and the temperature sum during the growing season. As a result, this index possesses significant agronomical and meteorological significance. In contrast to previous studies [15,38,39], this paper comprehensively considers the impact of mean long-term climate change on identifying chilling damage using series data, thereby greatly enhancing both its accuracy and scientific validity.
This paper primarily discusses the impact of temperature anomalies on rice; however, it is important to note that climate change has multifaceted effects. This study reveals a consistent year-on-year increase in the accumulated temperature from May to September, indicating a significant rise in heat resources within Heilongjiang Province. Moreover, the warming rate exhibits an accelerated trend during the later interdecadal period, aligning with previous research findings [40,41]. In the P3 scenario, rice chilling injury exhibited a spatial distribution skewed towards the west and lighter in the east, showing a general decreasing trend. These findings were further corroborated by Yin’s research [42]. In conclusion, continuous research should be conducted on climate change and its impact on food security. According to the findings of this study, climate warming induces significant alterations in various climate averages, consequently impacting the identification of chilling damage outcomes. Therefore, when evaluating the occurrence patterns and change characteristics of chilling damage within long historical sequences, careful selection of climate averages is imperative. Considering both the distribution of climate averages and evaluation timeframe while accounting for actual climatic conditions, employing a rolling identification approach with diverse climate averages may enhance result accuracy. Furthermore, climate change affects rice yield, and subsequent studies on the effects of chilling damage, water, pests, and diseases on rice growth and yield can be carried out by combining field observation, field experiments, low-temperature and water control experiments, etc. This will provide valuable scientific insights for ensuring national food security. However, this paper does not delve into these aspects in detail, and further comprehensive investigations are warranted. An apparent limitation of the method is that delayed chilling damage in rice occurs over an extended period due to consistently low temperatures. Another form of chilling damage is known as sterile-type rice cold damage, where there is a brief but intense spell of low temperatures. Sterile-type rice cold damage specifies specific thresholds for temperature and duration under harmful conditions. Frost disasters occur when daily minimum temperatures drop below 0 °C during crop growth, leading to abnormal growth patterns. The occurrence of frost is also related to a significant decrease in temperature within a short period of time. Most studies have not addressed its distinct influence on delayed chilling damage. Frost disasters will be our focus for further research.
Author Contributions
Methodology, L.J. and X.L.; Software, Y.J.; Formal analysis, Q.W. and P.W.; Data curation, J.H., S.L. and Y.Z.; Writing—original draft, L.J.; Writing—review and editing, Z.C.; Visualization, H.C.; Project administration, L.J. All authors have read and agreed to the published version of the manuscript.
Funding
This research was funded by the National Key Research and Development Program of China (No. 2022YFD2300201) and the Joint Open Fund Project of the Shenyang Atmospheric Environment Research Institute of the China Meteorological Administration (2022SYIAEKFZD04-02).
Institutional Review Board Statement
Not applicable.
Informed Consent Statement
Not applicable.
Data Availability Statement
The data presented in this study are available on request from the corresponding author. The data are not publicly available because meteorological data with high temporal and spatial resolution are not suitable for public disclosure.
Conflicts of Interest
The authors declare no conflict of interest.
References
- Qin, D. Thomas Stocker. Highlighted from the IPCC Fifth Assessment Report of Working Group I. Clim. Chang. Res. 2014, 10, 1–6. [Google Scholar]
- Yang, Z.; Yang, W.; Liu, Z.; Gao, W.; Ren, T.; Shen, Y.; Yang, X. Effects of climate change on wind erosion in the three provinces of Northeast China. Chin. J. Appl. Ecol. 2023, 34, 2429–2435. [Google Scholar]
- Yang, X.; Liu, Z.; Chen, F. The possible effects of global warming on cropping systems in Chian VI. Possible effects of future climate change on Northern limits of cropping system in China. Sci. Agric. Sin. 2011, 44, 1562–1570. [Google Scholar]
- Ding, Y.H. Sustainalbe management and action in China under the increasing risks of global climate change. Engineering 2018, 4, 301–305. [Google Scholar] [CrossRef]
- Maina, M.M.; Shanono, N.J.; Bello, M.M.; Nasidi, N.M.; Abdullahi, M. Simulation of climate change effect on rice (Oryza sativa L.) production in Kano river irrigation scheme(Kris) using APSIM model. FUDMA J. Sci. 2023, 7, 21–27. [Google Scholar] [CrossRef]
- Zare, M.; Azam, S.; Sauchyn, D.; Basu, S. Assessment of Meteorological and Agricultural Drought Indices under Climate Change Scenarios in the South Saskatchewan River Basin, Canada. Sustainability 2023, 15, 5907. [Google Scholar] [CrossRef]
- Li, F.D.; Leng, P.F.; Zhang, Q.Y.; Song, S.; Qiao, Y.; Gu, C.; Zhang, Q.; Wu, L.; Mulubrhan, B.; Dagne, M.; et al. Understanding agriculture production and food security in Ethiopia from the perspective of China. J. Resour. Ecol. 2018, 9, 237–249. [Google Scholar]
- Jiang, L.Q.; Gong, L.J.; Jiang, L.X.; Li, X.; Cheng, M.; Zhang, X. Chilling injury monitoring and intensity identification of dryland maize in Heilongjiang. J. Sci. Food Agric. 2023, 103, 4573–4583. [Google Scholar] [CrossRef]
- Shi, Q.; Wang, H.H.; Zhao, L.M.; Zhao, L.-M.; Gu, C.-M.; Na, Y.-G.; Xie, B.; Cheng, S.-H.; Pan, G.-J. Application of brassinolide alleviates cold stress at the booting stage of rice. J. Integr. Agric. 2020, 19, 975–987. [Google Scholar]
- Ji, R.; Yu, W.; Feng, R.; Wu, J.; Zhang, Y. Construction and application of Rice Sterile-type cold damage index in cold area: A case study Liaoning Province. Prog. Geogr. 2017, 36, 437–445. [Google Scholar]
- Jiang, L.; Ji, S.; Li, S.; Wang, L.-M.; Han, J.-J.; Wang, L.-L.; Zhu, H.-X.; Ji, Y.-H. Relationship between rice empty grain rate and low temperature at booting stage in Heilongjiang Province. Chin. J. Appl. Ecol. 2010, 21, 1725–1730. [Google Scholar]
- da Cruz, R.P.; Sperotto, R.A.; Cargnelutti, D.; Adamski, J.M.; de FreitasTerra, T.; Fett, J.P. Avoiding damage and achieving cold tolerance in rice plants. Food Energy Secur. 2013, 2, 96–119. [Google Scholar] [CrossRef]
- Chen, D. Study on Monitoring and Evaluating the Chilling Injury of Rice in Northeast China by Remote-Sening and Crop Model; Nanjing University of Information Science and Technology: Nanjing, China, 2017. [Google Scholar]
- Ma, S.; Li, X.; Jin, L.; Xi, Z.; Deng, K.; Liu, X. Effects of cold accumulation temperature in different sub-flowering period on Japonica rice seed setting and chilling injury indexes in northeast China. J. Nat. Disasters 2019, 28, 153–159. [Google Scholar]
- Wang, X.; Yang, X.; Lv, S.; Chen, F. The possible effects of global warming on cropping systems in China XII. The possible effects of climate warming on grographical shift in safe planting area of rice in cold areas and the risk analysis of chilling damage. Sci. Agric. Sin. 2016, 49, 1859–1871. [Google Scholar]
- Diagi, B.E.; Edokpa, D.O.; Ajiere, S. Rice and Climate Change: Implication for Food Security in Nigeria: A Review. J. Geogr. Res. 2021, 4, 18–27. [Google Scholar]
- Qu, H.; Jiang, L.; Wang, D. Influence of climate change on sterile type cooling injury in rice in Heilongjiang Province, China. Acta Ecol. Sin. 2016, 36, 769–777. [Google Scholar]
- Fenza, M.D.; Hogg, B.; Grant, J.; Barth, S. Transcriptomic response of maize primary roots to low temperatures at seedling emergence. PeerJ 2017, 5, e2839. [Google Scholar] [CrossRef]
- Yoshida, R.; Fukui, S.; Yamazaki, T. Applicability of meteorological ensemble forecasting to predict summer cold damage in rice growth. J. Agric. Meteorol. 2020, 76, 129–139. [Google Scholar] [CrossRef]
- Qi, W.; He, L.; Wang, A.; Gu, X.; Zhou, Y. Remote Sensing Monitoring of Yield Loss of Multiple Cropping Paddy Caused by Low Temperature. Remote Sens. Technol. Appl. 2023, 38, 558–565. [Google Scholar]
- Tanure TM, D.P.; Domingues, E.P.; Aline, D.S.M. The regional economic impacts of climate change on family farming and large-scale agriculture in Brazil: A computable general equilibrium approach. Clim. Chang. Econ. 2023, 14, 2350012. [Google Scholar] [CrossRef]
- Yimam, D.A.; Holvoet, N. Assessing climate change vulnerability of smallholder farmers in northwest Ethiopia: Application of a household intrinsic vulnerability index. Int. J. Clim. Chang. Strateg. Manag. 2023, 15, 537–560. [Google Scholar] [CrossRef]
- Ma, S.; Quan, H.; Deng, K.; Liu, X.; Xi, Z.; Tong, L.; Chai, Q.; Yang, J.; Yang, R.; Pan, C.; et al. Effects of low temperature in Japonica rice flowering stage on seed setting based on a mountain temperature gradient. Chin. J. Ecol. 2018, 37, 1043–1050. [Google Scholar]
- Ma, S.; Xi, Z.; Ma, L.; Li, X.; Chen, S.; Wang, Q.; Zhang, S. Test and Comparison of Sustainable Suitability of Meteorological Indicators for Rice Cold Damages in the North of China. Meteorol. Mon. 2015, 41, 778–785. [Google Scholar]
- Du, C.; Jiang, L. Monitoring and Early Warning Technology of Cold Damage in Cold Region Rice; Meteorological Press: Beijing, China, 2017; pp. 80–110. [Google Scholar]
- Xu, S.; Yang, S.; Gao, P. Simulation of rice empty grain rate by coupling ORYZA2000 with sterile-type chilling injury loss evaluation model. Jiangsu Agric. Sci. 2018, 46, 68–73. [Google Scholar]
- Dong, S.-C.; Yang, X.-L.; Chi, L.-Y.; Che, W.-C.; Jiang, H.; Li, R.; Wang, L.-Z.; Zhang, X.-J.; Zhao, Q.; Li, W.-H.; et al. Detection of QTLs controlling cold tolerance at bud bursting stage by using a high-density SNP linkage map in Japonica rice. Acta Agron. Sin. 2020, 46, 1174–1184. [Google Scholar] [CrossRef]
- Yan, H.; Yuan, Y.; Wang, Y. Influence of climatological mean value change on climate operation in China under the global warming. Meteorol. Mon. 2022, 48, 284–298. [Google Scholar]
- Ma, S.; Ma, L.; Xi, Z.; Wang, Q.; Li, X.; Chen, S.; Ji, L.; Zhang, S.; Liu, J.; Jiang, L.; et al. GB/T 34967-2017; Grading of Cold Damage of Rice in Northern China. Standards Press of China: Beijing, China, 2017; pp. 1–4.
- Li, X.; Zhang, W.; Zhao, Y.; Du, Z.; Yang, S. Comparison study on main crop yield separation methods. J. Appl. Meteorol. Sci. 2020, 31, 74–82. [Google Scholar]
- Chen, F.; Yang, S.; Shen, S.; Jiang, X.; Hu, J.; Hu, N. Simulation model of relative meteorological yield of double cropping early rice in the middle and lower reaches of the Yangtze River based on principal component regression. Chin. J. Agrometeorol. 2014, 35, 522–528. [Google Scholar]
- Yang, H.; Zhao, X.; Wang, L. Review of Data Normalization Methods. Comput. Eng. Appl. 2023, 59, 13–22. [Google Scholar] [CrossRef]
- Yang, X.; Liu, Z.; Chen, F. The Possible Effects of Global Warming on Cropping Systems in China I. The Possible Effects of Climate Warming on Northern Limits of Cropping Systems and Crop Yields in China. Sci. Agric. Sin. 2010, 43, 329–336. [Google Scholar]
- Zhao, J.; Yang, X.; Liu, Z.; Cheng, D.; Wang, W.; Chen, F. The Possible Effect of Global Climate Changes on Cropping Systems Boundary in China II. The Characteristics of Climatic Variables and the Possible Effect on Northern Limits of Cropping Systems in South China. Sci. Agric. Sin. 2010, 43, 1860–1867. [Google Scholar]
- Li, K.; Yang, X.; Mu, C. The Possible Effects of Global Warming on Cropping Systems in China VIII—The Effects of Climate Change on Planting Boundaries of Different Winte-Spring Varieties of Winter Wheat in China. Sci. Agric. Sin. 2013, 46, 1583–1594. [Google Scholar]
- Wen, K. The History of Meteorological Disasters in Heilongjiang Province, China; Meteorological Press: Beijing, China, 2007; pp. 7–32. [Google Scholar]
- Ji, R.; Yu, W.; Wu, J.; Feng, R.; Zhang, Y.-s. Effect of climatic mean value change on the evaluation result of rice delayed cold damage in Liaoning Province, Northeast China. Chin. J. Appl. Ecol. 2015, 26, 1695–1703. [Google Scholar]
- Gong, L.; Li, S.; Jiang, L.; Zhu, H. Spatial-temporal characteristics of delayed cold injury for rice from 1961 to 2010 in Heilongjiang Province. J. Meteorol. Environ. 2015, 31, 76–83. [Google Scholar]
- Yao, M.; Zhang, Q.; Yang, Z.; Han, J.; Liu, X. Spatial-temporal variation of delayed/ster-type chilling injury in major growth periods in Jilin Province. Chin. J. Agrometeorol. 2022, 43, 50–60. [Google Scholar]
- Zhang, W.; Zhao, J.; Cui, W.; Li, M.; Li, E.; Gong, X.; Yang, X. Effects of changing normal and extreme climate states on maize meteorological yield in Northeast China. Sci. Agric. Sin. 2023, 56, 1859–1870. [Google Scholar]
- Chu, Z.; Guo, J.; Zhao, J. Impacts of future climate change on agroclimatic resources in Northeast China. J. Geogr. Sci. 2023, 27, 1044–1058. [Google Scholar] [CrossRef]
- Yin, J. Temproal and Spatial Distribution and Comprehensive Risk Assessment of Maize Delayed Chilling Injury in Northeast China; Shenyang Agricultural University: Shenyang, China, 2020. [Google Scholar]
Disclaimer/Publisher’s Note: The statements, opinions and data contained in all publications are solely those of the individual author(s) and contributor(s) and not of MDPI and/or the editor(s). MDPI and/or the editor(s) disclaim responsibility for any injury to people or property resulting from any ideas, methods, instructions or products referred to in the content. |
© 2024 by the authors. Licensee MDPI, Basel, Switzerland. This article is an open access article distributed under the terms and conditions of the Creative Commons Attribution (CC BY) license (https://creativecommons.org/licenses/by/4.0/).