Article

Near-Infrared-Based Measurement Method of Mass Flow Rate in Grain Vibration Feeding System

by
Yanan Zhang
1,
Zhan Zhao
1,*,
Xinyu Li
1,
Zhen Xue
1,2,
Mingzhi Jin
1 and
Boyu Deng
1
1
School of Agricultural Engineering, Jiangsu University, Zhenjiang 212013, China
2
Taizhou Xiechuang Agricultural Equipment Co., Ltd., Taizhou 225312, China
*
Author to whom correspondence should be addressed.
Agriculture 2024, 14(9), 1476; https://doi.org/10.3390/agriculture14091476
Submission received: 4 August 2024 / Revised: 22 August 2024 / Accepted: 27 August 2024 / Published: 29 August 2024
(This article belongs to the Section Agricultural Technology)

Abstract

:
The radial distribution of material feeding onto a screen surface is an important factor affecting vibration screening performance, and it is also the main basis for the optimization of the operating parameters of a vibration screening system. In this paper, based on near-infrared properties, a real-time measurement method for the mass flow rate of grain vibration feeding was proposed. A laser emitter and a silicon photocell were used as the measuring components, and the corresponding signal processing circuit mainly composed of a T-type I/V convertor, a voltage follower, a low-pass filter, and a setting circuit in series was designed. Calibration test results showed that the relationship between grain mass flow rate and output voltage could be described using the Gaussian regression model, and the coefficient of determination was greater than 0.98. According to the working principle of the grain cleaning system of combine harvesters, the dynamic characteristics of grain vibration feeding were analyzed using discrete element method (DEM) simulations, and the monitoring range of the sensor was determined. Finally, grain mass flow rate measurement tests were carried out on a vibration feeding test rig. The results indicated that the grain mass measurement error could be controlled within 5.0% with the average grain mass flow rate in the range of 3.0–5.0 g/mm·s. The proposed measurement method has potential application value in the uniform feeding control systems of vibration feeders.

1. Introduction

In many chemical, food, and agricultural industries, it is a widely used mechanism to feed granular material into a classification or clearing process at a desired mass flow rate [1,2]. The accurate control of mass flow rate is the basis for ensuring product quality, process reliability, and the efficient utilization of energy and raw materials [3]. Fluctuations in granular mass flow rate during continuous feeding operations are inevitable due to process- or equipment-related disturbances [4,5]. Therefore, it is an important task to propose a real-time measurement of mass flow according to the characteristics of the actual production process [6].
In recent years, many particle mass flow monitoring methods have been proposed in different application fields, such as pneumatic conveyors, screw or rotary feeders, and vibration feeders. Through experiments and DEM simulations, Minglani et al. summarized the granular flow, transport, and mixing behaviors in screw feeders and conveyors [7]. Suppan et al. proposed an electrical capacitance tomography-based method for the estimation of slug velocity and particle velocity in horizontal pneumatic conveyors [8]. Yuan et al. combined vibration and pneumatic pressure to achieve stable powder flow rates and a high delivery velocity [9]. According to the characteristic that a net electrostatic charge is generated on the surface of particles through movement interactions, some mass flow measurement methods of solid particles in pneumatic conveying pipelines using electrostatic sensors have been proposed [10,11]. Keep and Noble proposed the use of the particle tracking velocimetry technique for the visualization and evaluation of grain flow in pneumatic conveying systems [12]. This method requires special equipment and corresponding post-processing software, and it is difficult to achieve real-time performance. Singh et al. [13] proposed a real-time measurement method for powder packing density using near-infrared scanning spectral data and then applied it to a feed-forward/feed-back control of a continuous blending machine. Madarász et al. [14] designed a feeder operating speed control system, which included a high-speed camera image analysis system to measure the particle mass flow rate. The system is expensive and requires a high operating environment. Ruiz-Carcel et al. proposed an estimation method of powder mass flow rate in a screw feeder using acoustic emissions [15]. They used generalized norms and moments measured by structural-borne acoustic emissions as key statistical indicators to establish a general mass flow rate estimation model for different types of powders.
In the field of agricultural machinery, the measurement of grain mass flow mainly adopts four principles, i.e., impulse, volumetric, piezoelectric, and optical grating [16,17,18,19]. Load cells are used to sense the grain impulsive force, and a mathematical relationship can be established between the impulsive force and the mass flow rate [20,21]. The measuring range of impulse sensors is usually several kilograms per second. Machine vibration is an important factor that affects measurement accuracy, and a lot of improved measures such as filtering, vibration isolation, and double-plate differential calculations have been proposed [22]. Piezoelectric sensors mainly measure the number of collisions of the grains through the piezoelectric effects of the sensitive element [23]. Once two or more grains impact the sensitive element within a short time width, the sensor will cause errors due to missed counting, which makes its measuring range usually a few grams per second [24]. Impulse and piezoelectric sensors both use contact measurement methods, which not only require a certain installation space but also affect the airflow of the measurement environment. Photoelectric sensors are widely used non-contact sensors. According to the time width of grains blocking arranged photoelectric sensors, the mass flow rate in a certain area can be predicted [25,26,27]. When there are multiple grains simultaneously blocking the photoelectric sensor, a measurement error occurs. Therefore, its measuring range is small, and it is mainly used for measuring the seeding performance of precision seeders [28,29].
Cleaning is the key process of grain combine harvesting, and the grain cleaning performance directly determines the operational performance of harvesters [30,31]. A typical grain cleaning device mainly consists of a vibration feeder, a fan, a vibration screen, and screw conveyors, as shown in Figure 1. The grain is fed onto the screen surface through the vibration feeder. Under the action of airflow and vibration, the clean grains pass through the screen apertures and are then transported into the grain tank through the screw conveyors. A large number of studies have been carried out on the structural design, operating parameter optimization, and performance monitoring of cleaning systems. At present, this research is still ongoing [32,33,34]. Due to the structure and operating principles of the harvester, the grain radial distribution on the vibration feeder is uneven and time-varying. The consensus is that the uniform feeding of grain along the screen surface is an effective way of improving cleaning performance. Therefore, more and more harvesters are adopting the installation of guide strips on the vibration feeder surface to improve the grain movement direction so that the grain can be uniformly fed onto the vibration screen [35]. The state of the grain fed onto the vibration screen is discrete and dynamic. Impulse or piezoelectric sensors are not a good choice because the sensitive plate will affect the cleaning flow field. The measuring range of the arranged photoelectric sensor also cannot meet the requirements. So, accurately obtaining the grain feeding distribution is still a difficult problem.
In this paper, the attenuation characteristics of near-infrared light intensity that traveled through discrete grains were analyzed. The objective was to propose a near-infrared-based measurement method of mass flow rate, which could potentially be used for the real-time measurement of grain feeding distribution in cleaning systems. The near-infrared laser transmitter and silicon photocell were selected as measuring elements, and a corresponding signal processing circuit was designed. The variation in the output signal at different grain mass flow rates was analyzed. Finally, the feasibility of the proposed method was verified by grain vibration feeding tests.

2. Materials and Methods

2.1. Measurement Principle

A set of measuring components mainly consisting of a near-infrared laser emitter (Shenzhen Fulei Technology Co., Ltd., Shenzhen, China) and a silicon photocell aligned(Shanghai Xu’erhong Electronic Technology Co., Ltd., Shanghai, China) on a common axis were established. According to the Beer–Lambert law, the intensity of laser light will attenuate as it propagates in a material medium, which can be described as [36]
I = I 0 e μ l
where I is the light intensity, I0 is the initial light intensity, µ is the attenuation coefficient, and l is the distance that the light has traveled through.
The attenuation coefficient of a laser in grain is much greater than that in air. Therefore, the grain thickness on the laser propagation axis can be determined according to the laser light intensity received by the silicon photocell, and, thus, the grain mass flow on the axis can be calculated. The diameter of the laser emitter was 10 mm and the length was 30 mm. It emitted an infrared laser with a diameter of about 1 mm, and the power was 300 mW. The silicon wafer was 6 mm × 6 mm with a sensitivity of 0.57 A/W. The characteristic wavelength was 940 nm.

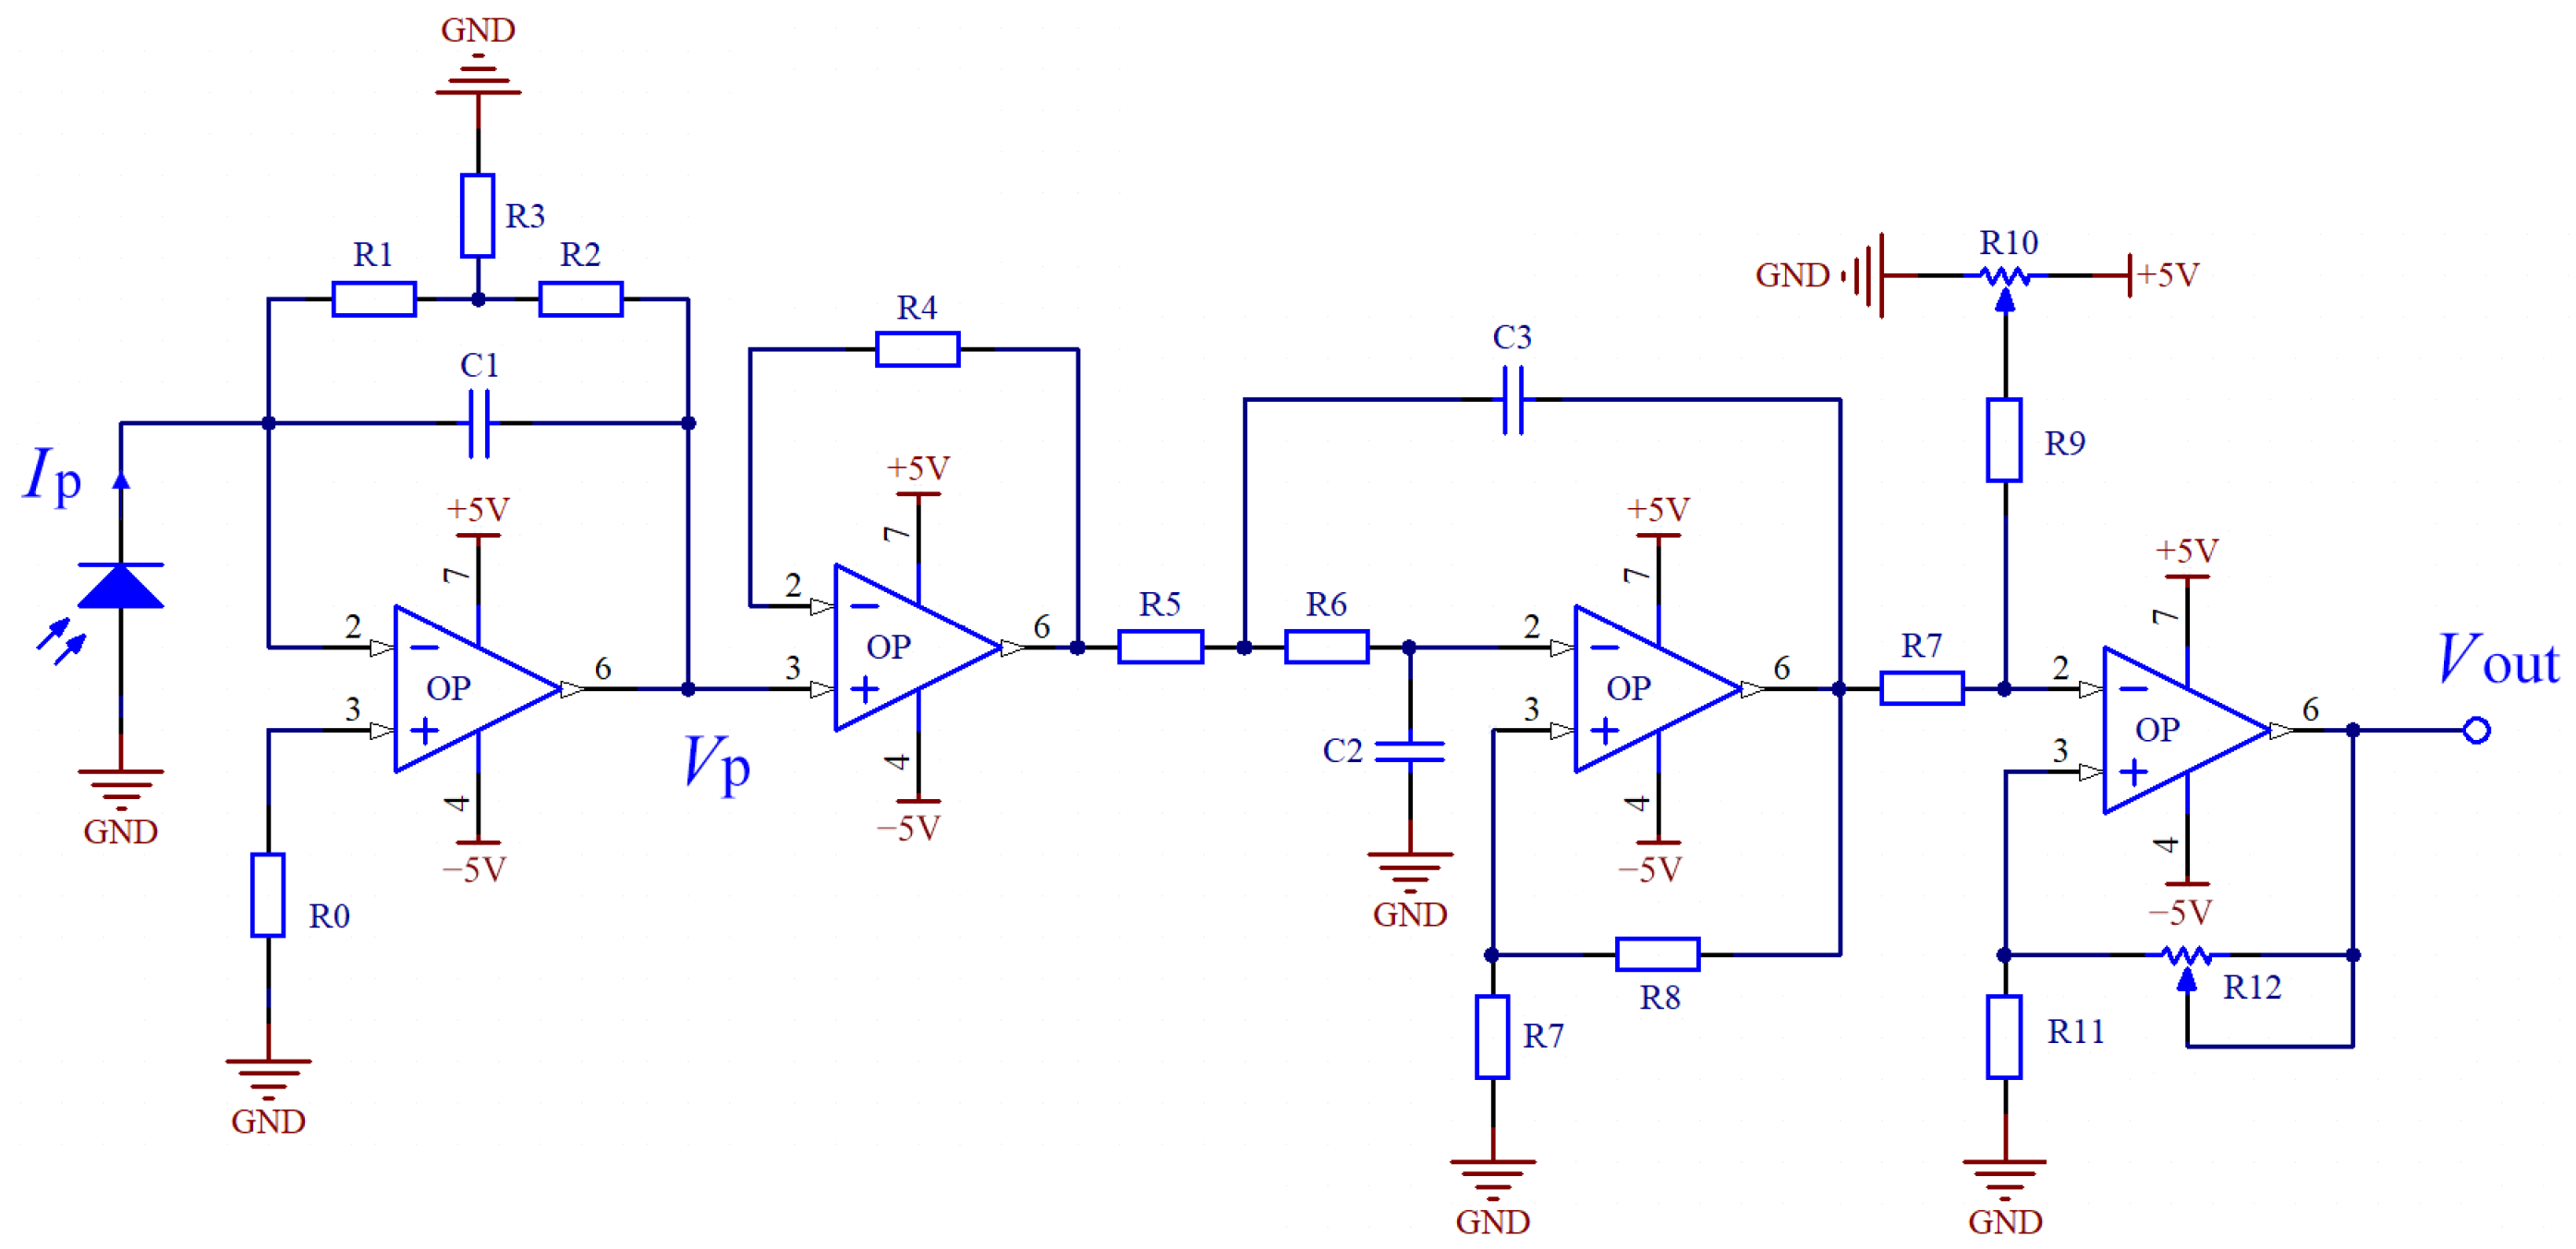
2.2. Signal Process Circuit

A silicon photocell is a semiconductor device that converts light energy into electrical energy. When a silicon photocell receives light, it outputs an electrical charge corresponding to the light intensity. The corresponding time is microseconds. A signal processing circuit was designed, as shown in Figure 2. It consists of a T-type I/V convertor, a voltage follower, a low-pass filter, and a setting circuit in series. The T-type I/V convertor linearly converts an electrical charge Ip to a voltage signal Vp. It can eliminate parasitic oscillations and improve the stability of the frequency response, thereby increasing the signal-to-noise ratio. The output voltage Vp can be calculated as
V p = I p ( R 1 + R 2 + R 1 R 2 R 3 )
A voltage follower with high input impedance and low output impedance was used as isolation to improve the load carrying capacity. Considering the fluctuation characteristics of the vibration feeding, a second-order low-pass filter with a critical frequency of 2.0 Hz was added to obtain a stabilized voltage signal, and finally, the output voltage Vout was modulated through the setting circuit.

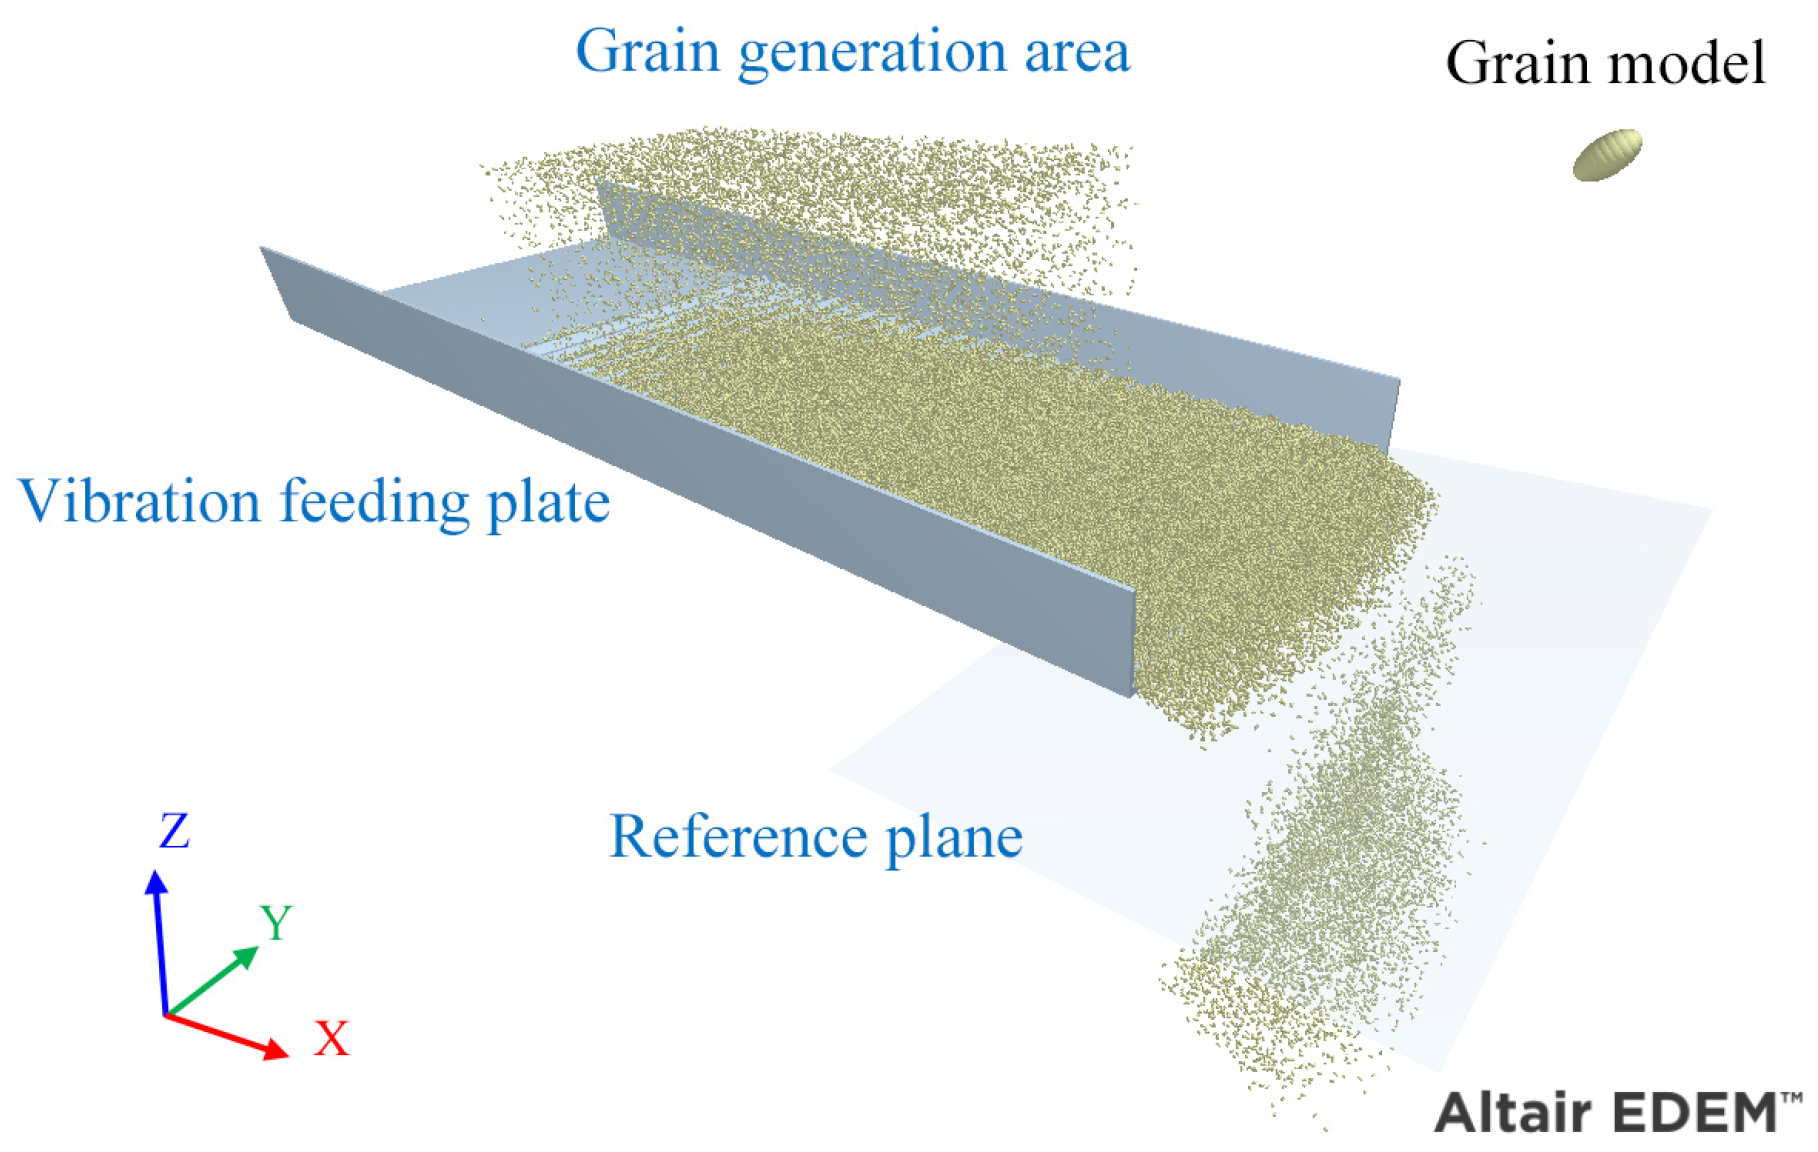
2.3. Vibration Feeding Dynamics

The material feeding dynamics is the basis of circuit parameter design. Today, DEM simulation is the most effective way to obtain the material vibration feeding process. By solving the contact forces and Newton’s equations of motion, DEM simulation can provide the motion state information of each particle, thus obtaining the dynamic behavior of the whole system [37,38]. Simulations were performed using commercial DEM 2020 software (EDEM®2020, EDEM, Edinburgh, UK). The Hertz–Mindlin non-slip contact model, which has been successfully applied to the dynamic analysis of agricultural materials, was used to calculate the interaction forces. According to the actual structure of the cleaning device of grain combine harvesters, the vibration feeding plate is designed as a rectangular corrugated plate with a length of 900 mm and a width of 450 mm. The vibration frequency and amplitude are 5 Hz and 16 mm, respectively. The basic DEM simulation parameters are shown in Table 1, and the general simulation mechanical parameters of grain vibration screening are given by Zhao et al. [39]. The grains fall uniformly from the generation area above the vibration plate, and the mass rate Mf is defined as the mass of grain falling per unit of plate width in a unit of time. Under the excitation of vibration, the material is transported to the end of the corrugated plate and finally falls from the discharge port. A reference plane is set below the feed port. By calculating the time, position, and velocity of grain passing through the reference plane, the dynamic characteristics of grain vibration feeding can be obtained. A graphic of the DEM simulation of the grain vibration feeding process is shown in Figure 3.

3. Results and Discussion

3.1. Material Feeding Characteristics

Since the grain uniformly falls onto the vibration plate, the radial distribution of the falling grain along the vibrating plate is generally uniform, although some random fluctuations are unavoidable. Therefore, to describe the falling process under vibration excitation, the mass flow rate γm is defined as
γ m = m p / L Δ t
where mp is the mass of grain passing through the reference plane at a time period Δt and L is the width of the vibration feeding plate.
The physical meaning of γm is the grain mass flow rate per unit of width. The motion of grain vibration feeding is close to a stable periodic motion after 5 s. When the height position of the reference plane is 5.0 cm, the statistical time period Δt is 5.0 ms and the mass rate of grain feeding Mf are 0.5, 1.0, and 2.0 g/mm·s; the change process of γm is shown in Figure 4. The grain falling motion is non-continuous and has similar periodic characteristics. Its frequency is consistent with the vibration frequency of the feeding plate. The peak value of γm is linearly related to the mass rate of grain feeding Mf, and the ratio can reach 4–5 times.

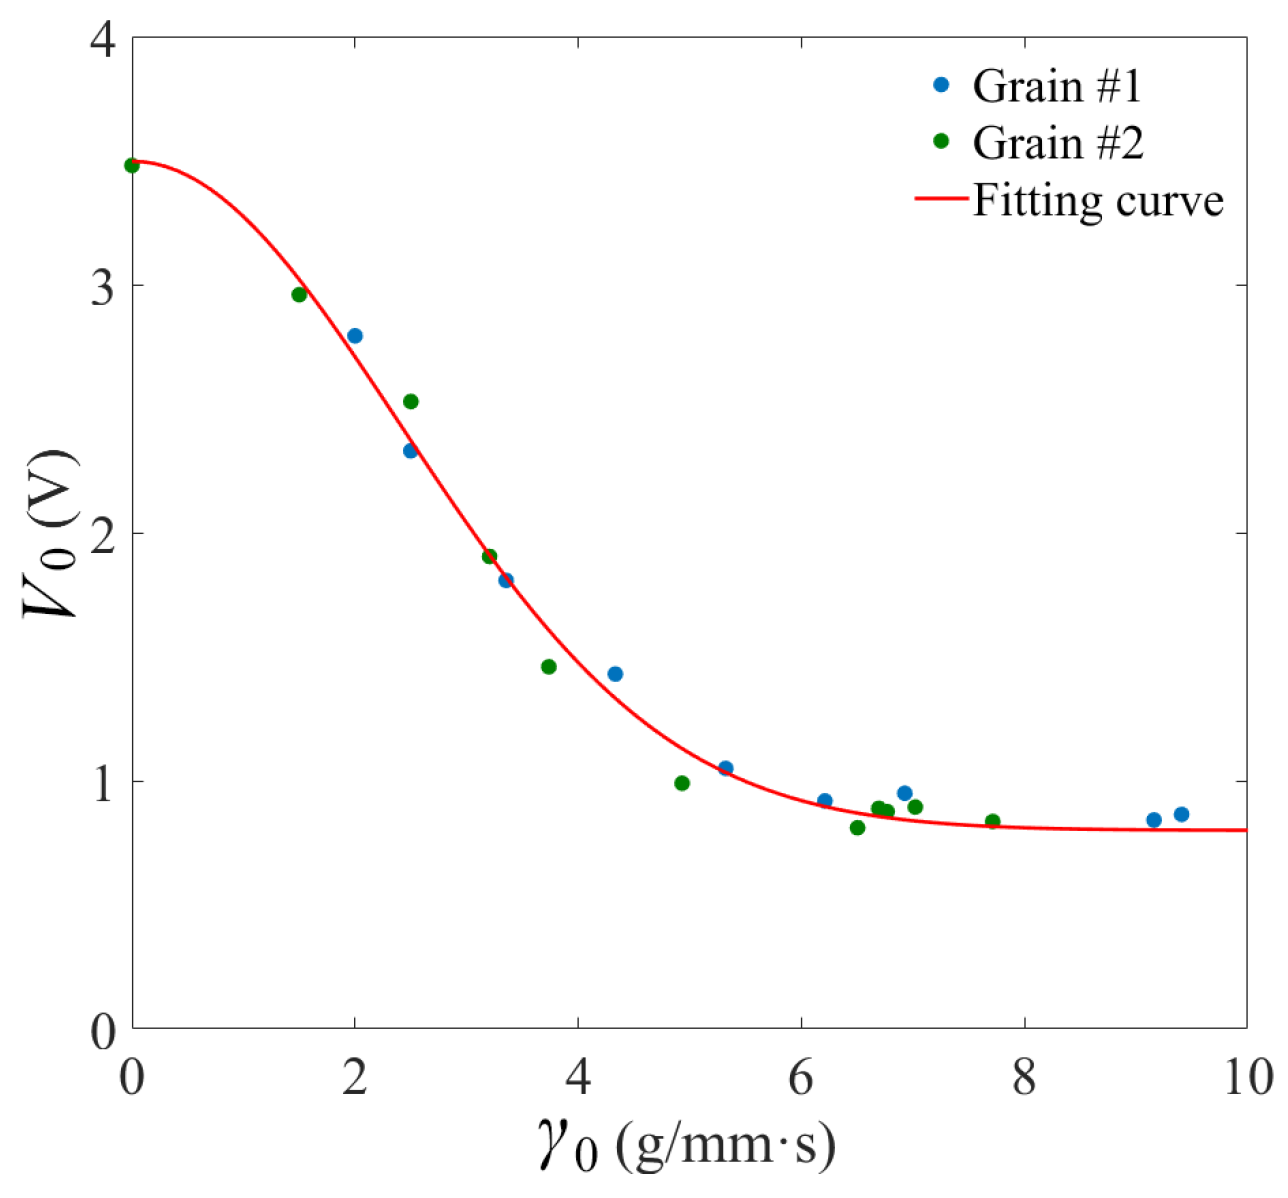
3.2. Calibration Tests

To establish the relationship between the mass flow rate γm and the output voltage Vout, calibration tests were carried out. Two types of rice grains were selected as test materials, and their semi-axes were Grain #1: 3.25 mm × 1.55 mm × 1.05 mm and Grain #2: 4.35 mm × 1.15 mm × 0.95, respectively. A grain flow channel with a length of 200 mm and a width of 10 mm was constructed. A laser emitter and a silicon photocell were symmetrically mounted on the same axis height. The grains were laid evenly on the conveyor belt. Under the transport of the conveyor belt with a constant linear velocity, the grains fall and pass through the channel. An A/D acquisition card was used to record changes in the output voltage Vout of the signal processing circuit. By changing the grain mass on the conveyor belt per unit length, the mass flow rate γm passing through the channel can be changed.
When the mass flow rate γm is small, the grains are separated from each other by larger distances. The passage of grains through the infrared measurement axis is transient and random. Test results show that it is difficult to obtain a continuous output voltage signal when γm is less than 1.0 g/mm·s. With the increase in γm, the stability of grain flow increases. When the γm are 2.0, 4.5, and 6.5 g/mm·s, the variations in output voltage Vout are shown in Figure 5. Although the grains fall evenly through the conveyor belt, due to the mutual collision of the grains and the uncertainty of the falling posture, the instantaneous γm and the process of blocking the infrared measurement axis still have a certain randomness. This causes Vout to fluctuate within a certain range, especially when γm is relatively small. The relationship between γm and Vout cannot be accurately established. Therefore, it is proposed to calculate the average grain mass flow rate γ0 and average output voltage V0 during the grain falling period ΔT, and the results are shown in Figure 6. In the actual grain cleaning process, the grains fed from the vibration feeder would include some short stalks, and the content is usually less than 10% [40]. Since V0 is the average voltage over a period of time, we do not find that small impurity ratios have a significant effect on the relationship shown in Figure 6.
It can be seen that there are no significant differences in the measurement results of the two types of grains. Due to the exponential decay law of light intensity, a Gaussian function is chosen to establish the relationship between γ0 and V0, which can be expressed as
V 0 = a e ( γ 0 / b ) 2 + c
where a represents the variation amplitude of V0, b is the attenuation coefficient, and c is the DC bias voltage. The least square method is used to calculate the minimum seeking optimization function of the residual sum of squares [41]. Based on the design of signal processing circuit parameters and experimental results, the obtained fitting coefficients are 2.75, 3.55, and 0.75, and the coefficient of determination (R2) is greater than 0.98.

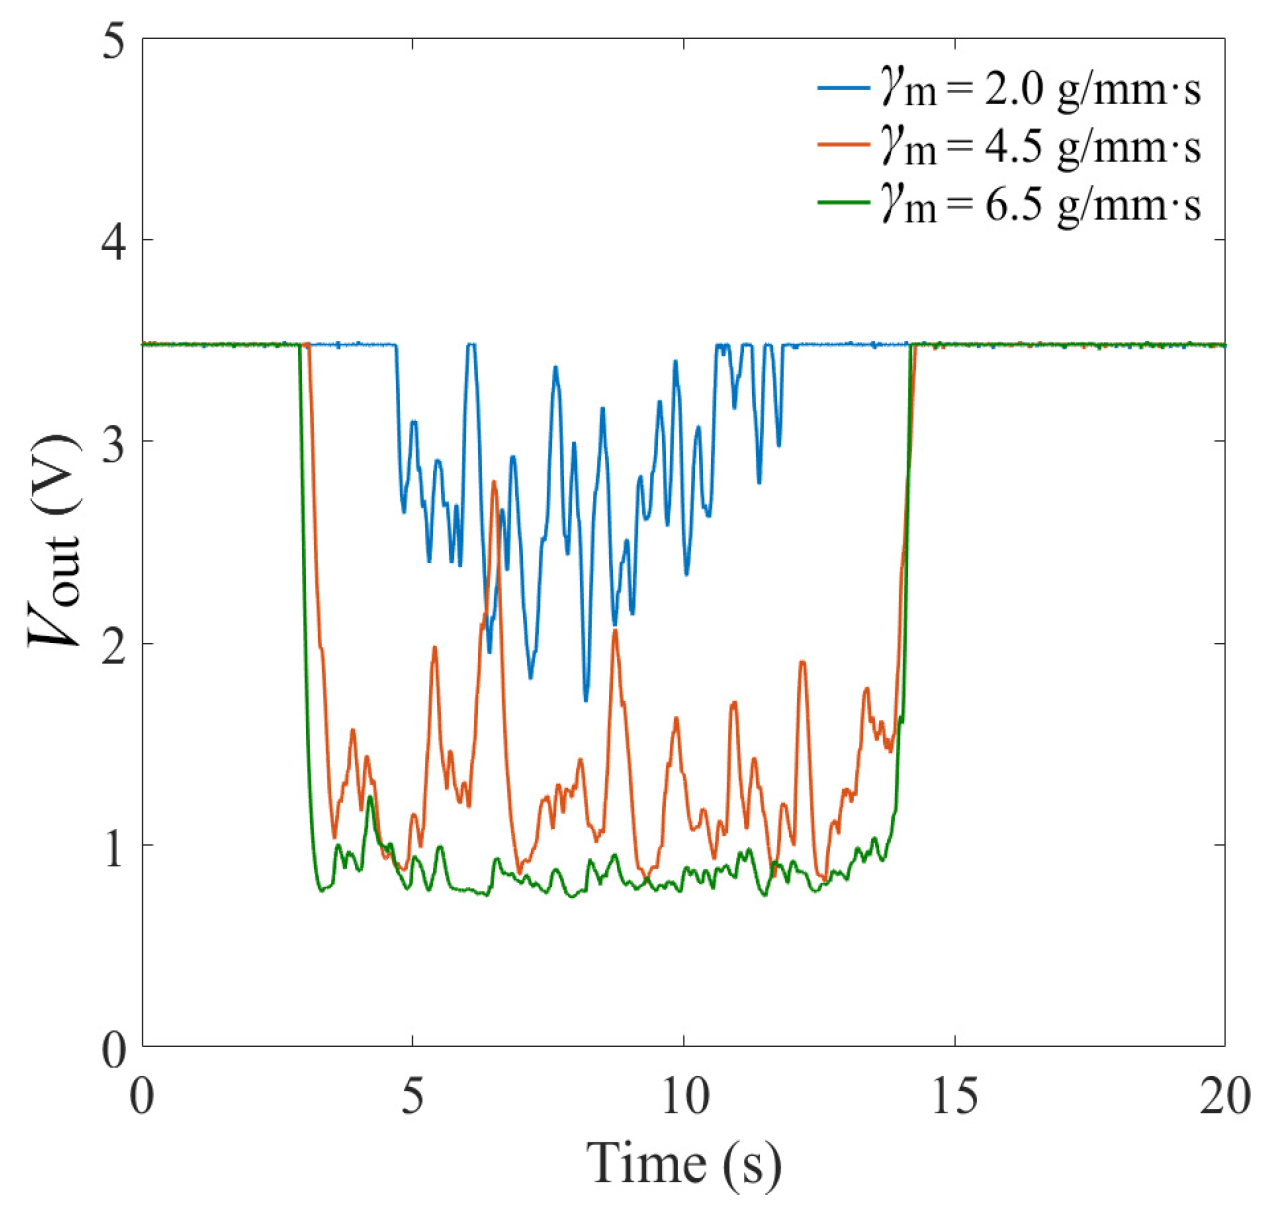
3.3. Vibration Feeding Measurement Tests

The grain vibration feeding measurement tests were carried out on a vibration feeding test rig, as shown in Figure 7. The feeder was suspended on four vertical slides using four booms. The feeder surface was a corrugated plate that reciprocated under the drive of a set of DC motors and crank linkage mechanisms. The main purpose of mass flow measurement is to determine the distribution of grain falling from the feeder so as to provide a basis for the adjustment of the operating parameters of the vibration screen. Here, two sets of measuring devices were placed on the left and right sides of the feeder. Two boxes were used to collect the grain passing through the two infrared detection channels.
The inclination angle of the feeder surface was set to 4°, and the vibration frequency and amplitude were 5 Hz and 16 mm, respectively. These are similar to the actual grain harvest cleaning system. During the tests, the grains were randomly laid on the conveyor belt and fed onto the feeder surface. Under vibration excitation, the grains were transferred to the rear and fell freely. The partially falling grains passed through two infrared detection channels and then entered the collection boxes. At the same time, the output voltages of the two sensors were recorded. The grains collected in the two boxes were weighed to obtain the total grain mass ML and MR. The mass flow rates γm_L and γm_R can be calculated by inputting the two output voltages Vout_L and Vout_R into Equation (4). Through the time integration of γm_L and γm_R, the measured total grain mass ML′ and MR´ can be obtained. Figure 8 gives the recorded output voltage and the corresponding calculated grain mass flow rate. The output voltage signal exhibited periodic fluctuations at a frequency of approximately 5 Hz, which is similar to the vibration frequency of the vibrating feeder.

3.4. Discussion

The vibration feeding of the material had obvious fluctuation characteristics, and the fluctuation period was similar to that of the vibration feeder. This is basically consistent with the dynamic characteristics of grain feeding obtained by DEM simulations shown in Figure 4. In this paper, two indices were proposed to evaluate the measurement performance. The first is the grain mass measurement error eM, which directly reflects the accuracy of the infrared measurement method. The second is the mass ratio error eχ, which can be calculated as follows:
e χ = χ χ / χ
where χ = ML/MR and χ′ = ML′/MR′.
The mass ratio χ reflects the difference in feeding grain mass between the left and right sides of the feeder. It is an important basis for the automatic control of the vibration screen surface attitude angle and guide strip angle [35,42]. This is because ensuring the uniformity of the radial distribution of the feeding material along the feeder can improve the uniformity of material distribution on the vibrating screen surface, thereby improving the screening performance.
Table 2 gives the measurement error analysis results of several feeding experiments. The vibration feeding of materials is random. When the average grain mass flow rate γ0 is in the range of 3.0–5.0 g/mm·s, the instantaneous grain mass flow rate mainly varies in the range of 2.0–6.0 g/mm·s. It can be seen from Figure 6 that infrared measurements have higher sensitivity in this range. The grain mass measurement error eM can be controlled within 5.0%. In one test, the dynamic characteristics of material feeding to the left and right measuring devices are similar. The mass ratio error eχ has better accuracy and stability and can effectively obtain the distribution of feeding material. As shown in tests 4 and 8, when γ0 is greater than 5.0 g/mm·s, the instantaneous grain mass flow rate may exceed 7.0 g/mm·s. The sensitivity of infrared measurement decreases rapidly, which directly leads to an increase in measurement error.

4. Conclusions

In this paper, a real-time measurement method for grain mass flow rate was proposed using the attenuation characteristics of near-infrared light. A silicon photocell was used to receive light emitted from a near-infrared laser emitter that passes through discrete moving grains. Then, a signal processing circuit was designed to convert the received light intensity into a voltage signal. When the grain was fed into the infrared measuring device, the Gaussian regression model could describe the relationship between the grain mass flow rate and the output voltage. Measurement tests were carried out on a vibration feeding test rig, which is similar to that of grain harvesters. When the average grain mass flow rate is in the range of 3.0–5.0 g/mm·s, the grain mass measurement error can be controlled within 5.0%, and the mass ratio error has better accuracy and stability.
The proposed method is a non-contact measurement method. Compared to pulse, volume, and piezoelectric measuring devices, silicon photovoltaic cells and near-infrared laser emitters are easy to install and do not affect the cleaning flow field. Therefore, it is a feasible method to obtain the radial distribution state of the material fed onto the vibration screen through the array near-infrared measuring device. In future research work, on the basis of the work in this paper, a control strategy can be further proposed to optimize the vibration feeder to make the materials enter the vibrating screen more uniformly, which should be a potential way to improve the cleaning performance of combine harvesters.

Author Contributions

Z.Z. provided project management and financial support; Y.Z. designed the signal processing circuit, carried out calibration experiments, and wrote the paper; X.L. conducted simulations to analyze the dynamic characteristics of grain vibration feeding; M.J. performed the tests; and Z.X. and B.D. directed the study. All authors have read and agreed to the published version of the manuscript.

Funding

This work was supported by the Natural Science Foundation of China (52375247), the Modern Agricultural Machinery Equipment and Technology Demonstration Project of Jiangsu Province (No. NJ2023-10), the Graduate Research and Innovation Projects of Jiangsu Province (No. KYCX21-3380), and a Project Funded by the Priority Academic Program Development of Jiangsu Higher Education Institutions (PAPD-2023-87).

Data Availability Statement

The data presented in this study are available in the article.

Conflicts of Interest

Author Zhen Xue was employed by the company Taizhou Xiechuang Agricultural Equipment Co., Ltd. The remaining authors declare that the research was conducted in the absence of any commercial or financial relationships that could be construed as a potential conflict of interest.

References

  1. Ortega-Rivas, E. Bulk properties of food particulate materials: An appraisal of their characterisation and relevance in processing. Food Bioprocess Technol. 2008, 2, 28–44. [Google Scholar] [CrossRef]
  2. Qian, X.; Yan, Y. Flow measurement of biomass and blended biomass fuels in pneumatic conveying pipelines using electrostatic sensor-arrays. IEEE Trans. Instrum. Meas. 2012, 61, 1343–1352. [Google Scholar] [CrossRef]
  3. Thayalan, V.; Landers, R.G. Regulation of powder mass flow rate in gravity-fed powder feeder systems. J. Manuf. Process. 2006, 8, 121–132. [Google Scholar] [CrossRef]
  4. Stranzinger, S.; Faulhammer, E.; Li, J.; Dong, R.; Khinast, J.G.; Zeitler, J.A.; Markl, D. Measuring bulk density variations in a moving powder bed via terahertz in-line sensing. Powder Technol. 2019, 344, 152–160. [Google Scholar] [CrossRef]
  5. Kruisz, J.; Rehrl, J.; Hörmann-Kincses, T.R.; Khinast, J.G. Effects of signal processing on the relative standard deviation in powder feeding characterization for continuous manufacturing. Powder Technol. 2021, 389, 536–548. [Google Scholar] [CrossRef]
  6. Du, J.; Liu, C.; Wang, C.; Wu, P.; Ding, Y.; Wang, L. Discharge of granular materials in a hemispherical bottom silo under vertical vibration. Powder Technol. 2020, 372, 128–135. [Google Scholar] [CrossRef]
  7. Minglani, D.; Sharma, A.; Pandey, H.; Dayal, R.; Joshi, J.B.; Subramaniam, S. A review of granular flow in screw feeders and conveyors. Powder Technol. 2020, 366, 369–381. [Google Scholar] [CrossRef]
  8. Suppan, T.; Neumayer, M.; Bretterklieber, T.; Puttinger, S.; Feilmayr, C.; Schuster, S.; Wegleiter, H. Electrical capacitance tomography-based estimation of slug flow parameters in horizontally aligned pneumatic conveyors. Powder Technol. 2023, 420, 118418. [Google Scholar] [CrossRef]
  9. Yuan, Y.; Yu, K.; Zhu, H.; Ehmann, K.F. Continuous feeding of powders with vibration and pneumatic pressure assistance for laser-based additive manufacturing processes. J. Manuf. Process. 2022, 82, 336–346. [Google Scholar] [CrossRef]
  10. Qian, X.; Huang, X.; Yonghui, H.; Yan, Y. Pulverized coal flow metering on a full-scale power plant using electrostatic sensor arrays. Flow Meas. Instrum. 2014, 40, 185–191. [Google Scholar] [CrossRef]
  11. Abbas, F.; Wang, L.; Yan, Y. Mass flow rate measurement of solids in a pneumatic conveying pipeline in different orientations. Meas. Sens. 2020, 10–12, 100021. [Google Scholar] [CrossRef]
  12. Keep, T.; Noble, S.D. Optical flow profiling method for visualization and evaluation of flow disturbances in agricultural pneumatic conveyance systems. Comput. Electron. Agric. 2015, 118, 159–166. [Google Scholar] [CrossRef]
  13. Smith, R.; Sparks, D.R.; Riley, D.; Najafi, N. A MEMS-based Coriolis mass flow sensor for industrial applications. IEEE Trans. Ind. Electron. 2009, 56, 1066–1071. [Google Scholar] [CrossRef]
  14. Madarasz, L.; Kote, A.; Gyurkes, M.; Farkas, A.; Hambalko, B.; Pataki, H.; Fulop, G.; Marosi, G.; Lengyel, L.; Casian, T.; et al. Videometric mass flow control: A new method for real-time measurement and feedback control of powder micro-feeding based on image analysis. Int. J. Pharm. 2020, 580, 119223. [Google Scholar] [CrossRef] [PubMed]
  15. Ruiz-Carcel, C.; Starr, A.; Nsugbe, E. Estimation of powder mass flow rate in a screw feeder using acoustic emissions. Powder Technol. 2017, 336, 122–130. [Google Scholar] [CrossRef]
  16. Besharati, B.; Navid, H.; Karimi, H.; Behfar, H.; Eskandari, I. Development of an infrared seed-sensing system to estimate flow rates based on physical properties of seeds. Comput. Electron. Agric. 2019, 162, 874–881. [Google Scholar] [CrossRef]
  17. Liu, R.; Sun, Y.; Li, M.; Zhang, M.; Zhang, Z.; Li, H.; Yang, W. Development and application experiments of a grain yield monitoring system. Comput. Electron. Agric. 2022, 195, 106851. [Google Scholar] [CrossRef]
  18. Reyns, P.; Missotten, B.; Ramon, H.; De Baerdemaeker, J. A review of combine sensors for precision farming. Precis. Agric. 2002, 3, 169–182. [Google Scholar] [CrossRef]
  19. Cheng, S.; Han, H.; Qi, J.; Ma, Q.; Liu, J.; An, D.; Yang, Y. Design and Experiment of Real-Time Grain Yield Monitoring System for Corn Kernel Harvester. Agriculture 2023, 13, 294. [Google Scholar] [CrossRef]
  20. Loghavi, M.; Ehsani, R.; Reeder, R. Development of a portable grain mass flow sensor test rig. Comput. Electron. Agric. 2008, 61, 160–168. [Google Scholar] [CrossRef]
  21. Zhou, J.; Cong, B.; Liu, C. Elimination of vibration noise from an impact-type grain mass flow sensor. Precis. Agric. 2014, 15, 627–638. [Google Scholar] [CrossRef]
  22. Liang, Z.; Li, Y.; Xu, L.; Zhao, Z.; Tang, Z. Optimum design of an array structure for the grain loss sensor to upgrade its resolution for harvesting rice in a combine harvester. Biosyst. Eng. 2017, 157, 24–34. [Google Scholar] [CrossRef]
  23. Liang, Z.; Li, Y.; Xu, L.; Zhao, Z. Sensor for monitoring rice grain sieve losses in combine harvesters. Biosyst. Eng. 2016, 147, 51–66. [Google Scholar] [CrossRef]
  24. Jin, M.; Zhao, Z.; Chen, S.; Chen, J. Improved piezoelectric grain cleaning loss sensor based on adaptive neuro-fuzzy inference system. Precis. Agric. 2022, 23, 1174–1188. [Google Scholar] [CrossRef]
  25. Fang, Y.; Chen, Z.; Wu, L.; Farhan, S.M.; Zhou, M.; Yin, J. Design and Experiments of a Convex Curved Surface Type Grain Yield Monitoring System. Electronics 2024, 13, 254. [Google Scholar] [CrossRef]
  26. Zhang, J.; Hou, Y.; Ji, W.; Zheng, P.; Yan, S.; Hou, S.; Cai, C. Evaluation of a Real-Time Monitoring and Management System of Soybean Precision Seed Metering Devices. Agronomy 2023, 13, 541. [Google Scholar] [CrossRef]
  27. Zagainov, N.; Kostyuchenkov, N.; Huang, Y.X.; Sugirbay, A.; Xian, J. Line laser based sensor for real-time seed counting and seed miss detection for precision planter. Opt. Laser Technol. 2023, 167, 109742. [Google Scholar] [CrossRef]
  28. Liu, W.; Hu, J.; Zhao, X.; Pan, H.; Ali Lakhiar, I.; Wang, W. Development and experimental analysis of an intelligent sensor for monitoring seed flow rate based on a seed flow reconstruction technique. Comput. Electron. Agric. 2019, 164, 104899. [Google Scholar] [CrossRef]
  29. Jiang, M.; Liu, C.; Du, X.; Huang, R.; Dai, L.; Yuan, H. Research on continuous granular material flow detection method and sensor. Measurement 2021, 182, 109773. [Google Scholar] [CrossRef]
  30. Xu, L.; Li, Y.; Chai, X.; Wang, G.; Li, B. Numerical simulation of gas–solid two-phase flow to predict the cleaning performance of rice combine harvesters. Biosyst. Eng. 2020, 157, 24–34. [Google Scholar] [CrossRef]
  31. Feng, X.; Gong, Z.; Wang, L.; Yu, Y.; Song, L. Behavior of maize particle penetrating a sieve hole based on the particle centroid in an air-screen cleaning unit. Powder Technol. 2021, 385, 501–516. [Google Scholar] [CrossRef]
  32. Chai, X.; Xu, L.; Sun, Y.; Liang, Z.; Li, Y. Development of a cleaning fan for a rice combine harvester using computational fluid dynamics and response surface methodology to optimise outlet airflow distribution. Biosyst. Eng. 2020, 192, 232–244. [Google Scholar] [CrossRef]
  33. Zhang, M.; Jiang, L.; Wu, C.; Wang, G. Design and test of cleaning loss kernel recognition system for corn combine harvester. Agronomy 2022, 12, 1145. [Google Scholar] [CrossRef]
  34. Liang, Z.; Wada, M.E. Development of cleaning systems for combine harvesters: A review. Biosyst. Eng. 2023, 236, 79–102. [Google Scholar] [CrossRef]
  35. Chai, X.; Zhou, Y.; Xu, L.; Li, Y.; Li, Y.; Lv, L. Effect of guide strips on the distribution of threshed outputs and cleaning losses for a tangential-longitudinal flow rice combine harvester. Biosyst. Eng. 2020, 198, 223–234. [Google Scholar] [CrossRef]
  36. Beć, K.B.; Grabska, J.; Huck, C.W. Physical principles of infrared spectroscopy. Compr. Anal. Chem. 2022, 98, 1–43. [Google Scholar] [CrossRef]
  37. Ma, H.; Zhou, L.; Liu, Z.; Chen, M.; Xia, X.; Zhao, Y. A review of recent development for the CFD-DEM investigations of non-spherical particles. Powder Technol. 2022, 412, 117972. [Google Scholar] [CrossRef]
  38. Zhao, G.; Pu, K.; Xu, N.; Gong, S.; Wang, X. Simulation of particles motion on a double vibrating flip-flow screen surface based on FEM and DEM coupling. Powder Technol. 2023, 421, 118422. [Google Scholar] [CrossRef]
  39. Zhao, Z.; Zhang, Y.; Qin, F.; Jin, M. Kinetic model of vibration screening for granular materials based on biological neural network. Powder Technol. 2024, 88, 98–106. [Google Scholar] [CrossRef]
  40. Wang, L.; Chai, X.; Huang, J.; Hu, J.; Cui, Z.J.A. Efficient and low-loss cleaning method for non-uniform distribution of threshed materials based on multi-wing curved combination air screen in computational fluid dynamics/discrete element method simulations. Agriculture 2024, 14, 895. [Google Scholar] [CrossRef]
  41. De Souza, S.V.; Junqueira, R.G. A Procedure to Assess Linearity by Ordinary Least Squares Method. Anal. Chim. Acta 2005, 552, 25–35. [Google Scholar] [CrossRef]
  42. Zhu, L.; Chen, S.; Zhao, Z.; Ding, H.; Zhu, Y. Influence of sieve surface attitude on sieving performance of cranular materials with non-uniform feeding conditions. Agriculture 2022, 12, 2023. [Google Scholar] [CrossRef]
Figure 1. Schematic diagram of grain cleaning device.
Agriculture 14 01476 g001
Figure 2. Signal processing circuit.
Agriculture 14 01476 g002
Figure 3. Snapshot of DEM simulation.
Agriculture 14 01476 g003
Figure 4. Variation of grain mass flow rate.
Agriculture 14 01476 g004
Figure 5. Variations in output voltage at different grain mass flow rates.
Agriculture 14 01476 g005
Figure 6. Relationship between average output voltage and average grain mass flow rate.
Agriculture 14 01476 g006
Figure 7. Structure of experimental system.
Agriculture 14 01476 g007
Figure 8. Recorded output voltage and corresponding grain mass flow rate.
Agriculture 14 01476 g008
Table 1. DEM simulates the physical characteristics of grain and carbon steel.
MaterialGrainScreen
Density (kg/m3)11507800
Shear modulus (MPa)37572,000
Poisson’s ratio0.250.33
Table 2. Measurement error analysis results.
MaterialNumberSensorActual ValueMeasurement ResultError Analysis
γ0/g/mm·sGrain Mass/gMass Ratio χGrain Mass/gMass Ratio χeM/%eχ/%
Grain #1Test #1Sensor_L3.30437.71.36521.01.336.171.70
Sensor_R3.79595.2698.13.99
Test #2Sensor_L3.85542.51.67570.31.544.885.03
Sensor_R5.44908.9881.13.14
Test #3Sensor_L3.67608.61.54602.91.620.943.08
Sensor_R5.32939.9977.63.86
Test #4Sensor_L5.23538.11.61576.41.415.178.82
Sensor_R6.61866.9800.58.30
Grain #2Test #5Sensor_L3.83550.11.24566.71.263.021.01
Sensor_R4.43685.9715.64.33
Test #6Sensor_L4.32487.01.42480.41.331.364.75
Sensor_R5.31690.2637.97.58
Test #7Sensor_L4.78987.81.30724.01.335.202.18
Sensor_R5.57891.2965.18.30
Test #8Sensor_L4.47578.61.47598.91.283.5110.38
Sensor_R6.28852.5765.410.21
Disclaimer/Publisher’s Note: The statements, opinions and data contained in all publications are solely those of the individual author(s) and contributor(s) and not of MDPI and/or the editor(s). MDPI and/or the editor(s) disclaim responsibility for any injury to people or property resulting from any ideas, methods, instructions or products referred to in the content.

