Article

Interaction Effects of Water and Nitrogen Practices on Wheat Yield, Water and Nitrogen Productivity under Drip Fertigation in Northern China

1
State Key Laboratory of North China Crop Improvement and Regulation, Baoding 071000, China
2
College of Resources and Environmental Sciences, Hebei Agricultural University, Baoding 071000, China
3
College of Agronomy, Hebei Agricultural University, Baoding 071000, China
4
Key Laboratory of Crop Growth Regulation of Hebei Province, Baoding 071001, China
5
Key Laboratory of North China Water-Saving Agriculture, Ministry of Agriculture and Rural Affairs, Baoding 071001, China
*
Author to whom correspondence should be addressed.
Agriculture 2024, 14(9), 1496; https://doi.org/10.3390/agriculture14091496
Submission received: 27 June 2024 / Revised: 4 August 2024 / Accepted: 22 August 2024 / Published: 2 September 2024
(This article belongs to the Section Agricultural Water Management)

Abstract

:
Water resource shortage and unreasonable application of nitrogen (N) fertilizer have been problems in wheat production of northern China. However, the interaction effects of water regimes and N practices on wheat root growth, grain yield, soil water, and inorganic N changes as well as water-N use efficiency are still unclear under drip irrigation. A field experiment was conducted during the 2020–2021 and 2021–2022 winter wheat (Triticum aestivum) growing seasons. In this study, three irrigation schedules (i.e., irrigation was applied up to 80% [D1], 75% [D2], and 70% [D3] as soon as the soil water content decreased to 65%, 60% or 55% of field capacity) and two N practices (i.e., N applied at the base, jointing, booting stages were 90, 72, 48 kg ha−1 [N1], and the base, jointing, booting, filling stages were 90, 40, 40, 40 kg ha−1 [N2], respectively) were considered. The decease in irrigation water amount was offset by the increase in soil water consumption. In addition, N practices significantly interacted with irrigation on soil NO3–N accumulation (2021–2022), NH4+–N accumulation, SPAD value (2020–2021), N content in stems and grains at maturity, and average root length and weight density at the flowering stage. Irrigation, rather than N practices, significantly affected grain yield, total N uptake, crop N transformations (NT), the contribution of NT to grain (NTPC), water and N productivity, in which, for the value of these two seasons, D2 increased total N uptake by 18.1% (p < 0.05), and NT by 39.4% (p < 0.05) under N1 as compared to D3. Additionally, the highest WUE and ANUE were found in D2 during 2021–2022. Heavy irrigation water amount caused high a LAI; further analysis proved that the LAI was the key factor affecting grain yield, and positively and significantly correlated to yield. However, no significant difference in the LAI between D1 and D2 was found. N1 was beneficial to prevent N leaching and increase water and N use efficiency, biomass, and N transformation amount. This study recommends that D2 + N1 might be a promising system for manipulating irrigation and fertilization practices under sub-surface drip irrigation systems to improve water and N use efficiency and grain yields in semi-arid regions.

1. Introduction

Wheat (Triticum aestivum L.) is one of the world’s most important food crops and plays a key role in global food security and stability [1]. Globally, drought and water scarcity have been increasing the competition for water resources in arid and semi-arid regions of the world to meet the sustained demands for increased crop yield per unit area [2,3]. In northern China, the rainfall in winter wheat season accounted for 10–30% of total annual rainfall, which caused a water shortage of up to 200–300 mm per season [4,5]. Accordingly, winter wheat production is irrigated by pumping groundwater for more than 30 years [6,7]. Consequently, problems such as a decrease in groundwater table, the low productivity of water resources and N losses have become increasingly prominent [8,9]. Recently, developing water-saving irrigation strategies for improving water and N use efficiency has become necessary to ensure food security in this area [3,10].
Adequate N and water supplies through drip irrigation systems for wheat requirements are essential to increase grain yields [11,12,13]. Previous studies in this region have suggested that the suitable N rate is 180–240 kg ha−1 [14,15]. However, the unreasonable N fertilized has brought a series of problems to the environment [16]. For example, currently, some N fertilizer is applied during sowing, and the rest is top-dressed during re-greening stage, which might cause N volatilization and leaching due to the lower requirement for fertilizer N in the early wheat growth stage [8]. And some evidence indicated that topdressing fertilizer N in the late growth stages (e.g., flowering, filling) can effectively enhance grain yield and N use efficiency [14,17]. The Soil and Plant Analysis Development (SPAD) and leaf area index (LAI) values, soil conditions, and root characteristics play an important role in crop N and irrigation water utilization [18,19]. Drip irrigation might increase chlorophyll content and water consumption at post-anthesis and root length density at a deeper soil layer (below 80 cm), which increased the efficient utilized of deep soil water and fertilizer, and the efficient formation of photosynthate, thus improved yield by 10–12% [20,21]. Additionally, Guo et al. [22] found that the grain and biomass yield were increased by 15.2–22.0%, and 7.8–9.7% when irrigation water consumption was declined by 20%, respectively. Therefore, soil moisture and fine root biomass might be the main contributors to affect yield formation [23,24]. Additionally, the collaborative and optimized management of irrigation water and fertilizer N significantly influenced root partitioning, and in return affected the utilization of soil water and nitrogen [25]. Crop N uptake would be restricted under insufficient soil water conditions. Hence, balancing irrigation water and fertilizer N supply is necessary for crop growth and grain formation.
Currently, studies mainly focused on crop growth and yield under water-saving irrigation [3,12], or the interaction of fertilizer N and irrigation under conventional irrigation [8,26], but the responses of soil physiochemical properties, wheat growth and yield to different water regimes and N fertilizer topdressing are still unclear. Based on the aforementioned context, the aims of this study were to (1) compare soil water and N dynamics, plant physiology, and wheat yield among different water regimes and N practices; (2) clarify the interaction effects of water and fertilizer N practices on plant and root growth, wheat grain yields, and water/N use efficiency; and (3) determine optimally coupled water regimes and fertilization managements for future sustainable irrigated agricultural production. These findings will provide an important reference for optimizing irrigation and fertilization managements under sub-surface drip irrigation to improve grain yield and resource use efficiency in northern China.

2. Materials and Methods

2.1. Experimental Site and Design

The field experiments were conducted at Gaoyang County, Hebei Province (38°33′ N, 115°93′ W), which is a typical water-scarce and intensively farmed region in northern China, during October 2020–June 2022. The soil is calcareous clay loam soil (0–20 cm) in texture with 16% clay, 45% silt, and 39% sand, and the physio-chemical properties were as follows: bulk density—1.29 g cm−3; pH (1:2.5, soil/water)—7.8; soil organic matter—20.3 g kg−1; and total N content—0.9 g kg−1. In the field, winter wheat (Shannong 29) was planted with machine drill for a 15 cm row spacing and a seeding density of 450 kg/ha from 26 October 2020 to 21 June 2021, and 31 October 2021 to 21 June 2022. The succeeding crop in 2021 and 2022 was summer maize with the same practices of irrigation and N fertilization managements. In this study, the irrigation regimes and fertilizer scheduling during 2020–2022 were maintained as shown in Figure 1a,c. The N fertilizer (urea) was dissolved and then penetrated into the soil along with irrigation water through subsurface drip irrigation systems. The drip lines (produced by Shuofeng Farming Co., Baoding, China) were placed at an interval of 60 cm with emitter space of 30 cm apart and 1.38 L/h discharge rate. In this study, three irrigation schedules (i.e., irrigation was applied up to 80% [D1], 75% [D2], and 70% [D3] as soon as the soil water content decreased to 65%, 60% or 55% of field capacity), and two N practices (i.e., N applied at the base, jointing, booting stages were 90, 72, 48 kg ha−1 [N1], and the base, jointing, booting, filling stages were 90, 40, 40, 40 kg ha−1 [N2], respectively) were considered. Therefore, six treatments (each with an area of 60 m length × 25 m width) including 3 replicates (in total of 18 plots) were considered. For all treatments, 120 kg P2O5 ha−1 and 90 kg K2O ha−1 were applied as base fertilizer. The irrigation water was directly pumped from underground water, which met the irrigation water standard. Phosphorus was applied as calcium super-phosphate (P2O5 15.5%) at a rate of 120 kg P2O5 ha−1 and potash was applied as potassium sulphate (K2O 48%) at a rate of 90 kg K2O ha−1. The nitrogen was applied as urea (46% N).

2.2. Sampling and Measurements

2.2.1. Meteorological Data

Meteorological data during these two seasons were provided by Meteorological Bureau of Gaoyang County.

2.2.2. Soil Bulk Density, Water Content, NO3–N and NH4+–N Concentrations

Before wheat sowing (26 October 2020), the soil bulk density and field water capacity of the 0–200 cm soil layers were determined using the ring knife method [27]. Three soil samples were collected at 20 cm intervals in the 0–200 cm soil layer for measuring soil water content at sowing and maturity stage. Additionally, the soil samples at 20 cm intervals in the 0–100 cm soil layer at the jointing, flowering and maturity stages were collected, then sieved through a 2 mm mesh for inorganic N concentration analysis. Soil NO3–N and NH4+–N concentrations were analyzed using a continuous flow analyzer (TRAACS 2000, Bran and Luebbe, Norderstedt, Germany) after extraction with 1 M KCl (soil:solution = 1:5).

2.2.3. Plant Physiology Characteristics Analysis

The relative chlorophyll content (SPAD value) was determined using a Soil Plant Analysis Development (SPAD) meter (Minolta, Ramsey, NJ, USA) at the seeding, jointing, booting, flowering and filling stages. A total of 20 fully opened flag leaves were selected for measurement.
Six plant samples were randomly selected in each plot at the seeding, regreening, jointing, flowering, filling and maturity stages for the aboveground biomass analysis. The samples were oven-dried at 105 °C for 30 min and then at 80 °C until constant weight.
Leaf length (L) and width (W) were measured indoors using a ruler at the seeding, regreening, jointing, flowering, filling and maturity stages. Leaf area (A) was calculated as: A = L × W × K, where K = 0.75 for fully expanded leaves and K = 0.5 for incompletely expanded leaves. The green leaf area index (LAI, m2 m−2) was calculated as the ratio of sum of the green leaf area to the area occupied by those six collected plants [28].

2.2.4. Plant N Content and Grain Yield

A total of 20 plant samples were randomly selected with a “S” type method in each plot at the regreening, jointing, flowering, filling and maturity stages of winter wheat. Plant samples were separated into leaves, stems at the regreening, jointing, flowering, filling stages and leaves, stems and grains at maturity. All samples were dried and then passed through a 1 mm mesh for measuring total nitrogen content using the Kjeldahl method. At the maturity stage, all wheat plants in a 3 m2 area at each plot were harvested, threshed, and then dried in 80 °C and weighted. And the crop yield was calculated with a 12.5% moisture basis.

2.2.5. Root Samples Collection

To excavate the root samples, a square block (length 7.5 cm × width 7.5 cm × depth 40 cm) was dug by taking the midline of the spacing between two adjacent drip lines (spacing at 60 cm) as a boundary including four rows of wheat plants at the flowering stage (10 May 2021 and 12 May 2022). The soil depth was 60 cm and each layer had a depth of 10 cm. The sub-samples were rinsed with water to separate from soil indoor, the details are described in Wang et al. [12]. The roots samples were scanned using a double-sided scanner (Epson Expression 1600 pro, Model EU-35, Tokyo, Japan). These root images were analyzed with WinRHIZO Pro Vision 2009c software (Regent Instruments Inc., Québec, QC, Canada) to measure root length density (RLD). The root samples were oven-dried at 70 °C in a forced-draft oven to constant weight and then weighed immediately after scanning to measure root weight density (RWD).

2.3. Data Analysis

2.3.1. Water Consumption Characteristics

The soil water-holding consumption (SWC, mm) was calculated by soil water-holding amount at harvest stage minus the initial one at seeding stage. Total water consumption (TWC, defined as ET) during the wheat season was calculated according to the soil water balance equation [27]:
ET = ΔS + I + P − R − D + CR
where ET is crop evapotranspiration (mm); ∆S (mm) is soil water extraction based on the difference between two close growth stages, I (mm) is irrigation, P (mm) is rainfall, R (mm) is runoff, D (mm) is drainage deeper than 200 cm soil profile, and CR (mm) is capillary rise into the root zone. In this study, different plots were separated by a ridge, and no surface runoff was observed. Additionally, no extreme precipitation events were occurred during the study periods, and the depth of precipitation infiltration did not exceed 2 m, so the drainage was negligible. Consequently, R and D can be ignored in this study [27,29,30]. Moreover, the groundwater table is deeper than the wheat root activity depth (0–2.5 m) at the experimental site; therefore, the CR is negligible.
∆S was determined using the Equation (2):
S = 10 i = 1 n γ i H i ( θ i 1 θ i 2 )
where n (=10): the numbers of soil layers (0–200 cm); γi (g cm−3): the bulk density of the ith soil layer; Hi (cm): the soil depth of the ith soil layer; θi1 (%) and θi2 (%): the initial and final gravimetric water content of the ith soil layer, respectively.

2.3.2. Crop Water and Nitrogen Use Efficiency

The crop water use efficiency was calculated based on the total and irrigation water supplied during the growing period, which were total water use efficiency (WUE, kg m−3) and irrigation water use efficiency (IWUE, kg m−3) [31].
W U E = GY ET c × 10
I W U E = GY I   × 10
where GY is the grain yield (kg ha−1); ETc is the total evapotranspiration during a growing season (mm); I is the total amount of irrigation water during a growing season (mm).
In this study, two nitrogen (N) use efficiency indicators were used: N partial factor productivity for fertilizer (PFPN, kg kg−1) and apparent N use efficiency (ANUE, %), which were described by Zhang et al. [6].
P F P N = GY N f e r t
A N U E = N u p t a k e N f e r t
where GY is the grain yield (kg ha−1); Nfert is the mineral fertilizer N application rate (kg N ha−1); Nuptake is the total N uptake by aboveground biomass (kg N ha−1).
Crop N accumulation (NAM, kg ha−1), N transformation amount (NT, kg ha−1), and the contribution of crop N transformation amount to grain (NTPC, %) were calculated by:
N A M = GB × NC 1000
N T = N A M f N A M m
N T P C = N T N A M m
where GB if the dry biomass (kg ha−1); NC is the crop N content (g kg−1); NAMf and NAMm are the NAM in flowering and mature stages (kg ha−1).

2.3.3. Soil Ammonia/Nitrate-Nitrogen Accumulation

The accumulate amount of NO3–N and NH4+–N in 1 m soil is the sum of ammonia/nitrate accumulation in each soil layer [20]. Plant nitrogen accumulation was calculated as follows according to Koutroubas et al. [32]:
Plant N accumulation = DM × NC%
where DM is dry matter accumulation of plants at maturity; NC is the nitrogen concentration in straw or grain.

2.4. Statistical Analysis

N fertilization (i.e., N1 and N2) and irrigation practices (i.e., D1, D2 and D3) were applied in the main and sub-plot, respectively. Microsoft Excel 2010 (Microsoft Co., Redmond, WA, USA) was used to arrange the experimental data. The two-way and three-way analysis of variance (ANOVA) were conducted with SPSS 22.0 software (SPSS Inc., Chicago, IL, USA) at a significance level of 0.05. The effects of different fertilization and irrigation treatments and their interaction on soil NO3–N, NH4+–N, plant LAI, SPAD, biomass, N content in leaves, stems and grains, and root length and weight density were analyzed by two-way ANOVA. The effects of different year, fertilization and irrigation treatments and their interaction on SWC, TWC and their percentage to ET, wheat yield formation, N uptake and water and N productivity were analyzed by three-way ANOVA. Significant differences among different treatments were tested using a least significant differences (LSD) at a significance level of 0.05. The redundancy analysis (RDA) was estimated by Canoco 5 (version 5.02) software.

3. Results

3.1. Soil Environmental Parameters

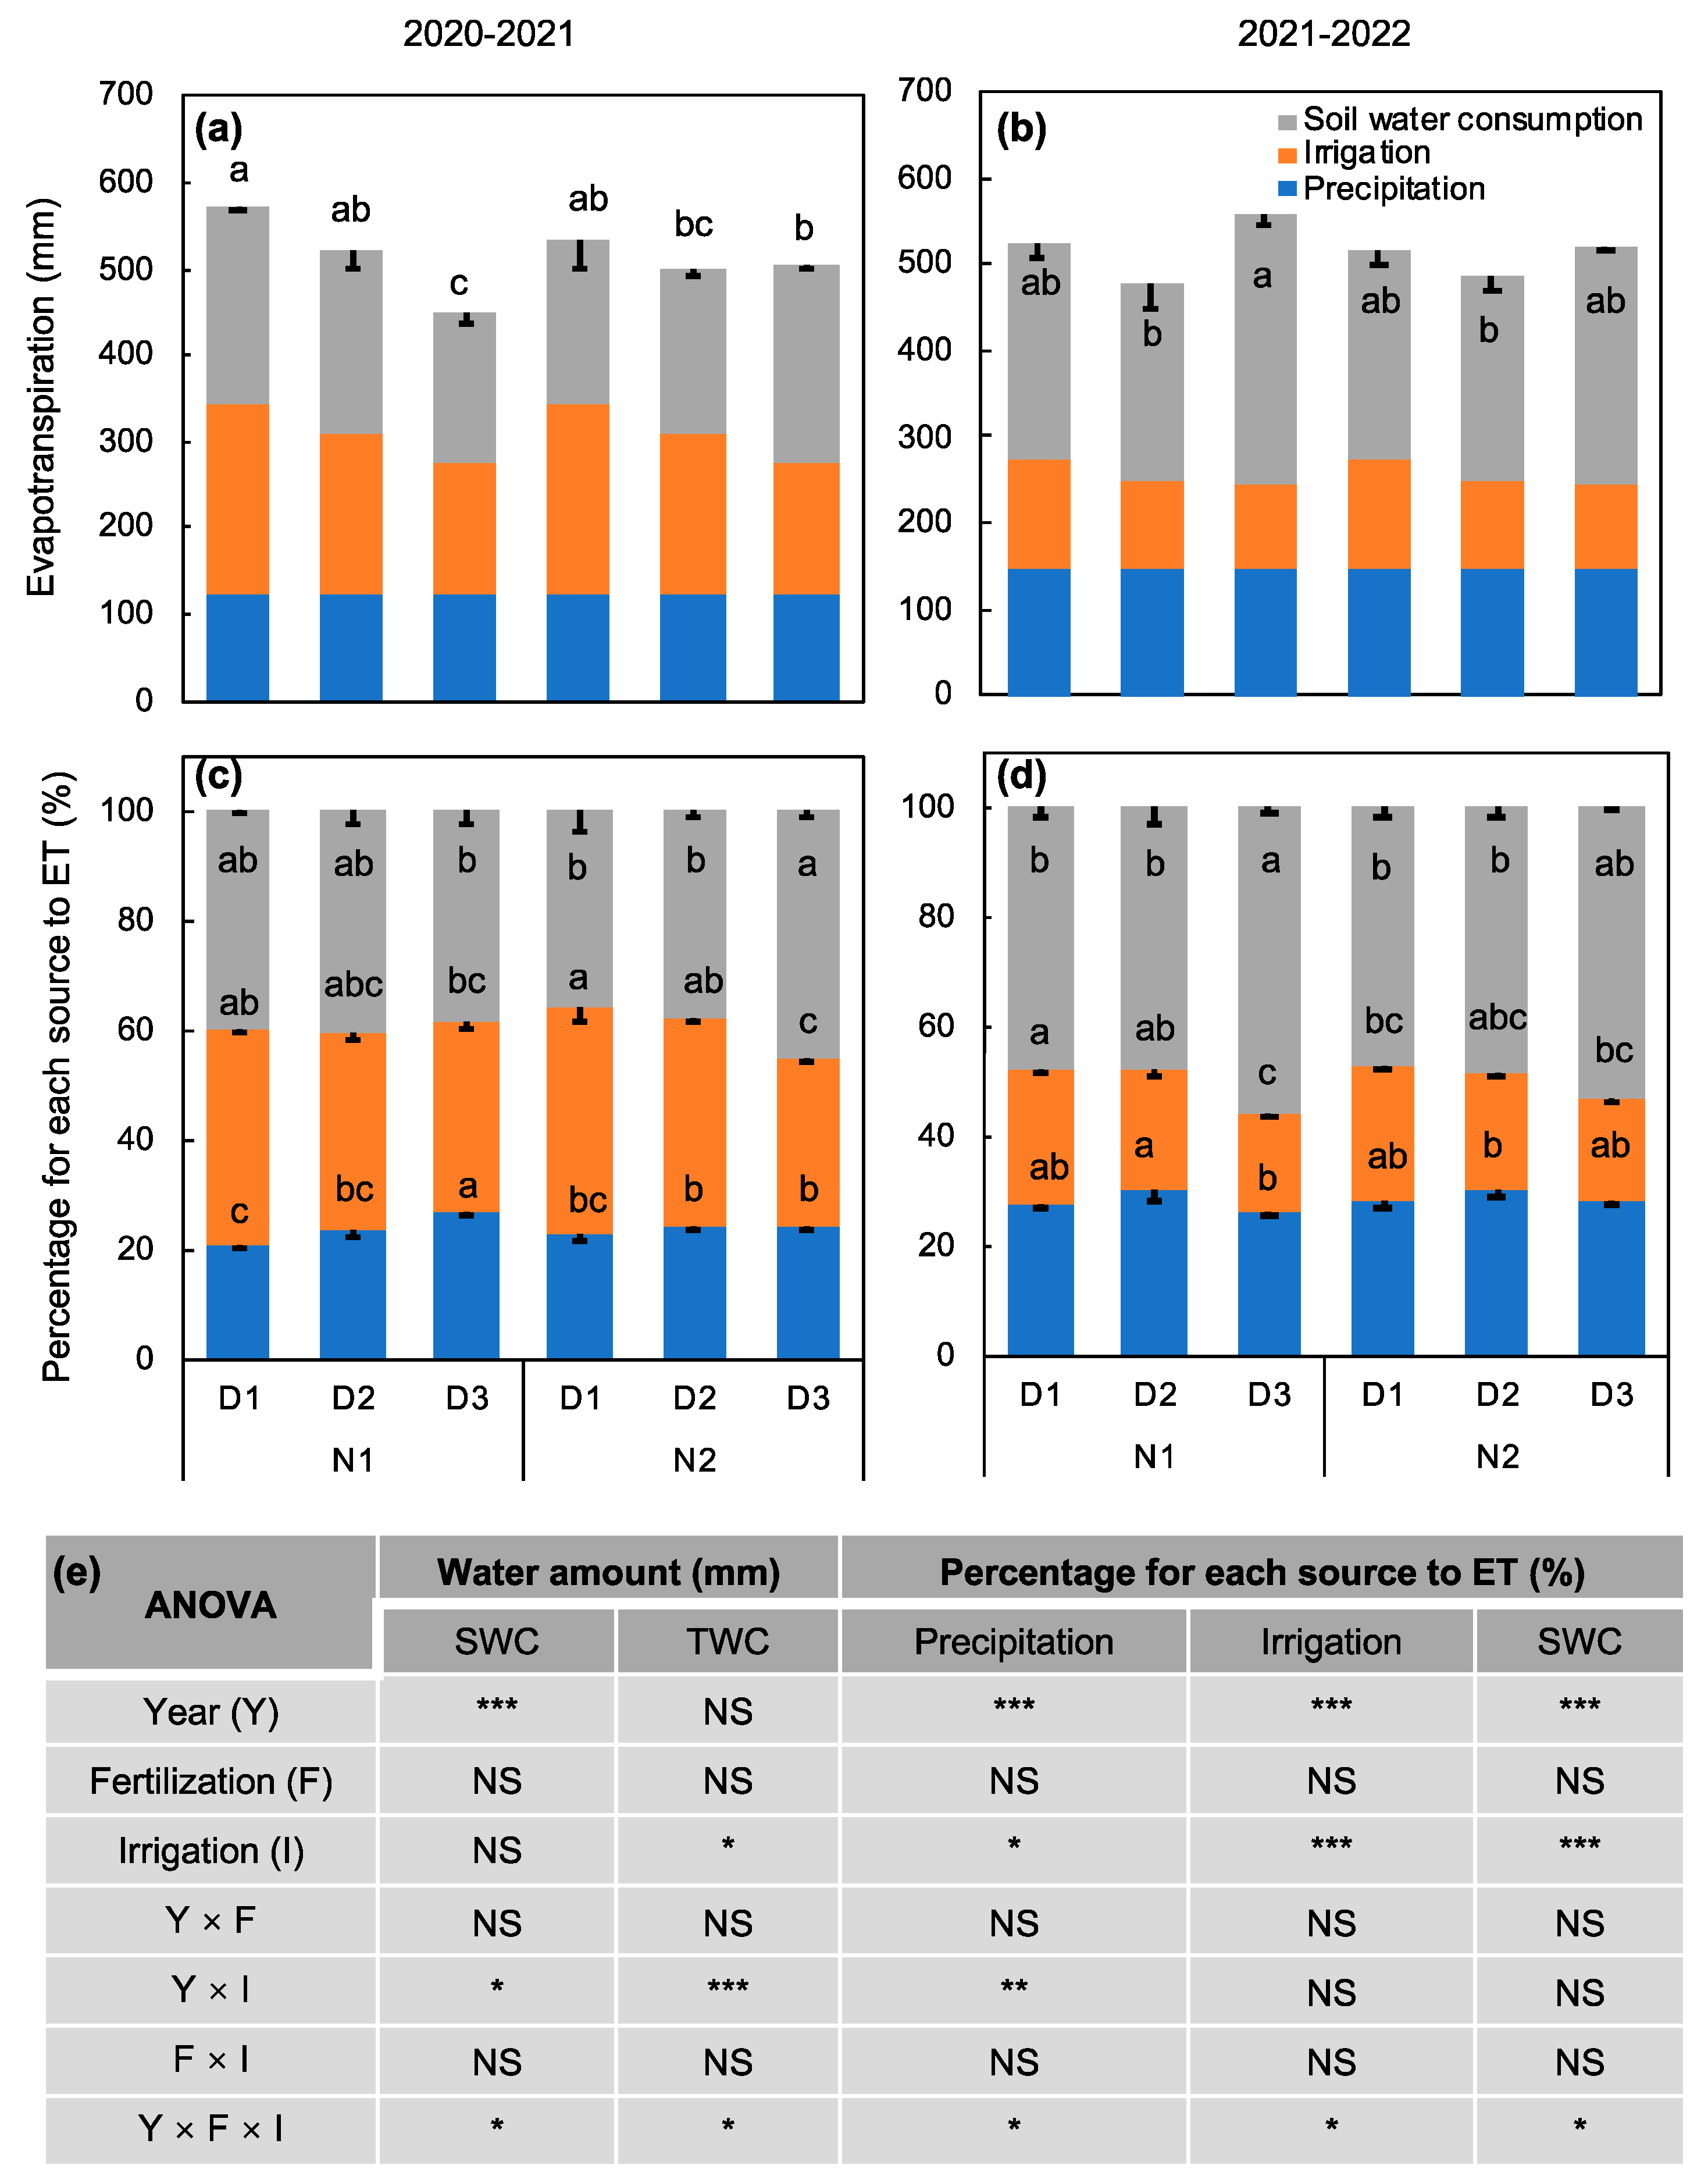
3.1.1. Soil Water Consumption and Sources of Water Consumption

During the wheat season, the cumulative precipitation, sunshine duration and average air temperature were 122.8 mm, 1771.6 h, and 9.5 °C (−13.6–29.9) during October 2020–June 2021, and 146.6 mm, 1861.0 h, and 9.6 °C (−8.8–33.8) during October 2021–June 2022, respectively (Figure 1b,d). Irrigation and nitrogen practices significantly influenced total water consumption (ET) and SWC. Except N1 treatment in 2020–2021, the lowest SWC values were all found in D2 under N2 (188 mm) in 2020–2021, and under N1 (229 mm) and N2 (235 mm) in 2021–2022 (Figure 2a,b). D1 increased the ET by 31.8% (p < 0.05) under N1 in 2020–2021 compared to D3, while D3 increased the ET by 36.6% (p < 0.05) under N1 in 2021–2022 compared to D2.
As shown in Figure 2c,d, SWC ranged from 173 to 313 mm for these two growing seasons, accounting for 35.7–55.9% of the total water consumption, while rainfall accounted for an average of 21.5–30.6% of the total water consumption. Additionally, water consumption from irrigation ranged 154.8–221.3 (2020–2021) and 104–127 mm (2021–2022), accounting for 30.6–41.3% (2020–2021) and 19.2–24.6% (2021–2022), respectively.
Under the same N treatment, irrigation significantly affected ET, and the percentage for each source to ET (p < 0.05, Figure 2e). Additionally, the interaction effects of year, fertilization and irrigation on SWC, TWC and the percentage for each source to ET were significant.

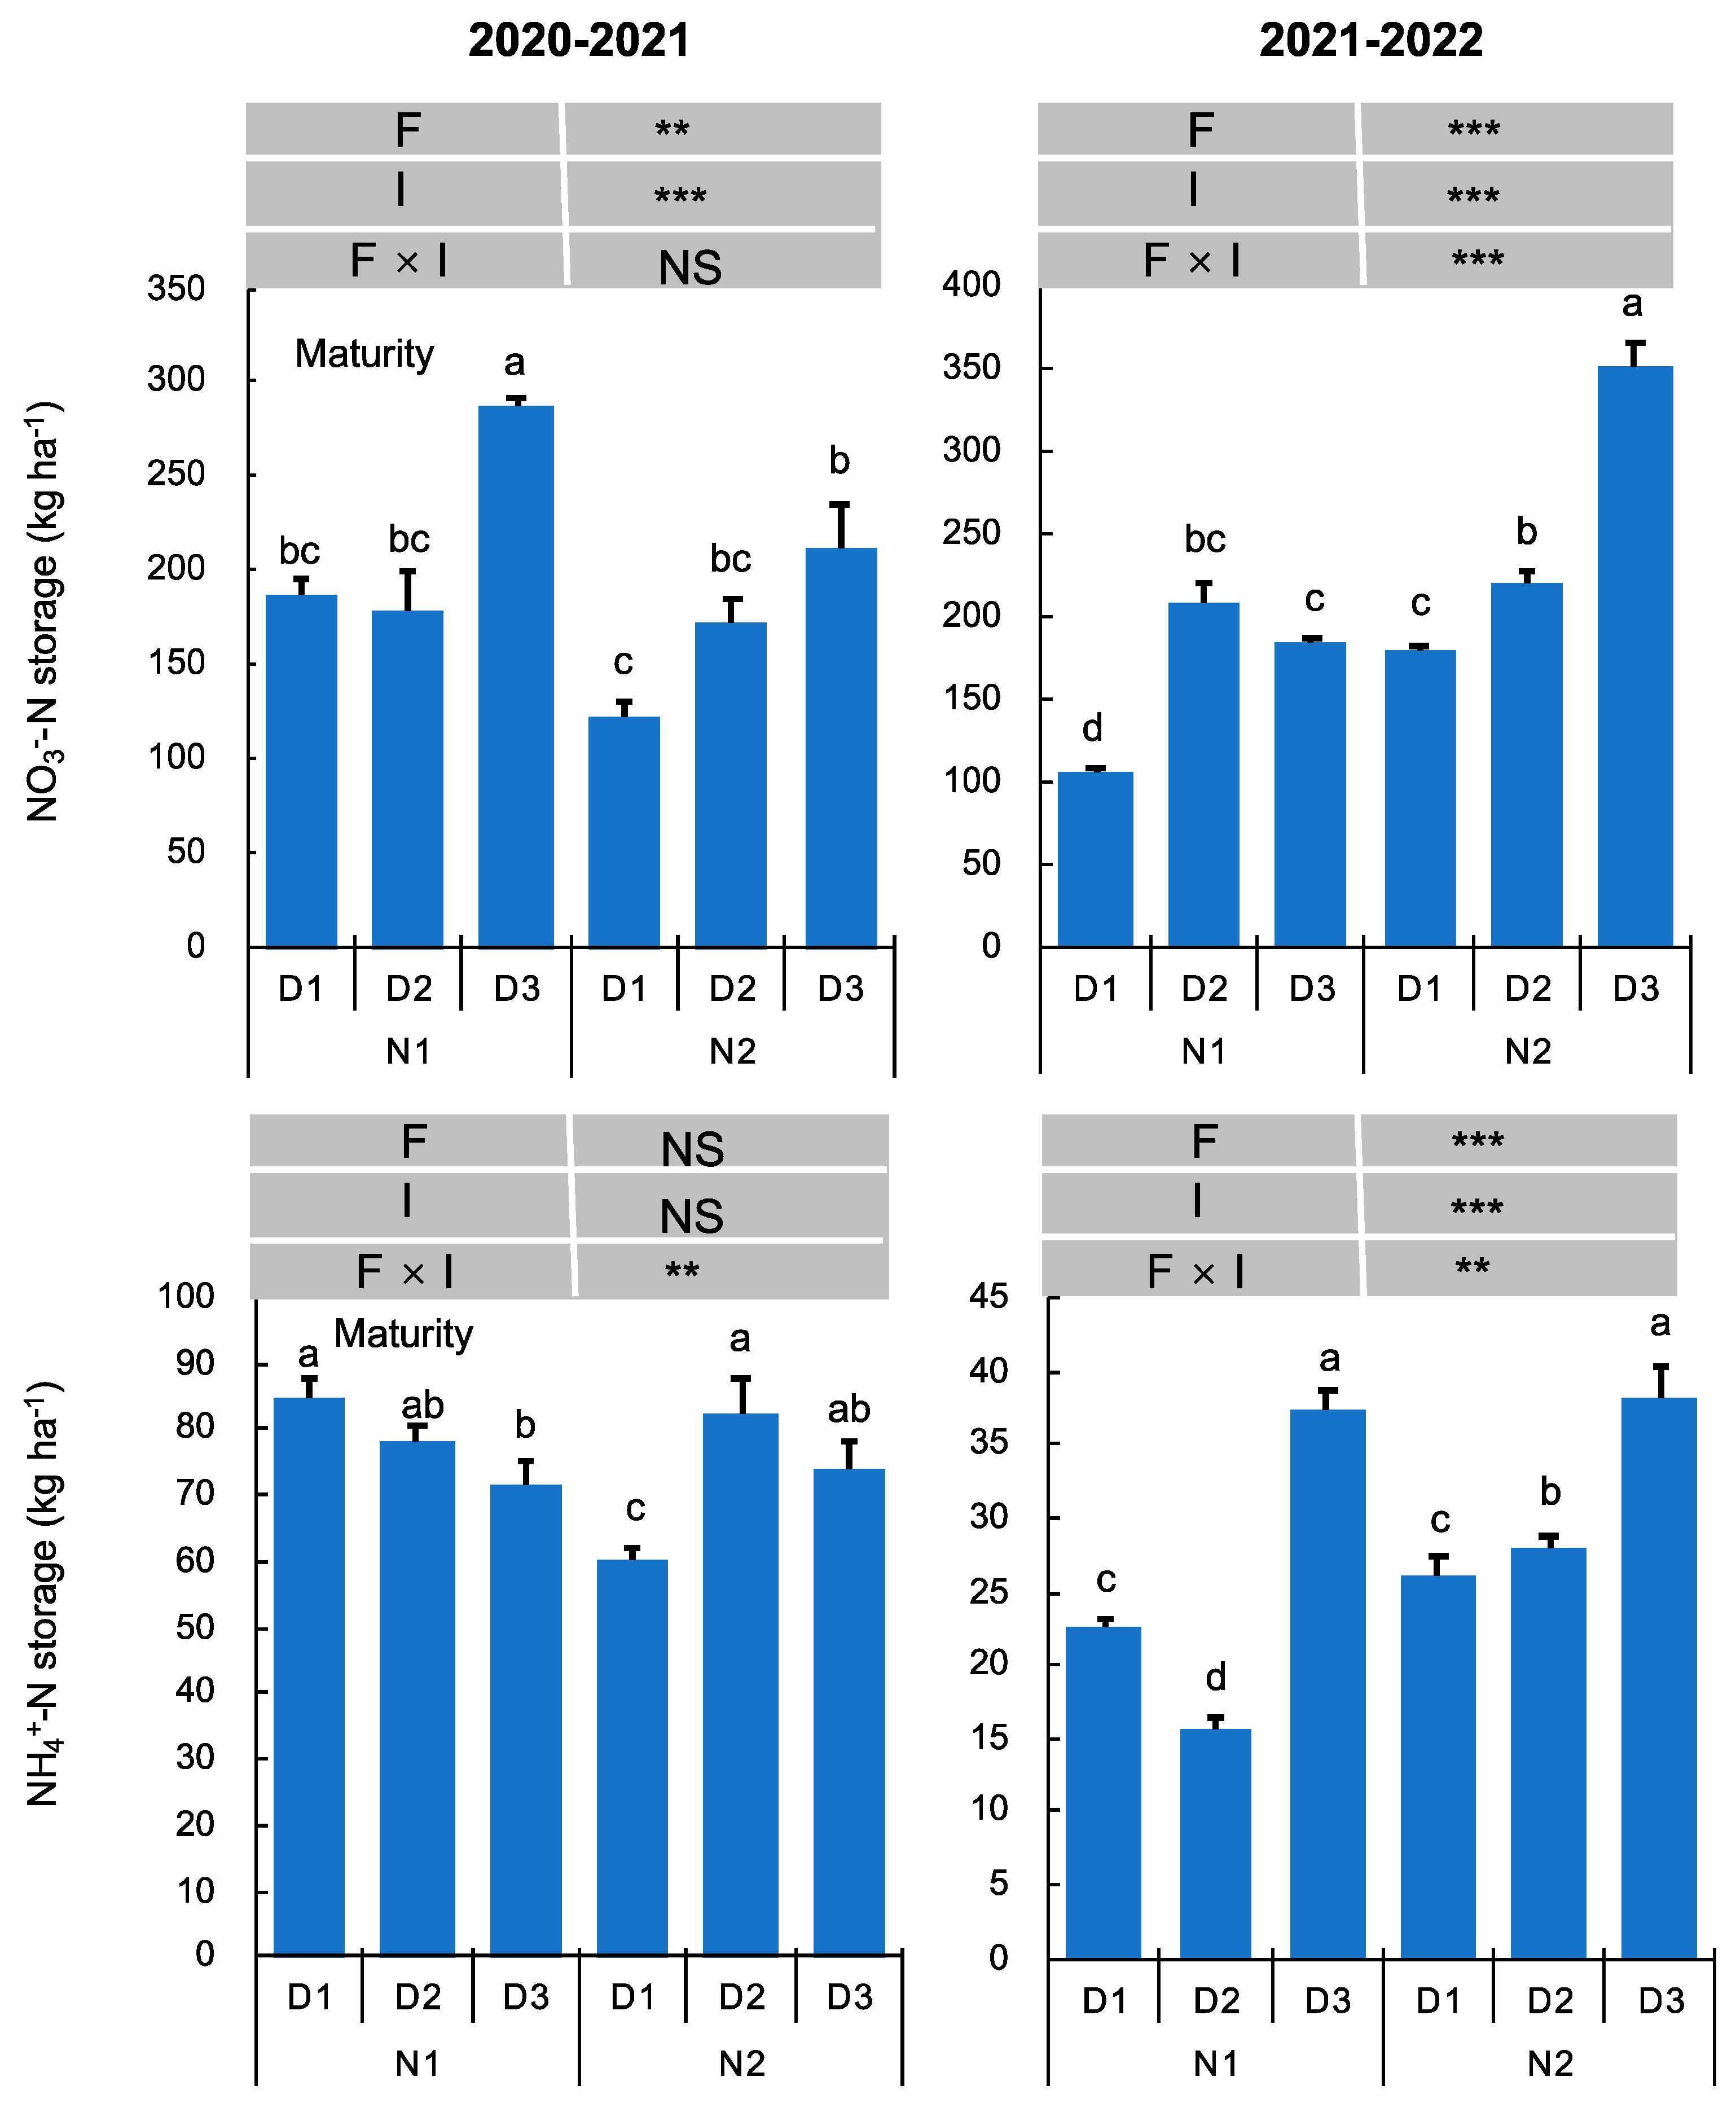
3.1.2. Soil Inorganic Nitrogen Accumulation

Irrigation and fertilization significantly affected soil NO3–N accumulation during 2020–2021 (Figure 2). For example, under N2, D3 was 73.1% (p < 0.05) higher than that under D1. During 2021–2022, the effects of fertilization and irrigation and their interaction on soil NO3–N accumulation were found. For example, under N2, D3 was 97.0% (p < 0.05) higher than that of D1, while under D3, N2 was 90.8% (p < 0.05) higher than that of N1. During 2020–2021, an interaction effect between fertilization and irrigation was found (Figure 3). During 2021–2022, the effect of fertilization and an interaction between fertilization and irrigation were found at the maturity stage. Additionally, the highest value of soil NH4+–N accumulation was found in D3, which was 65.2% and 137.5% higher than that in D1 and D2 under N1, and 46.3% and 37.0% higher than that in D1 and D2 under N2, respectively.

3.2. Wheat Growth Parameters

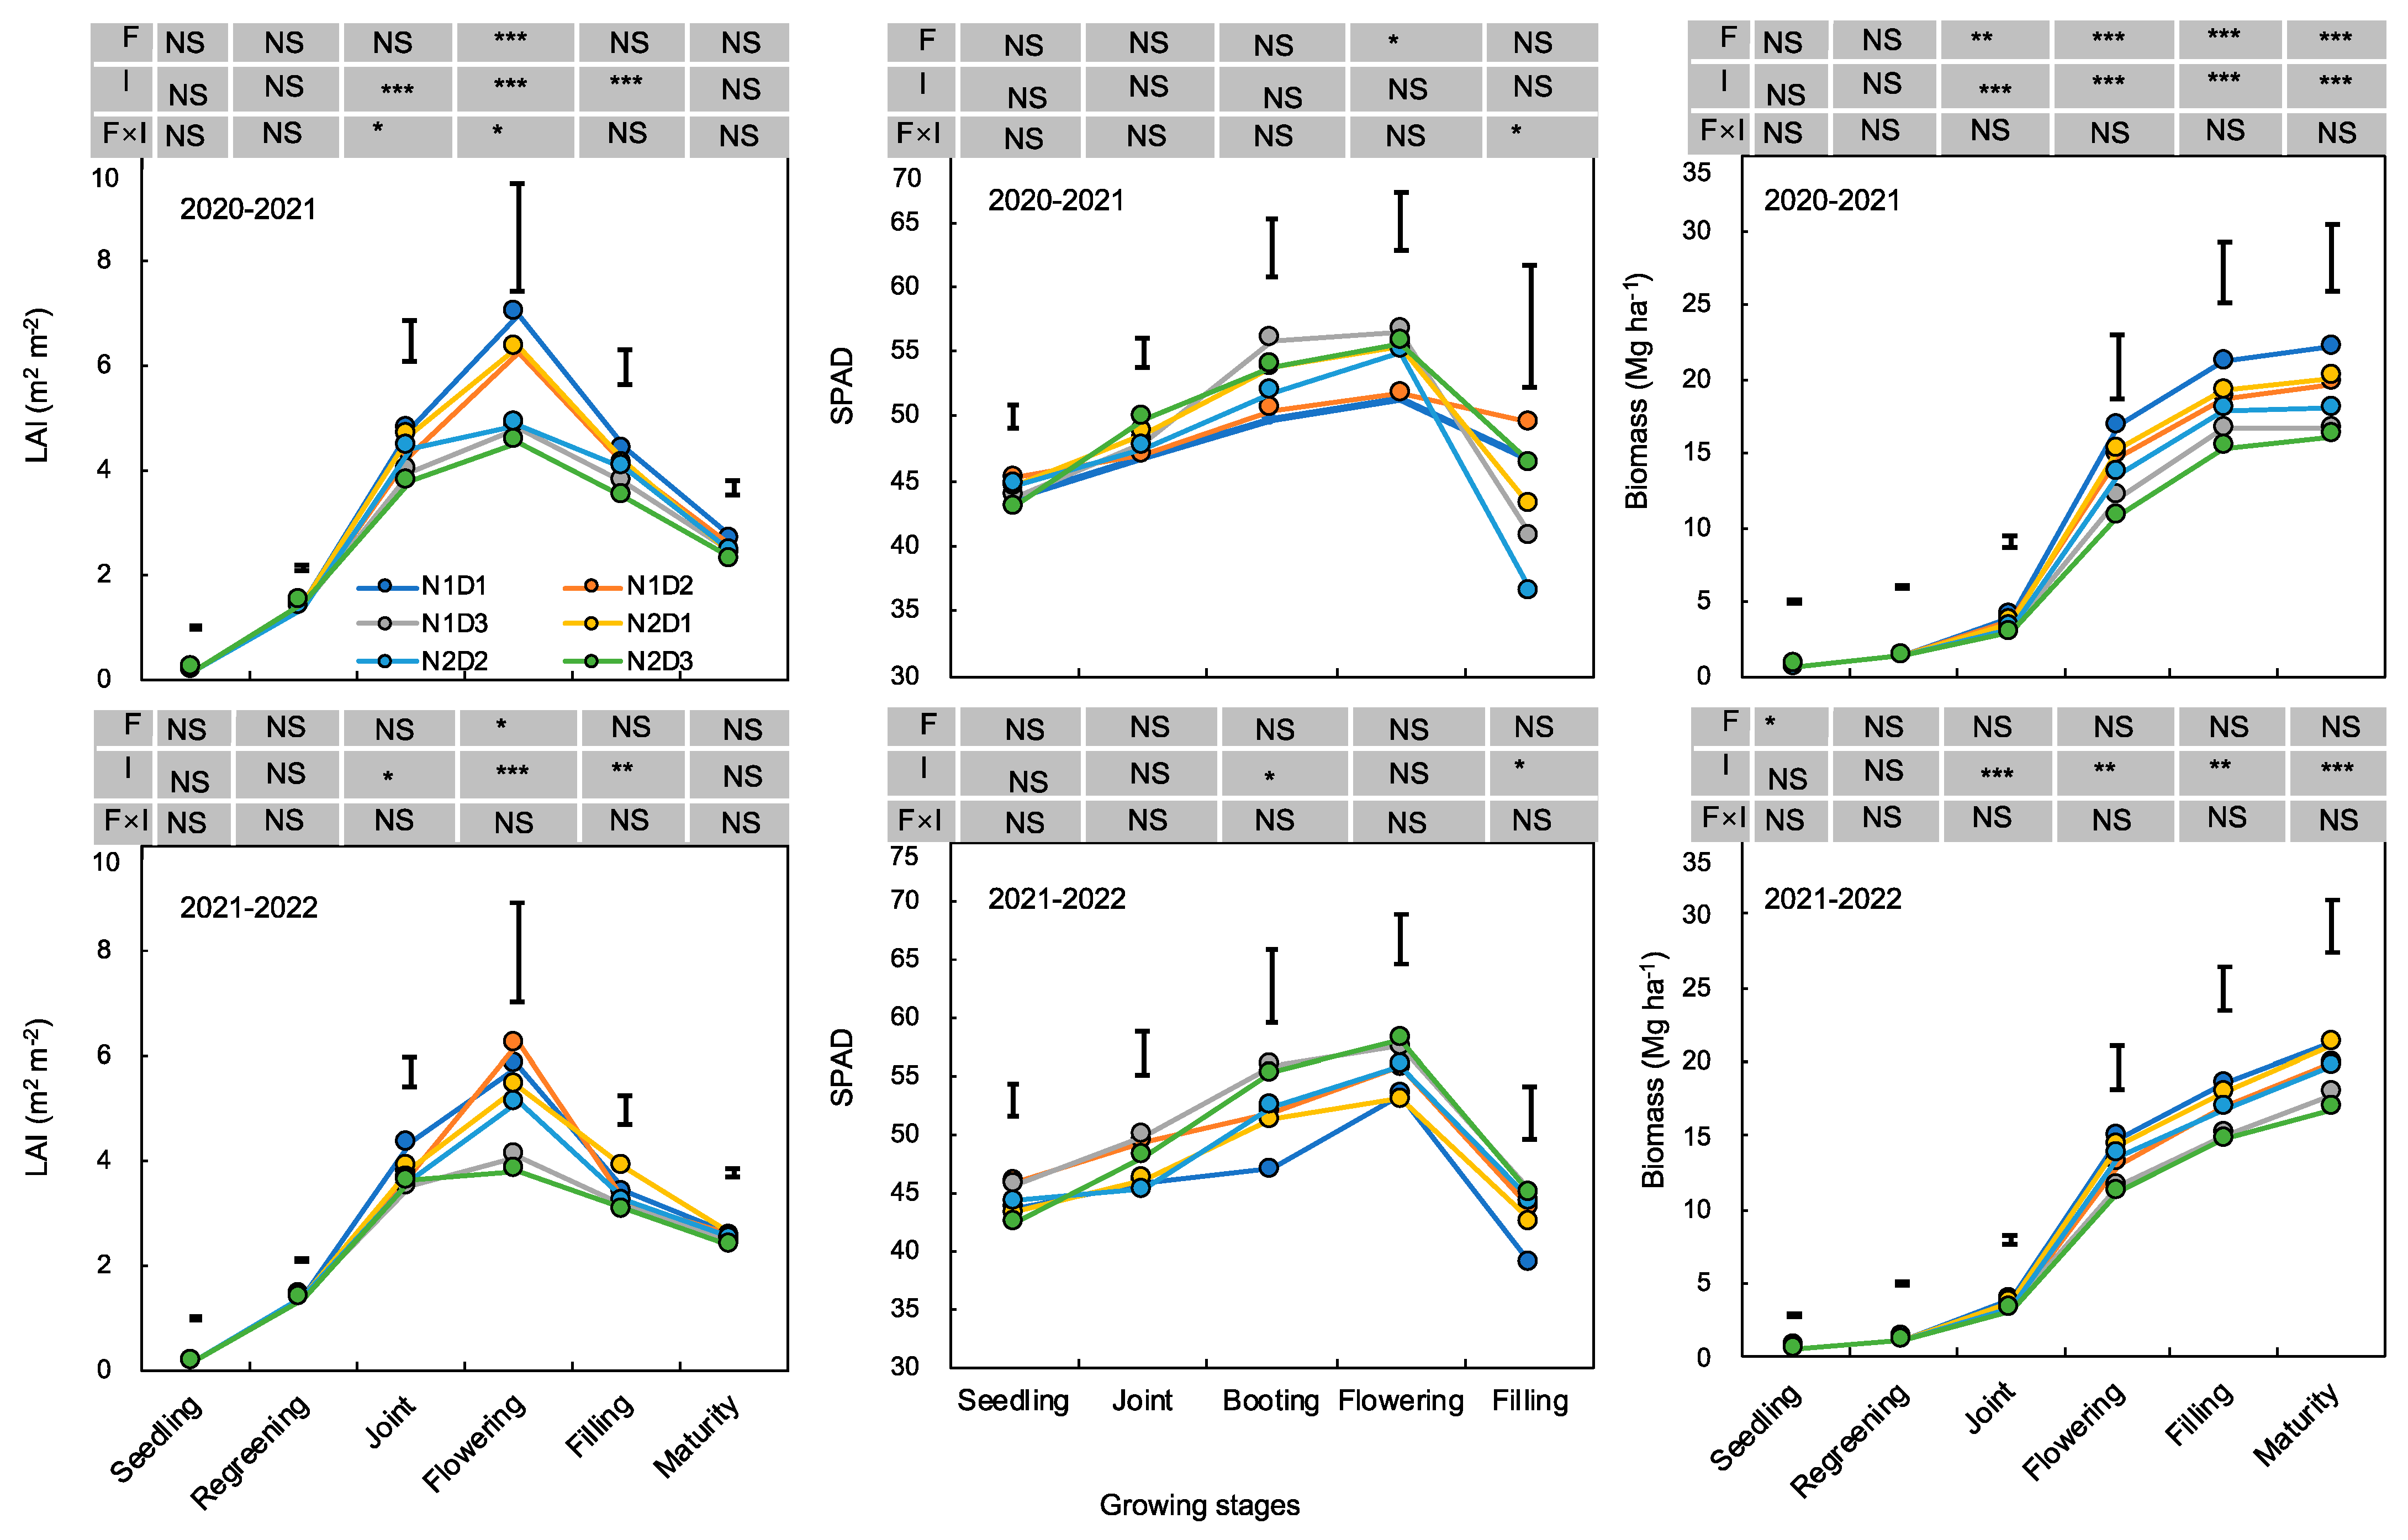
3.2.1. Leaf Area Index, SPAD Value and Biomass

As shown in Figure 4, the highest values of the LAI and SPAD for all treatments were found in the flowering stage. Under the same N treatments, the LAI under D3 had always been lower than that under D1 during these two growing seasons. Fertilization and irrigation both significantly affected the LAI in the flowering stage during these two growing seasons, and their interaction effect was found only in 2020–2021. In addition, SPAD under D1 had always been lower than that under D3 during these two growing seasons, and fertilization significantly affected SPAD in the flowering stage in 2020–2021. Biomass under D1 had always been higher than that under D3 under the same N treatment during these two growing seasons. For instance, biomass of D1 was 24.3–33.1% (p < 0.05) and 19.1–25.7% (p < 0.05) higher than D3 in 2020–2021, and 2021–2022, respectively.

3.2.2. Nitrogen Content of Plants

N content in leaves and stems decreased gradually throughout the growth of the crop (Figure 5). Significant effects of fertilization and irrigation, and their interaction on N content in leaves at the jointing stage, and on N content in stems at the jointing and flowering stages during 2021–2022 were found. At the maturity stage, the grain N content of N2 was 8.0% higher (p < 0.05) than that of N1 under D2 during 2020–2021, and the grain N content of N2 increased by 7.0% (p < 0.05) as compared to N1 under D3 during 2021–2022. Additionally, compared to D1, the grain N content of D2 was 6.2% (p < 0.05) and 8.7% higher (p < 0.05) under N1 and N2 during 2021–2022, respectively. An interaction effect of fertilization and irrigation on N content in grains was found.

3.2.3. Root Length and Weight Density

During 2020–2021, fertilization and irrigation significantly affected RLD in the 0–10 cm and 40–60 cm soil layers (Figure 6). The highest value of RLD in 0–10 cm was found in N1D3, which was 29.2% higher (p < 0.05) than that of N2D2. The highest average value of RLD in 0–60 cm was found in N2D1 (3.4 cm cm−3), which was 5.0% higher (p < 0.05) than that of N2D3; the RLD of N1D3 in 0–60 cm significantly increased by 4.5% as compared to N1D1. The significant effect of fertilization and the interaction between fertilization and irrigation were found on average RLD in 0–60 cm (Figure 6). During 2021–2022, fertilization significantly affected RLD in 10–20 cm, and 30–60 cm, while irrigation significantly affected RLD in 0–10 cm and 20–60 cm (Figure 6). The highest value of RLD in 0–10 cm was found in N1D3 (3.1 cm cm−3), which was 57.7% higher (p < 0.05) than that of N1D1. The highest average value of RLD in 0–60 cm was found in D3 under N1 while D1 under N2.
The RWD of N1D1 in the 0–10 cm soil layer was the highest, and an interaction between fertilization and irrigation on RWD in 0–10 cm was found during both growing seasons (Figure 7). The highest average value of RWD in 0–60 cm was found in N1D1 (164.3 g m−3), which was 7.5% higher (p < 0.05) than that of N1D3 and 9.0% higher (p < 0.05) than that of N2D1 during 2020–2021 (Figure 7). During 2021–2022, the highest average value of RWD in 0–60 cm was all found in D1 under N1 and N2 treatments, which were 12.1% (p < 0.05) and 19.6% (p < 0.05) higher than D3, respectively (Figure 7).

3.2.4. N Accumulation and Distribution

A significant influence of irrigation on NAM, NT, NTPC and fertilization on NAM, NT and an interaction influence of fertilization and irrigation on NT were found. And the lowest values of NAM and NT were all found in N2D3 during these two seasons. During 2020–2021, the highest values of NAM, NT and NTPC were found in N1D1, which were 11.1% (p < 0.05), 20.9% (p < 0.05), and 2.8% higher than that of N2D1 (Table 1). During 2021–2022, the highest values of NAM, NT and NTPC were found in N1D2, which were not significant different to N1D1 and were 16.8% (p < 0.05), 34.2% (p < 0.05), and 12.5% (p < 0.05) higher than that of N2D2.

3.3. Yield, Water and N Productivity

Under N1, a 12.5% higher (p < 0.05) of spike numbers in D1 as compared to D3 was found, and resulted in a 9.2% (p < 0.05) increase in yield during 2020–2021 (Table 2). The effects of year, fertilization and irrigation, and their interaction on spike numbers were found. Irrigation significantly affected straw, grain, and total N uptake. The total N uptake in D2 increased by 11.3–18.5% (p < 0.05) especially under N2 treatment during these two growing seasons (Table 2). In addition, irrigation significantly affected water and N productivity. D3 significantly increased WUE by 16.0% and 12.4% as compared to D1 and D2 under N1, respectively. However, the highest WUE of D2 was found under N2 during 2020–2021 and under N1 and N2 during 2021–2022. The highest values of IWUE were found in D3 during 2020–2021. For PFP and ANUE, the best irrigation regimes were found in D1 during 2020–2021 and D2 during 2021–2022.

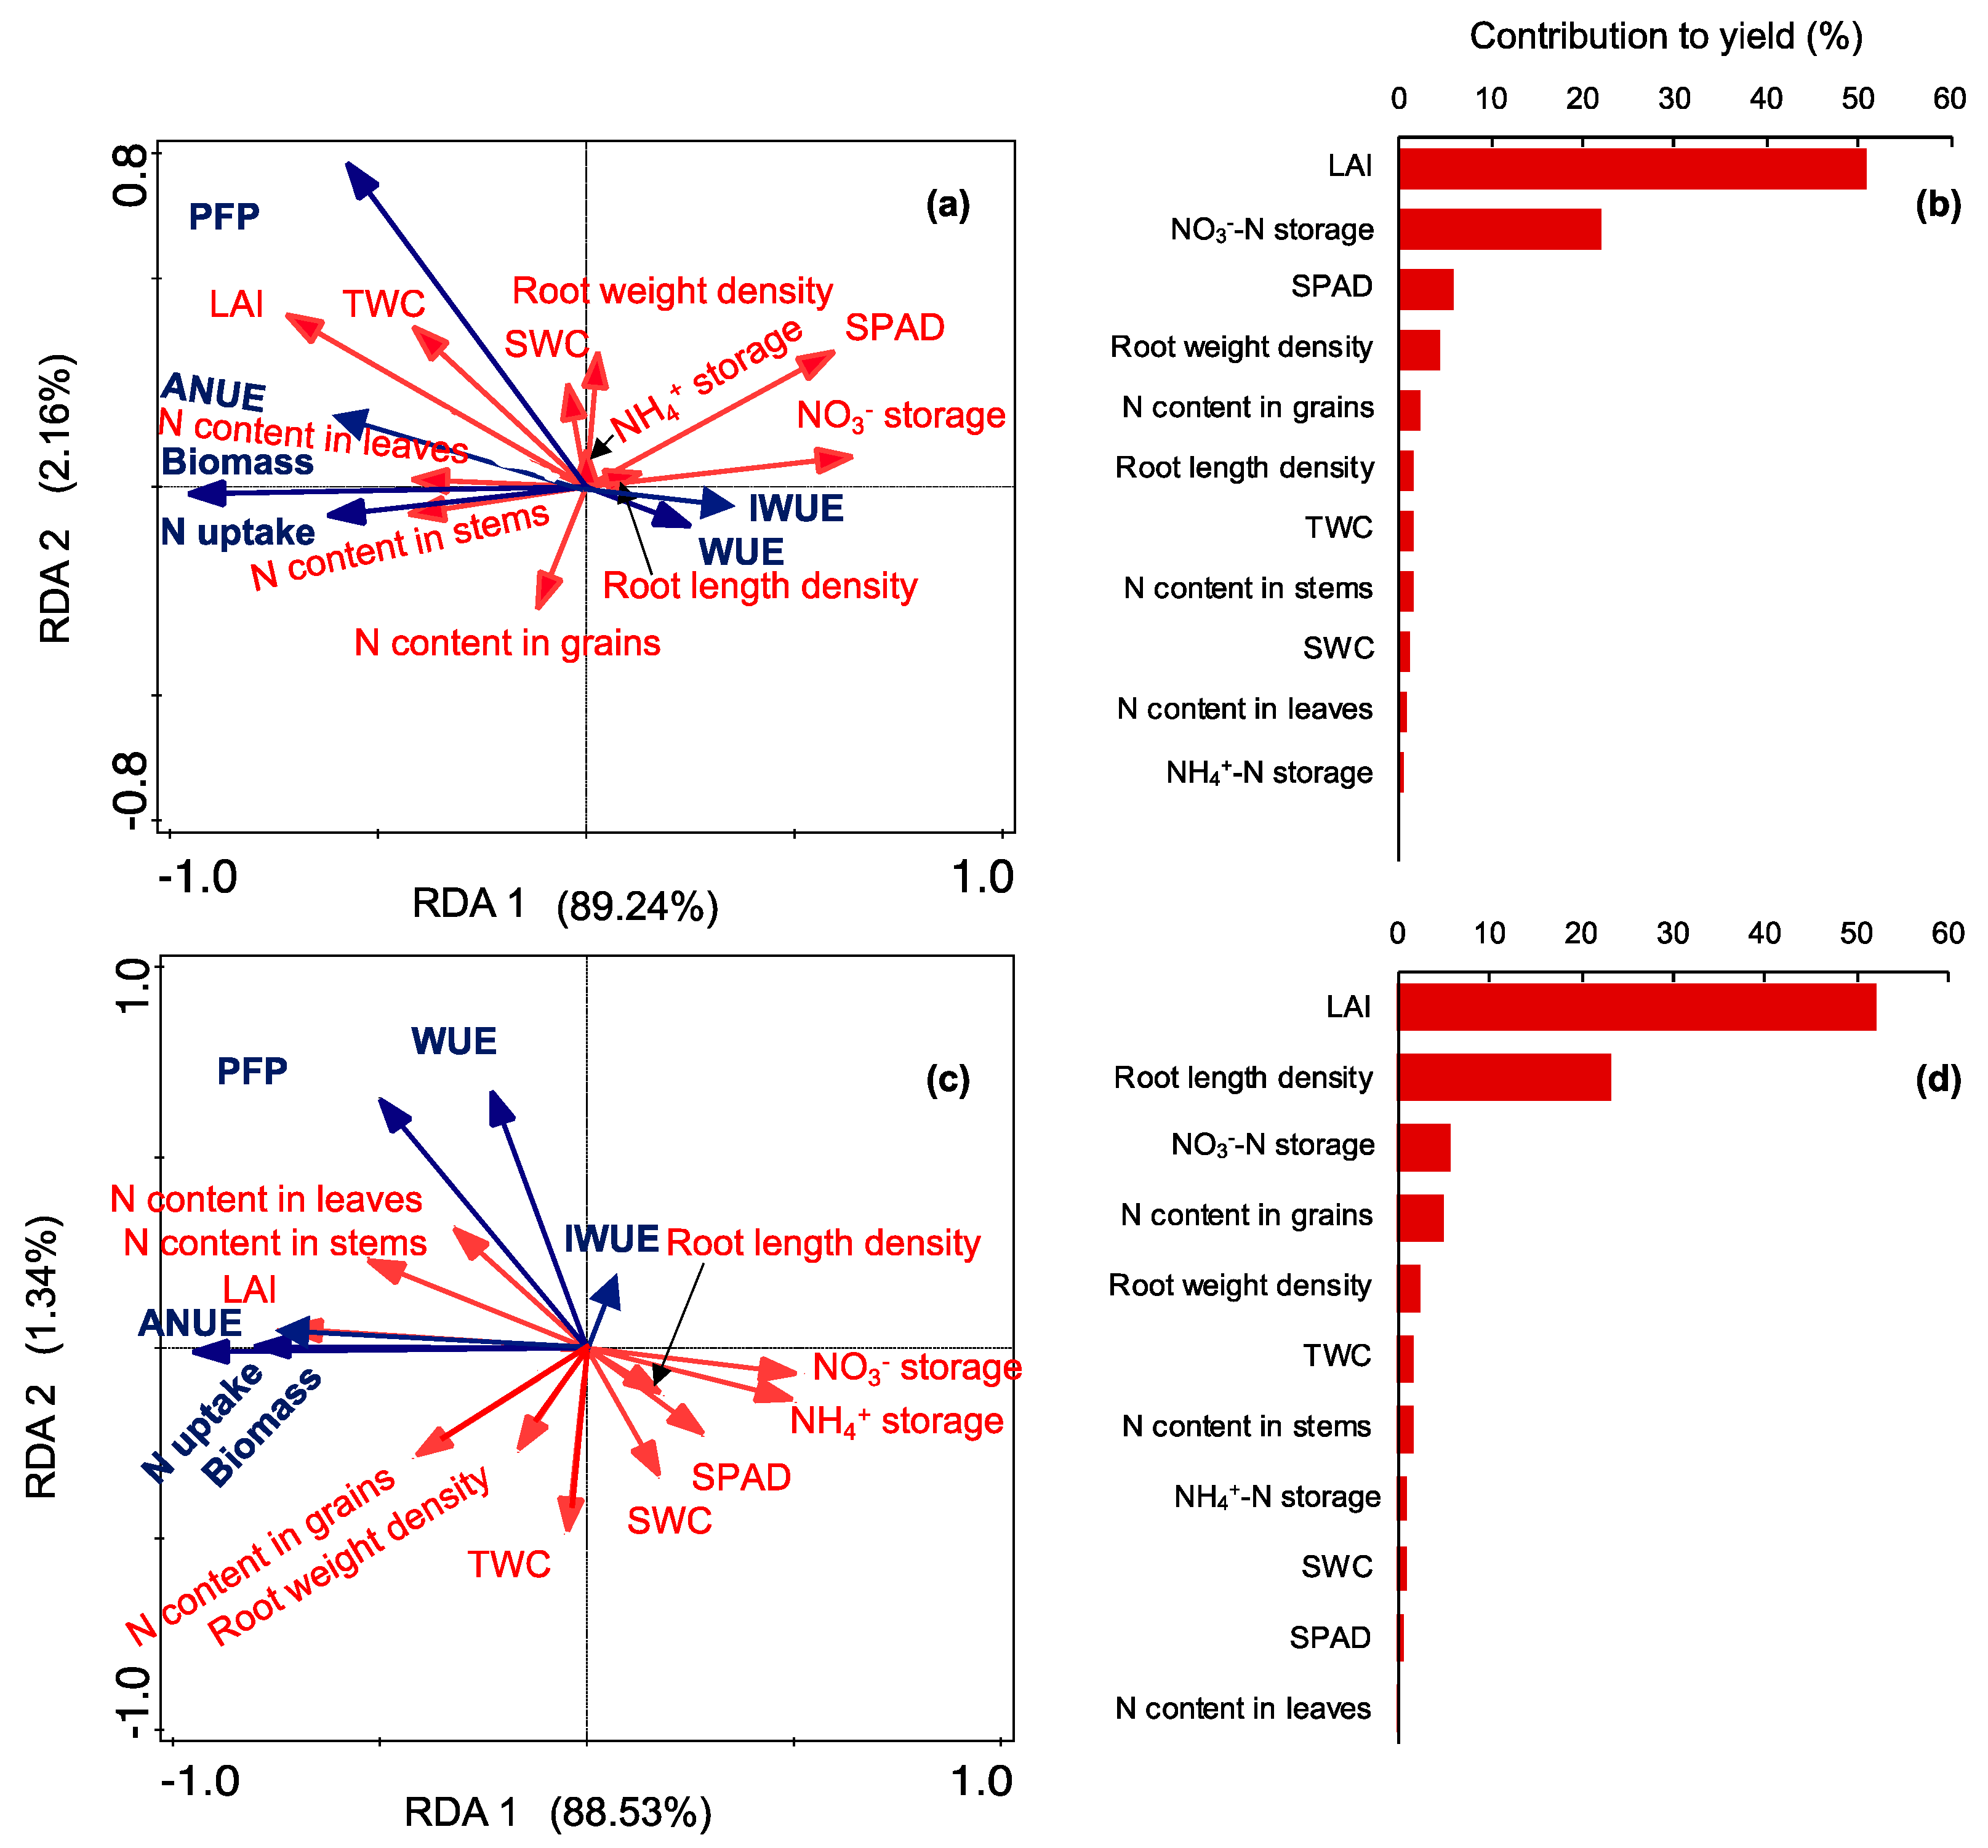
3.4. The Effects of Irrigation and N Managements on Wheat Growth and Crop Water Productivity

Under N1, the LAI, TWC, RWD and SWC were positively and significantly correlated to yield, PFP and ANUE (Figure 8a), in which LAI and soil NO3–N storage were the major contributors to yield, accounting for 51.0% and 21.9%, respectively (Figure 8b). The crop biomass and N uptake were significantly and positively affected by N content in leaves and stems, while were significantly and negatively affected by soil NO3–N storage. Root length density and soil NO3–N storage were positively correlated to WUE and IWUE (p < 0.05).
Under N2, the LAI, N content in leaves and stems were positively and significantly correlated to yield, PFP and ANUE (Figure 8c). The LAI and root length density were the major contributors to yield, accounting for 52.0% and 23.4%, respectively (Figure 8d). The crop biomass and N uptake were significantly and positively affected by the LAI, N content in leaves and stems, while were significantly and negatively affected by soil NO3–N and NH4+–N storage. RWD was positively correlated (p < 0.05) TWC and SWC under N1 and N2.

4. Discussion

4.1. The Effects of Fertilization and Irrigation on Soil Water and Nitrogen Conditions

In a semi-arid regions like northern China, the rainfall in winter season is far less than evaporation, thus water has been a major factor to limit wheat yields [33]. Normally, irrigation can directly and significantly increase the soil total water consumption by crops [34]. Irrigation and rainfall are the main sources to meet the water need of plant growth. For example, He et al. [35] found that high irrigation enhanced soil water content especially in the 10–60 cm soil layer. Here, we found out that during 2020–2021 season, total water consumption (TWC) increased along with the increase in irrigation amount. However, the highest TWC was found in D3 during 2021–2022, due to the higher soil water consumption (SWC). The reason might be the 19.4% increase in rainfall during 2021–2022 compared with 2020–2021, as a significant effect of year on SWC. This approach has been proved by He et al. [35]. Additionally, increasing irrigation water amount reduced the consumption rate of soil water through wheat roots [8], thus decreasing the percentage for SWC to TWC (e.g., D1 vs. D3). However, over-saving irrigation water input did not necessarily reduce TWC, because of the increase in SWC by crops. Accordingly, D2 treatment might be the better irrigation option for efficient water utilization, which can reduce SWC under the condition of low irrigation water input.
Soil inorganic N accumulation, especially soil NO3–N storage, could be strongly influenced by irrigation and rainfall [35,36]. However, heavy rainfall might offset the influences of irrigation on soil inorganic N concentrations. In the first season, a daily precipitation at June 13, 2021 was up to 41.4 mm, the heavy rainfall might cause the vertical leaching of NO3 and NH4+ to a deeper soil layer. This might be the main reason to resulted in that no significant effects of fertilization and irrigation on soil NH4+ storage in the 1 m soil layer (Figure 3). Therefore, increasing irrigation water amounts might reduce the inorganic N accumulation due to increasing the inorganic N (e.g., nitrate) migration to deeper soil [8]. In our study, reduced irrigation water application was beneficial to increase soil inorganic N accumulation storage, but caused the decrease in yield (Figure 3, Table 2). Therefore, under D1 or D2 treatment, N1 treatment might be better for avoiding soil inorganic N migration and remaining high inorganic N accumulation in upper soil.

4.2. The Effects of Fertilization and Irrigation on Crop Growth

The different water regimes under drip irrigation systems changed soil moisture and the root partitioning of winter wheat, then affected the plant N content and biomass allocation [33,37]. Additionally, the root growth had hydrotropism [38], which means the crop root partitioning could be directly affected by field soil moisture status [23]. For example, Sampathkumar et al. [24] found that the plant root system could be limited to a relatively shallow depth under drip irrigation due to the uneven and limited wet soil. Jha et al. [4] reported that frequently irrigated treatment could increase root length density (RLD) in the top soil, which was in line with our results (Figure 6, Figure 7 and Figure 8). Consequently, more winter wheat roots were gathered in the shallow soil layer (0–10 cm), and a lower RWD of D3 than D1 was found, which agrees with results obtained by Yang et al. [21].
Under drip irrigation systems, the soil in the main root zone of crops was always maintained appropriate moisture and oxygen content, causing a clear boundary in the soil between dryness and wetness [21]. The frequent alternations between soil dry and wet conditions was beneficial to improve root development [4]. Additionally, fertilizer N was dissolved in irrigation water and fertilized through drip irrigation systems, which resulted in N gathering near the taproot area, thus affected the crop growth and physiological characteristics [20,25].
An increased LAI extended the functional period of leaves and duration of photosynthesis, providing sufficient sources of photoassimilates for crop growth [39]. However, when the LAI was greater than that needed for maximizing crop growth rate caused the leaves shades and net assimilation rate decline [40]. In addition, excess irrigation water supplement might result in robust growth in early-season of wheat, which likely decreased the availabilities of soil water and nutrient in the late growth stages, thus caused the yield decrease [22]. Irrigation interacted with fertilization to affect the N content in stems and grains at maturity (Figure 4 and Figure 5), thus affected the crop total N distribution and utilization [41]. Previously, Ye et al. [42] and Ercoli et al. [43] reported that increasing irrigation amount might inhibit N translocation to grain in pre-anthesis, but promoting N assimilation in post-anthesis, and decreasing N content in grains. Therefore, D2 was the best method to maintain the highest N content in grains in all irrigation treatments.
Nitrogen management is another main factor affecting nitrogen transfer and absorption. Previously, Ye et al. [42] found out that the fertilizer N absorption rate by the crop in topdressing was higher than that in basal, thus resulted in the lower soil N losses. Additionally, the increase in pre-anthesis N accumulation through topdressing at key growth stages (e.g., jointing, flowering) were beneficial for the translocation of more N to the grain [44]. In this study, the highest values of NAM in the flowering stage were all found in N1 treatment, and resulted in the highest values of NT and NTPC (Table 1). Above all, D2 + N1 might be the best method to recommend for high resources utilization and future sustainable agricultural production (Figure 9).

4.3. The Effects of Fertilization and Irrigation on Biomass and Yield

Increasing biomass accumulation in post-anthesis is the main measure to improve wheat yields. In our study, the water and fertilizer N supplementation after the jointing stages was beneficial to increase biomass production (Figure 4), which was in line with Shang et al. [45]. Additionally, under the same irrigation treatment, the biomass in post-anthesis of N1 was significantly higher than that of N2 during 2020–2021 season. However, similar to what Li et al. [20] reported, irrigation was still the main factor to affect crop biomass. The post-anthesis biomass production was significantly affected by the duration period of green leaves [46]. This study also found that D2 was the better option to increase SPAD values in all irrigation treatments (Figure 4). Accordingly, D2 might be the better method to maintain high biomass.
The LAI will decrease with the decrease in irrigation amount, which is in agreement with previous studies [40,47]. However, in the current study, the LAI was positively and significantly correlated to yield, and was the major contributor to affect grain yield production, which was accounted for up to 51–52% through a redundancy analysis (Figure 8). As compared to D1, D2 reduced 17.8–18.1% of irrigation amount but not decreased yield, NAM, NT and NTPC especially (Table 1). This approach demonstrated that D2 was the better option to realize the high water and N productivity (Table 2, Figure 9).
N fertilization plays an important role in ensuring high grain yield. In current studies, the recommended N fertilizer applied rate was ranged in 180–240 kg ha−1 [14,15], which was reduced by >20% when compared to conventional practices. And there still was a potential reduction in N applied when combined with drip irrigation (i.e., fertigation), integrated N fertilization management, adjusted fertilization events [1,48]. In this study, there was no significant difference in grain yield between N1 (two topdressing events) and N2 (three topdressing events), which differed to Wang et al. [49], and the reason might be the significant differences in rainfall in different years increased the contribution of water to yield. Therefore, adopting different fertilizer and irrigation management based on precipitation year was essential to meet the great potential in improving water/nitrogen use and crop yield in northern China [50].

5. Conclusions

Irrigation practice but not fertilization regimes was the main factor affecting total water consumption. When the amount of irrigation water applied was decreased, the water demanded by crops was offset by the increase in soil water consumption. Additionally, the ratio of soil water consumption to ET was increased. However, fertilization but not irrigation significantly affected soil NO3–N accumulation. Irrigation was the main factor to affect grain yield, total N uptake, N transformation amount, and water use efficiency, and interacted with fertilization to affect the N content in plant. The LAI, as the main contributor to affect yield, was positively and significantly correlated to yield. In this study, D2 was beneficial in improving N content in grains, yield, and the LAI, and thus resulted in the highest WUE. Compared to N2, N1 was beneficial to prevent N leaching and increase water and N use efficiency, biomass, and N transformation amount. Therefore, D2 + N1 might be a promising system for obtaining high yield with water-saving irrigation in arid region of northern China.

Author Contributions

Conceptualization, X.Z., W.Z. and G.W.; methodology, X.Z. and J.Z.; software, L.L. and Y.L.; formal analysis, L.L. and Y.L.; investigation, L.L. and Y.L.; data curation, X.Z.; writing—original draft preparation, X.Z.; writing—review and editing, X.Z. and G.W.; supervision, G.W.; funding acquisition, X.Z. and G.W. All authors have read and agreed to the published version of the manuscript.

Funding

This research was funded by the Key Research and Development Program of Hebei Province (grant number: 21327001D and 22326402D).

Institutional Review Board Statement

Not applicable.

Data Availability Statement

The data are available from the corresponding author on reasonable request.

Acknowledgments

We gratefully acknowledge the participating farmers at Gaoyang Experimental Station, and other relevant help.

Conflicts of Interest

The authors declare no conflicts of interest.

References

  1. Asmamaw, D.K.; Janssens, P.; Dessie, M.; Tilahun, S.A.; Adgo, E.; Nyssen, J.; Walraevens, K.; Assaye, H.; Yenehun, A.; Nigate, F.; et al. Effect of deficit irrigation and soil fertility management on wheat production and water productivity in the Upper Blue Nile Basin, Ethiopia. Agric. Water Manag. 2023, 277, 108077. [Google Scholar] [CrossRef]
  2. Kharrou, M.H.; Le Page, M.; Chehbouni, A.; Simonneaux, V.; Er-Raki, S.; Jarlan, L.; Ouzine, L.; Khabba, S.; Chehbouni, G. Assessment of equity and adequacy of water delivery in irrigation systems using remote sensing-based indicators in semi-arid region, Morocco. Water Resour. Manag. 2013, 27, 4697–4714. [Google Scholar] [CrossRef]
  3. Rady, M.O.A.; Semida, W.M.; Howladar, S.M.; Abd El-Mageed, T.A. Raised beds modulate physiological responses, yield and water use efficiency of wheat (Triticum aestivum L.) under deficit irrigation. Agric. Water Manag. 2021, 245, 106629. [Google Scholar] [CrossRef]
  4. Jha, S.K.; Gao, Y.; Liu, H.; Huang, Z.; Wang, G.; Liang, Y.; Duan, A. Root development and water uptake in winter wheat under different irrigation methods and scheduling for North China. Agric. Water Manag. 2017, 182, 139–150. [Google Scholar] [CrossRef]
  5. Liu, C.; Zhang, X.; Zhang, Y. Determination of daily evaporation and evapotranspiration of winter wheat and maize by large-scale weighing lysimeter and micro-lysimeter. Agric. For. Meteorol. 2002, 111, 109–120. [Google Scholar] [CrossRef]
  6. Zhang, X.; Bol, R.; Rahn, C.; Xiao, G.; Meng, F.; Wu, W. Agricultural sustainable intensification improved nitrogen use efficiency and maintained high crop yield during 1980-2014 in Northern China. Sci. Total Environ. 2017, 596–597, 61–68. [Google Scholar] [CrossRef]
  7. Akbari, M.; Gheysari, M.; Mostafazadeh-Fard, B.; Shayannejad, M. Surface irrigation simulation-optimization model based on meta-heuristic algorithms. Agric. Water Manag. 2018, 201, 46–57. [Google Scholar] [CrossRef]
  8. Shen, H.; Gao, Y.; Sun, K.; Gu, Y.; Ma, X. Effects of differential irrigation and nitrogen reduction replacement on winter wheat yield and water productivity and nitrogen-use efficiency. Agric. Water Manag. 2023, 282, 108289. [Google Scholar] [CrossRef]
  9. Zhang, X.; Meng, F.; Li, H.; Wang, L.; Wu, S.; Xiao, G.; Wu, W. Optimized fertigation maintains high yield and mitigates N2O and NO emissions in an intensified wheat–maize cropping system. Agric. Water Manag. 2019, 211, 26–36. [Google Scholar] [CrossRef]
  10. Mounzer, O.; Pedrero-Salcedo, F.; Nortes, P.A.; Bayona, J.-M.; Nicolás-Nicolás, E.; Alarcón, J.J. Transient soil salinity under the combined effect of reclaimed water and regulated deficit drip irrigation of Mandarin trees. Agric. Water Manag. 2013, 120, 23–29. [Google Scholar] [CrossRef]
  11. Farneselli, M.; Benincasa, P.; Tosti, G.; Simonne, E.; Guiducci, M.; Tei, F. High fertigation frequency improves nitrogen uptake and crop performance in processing tomato grown with high nitrogen and water supply. Agric. Water Manag. 2015, 154, 52–58. [Google Scholar] [CrossRef]
  12. Wang, J.; Niu, W.; Li, Y.; Lv, W. Subsurface drip irrigation enhances soil nitrogen and phosphorus metabolism in tomato root zones and promotes tomato growth. Appl. Soil Ecol. 2018, 124, 240–251. [Google Scholar] [CrossRef]
  13. Guo, R.; Qian, R.; Han, F.; Khaliq, A.; Hussain, S.; Yang, L.; Zhang, P.; Chen, X.; Ren, X. Managing straw and nitrogen fertilizer based on nitrate threshold for balancing nitrogen requirement of maize and nitrate residue. J. Environ. Manag. 2023, 329, 117084. [Google Scholar] [CrossRef] [PubMed]
  14. Yao, C.; Li, J.; Zhang, Z.; Liu, Y.; Wang, Z.; Sun, Z.; Zhang, Y. Improving wheat yield, quality and resource utilization efficiency through nitrogen management based on micro-sprinkler irrigation. Agric. Water Manag. 2023, 282, 108277. [Google Scholar]
  15. Si, Z.; Zain, M.; Mehmood, F.; Wang, G.; Gao, Y.; Duan, A. Effects of nitrogen application rate and irrigation regime on growth, yield, and water-nitrogen use efficiency of drip-irrigated winter wheat in the North China Plain. Agric. Water Manag. 2020, 231, 106002. [Google Scholar] [CrossRef]
  16. Tedone, L.; Alhajj Ali, S.; Verdini, L.; De Mastro, G. Nitrogen management strategy for optimizing agronomic and environmental performance of rainfed durum wheat under Mediterranean climate. J. Clean. Prod. 2018, 172, 2058–2074. [Google Scholar] [CrossRef]
  17. Zhang, Z.; Yu, Z.; Zhang, Y.; Shi, Y. Split nitrogen fertilizer application improved grain yield in winter wheat (Triticum aestivum L.) via modulating antioxidant capacity and 13C photosynthate mobilization under water-saving irrigation conditions. Ecol. Process. 2021, 10, 21. [Google Scholar] [CrossRef]
  18. Yu, X.; Keitel, C.; Zhang, Y.; Wangeci, A.N.; Dijkstra, F.A. Global meta-analysis of nitrogen fertilizer use efficiency in rice, wheat and maize. Agric. Ecosyst. Environ. 2022, 338, 108089. [Google Scholar] [CrossRef]
  19. Foulkes, M.J.; Hawkesford, M.J.; Barraclough, P.B.; Holdsworth, M.J.; Kerr, S.; Kightley, S.; Shewry, P.R. Identifying traits to improve the nitrogen economy of wheat: Recent advances and future prospects. Field Crops Res. 2009, 114, 329–342. [Google Scholar] [CrossRef]
  20. Li, J.; Xu, X.; Lin, G.; Wang, Y.; Liu, Y.; Zhang, M.; Zhou, J.; Wang, Z.; Zhang, Y. Micro-irrigation improves grain yield and resource use efficiency by co-locating the roots and N-fertilizer distribution of winter wheat in the North China Plain. Sci. Total Environ. 2018, 643, 367–377. [Google Scholar] [CrossRef]
  21. Yang, D.; Li, S.; Wu, M.; Yang, H.; Zhang, W.; Chen, J.; Wang, C.; Huang, S.; Zhang, R.; Zhang, Y. Drip irrigation improves spring wheat water productivity by reducing leaf area while increasing yield. Eur. J. Agron. 2023, 143, 126710. [Google Scholar] [CrossRef]
  22. Guo, Y.; Yin, W.; Hu, F.; Fan, Z.; Fan, H.; Zhao, C.; Yu, A.; Chai, Q.; Coulter, J.A. Reduced irrigation and nitrogen coupled with no-tillage and plastic mulching increase wheat yield in maize-wheat rotation in an arid region. Field Crops Res. 2019, 243, 107615. [Google Scholar] [CrossRef]
  23. Wang, J.; Du, G.; Tian, J.; Jiang, C.; Zhang, Y.; Zhang, W. Mulched drip irrigation increases cotton yield and water use efficiency via improving fine root plasticity. Agric. Water Manag. 2021, 255, 106992. [Google Scholar] [CrossRef]
  24. Sampathkumar, T.; Pandian, B.J.; Mahimairaja, S. Soil moisture distribution and root characters as influenced by deficit irrigation through drip system in cotton–maize cropping sequence. Agric. Water Manag. 2012, 103, 43–53. [Google Scholar] [CrossRef]
  25. Wang, C.; Liu, W.; Li, Q.; Ma, D.; Lu, H.; Feng, W.; Xie, Y.; Zhu, Y.; Guo, T. Effects of different irrigation and nitrogen regimes on root growth and its correlation with above-ground plant parts in high-yielding wheat under field conditions. Field Crops Res. 2014, 165, 138–149. [Google Scholar] [CrossRef]
  26. Gao, Z.; Liang, X.G.; Lin, S.; Zhao, X.; Zhang, L.; Zhou, L.L.; Shen, S.; Zhou, S.L. Supplemental irrigation at tasseling optimizes water and nitrogen distribution for high-yield production in spring maize. Field Crops Res. 2017, 209, 120–128. [Google Scholar] [CrossRef]
  27. Ye, T.; Ma, J.; Zhang, P.; Shan, S.; Liu, L.; Tang, L.; Cao, W.; Liu, B.; Zhu, Y. Interaction effects of irrigation and nitrogen on the coordination between crop water productivity and nitrogen use efficiency in wheat production on the North China Plain. Agric. Water Manag. 2022, 271, 107787. [Google Scholar] [CrossRef]
  28. Yan, P.; Yue, S.; Qiu, M.; Chen, X.; Cui, Z.; Chen, F. Using maize hybrids and in-season nitrogen management to improve grain yield and grain nitrogen concentrations. Field Crops Res. 2014, 166, 38–45. [Google Scholar] [CrossRef]
  29. Zhang, D.B.; Zhang, C.; Ren, H.L.; Xu, Q.; Yao, Z.Y.; Yuan, Y.Q.; Yao, P.W.; Zhao, N.; Li, Y.Y.; Zhang, S.Q.; et al. Trade-offs between winter wheat production and soil water consumption via leguminous green manures in the Loess Plateau of China. Field Crop Res. 2021, 272, 108278. [Google Scholar] [CrossRef]
  30. Wang, D.; Yu, Z.; White, P.J. The effect of supplemental irrigation after jointing on leaf senescence and grain filling in wheat. Field Crops Res. 2013, 151, 35–44. [Google Scholar] [CrossRef]
  31. Jha, S.K.; Ramatshaba, T.S.; Wang, G.; Liang, Y.; Liu, H.; Gao, Y.; Duan, A. Response of growth, yield and water use efficiency of winter wheat to different irrigation methods and scheduling in North China Plain. Agric. Water Manag. 2019, 217, 292–302. [Google Scholar]
  32. Koutroubas, S.D.; Fotiadis, S.; Damalas, C.A. Biomass and nitrogen accumulation and translocation in spelt (Triticum spelta) grown in a Mediterranean area. Field Crops Res. 2012, 127, 1–8. [Google Scholar] [CrossRef]
  33. Dai, Y.; Fan, J.; Liao, Z.; Zhang, C.; Yu, J.; Feng, H.; Zhang, F.; Li, Z. Supplemental irrigation and modified plant density improved photosynthesis, grain yield and water productivity of winter wheat under ridge-furrow mulching. Agric. Water Manag. 2022, 274, 107985. [Google Scholar] [CrossRef]
  34. Wang, B.; van Dam, J.; Yang, X.; Ritsema, C.; Du, T.; Kang, S. Reducing water productivity gap by optimizing irrigation regime for winter wheat-summer maize system in the North China Plain. Agric. Water Manag. 2023, 280, 108229. [Google Scholar] [CrossRef]
  35. He, Y.; Xi, B.; Li, G.; Wang, Y.; Jia, L.; Zhao, D. Influence of drip irrigation, nitrogen fertigation, and precipitation on soil water and nitrogen distribution, tree seasonal growth and nitrogen uptake in young triploid poplar (Populus tomentosa) plantations. Agric. Water Manag. 2021, 243, 106460. [Google Scholar] [CrossRef]
  36. Sato, S.; Morgan, K.T.; Ozores-Hampton, M.; Simonne, E.H. Spatial and temporal distributions in sandy soils with seepage irrigation: I. ammonium and nitrate. Soil Sci. Soc. Am. J. 2009, 73, 1044–1052. [Google Scholar] [CrossRef]
  37. Yan, S.; Wu, Y.; Fan, J.; Zhang, F.; Guo, J.; Zheng, J.; Wu, L. Optimization of drip irrigation and fertilization regimes to enhance winter wheat grain yield by improving post-anthesis dry matter accumulation and translocation in northwest China. Agric. Water Manag. 2022, 271, 107782. [Google Scholar] [CrossRef]
  38. Maurel, C.; Nacry, P. Root architecture and hydraulics converge for acclimation to changing water availability. Nat. Plants 2020, 6, 744–749. [Google Scholar] [CrossRef]
  39. Boedhram, N.; Arkebauer, T.J.; Batchelor, W.D. Season-long characterization of vertical distribution of leaf area in corn. Agron. J. 2001, 93, 1235–1242. [Google Scholar] [CrossRef]
  40. Han, Y.; Wang, Y.; Zhang, D.; Gao, H.; Sun, Y.; Tao, B.; Zhang, F.; Ma, H.; Liu, X.; Ren, H. Planting models and deficit irrigation strategies to improve radiation use efficiency, dry matter translocation and winter wheat productivity under semi-arid regions. J. Plant Physiol. 2023, 280, 153864. [Google Scholar] [CrossRef]
  41. Liu, K.; Zhang, T.Q.; Tan, C.S.; Astatkie, T.; Price, G.W. Crop and soil nitrogen responses to phosphorus and potassium fertilization and drip irrigation under processing tomato. Nutr. Cycl. Agroecosystems 2012, 93, 151–162. [Google Scholar] [CrossRef]
  42. Ye, T.; Liu, B.; Wang, X.; Zhou, J.; Liu, L.; Tang, L.; Cao, W.; Zhu, Y. Effects of water-nitrogen interactions on the fate of nitrogen fertilizer in a wheat-soil system. Eur. J. Agron. 2022, 136, 126507. [Google Scholar] [CrossRef]
  43. Ercoli, L.; Lulli, L.; Mariotti, M.; Masoni, A.; Arduini, I. Post-anthesis dry matter and nitrogen dynamics in durum wheat as affected by nitrogen supply and soil water availability. Eur. J. Agron. 2008, 28, 138–147. [Google Scholar] [CrossRef]
  44. Liu, M.; Wu, X.; Li, C.; Li, M.; Xiong, T.; Tang, Y. Dry matter and nitrogen accumulation, partitioning, and translocation in synthetic-derived wheat cultivars under nitrogen deficiency at the post-jointing stage. Field Crops Res. 2020, 248, 107720. [Google Scholar] [CrossRef]
  45. Shang, Y.; Wang, S.; Lin, X.; Gu, S.; Wang, D. Supplemental irrigation at jointing improves spike formation of wheat tillers by regulating sugar distribution in ear and stem. Agric. Water Manag. 2023, 279, 108160. [Google Scholar] [CrossRef]
  46. Aisawi, K.A.B.; Reynolds, M.P.; Singh, R.P.; Foulkes, M.J. The physiological basis of the genetic progress in yield potential of CIMMYT spring wheat cultivars from 1966 to 2009. Crop Sci. 2015, 55, 1749–1764. [Google Scholar] [CrossRef]
  47. Piao, L.; Qi, H.; Li, C.; Zhao, M. Optimized tillage practices and row spacing to improve grain yield and matter transport efficiency in intensive spring maize. Field Crops Res. 2016, 198, 258–268. [Google Scholar] [CrossRef]
  48. Liu, C.; Ren, D.; Liu, H.; Zhang, Y.; Wang, L.; Li, Z.; Zhang, M. Optimizing nitrogen management diminished reactive nitrogen loss and acquired optimal net ecosystem economic benefit in a wheat-maize rotation system. J. Clean. Prod. 2022, 331, 129964. [Google Scholar] [CrossRef]
  49. Wang, Y.; Peng, Y.; Lin, J.; Wang, L.; Jia, Z.; Zhang, R. Optimal nitrogen management to achieve high wheat grain yield, grain protein content, and water productivity: A meta-analysis. Agric. Water Manag. 2023, 290, 108587. [Google Scholar] [CrossRef]
  50. Gao, Z.; Wang, C.; Zhao, J.; Wang, K.; Shang, M.; Qin, Y.; Bo, X.; Chen, F.; Chu, Q. Adopting different irrigation and nitrogen management based on precipitation year types balances winter wheat yields and greenhouse gas emissions. Field Crops Res. 2022, 280, 108484. [Google Scholar] [CrossRef]
Figure 1. The (a) irrigation regimes, (c) fertilization schedules, and (b) daily air temperature (°C), (d) precipitation (mm), sunshine duration (hours d−1) from 2020 to 2022 in Gaoyang County, China.
Agriculture 14 01496 g001
Figure 2. Three sources of water consumption during the wheat growth period (a,b) and their percentages of total water consumption (c,d) under different irrigation and nitrogen treatments, and a three-way ANOVA among year, fertilization and irrigation (e). Different lowercase letters indicate significant (p < 0.05) difference among these six different treatments. SWC, soil water consumption; TWC, total water consumption. The effects of year, fertilization and irrigation were estimated by three-way ANOVA. *, ** and *** represent the 0.05, 0.01 and 0.001 significance levels, respectively. NS: non-significant.
Agriculture 14 01496 g002
Figure 3. Soil NO3–N, NH4+–N accumulation in the 0–100 cm soil layer under different fertilization and irrigation treatments during the 2020–2022. Different letters indicate significant differences among these three irrigation treatments under N1 or N2 using the least significant difference (LSD) test at p < 0.05. The effects of fertilization and irrigation were estimated by two-way ANOVA. ** and *** represent the 0.01 and 0.001 significance levels, respectively. NS: non-significant.
Agriculture 14 01496 g003
Figure 4. The leaf area index (LAI), SPAD values, and biomass under different fertilization and irrigation treatments during the 2020–2022 growing seasons. Vertical bars represent the LSD at p = 0.05 (n = 3). The effects of fertilization and irrigation were estimated by two-way ANOVA. *, ** and *** represent the 0.05, 0.01 and 0.001 significance levels, respectively. NS: non-significant.
Agriculture 14 01496 g004
Figure 5. Crop N content under different fertilization and irrigation treatments during the 2020–2022 growing seasons. Vertical bars represent the LSD at p = 0.05 (n = 3). The effects of fertilization and irrigation were estimated by two-way ANOVA. *, ** and *** represent the 0.05, 0.01 and 0.001 significance levels, respectively. NS: non-significant. Different letters indicate significant differences among these six treatments using the least significant difference (LSD) test at p < 0.05.
Agriculture 14 01496 g005
Figure 6. Root length density (RLD) in the 0–60 cm soil layer under different fertilization and irrigation treatments at the flowering stage during 2020–2022 seasons. (The error bars represent the standard error of the data, n = 3). Vertical bars represent the LSD at p = 0.05 (n = 3). Different letters indicate significant differences among these three irrigation treatments under N1 or N2 using the least significant difference (LSD) test at p < 0.05. The effects of fertilization and irrigation were estimated by two-way ANOVA. ** and *** represent the 0.01 and 0.001 significance levels, respectively. NS: non-significant.
Agriculture 14 01496 g006
Figure 7. Root weight density (RWD) in the 0–60 cm soil layer under different fertilization and irrigation treatments at the flowering stage during 2020–2022 seasons. (The error bars represent the standard error of the data, n = 3). Vertical bars represent the LSD at p = 0.05 (n = 3). Different letters indicate significant differences among these three irrigation treatments under N1 or N2 using the least significant difference (LSD) test at p < 0.05. The effects of fertilization and irrigation were estimated by two-way ANOVA. *, ** and *** represent the 0.05, 0.01 and 0.001 significance levels, respectively. NS: non-significant.
Agriculture 14 01496 g007
Figure 8. Redundancy analysis (RDA) among yield, biomass, total N uptake, water and N productivity, and soil and crop characteristics and the contributions to yield under N1 (a,b) and N2 (c,d).
Agriculture 14 01496 g008
Figure 9. Radar diagram of comprehensive assessment of selected parameters under different treatments. TWC, total water consumption; WUE, total water use efficiency; ANUE, apparent N use efficiency; RLD, root length density; RWD, root weight density.
Agriculture 14 01496 g009
Table 1. N accumulation and transformation in different treatments.
YearTreatmentNAM
kg ha−1
NT
kg ha−1
NTPC
%
2020–2021N1D1320.1 ± 5.4 a207.1 ± 7.6 a78.4 ± 3.0 a
N1D2274.3 ± 3.6 b172.0 ± 4.5 b75.3 ± 2.9 ab
N1D3219.7 ± 5.7 d138.6 ± 2.1 c75.8 ± 2.0 ab
N2D1288.0 ± 4.5 b171.3 ± 3.2 b76.3 ± 1.9 ab
N2D2259.3 ± 6.3 c148.3 ± 3.3 c70.1 ± 0.5 b
N2D3195.2 ± 1.5 e115.9 ± 1.7 d70.1 ± 0.7 b
2021–2022N1D1323.1 ± 13.1 a189.6 ± 7.1 ab71.0 ± 4.9 ab
N1D2328.6 ± 8.9 a197.6 ± 4.5 a72.2 ± 5.7 a
N1D3251.8 ± 3.6 cd126.3 ± 1.0 d58.5 ± 0.6 b
N2D1316.4 ± 20.3 ab181.8 ± 5.5 b70.5 ± 3.0 ab
N2D2281.3 ± 13.0 bc147.2 ± 2.3 c64.2 ± 5.0 ab
N2D3241.4 ± 7.7 d122.0 ± 2.5 d59.5 ± 1.0 ab
Three-way ANOVA
Year (Y) **NS**
Fertilization (F) ****NS
Irrigation (I) ******
Y × F NSNSNS
Y × I NS*NS
F × INS**NS
Y × F × INS**NS
Note: NAM, total N accumulation amount; NT, N transformation amount; NTPC, the contribution of N transformation amount to grain. Different letters indicate significant differences among these six irrigation treatments during 2020–2021 and 2021–2022 seasons using the least significant difference (LSD) test at p < 0.05. The effects of year, fertilization and irrigation were estimated by three-way ANOVA. *, ** represent the 0.05, 0.01 significance levels, respectively. NS: non-significant.
Table 2. Wheat yield formation, N uptake, and water use and nitrogen use efficiencies.
Formation of YieldYieldN UptakeWater ProductivityN Productivity
YearTreatmentSpike NumberKernels per Spike1000-Grain WeightStrawGrainTotalWUEIWUEPFPANUE
104 ha−1 gMg ha−1kg N ha−1kg mm−1
2020–2021N1D1687.7 ± 5.2 a39.7 ± 1.0 a47.7 ± 0.6 a10.7 ± 0.2 a48.8 ± 4.7 ab242.6 ± 4.9 a291.4 ± 7.2 a1.9 ± 0.0 b4.8 ± 0.1 c50.9 ± 0.8 a138.8 ± 3.4 a
N1D2651.0 ± 15.9 a38.6 ± 1.8 a48.6 ± 0.9 a10.0 ± 0.1 ab38.9 ± 1.9 abc232.0 ± 2.7 ab270.8 ± 4.4 a1.9 ± 0.1 b5.4 ± 0.1 b47.8 ± 0.7 ab129.0 ± 2.1 a
N1D3611.3 ± 7.4 b39.7 ± 2.2 a48.6 ± 0.4 a9.8 ± 0.1 b28.3 ± 3.7 cd219.8 ± 5.2 b248.1 ± 8.7 b2.2 ± 0.0 a6.7 ± 0.1 a46.4 ± 0.6 b118.2 ± 4.2 b
N2D1605.3 ± 2.4 b40.6 ± 0.4 a49.6 ± 1.7 a9.9 ± 0.2 ab55.6 ± 5.4 a240.4 ± 2.4 a296.0 ± 7.1 a1.9 ± 0.1 b4.4 ± 0.1 c47.4 ± 1.0 ab140.9 ± 3.4 a
N2D2609.0 ± 2.1 b39.8 ± 2.4 a50.4 ± 0.8 a9.9 ± 0.2 ab37.1 ± 2.5 bcd248.1 ± 8.2 a285.1 ± 7.6 a2.0 ± 0.1 ab5.4 ± 0.1 b47.3 ± 0.8 ab135.8 ± 3.6 a
N2D3611.7 ± 5.8 b38.6 ± 1.8 a47.8 ± 0.7 a9.5 ± 0.3 b20.9 ± 2.7 d219.8 ± 5.1 b240.6 ± 2.4 b1.9 ± 0.1 b6.5 ± 0.2 a45.2 ± 1.3 b114.6 ± 1.1 b
2021–2022N1D1671.0 ± 8.7 bc35.9 ± 0.7 a51.2 ± 0.5 a10.2 ± 0.1 a51.9 ± 3.2 ab258.9 ± 10.2 ab310.8 ± 10.4 a2.0 ± 0.1 ab8.4 ± 0.0 b48.5 ± 0.3 a148.0 ± 5.0 a
N1D2719.3 ± 12.1 ab33.5 ± 1.0 a51.0 ± 1.4 a10.3 ± 0.4 a43.9 ± 8.5 abc276.8 ± 6.0 a320.8 ± 5.7 a2.2 ± 0.1 a10.0 ± 0.3 a48.9 ± 1.7 a152.7 ± 2.7 a
N1D3717.0 ± 18.6 ab33.2 ± 2.1 a49.4 ± 1.5 a9.9 ± 0.0 a25.7 ± 2.6 c236.2 ± 19.0 b261.9 ± 16.9 b1.8 ± 0.0 b10.6 ± 0.0 a47.1 ± 0.1 a124.7 ± 8.1 b
N2D1714.3 ± 9.8 ab34.9 ± 0.8 a50.2 ± 1.8 a10.1 ± 0.0 a55.0 ± 6.0 a248.3 ± 19.0 ab303.3 ± 25.0 ab2.0 ± 0.1 ab8.4 ± 0.0 b48.2 ± 0.2 a144.4 ± 11.9 ab
N2D2754.7 ± 2.2 a34.2 ± 0.6 a46.6 ± 2.3 a10.1 ± 0.2 a39.6 ± 3.1 abc269.0 ± 3.8 a308.7 ± 4.8 a2.1 ± 0.1 ab9.8 ± 0.2 a48.1 ± 1.1 a147.0 ± 2.3 a
N2D3658.7 ± 4.2 c35.5 ± 0.7 a49.7 ± 1.3 a9.6 ± 0.2 a30.9 ± 3.1 bc246.4 ± 12.9 b277.3 ± 12.8 ab1.9 ± 0.0 ab10.4 ± 0.2 a45.9 ± 0.7 a132.0 ± 6.1 ab
Three-way ANOVA
Year (Y)******NSNSNS****NS***NS**
Fertilization (F)**NSNS*NSNSNSNSNS*NS
Irrigation (I)***NSNS*******************
Y × F***NSNSNSNSNSNSNSNSNSNS
Y × I***NSNSNSNSNSNS****NSNS
F × INSNSNSNSNSNSNSNSNSNSNS
Y × F × I***NSNSNSNS*NSNSNSNSNS
Note: WUE, total water use efficiency; IWUE, irrigation water use efficiency; PFP, partial factor productivity for fertilizer N; ANUE, apparent N use efficiency. Different letters indicate significant differences among these six irrigation treatments during 2020–2021 and 2021–2022 seasons using the least significant difference (LSD) test at p < 0.05. The effects of year, fertilization and irrigation were estimated by three-way ANOVA. *, ** and *** represent the 0.05, 0.01 and 0.001 significance levels, respectively. NS: non-significant.
Disclaimer/Publisher’s Note: The statements, opinions and data contained in all publications are solely those of the individual author(s) and contributor(s) and not of MDPI and/or the editor(s). MDPI and/or the editor(s) disclaim responsibility for any injury to people or property resulting from any ideas, methods, instructions or products referred to in the content.

