Article

Long-Term Manuring Enhanced Compositional Stability of Glomalin-Related Soil Proteins through Arbuscular Mycorrhizal Fungi Regulation

1
Key Laboratory of Arable Land Quality Monitoring and Evaluation, Ministry of Agriculture and Rural Affairs/State Key Laboratory of Efficient Utilization of Arid and Semi-Arid Arable Land in Northern China, Institute of Agricultural Resources and Regional Planning, Chinese Academy of Agricultural Sciences (CAAS), Beijing 100081, China
2
Terra Research Centre, Gembloux Agro-Bio Tech, University of Liège, 5030 Gembloux, Belgium
*
Author to whom correspondence should be addressed.
Agriculture 2024, 14(9), 1510; https://doi.org/10.3390/agriculture14091510
Submission received: 28 June 2024 / Revised: 15 August 2024 / Accepted: 16 August 2024 / Published: 3 September 2024

Abstract

:
Glomalin-related soil proteins (GRSP) play a crucial role in strengthening soil structure and increasing carbon (C) storage. However, the chemical stability of GRSP and related arbuscular mycorrhizal fungi (AMF) community response to fertilization remains unclear. This study investigated C and nitrogen (N) contents, three-dimensional fluorescence characteristics in GRSP, and AMF properties based on a field experiment that was subjected to 29 years of various fertilizations. The experiment included treatments with no fertilizer (CK), chemical fertilizer (NPK), manure (M), and manure combined with NPK (NPKM) treatments. Results showed that GRSP contained 37–49% C and 6–9% N, respectively. Compared with CK and NPK, the C and N proportions in GRSP significantly increased under M and NPKM. Using the parallel factor model, four fluorescent components of GRSP were identified: one fulvic acid-like component (C2), one tyrosine-like component (C4), and two humic acid-like components (C1, C3). Under M and NPKM, the fluorescent intensity of C2 and C4 decreased, while the humification index (HIX) increased relative to CK and NPK, indicating that organic fertilization could enhance the stability of GRSP. The C and N proportion in GRSP positively associated with soil organic C (SOC), total N (TN), available phosphorus (AP), AMF biomass, and diversity, while C2 and C4 showed negative associations. Structural equation modeling further revealed that manure-induced changes in pH, SOC, TN, and AP increased AMF biomass and diversity, thereby altering GRSP composition and stability. This study provides valuable insights into the compositional traits of GRSP, contributing to sustainable soil management and C sequestration in agroecosystems.

1. Introduction

Glomalin-related soil proteins (GRSP) are heat-stable proteins with an aromatic structure primarily derived from the metabolic activities of micro-organisms, notably arbuscular mycorrhizal fungi (AMF) [1,2]. GRSP serves as a crucial nutrient source for plants and microbes, containing 20–43% carbon (C) [3,4] and 3–5% nitrogen (N) [5]. In addition, GRSP has important ecological functions in improving soil stability, promoting soil C sequestration, enhancing microbial activity, and passivating heavy metals due to their recalcitrance, hydrophobicity, cohesiveness, and iron-binding capacity [6]. These functions largely depend on compositional traits of GRSP, such as functional group, fluorescence components, and/or C and N element ratio [7,8]. Studies have shown that molecular weight and element contents in GRSP vary with vegetation types and soil properties [9,10]. For instance, the C concentration of GRSP from saline soils is reported to be about 2.5 times higher than that from marine sediments in the old Yellow River Delta [3,11]. In coastal wetland soils, the C/N ratio of GRSP increases with soil depth [7]. Compared to forest soils, cropland soils exhibit higher concentrations of low molecular weight and aromatic GRSP [12]. In cropland, fertilization can affect GRSP contents [13]. However, the impacts of different fertilization regimes on the elemental characteristics of GRSP remain unclear.
Research on the chemical composition of GRSP remains limited, and significant differences have been observed across various soil types. Wang et al. used three-dimensional fluorescence spectroscopy (EEM) combined with parallel factor analysis (PARAFAC) to identify various organic substances in GRSP samples from forest soil. These substances included compounds similar to tyrosine protein, tryptophan protein, fulvic acid, humic acid, soluble microbial byproduct, nitrobenzoxadiazole, and calcofluor white [14]. However, Guo et al. identified four components from coastal wetland soils, including one tyrosine-like protein and three humic acid-like components [7]. These findings indicate that GRSP is not a typical glycosylated protein and that there are differences in the fluorescent components of GRSP. Although some progress has been made in forest and/or grassland ecosystems [4,15], the fluorescence characteristics of GRSP in cropland, particularly under different fertilization types, remain unclear. Since the 1980s, mineral fertilizer has become a substitute for organic manure due to its low price and convenience [16], but long-term mineral fertilization has led to issues such as soil acidification [17] and decreased fertility [18], which may largely affect the compositional traits of GRSP [15]. Therefore, elucidating the differences in compositional traits of GRSP under various long-term fertilization regimes is crucial for comprehensively understanding their ecological functions and providing scientific guidance for agricultural management.
AMF represents a significant pathway for C transfer from plants to soil [19]. AMF utilizes specific membrane transporters in root cortex cells to obtain N and P nutrients in exchange for plant-derived C [20]. However, it remains unclear how fertilization affects AMF communities and diversity, and subsequently, the fluorescence components and C and N element changes in GRSP. Some studies have shown that organic fertilization increases AMF biomass and diversity by regulating pH and nutrients, thereby altering the functional group structures of GRSP and increasing the proportion of aromatic C [13]. Zhong et al. found that soil moisture and electrical conductivity (EC) negatively influence the tyrosine-like component of GRSP [15]. Additionally, soil biofilms, composed of bacteria and fungi, play a critical role in GRSP production and stability, further influencing soil structure and quality [21]. Organic fertilizers contribute to the formation and maintenance of these biofilms, thereby enhancing overall soil health and GRSP accumulation. Bacteria and fungi in biofilms can synergistically interact with AMF, promoting GRSP production and its compositional traits [22]. Therefore, exploring the relationship between GRSP chemical characteristics and edaphic and microbial properties can clarify the key regulatory factors influencing GRSP accumulation in cropland soils under different fertilization regimes.
In this study, we aimed to unravel the compositional traits of GRSP in the cropland and how fertilization affects GRSP fluorescence components and C and N element changes based on an experiment subjected to a 29-year fertilization. Our hypotheses were that (i) manuring could increase the content and concentrations of C and N in GRSP, as well as alter the fluorescence components, and (ii) fertilization-induced changes in soil nutrients and pH would regulate AMF biomass and diversity, thereby altering the fluorescence components and C and N concentrations in GRSP.

2. Materials and Methods

2.1. Study Site

A long-term field experiment was initiated in 1990 on cropland soil located in Qiyang County, Hunan Province, China (26°45′ N, 111°52′ E). The site experiences a subtropical climate characterized by a mean annual temperature of 18.1 °C and mean annual precipitation of 1431 mm. The soil originates from quaternary red clay and is classified as Ferralic Cambisol according to the FAO classification. The initial soil pH was 5.70, with soil organic carbon (SOC) at 8.58 g kg−1, total nitrogen (TN) at 1.07 g kg−1, and total phosphorus (TP) at 0.45 g kg−1. The predominant cropping system consists of winter wheat–summer maize rotations [19]. There are four treatments with two repetitions. The area of each plot was 196 m2, and two soil samples were taken from each plot as two sub-replicates. To ensure sufficient samples, we selected three replicates for measurement. The treatments comprised the following elements: no fertilizer (CK); mineral fertilizer (NPK, mineral N, P, K fertilizer); manure (M, pig manure, C:N ≈ 21); NPKM (NPK plus pig manure). The information on fertilizer application and period is shown in Table 1. Soil samples were collected using a 5-point sampling method after maize harvest in September 2019 at a depth of 0–20 cm (Figure S1). One portion of the soil was air-dried according to previous protocols, while the other portion of fresh soil was stored at −80 °C.

2.2. Soil Sampling Analysis

Initial SOC was measured using the sulfuric acid–potassium dichromate oxidation method; SOC content was corrected by a factor of 1.3. Initial TN was determined using the Kjeldahl method for nitrogen digestion and distillation. Initial TP was determined using molybdenum–antimony resistance colorimetric method. In 2019, soil organic carbon (SOC) and total nitrogen (TN) were determined using an elemental analyzer (EA3000, leeman technology Co., Ltd, Milan, Italy). Available phosphorus (AP) was tested using the molybdenum–antimony resistance colorimetric method. Soil pH was measured at a soil-to-water ratio of 1:2.5 (FE30, Mettler Toledo, Shanghai, China). AMF biomass was quantified using C16:1ω5 phospholipid fatty acids (PLFAs). AMF diversity was assessed using high-throughput sequencing. The Magigene platform (http://cloud.magigene.com, accessed on 1 May 2022) was used to calculate AMF diversity (Shannon–Wiener and Chao1 index). Detailed methods and soil properties data (Table S1) can also be found in Yang et al. [13].

2.3. GRSP Determination

GRSP was measured using the methods described by Wright et al. [23]. Briefly, to extract the total GRSP, 8 mL of 50 mmol L−1 sodium citrate (pH = 8.0) was used for every 1 g of air-dried soil. The extracts were centrifuged at 10,000× g for 6 min after an autoclaving process lasting 1 h at 121 °C. After completing this process four times for each sample, the supernatants were combined and centrifuged one more time to prepare them for measurement. The optical density (OD) values of GRSP were determined at 595 nm with an enzyme microplate reader, using bovine serum albumin (BSA) as the standard. The BSA standard curve is shown in Table S2.
The supernatant was precipitated by adding a higher concentration of hydrochloric acid, chilling in an ice bath for one hour, and centrifuging at 10,000× g for 6 min. The sediment was dialyzed in dH2O for 60 h (dialysis bag, molecular weight cut off = 10,000 Dalton, USA) after being dissolved in 0.1 M sodium hydroxide (NaOH). After dialysis, in order to remove any insoluble residue, the dialysate was centrifuged at 10,000× g for six minutes. The supernatant was then freeze-dried using a freeze-dryer to obtain solid GRSP.

2.4. Structural Characterizations of GRSP

Elemental analyzer (EA3000, Milan, Italy) was used to analyze atomic ratios of GRSP, including C and N elements. In brief, solid GRSP samples of 1–3 mg were weighed using a millionth of a gram precision balance and wrapped in tin foil before determining their C and N content. GRSP-C (N) was calculated as follows:
GRSP-C(N) = C(N) × GRSP × 100%
where GRSP-C(N) stands for the C content of GRSP (mg g−1 Soil), C(N) represents the percentage of C in GRSP, GRSP is glomalin-related soil proteins content (mg g−1 Soil).
Fluorescence spectra were recorded employing Hitachi F-7000 fluorescence spectrometer (Hitachi, Tokyo, Japan) with a 700 V xenon lamp [14]. Specifically, the 1.00 mg solid GRSP samples were placed in centrifuge tubes, then 1 mL sodium hydroxide (NaOH) solution (0.1 M) and 4 mL dH2O were added, and the precipitate was completely dissolved by shaking. Excitation–emission matrices (EEMs) were obtained across an emission wavelength range from 250 to 550 nm and an excitation wavelength range from 200 to 500 nm. The excitation–emission slit was maintained at a fixed 2 mm and 5 mm step, respectively, with a scan speed of 2400 nm min−1.
The EEM data of the samples were analyzed using parallel factor (PARAFAC) model with the dreem6.4 and N-Way toolbox. The “smootheem” function was used to subtract the effects of Raman and Rayleigh scattering to obtain the actual fluorescence intensity. The fluorescence data were compared with the data published in the online spectral library (the OpenFluor website, http://www.openfluor.org, accessed on 1 June 2024). The excitation and emission wavelengths of similar fluorescence peaks identified by the OpenFluor database had a significance level greater than 0.95. PARAFAC is a mathematical modeling method based on trilinear decomposition theory, implemented using alternating least squares [24]. It decomposes the EEMs dataset into a set of trilinear terms and a residual array. The calculation formula of the PARAFAC model is shown in Equation (2):
X i j k = n = 1 N a i n b j n c k n + ε i j k
where X i j k is the fluorescence intensity of the i-th sample at the excitation wavelength k and emission wavelength j; a i n is the proportional concentration of the n-th component in the i-th sample; b j n and c k n are model parameters linearly correlated with the fluorescence quantum efficiency of the n-th component at the emission wavelength j and excitation wavelength k, respectively; N is the number of columns in the loading matrix, representing the number of components needed to correctly fit the model; and ε i j k is the residual matrix.
Based on the EEM data, we also obtained some fluorescence indices: biological index (BIX) and humification index (HIX) (Equations (3) and (4)). The humification index (HIX) is the ratio of the integrated fluorescence intensity values at an excitation wavelength (λEx) of 254 nm for emission wavelengths (λEm) in the range of 435–480 nm to those in the range of 300–345 nm (Equation (3)) [25]. The biological index (BIX) is the ratio of the fluorescence intensity at an excitation wavelength (λEx) of 310 nm for emission wavelengths (λEm) at 380 nm and 430 nm (Equation (4)) [26]. Here, I represent the fluorescence intensity value at specific excitation/emission wavelengths.
H I X = 435 n m 480 n m I λ E m 300 n m 345 n m I λ E m ,   λ E m = 254   n m
B I X = I λ E m = 380 n m I λ E m = 430 n m ,   λ E m = 310   n m

2.5. Statistical Analysis

The data were examined for homogeneity and normality using the Kolmogorov–Smirnov test. Nonparametric test was used to test for differences in C and N content and structural compositions of GRSP among fertilization practices. The relationship between characterizations of GRSP and edaphic and microbial factors (pH, SOC, TN, AP, AMF) was evaluated using Pearson’s correlation coefficient. Spectra graphs were created using Matlab2020b software; heatmap and structural equation modeling were performed using the statistical software R v.4.3.0.

3. Results

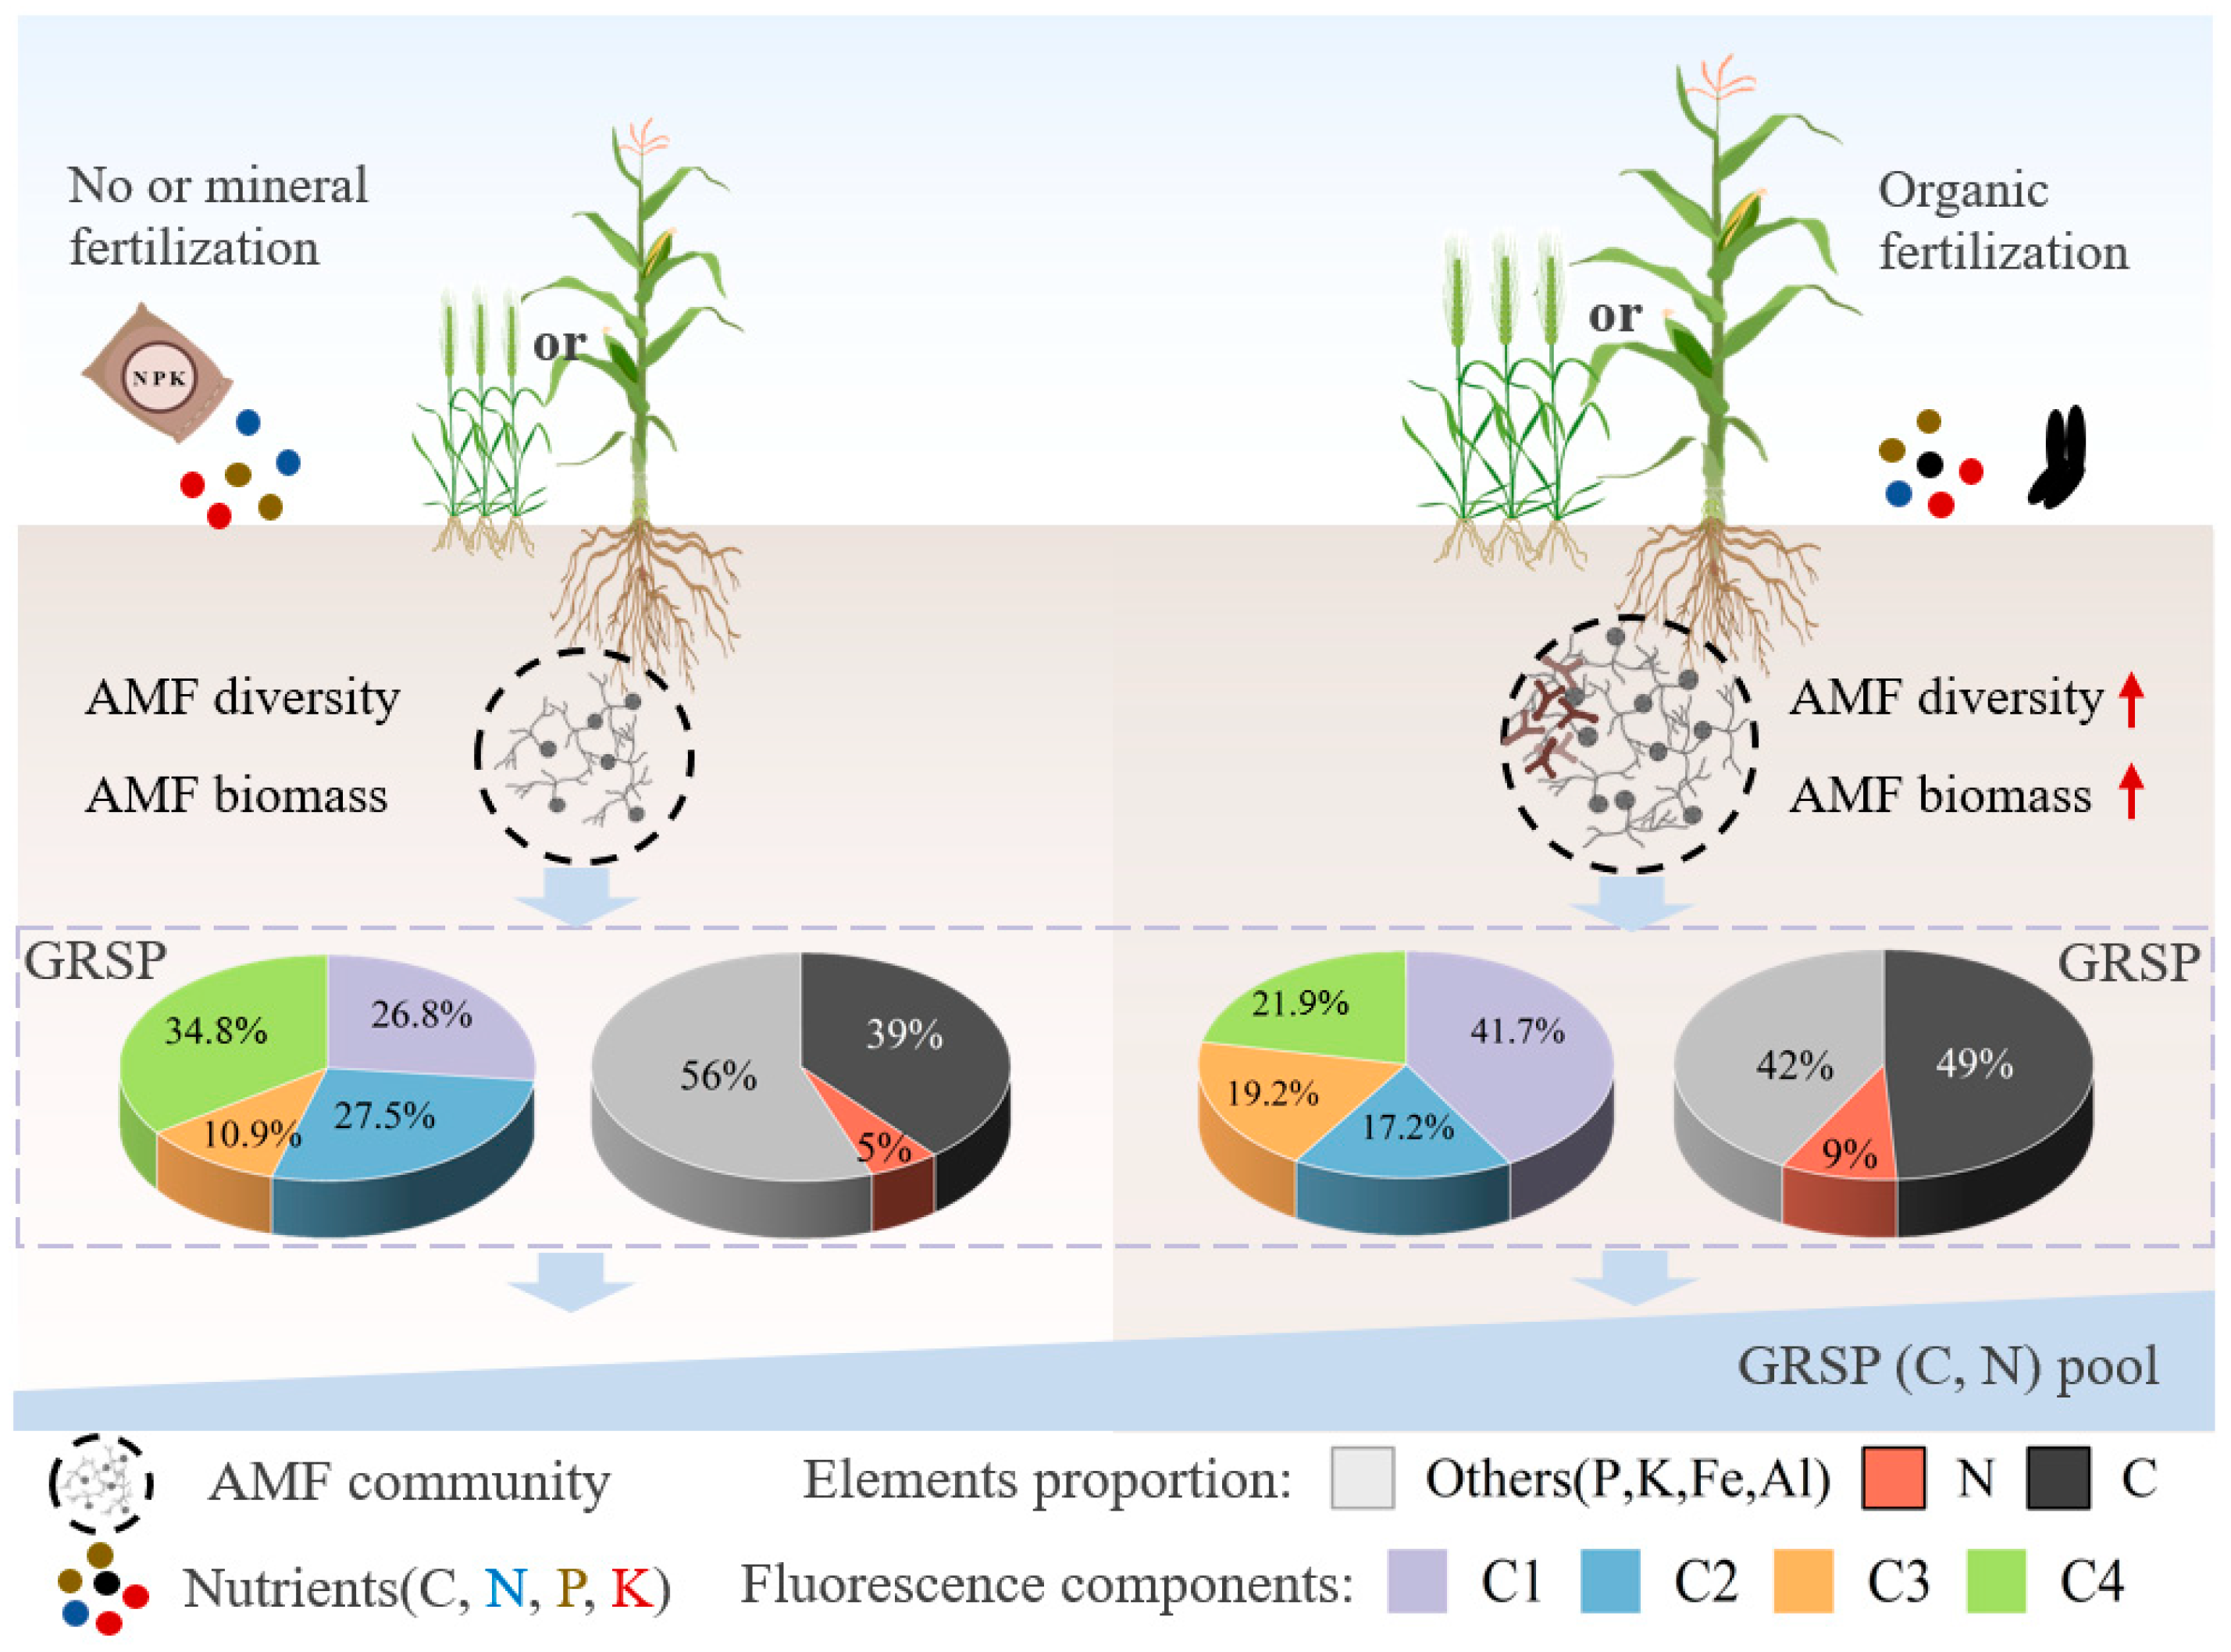
3.1. Differences between C and N Content and Proportion in GRSP under Fertilization Regimes

There were significant differences in the C and N proportion in GRSP under various fertilization regimes (p < 0.05, Figure 1). The percentage of C in GRSP was 31% higher under the M and NPKM treatments than that under the NPK treatment (Figure 1a). Similarly, the percentage of N in GRSP was 60% higher under M and NPKM treatments relative to CK and NPK treatments (Figure 1b). However, the C/N ratio in GRSP was lower under the M and NPKM treatments than in the CK and NPK treatments (Figure 1c).
The contents of C and N in GRSP also varied significantly under fertilization treatments (p < 0.05, Figure 1d,e). The GRSP-N content was substantially higher under the M and NPKM treatments (0.29–0.35 mg g−1) compared to the CK and NPK treatments (0.12–0.16 mg g−1), with GRSP-N being higher under M than under NPKM. In addition, GRSP-C significantly increased with fertilization (NPK, M, NPKM) treatments compared to CK treatment. GRSP-C content under M and NPKM was also higher than under NPK.

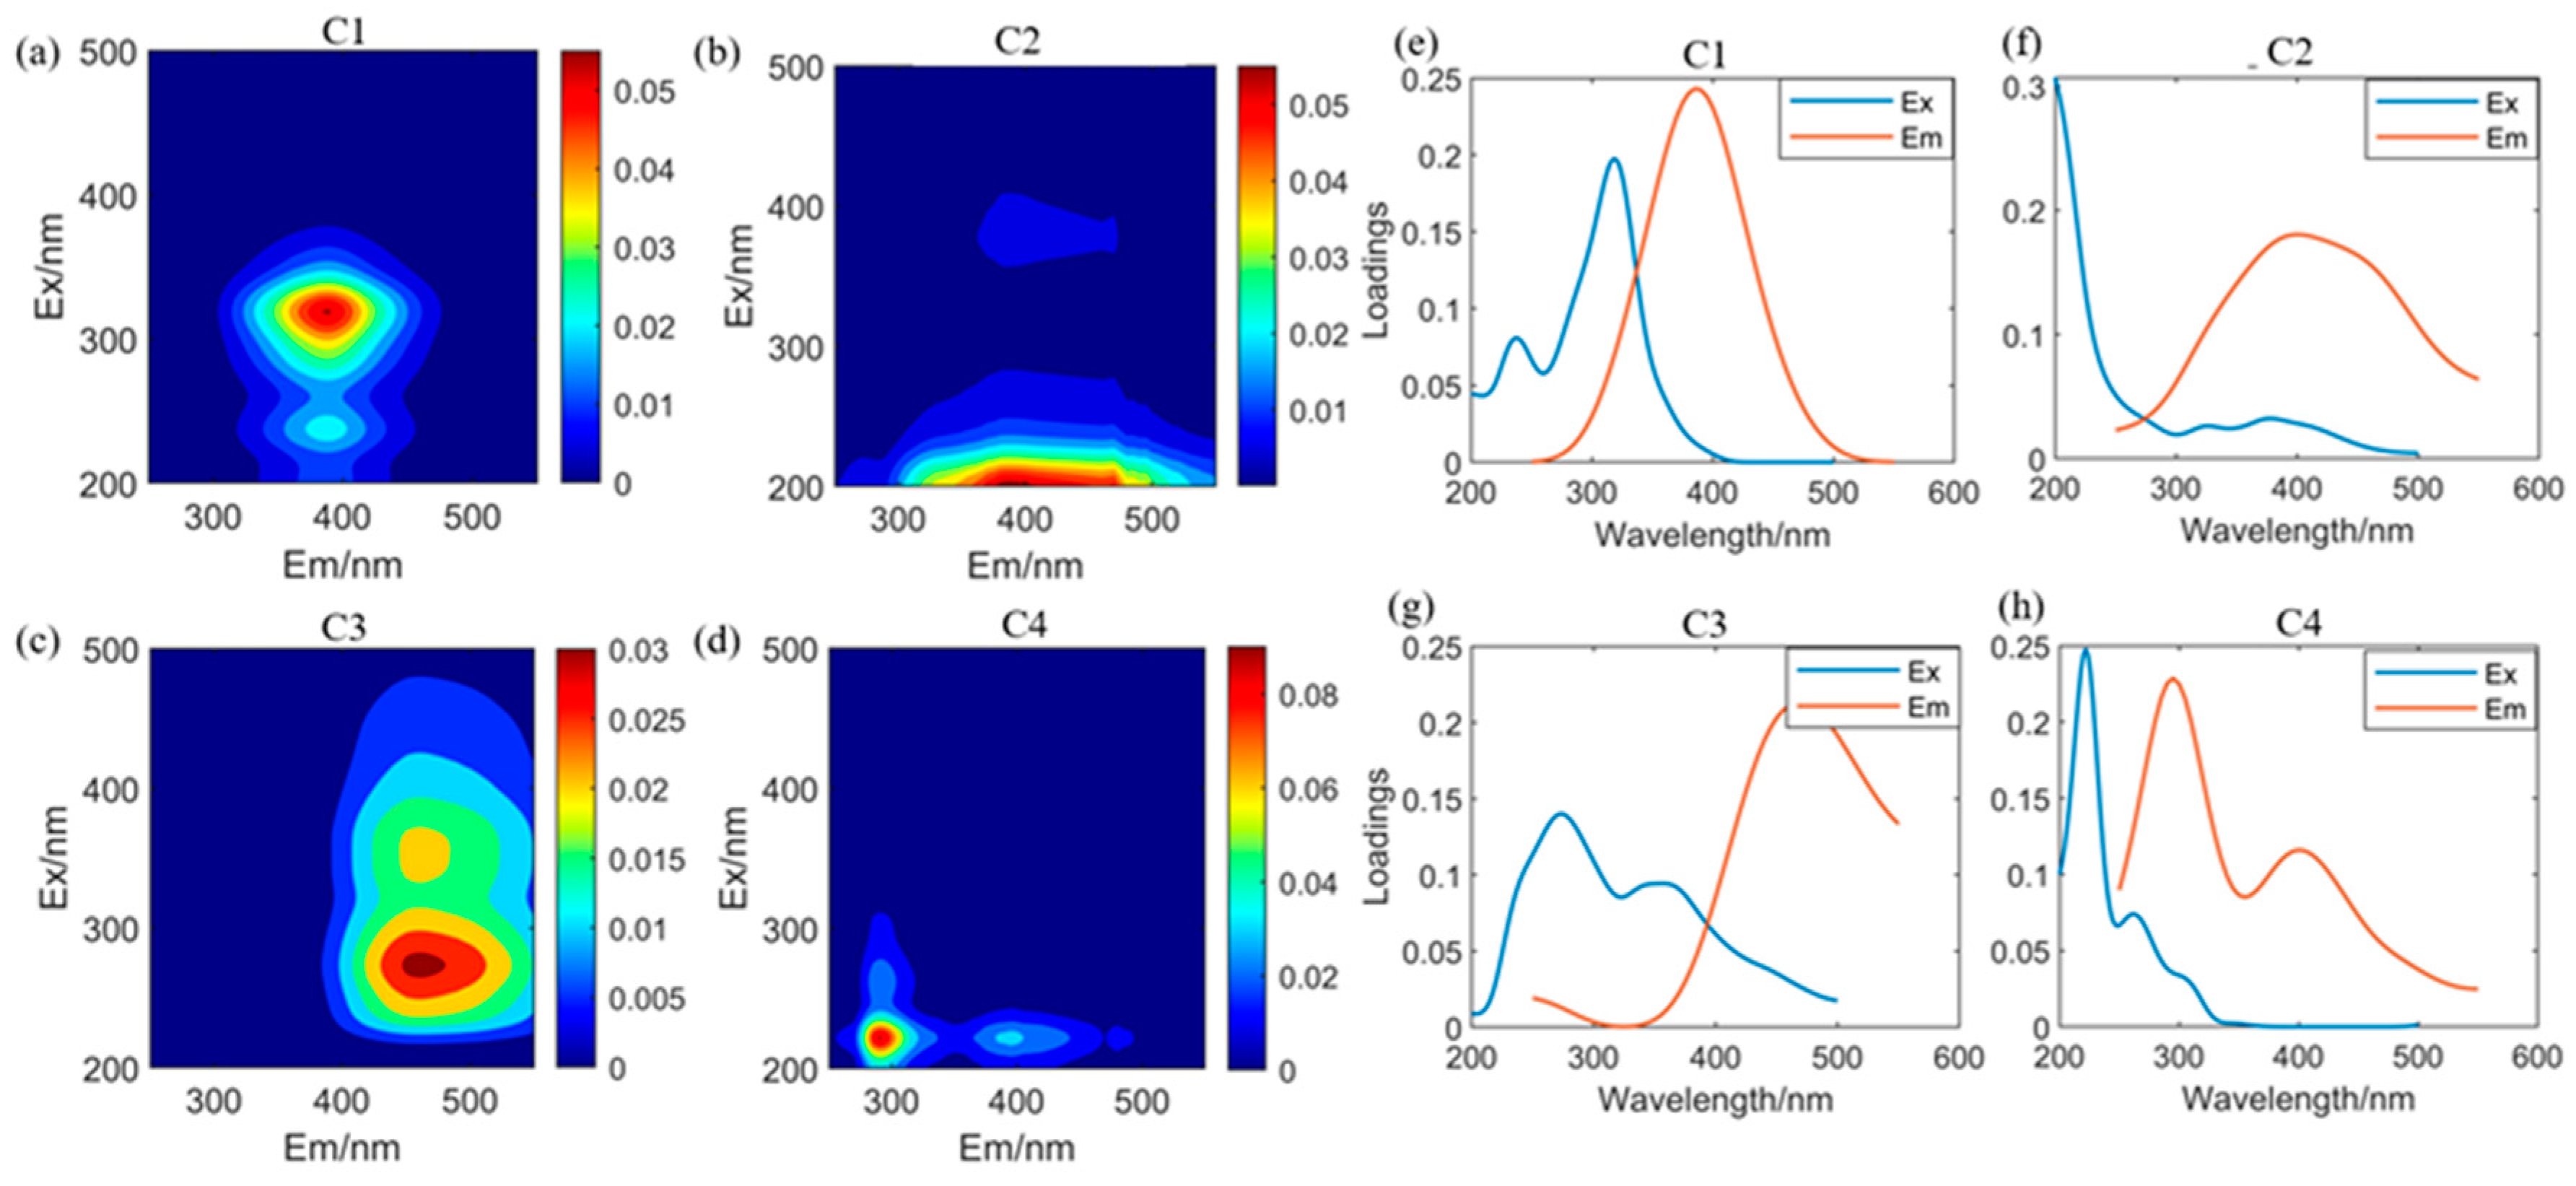
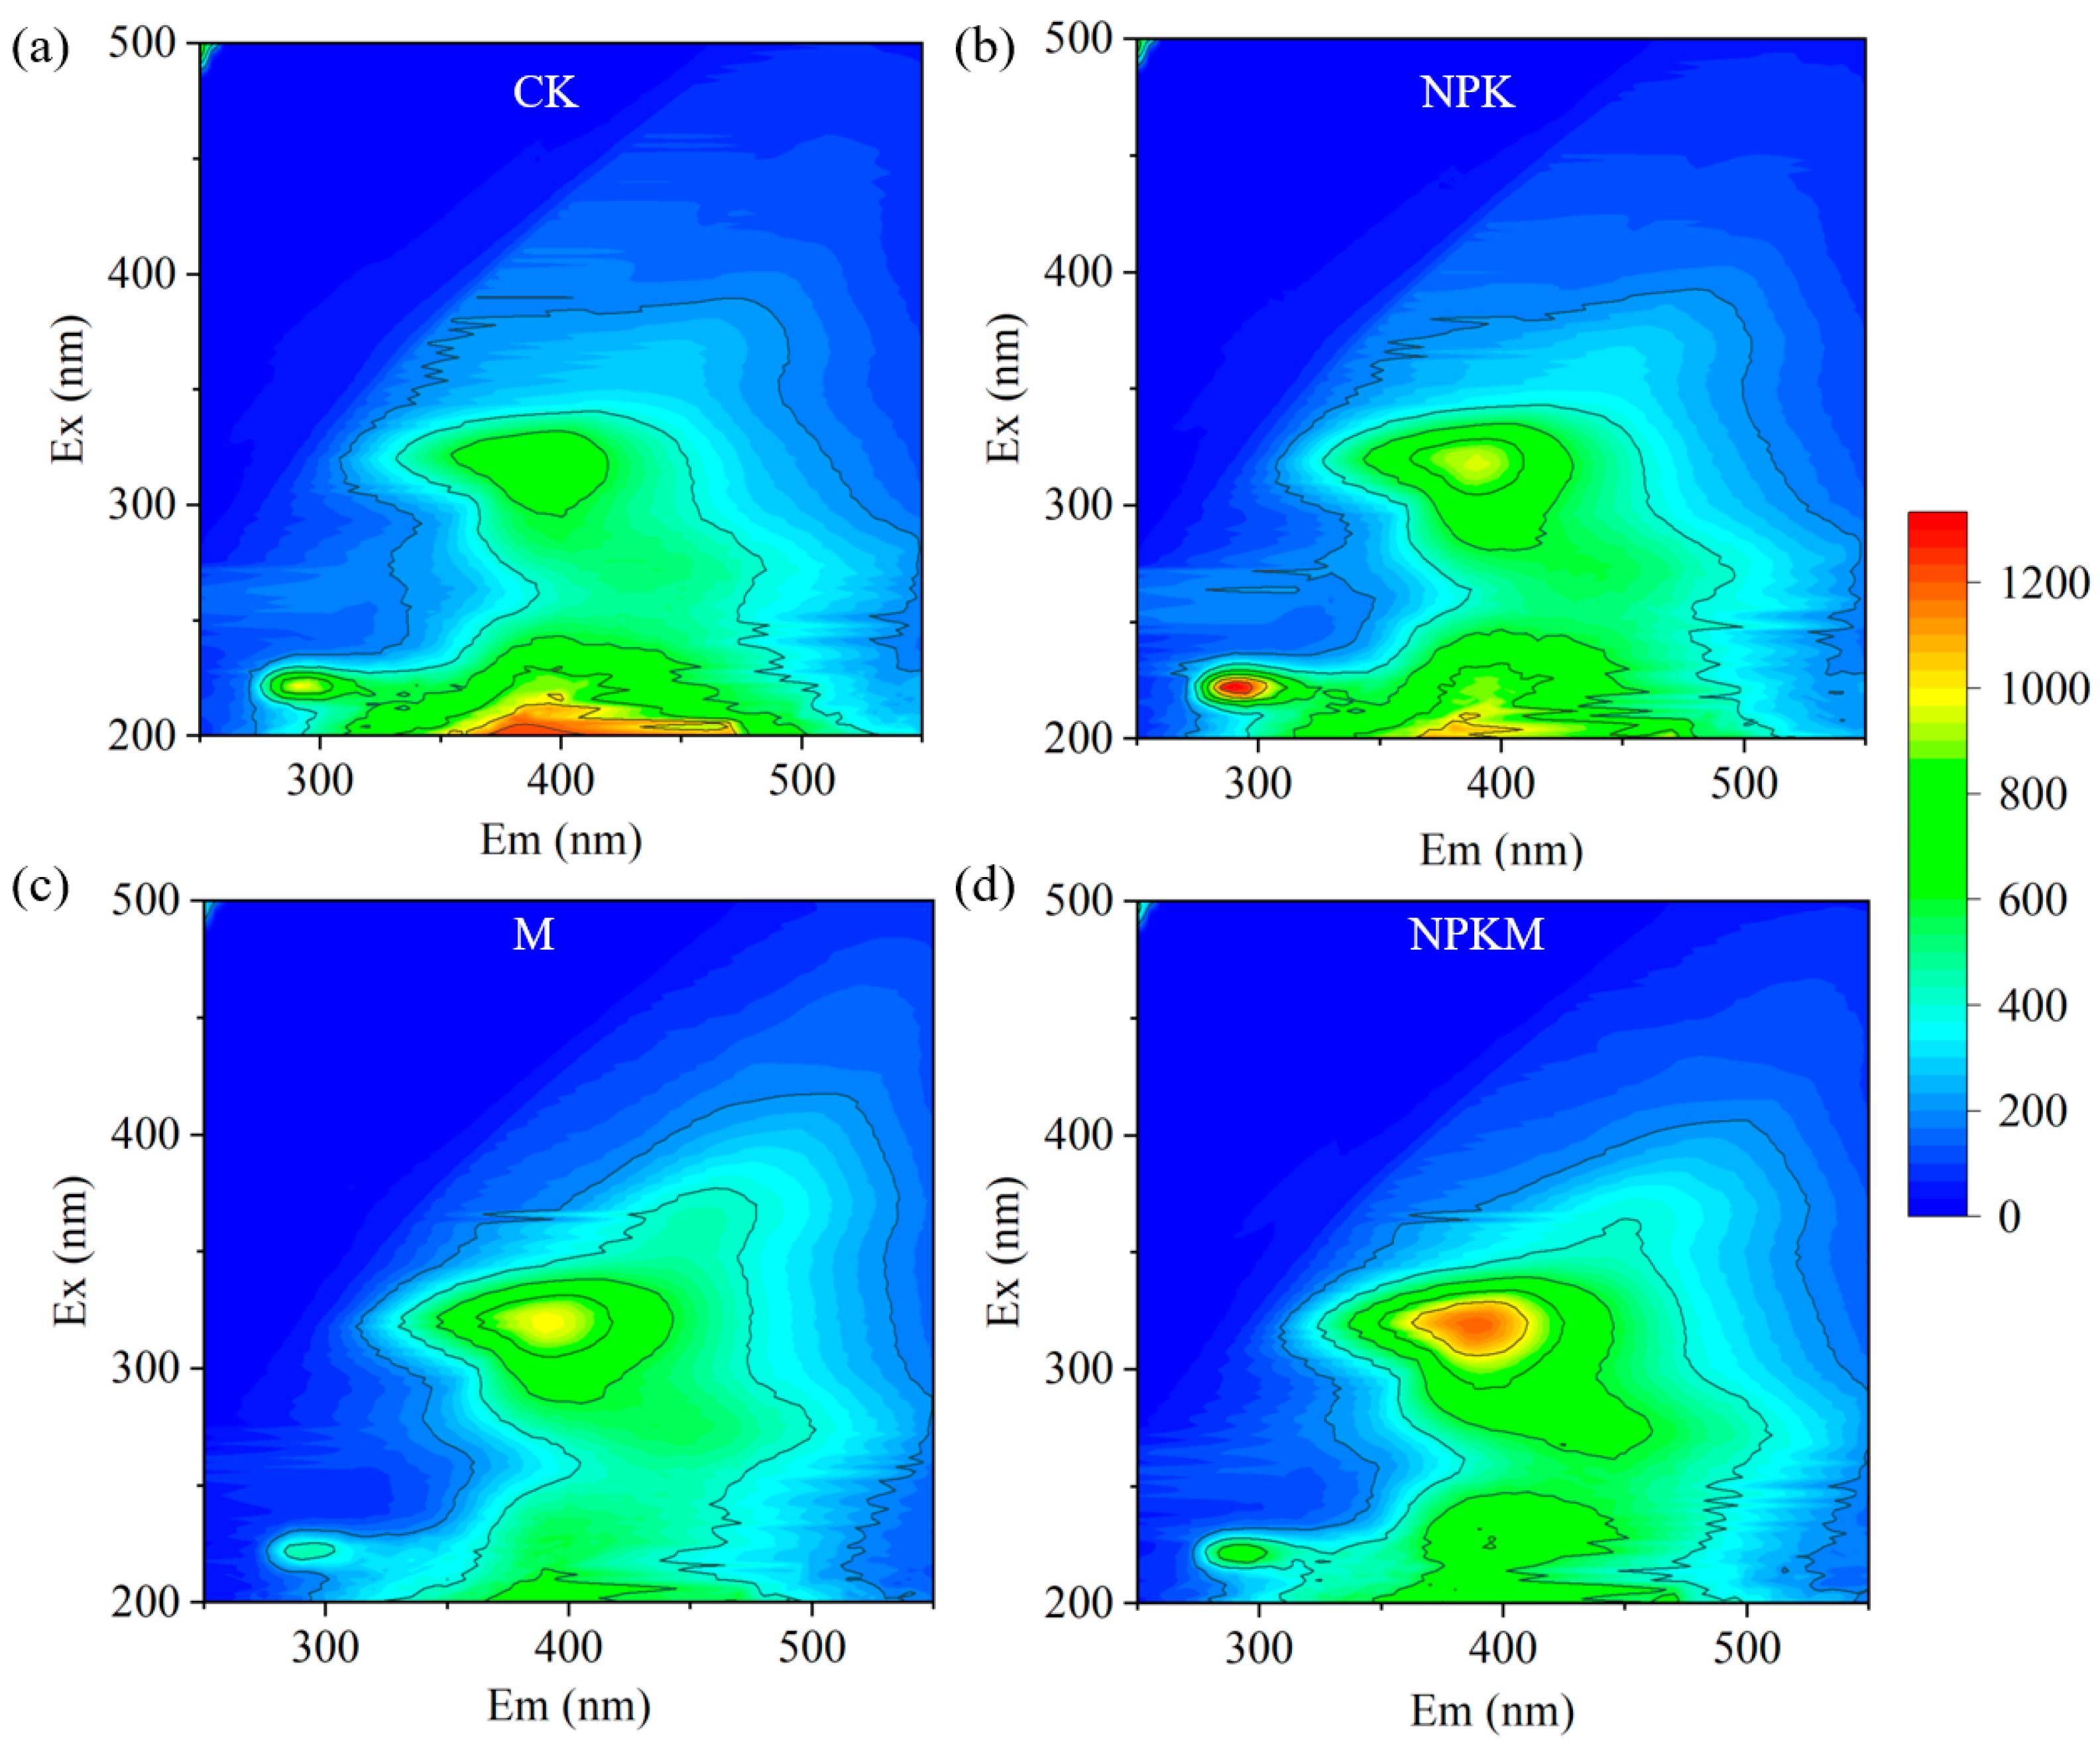
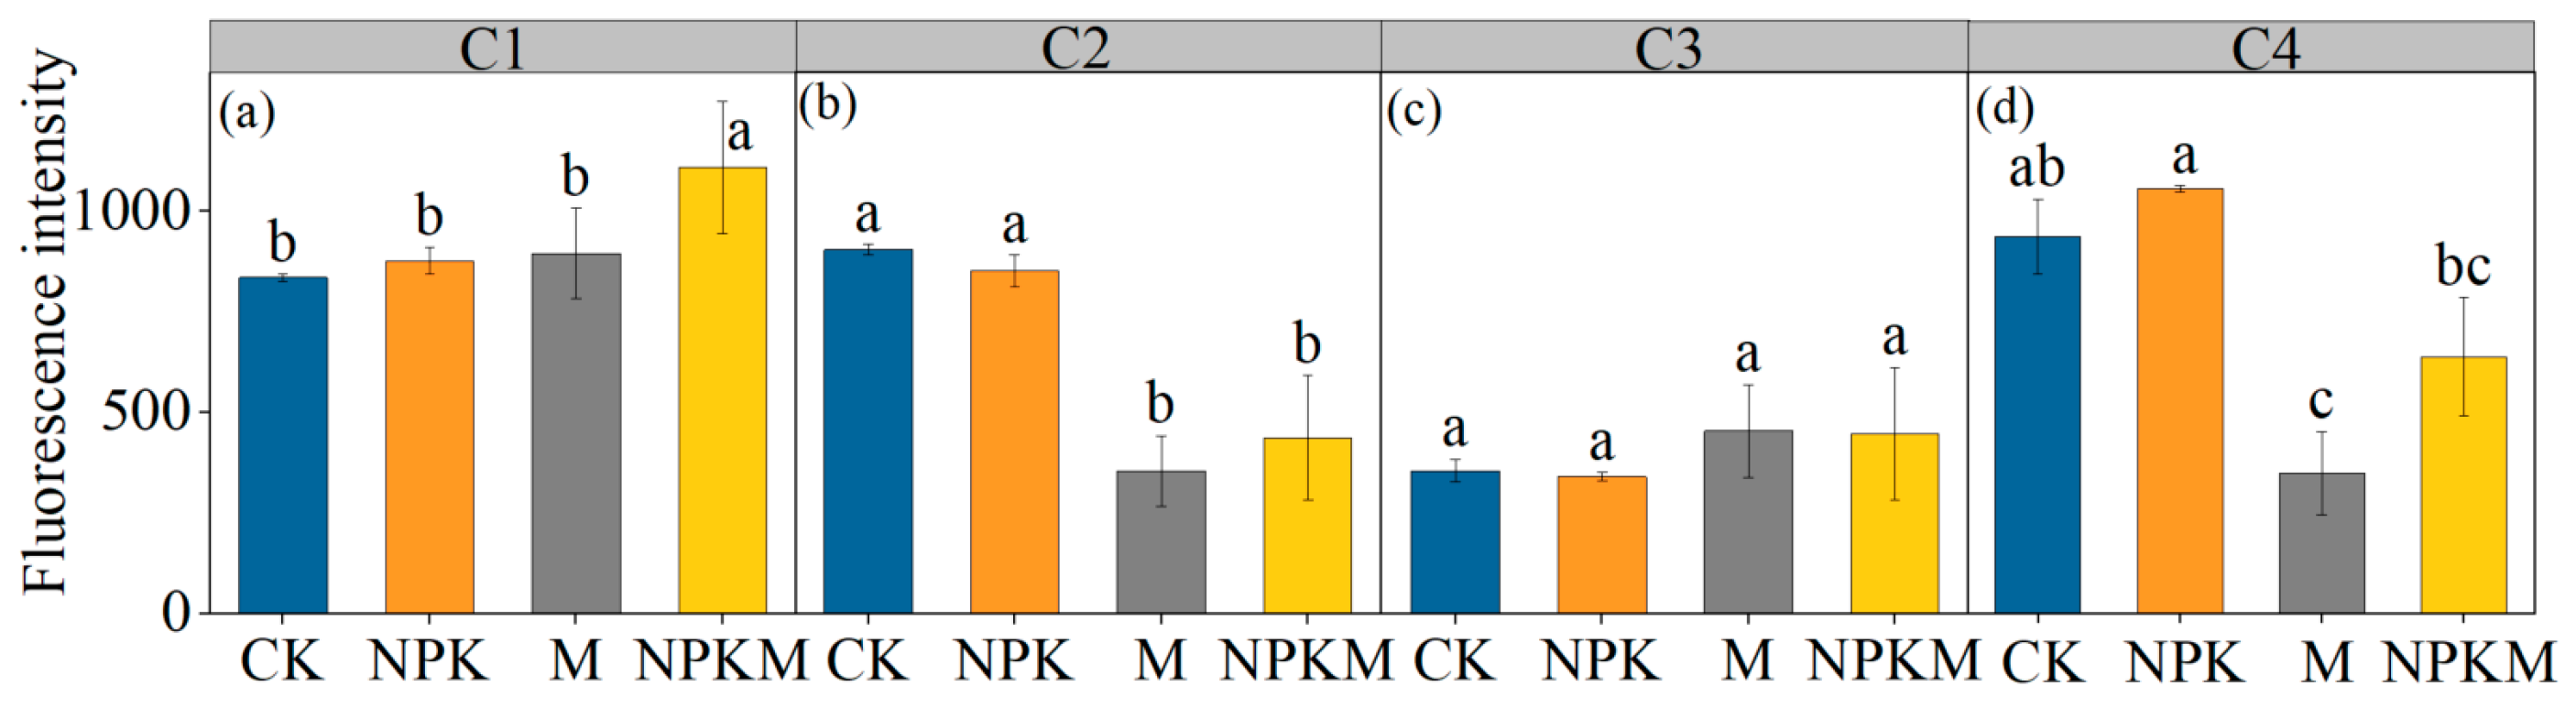
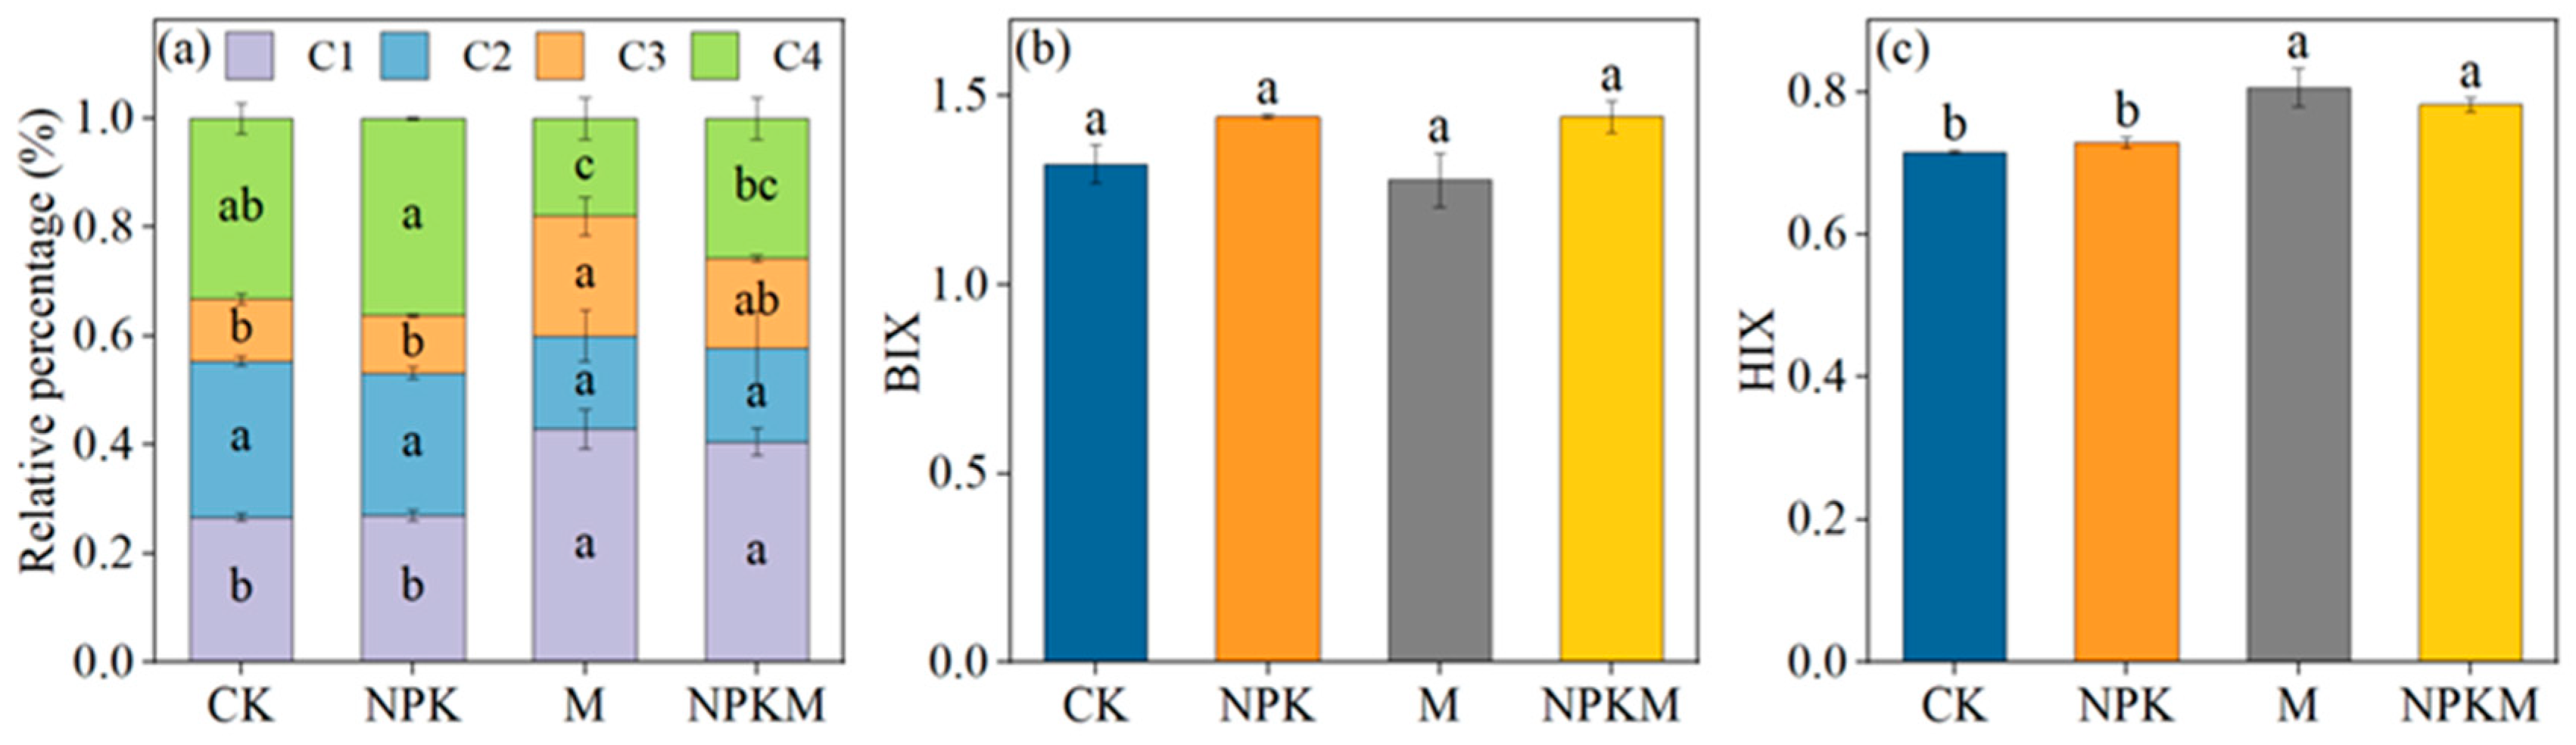
3.2. Fluorescence Characteristics Analysis of GRSP

The fluorescence characteristics of GRSP were preliminarily identified using excitation–emission matrix fluorescence spectroscopy (EEM). Based on the parallel factor (PARAFAC) model, four fluorescent components of GRSP were identified, including one fulvic acid-like component, one tyrosine-like component, and two humic acid-like components (Table 2, Figure 2). These components showed significant differences across different fertilization regimes (Figure 3 and Figure 4). Three distinct peaks were observed across the fertilization regimes (Figure 3). The fluorescence intensity of the fulvic acid-like (C2) and tyrosine-like (C4) components significantly reduced by 50% and 55%, respectively, under M and NPKM treatments compared to CK and NPK, while the intensity of the humic acid-like component (C1) increased by 17%. There was no significant difference in the humic acid-like component (C3) among the fertilization regimes (Figure 4a–d).
The relative percentage of fluorescence components had a strong difference among the fertilization regimes (p < 0.05, Figure 5a). The relative percentage of the humic acid-like components (C1, C3) was higher under M and NPKM than under CK and NPK treatments, while the tyrosine-like component (C4) was significantly reduced. The relative percentage of the fulvic acid-like component (C2) did not change significantly under different fertilization conditions. Moreover, the humification index (HIX) ranged from 0.72 to 0.81 (Figure 5c). Compared with CK and NPK, M and NPKM significantly increased the GRSP humification index (HIX) by 10%, but there was no effect on the biological index (BIX) between fertilization treatments (Figure 5b).

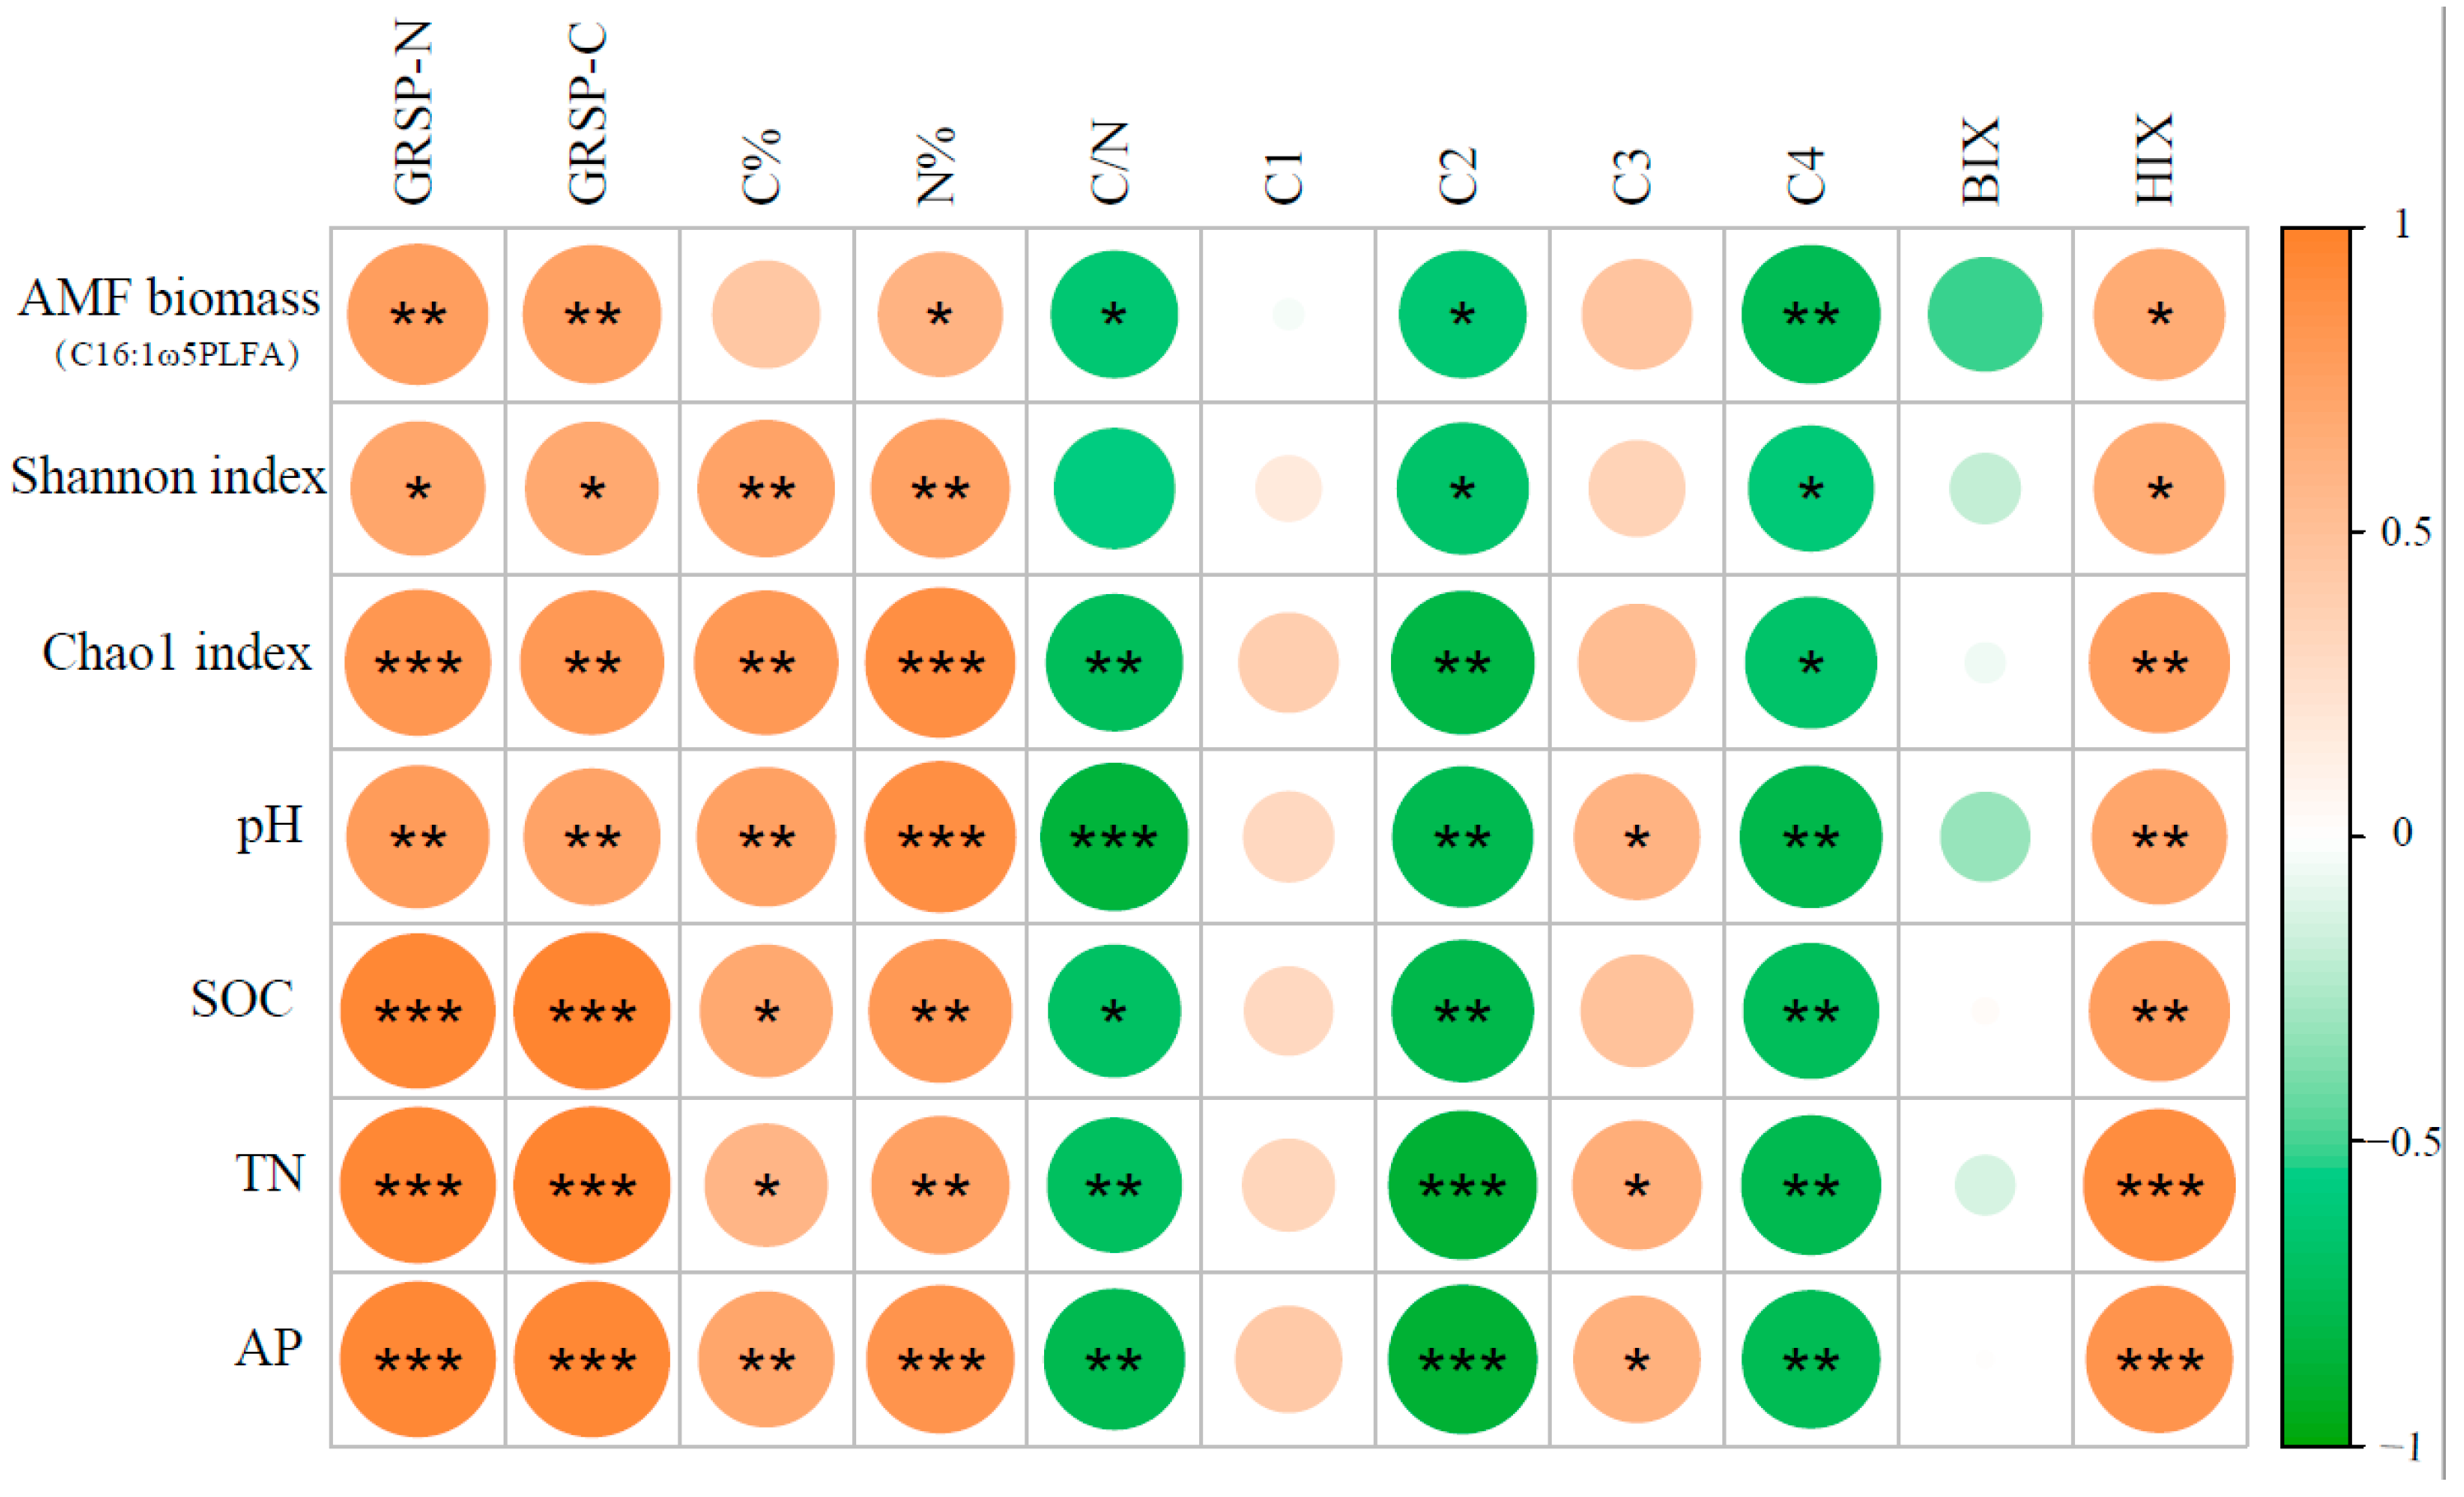
3.3. The Relationship between Structural Characterizations of GRSP and the Properties of Edaphic and AMF

The heatmap results indicated that soil pH, SOC, TN, AP, AMF biomass, and diversity (Shannon and Chao1 index) were positively correlated with the content of GRSP-N and GRSP-C, as well as their N proportion. Additionally, the proportion of GRSP-C also showed a positive correlation with these properties, except for AMF biomass. Furthermore, the C/N ratio in GRSP was significantly negatively correlated with AMF biomass, pH, SOC, TN, and AP. The C2 and C4 components of GRSP showed significant negative correlations with pH, SOC, TN, AP, AMF biomass, and diversity (Shannon and Chao1 indices). The C3 component showed a significant positive correlation only with pH, TN, and AP. The humification index (HIX) had significant positive correlations with pH, SOC, TN, AP, AMF biomass, and diversity (Shannon and Chao1 indices), while there was no correlation in terms of the biological index (BIX) (Figure 6).
Partial least squares path modeling exhibited that fertilization significantly influenced edaphic properties (i.e., pH, SOC, TN, AP) in a positive direction (pc (path coefficients) = 0.89, p < 0.001). Subsequently, these edaphic properties had a significant positive effect on AMF biomass (pc = 0.68, p < 0.05) and diversity (pc = 0.80, p < 0.01). In turn, AMF diversity showed a positive correlation with GRSP elements (C and N) (pc = 0.66, p < 0.01), whereas AMF biomass did not directly affect GRSP element contents (Figure 7a). However, both AMF biomass and diversity were negatively correlated with the intensity of fulvic acid-like (C2) and tyrosine-like (C4) components of GRSP (Figure 7b).

4. Discussion

This study clarified the differences in the elemental contents and fluorescent components of GRSP under different long-term fertilization regimes (Figure 8). The results revealed that the application of organic fertilizers shifted the elemental contents and fluorescent components of GRSP by increasing the biomass and diversity of AMF.

4.1. Effects of Fertilization Regimes on C and N Contents in GRSP

In this study, fertilization strongly altered GRSP-C contents, with significant differences between fertilization regimes (Figure 1d). Compared with no fertilization, chemical and organic fertilization increased GRSP-C by 42% and 123%, respectively (Figure 1d,e). Notably, the percentage of C and N in GRSP significantly increased with the application of organic fertilizer, while chemical fertilization had no significant effect (Figure 1a,b), supporting the first hypothesis. These findings indicated that fertilization, especially organic fertilization, can enhance the stability of soil C pools. The substantial increase in GRSP-C could be attributed to enhanced soil nutrients under fertilization [13], which allowed AMF to help plants absorb more nutrients in exchange for plant-derived C [27]. This mutualistic relationship promoted AMF growth and metabolism, thereby increasing GRSP production. Additionally, organic fertilization can improve soil organic matter and microbial activity, creating a more conducive environment for AMF colonization and activity [13]. This, in turn, allows AMF to acquire more resources to produce GRSP with higher proportions of C and N. However, chemical fertilization tended to lead to lower soil pH, reducing AMF colonization and diversity [28], thereby affecting the chemical composition of GRSP [15]. Interestingly, we also found that the C/N ratio (5.6–5.8) decreased under organic fertilization relative to no fertilization or chemical fertilization (6.7–7.1), indicating a more balanced integration of these elements in the GRSP structure. This shift could reflect enhanced N cycling and availability in soils receiving organic inputs, fostering more efficient assimilation into microbial biomass. Additionally, increased microbial activity, often stimulated by organic fertilization, may preferentially decompose carbon-rich components [29], leading to a decrease in the C/N ratio.
The compositional traits of GRSP may be influenced by many environmental factors, like soil properties, crop types, and microbes [30,31]. We found that GRSP-C, GRSP-N, and the proportions of C and N in GRSP were significantly positively correlated with soil factors (SOC, TN, AP, pH) and AMF diversity (Figure 6). Organic fertilization increased TN and AP through the decomposition of organic matter, facilitating better AMF symbiosis with host plants [32]. This improved nutrient exchange, leading to increased GRSP production. Moreover, organic fertilization typically maintained or increased soil pH at this experimental site. Soil pH is a critical factor affecting T-GRSP composition [14]. Thus, improving nutrient (C, N, P) availability and maintaining a favorable pH range can support AMF growth and their ability to produce C- and N-rich GRSP. Structural equation modeling in our study further revealed that improved soil conditions after fertilization directly influenced AMF diversity, which in turn enhanced the contents and proportions of C and N in GRSP (Figure 7a).

4.2. Effects of Fertilization Regimes on Fluorescence Components in GRSP

This study characterized the fluorescent components of GRSP using three-dimensional fluorescence spectroscopy. We identified four fluorescent components of GRSP (Figure 2), differing from previous studies that reported up to seven components [14]. This discrepancy may be due to the lower biomass and diversity of AMF in cropland soils compared to forest and grassland soils [33,34]. In cropland soils, we found that the application of organic fertilizers significantly reduced the fluorescence intensity of the fulvic acid-like component (C2) and the tyrosine-like component (C4) while increasing the fluorescence intensity of the humic acid-like components (C1, C3) (Figure 4). Additionally, there was a decrease in the relative percentage of the tyrosine-like component (C4) and an increase in the proportion of the humic acid-like component (C1) (Figure 5a). These may be attributed to the strong binding of GRSP with soil organic matter fractions, such as humic acids, which are co-extracted during acid precipitation and alkaline dissolution, thus interfering with GRSP fluorescence intensity [4]. This binding is likely regulated by functional groups such as hydroxyl, carboxyl, amide, and carbonyl in GRSP, which provide binding sites [35,36]. C4 is a low-molecular-weight phenolic compound; a reduction in its component might lead to decreased enzyme activities, reducing organic matter decomposition and nutrient mineralization [37]. Furthermore, the application of organic fertilization increased the humification index (HIX) of GRSP (Figure 5c), which was positively correlated with AMF and soil properties (Figure 6). This indicated that organic fertilization enhanced GRSP stability by increasing AMF biomass and diversity. This finding complemented our previous research on the mechanisms by which organic fertilization promotes GRSP accumulation [13].
Both biotic and abiotic factors appear to influence the fluorescent components of GRSP [38]. We found that the fluorescence components of fulvic acid-like (C2) and tyrosine-like (C4) were significantly negatively correlated with pH, SOC, TN, AP, and AMF biomass and diversity (Figure 6). These findings are consistent with Wang et al. (2015) [38]. Soil pH and nutrients are the key factors leading to the difference in GRSP composition, especially in regard to P, because AMF are highly sensitive to soil P levels [39]. Within a certain range of P, AMF biomass and diversity increase with the increase in P levels [40], while excessive P levels can exacerbate internal competition among AMF species due to nutrient imbalances. This competition may reduce the production of GRSP and its proportion of C2 and C4 fluorescence components. Further study on the relationship between species and components is needed. Structural equation modeling also indicated that fertilization-induced increases in AMF biomass and diversity reduced the fluorescence intensity of the C2 and C4 components (Figure 7b).

4.3. Implications and Perspective

The observed changes in GRSP composition under different fertilization regimes have significant implications for soil quality and soil C sequestration in agricultural systems. The increased C and N content in GRSP under organic fertilization suggests a potential for greater SOC storage and improved nutrient cycling. The alterations in GRSP fluorescence components and increased humification indicate a shift towards more recalcitrant organic forms, which are likely to persist longer in the soil. This transformation could enhance the stability of SOC, contributing to climate change mitigation efforts. However, the negative associations of certain fluorescent components (C2 and C4) with SOC and nutrients warrant further investigation to understand the underlying mechanisms and their implications for soil quality and the development of sustainable agroecosystems.
Future research should explore the long-term impacts of various fertilization strategies on GRSP compositional traits across different soil types and climatic zones. Understanding the interactions between climate, fertilization practices, microbial communities, and GRSP formation will be crucial for developing site-specific fertilization practices that enhance soil fertility and C sequestration. C sequestration adoption practices are often related to trade-offs, including crop yield. The incorporation of crop yield is more conducive to our understanding of the function of GRSP. Additionally, advancing techniques can be applied to precisely characterize GRSP composition, providing deeper insights into its role in soil ecosystems. Moreover, GRSP contains 0.8–9.9% Fe and 0.3–0.7% Ca, respectively [4,21,41]. GRSP-bound Fe and Ca, forming a GRSP-Fe (Ca)-OC ternary complex, may play an important role in SOC accumulation and stabilization. Therefore, studying the above contents will help us to comprehensively understand the carbon sequestration mechanisms of GRSP in agroecosystems.

5. Conclusions

In this study, GRSP contained 37–49% C and 6–9% N; meanwhile, it was composed of four components (i.e., one fulvic acid-like component (C2), one tyrosine-like component (C4), and two humic acid-like components (C1, C3)). Long-term manuring significantly increased the contents and proportions of C and N, as well as the percentage and fluorescence intensity of humic acid-like components (C1) in GRSP while reducing tyrosine-like components (C4). Manuring also increased HIX, enhancing the stability of GRSP. Additionally, the C and N contents and proportion of GRSP positively correlated with SOC, TN, AP, and the diversity and/or biomass of AMF, but fulvic acid-like (C2) and tyrosine-like components (C4) were negatively correlated with these factors. On the whole, manuring enhanced soil nutrients (SOC, TN, AP) and pH promotes the diversity and/or biomass of AMF, thereby altering the compositional characteristics and enhancing the stability of GRSP. This study contributes to the understanding of the C sequestration function of GRSP and provides a crucial foundation for soil management practices aimed at sustainable agricultural development.

Supplementary Materials

The following supporting information can be downloaded at: https://www.mdpi.com/article/10.3390/agriculture14091510/s1, Figure S1: The sampling method from each plot. Table S1: Soil properties and arbuscular mycorrhizal fungi (AMF) parameters subjected to 29-year various fertilization (CK, no fertilizer; NPK, mineral nitrogen, phosphorus, potassium fertilizer; M, pig manure; NPKM, NPK plus pig manure). Table S2: The BSA standard curve and protein concentration determination.

Author Contributions

Conceptualization, W.Z.; methodology, H.Y. and Z.C.; software, H.Y.; validation, H.Y.; formal analysis, H.Y.; investigation, H.Y.; resources, Z.C.; data curation, H.Y.; writing—original draft preparation, H.Y.; writing—review and editing, G.C. and J.M.; visualization, H.Y.; supervision, C.D.C., G.C. and J.M.; project administration, W.Z.; funding acquisition, W.Z. All authors have read and agreed to the published version of the manuscript.

Funding

This research was funded by the National Key R&D Program of China (No. 2021YFD1901201).

Data Availability Statement

The datasets analyzed during this study are available from the corresponding author upon reasonable request.

Acknowledgments

We appreciate the CAAS-Gembloux Agro-Bio Tech joint training program, the Innovation Program of the Chinese Academy of Agricultural Sciences, and the China Scholarship Council for their support.

Conflicts of Interest

The authors declare no conflicts of interest.

References

  1. Wright, S.F.; Upadhyaya, A. Extraction of an Abundant and Unusual Protein from Soil and Comparison with Hyphal Protein of Arbuscular Mycorrhizal Fungi. Soil Sci. 1996, 161, 575–586. [Google Scholar] [CrossRef]
  2. Gillespie, A.W.; Farrell, R.E.; Walley, F.L.; Ross, A.R.S.; Leinweber, P.; Eckhardt, K.-U.; Regier, T.Z.; Blyth, R.I.R. Glomalin-Related Soil Protein Contains Non-Mycorrhizal-Related Heat-Stable Proteins, Lipids and Humic Materials. Soil Biol. Biochem. 2011, 43, 766–777. [Google Scholar] [CrossRef]
  3. Zhang, J.; Tang, X.; Zhong, S.; Yin, G.; Gao, Y.; He, X. Recalcitrant Carbon Components in Glomalin-Related Soil Protein Facilitate Soil Organic Carbon Preservation in Tropical Forests. Sci. Rep. 2017, 7, 2391. [Google Scholar] [CrossRef] [PubMed]
  4. Agnihotri, R.; Sharma, M.P.; Prakash, A.; Ramesh, A.; Bhattacharjya, S.; Patra, A.K.; Manna, M.C.; Kurganova, I.; Kuzyakov, Y. Glycoproteins of Arbuscular Mycorrhiza for Soil Carbon Sequestration: Review of Mechanisms and Controls. Sci. Total Environ. 2022, 806, 150571. [Google Scholar] [CrossRef] [PubMed]
  5. Lovelock, C.E.; Wright, S.F.; Clark, D.A.; Ruess, R.W. Soil Stocks of Glomalin Produced by Arbuscular Mycorrhizal Fungi across a Tropical Rain Forest Landscape. J. Ecol. 2004, 92, 278–287. [Google Scholar] [CrossRef]
  6. Singh, A.K.; Zhu, X.; Chen, C.; Wu, J.; Yang, B.; Zakari, S.; Jiang, X.J.; Singh, N.; Liu, W. The Role of Glomalin in Mitigation of Multiple Soil Degradation Problems. Crit. Rev. Environ. Sci. Technol. 2022, 52, 1604–1638. [Google Scholar] [CrossRef]
  7. Guo, Z.; Liu, J.; Wu, J.; Yang, D.; Mei, K.; Li, H.; Lu, H.; Yan, C. Spatial Heterogeneity in Chemical Composition and Stability of Glomalin-Related Soil Protein in the Coastal Wetlands. Sci. Total Environ. 2022, 835, 155351. [Google Scholar] [CrossRef] [PubMed]
  8. Guo, Z.; Liu, J.; Zeng, H.; Xiao, X.; Liu, M.; Hong, H.; Lu, H.; Yan, C. Variation of Glomalin-Metal Binding Capacity in 1 m Soil Profiles from Mangrove Forests to Mudflat and Affected Factor Analysis. Sci. Total Environ. 2023, 863, 160890. [Google Scholar] [CrossRef] [PubMed]
  9. Holátko, J.; Brtnický, M.; Kučerík, J.; Kotianová, M.; Elbl, J.; Kintl, A.; Kynický, J.; Benada, O.; Datta, R.; Jansa, J. Glomalin–Truths, Myths, and the Future of This Elusive Soil Glycoprotein. Soil Biol. Biochem. 2021, 153, 108116. [Google Scholar] [CrossRef]
  10. Lin, H.; Xia, X.; Bi, S.; Jiang, X.; Wang, H.; Zhai, Y.; Wen, W. Quantifying Bioavailability of Pyrene Associated with Dissolved Organic Matter of Various Molecular Weights to Daphnia Magna. Environ. Sci. Technol. 2018, 52, 644–653. [Google Scholar] [CrossRef]
  11. Wang, Q.; Li, J.; Chen, J.; Hong, H.; Lu, H.; Liu, J.; Dong, Y.; Yan, C. Glomalin-Related Soil Protein Deposition and Carbon Sequestration in the Old Yellow River Delta. Sci. Total Environ. 2018, 625, 619–626. [Google Scholar] [CrossRef] [PubMed]
  12. Sui, X.; Wu, Z.; Lin, C.; Zhou, S. Terrestrially Derived Glomalin-Related Soil Protein Quality as a Potential Ecological Indicator in a Peri-Urban Watershed. Environ. Monit. Assess. 2017, 189, 315. [Google Scholar] [CrossRef] [PubMed]
  13. Yang, H.; Xiao, Q.; Huang, Y.; Cai, Z.; Li, D.; Wu, L.; Meersmans, J.; Colinet, G.; Zhang, W. Long-Term Manuring Facilitates Glomalin-Related Soil Proteins Accumulation by Chemical Composition Shifts and Macro-Aggregation Formation. Soil Tillage Res. 2024, 235, 105904. [Google Scholar] [CrossRef]
  14. Wang, Q.; Wu, Y.; Wang, W.; Zhong, Z.; Pei, Z.; Ren, J.; Wang, H.; Zu, Y. Spatial Variations in Concentration, Compositions of Glomalin Related Soil Protein in Poplar Plantations in Northeastern China, and Possible Relations with Soil Physicochemical Properties. Sci. World J. 2014, 2014, 160403. [Google Scholar] [CrossRef] [PubMed]
  15. Zhong, Z.; Wang, W.; Wang, Q.; Wu, Y.; Wang, H.; Pei, Z. Glomalin Amount and Compositional Variation, and Their Associations with Soil Properties in Farmland, Northeastern China. J. Plant Nutr. Soil Sci. 2017, 180, 563–575. [Google Scholar] [CrossRef]
  16. Wang, J.G.; Lu, J.F. Analyses on the Changes of Soil Fertility of North China Plain and the Affecting Factors. J. Eco. Rural Environ. 1998, 14, 12–16. (In Chinese) [Google Scholar]
  17. Tao, L.; Li, F.; Liu, C.; Feng, X.; Gu, L.; Wang, B.; Wen, S.; Xu, M. Mitigation of Soil Acidification through Changes in Soil Mineralogy Due to Long-Term Fertilization in Southern China. Catena 2019, 174, 227–234. [Google Scholar] [CrossRef]
  18. Zhang, W.; Xu, M.; Wang, B.; Wang, X. Soil Organic Carbon, Total Nitrogen and Grain Yields under Long-Term Fertilizations in the Upland Red Soil of Southern China. Nutr. Cycl. Agroecosystems 2009, 84, 59–69. [Google Scholar] [CrossRef]
  19. Hawkins, H.-J.; Cargill, R.I.M.; Van Nuland, M.E.; Hagen, S.C.; Field, K.J.; Sheldrake, M.; Soudzilovskaia, N.A.; Kiers, E.T. Mycorrhizal Mycelium as a Global Carbon Pool. Curr. Biol. 2023, 33, R560–R573. [Google Scholar] [CrossRef]
  20. Zhang, L.; Zhou, J.; George, T.S.; Limpens, E.; Feng, G. Arbuscular Mycorrhizal Fungi Conducting the Hyphosphere Bacterial Orchestra. Trends Plant Sci. 2022, 27, 402–411. [Google Scholar] [CrossRef]
  21. Khan, M.F.; Murphy, C.D. Application of microbial biofilms in biocatalysis and biodegradation. In Enzymes for Pollutant Degradation; Springer Nature: Singapore, 2022; pp. 93–118. [Google Scholar]
  22. Wang, G.; Ren, Y.; Bai, X.; Su, Y.; Han, J. Contributions of beneficial microorganisms in soil remediation and quality improvement of medicinal plants. Plants 2022, 11, 3200. [Google Scholar] [CrossRef]
  23. Wright, S.F.; Upadhyaya, A.; Buyer, J.S. Comparison of N-Linked Oligosaccharides of Glomalin from Arbuscular Mycorrhizal Fungi and Soils by Capillary Electrophoresis. Soil Biol. Biochem. 1998, 30, 1853–1857. [Google Scholar] [CrossRef]
  24. Gao, J.; Liang, C.; Shen, G.; Lv, J.; Wu, H. Spectral Characteristics of Dissolved Organic Matter in Various Agricultural Soils throughout China. Chemosphere 2017, 176, 108–116. [Google Scholar] [CrossRef]
  25. Zsolnay, A.; Baigar, E.; Jimenez, M.; Steinweg, B.; Saccomandi, F. Differentiating with Fluorescence Spectroscopy the Sources of Dissolved Organic Matter in Soils Subjected to Drying. Chemosphere 1999, 38, 45–50. [Google Scholar] [CrossRef] [PubMed]
  26. Huguet, A.; Vacher, L.; Relexans, S.; Saubusse, S.; Froidefond, J.-M.; Parlanti, E. Properties of Fluorescent Dissolved Organic Matter in the Gironde Estuary. Org. Geochem. 2009, 40, 706–719. [Google Scholar] [CrossRef]
  27. Williams, A.; Manoharan, L.; Rosenstock, N.P.; Olsson, P.A.; Hedlund, K. Long-term Agricultural Fertilization Alters Arbuscular Mycorrhizal Fungal Community Composition and Barley (H Ordeum Vulgare) Mycorrhizal Carbon and Phosphorus Exchange. New Phytol. 2017, 213, 874–885. [Google Scholar] [CrossRef] [PubMed]
  28. Liu, M.; Shen, Y.; Li, Q.; Xiao, W.; Song, X. Arbuscular Mycorrhizal Fungal Colonization and Soil PH Induced by Nitrogen and Phosphorus Additions Affects Leaf C: N: P Stoichiometry in Chinese Fir (Cunninghamia Lanceolata) Forests. Plant Soil 2021, 461, 421–440. [Google Scholar] [CrossRef]
  29. Six, J.; Frey, S.D.; Thiet, R.K.; Batten, K.M. Bacterial and Fungal Contributions to Carbon Sequestration in Agroecosystems. Soil Sci. Soc. Am. J. 2006, 70, 555–569. [Google Scholar] [CrossRef]
  30. Schindler, F.V.; Mercer, E.J.; Rice, J.A. Chemical Characteristics of Glomalin-Related Soil Protein (GRSP) Extracted from Soils of Varying Organic Matter Content. Soil Biol. Biochem. 2007, 39, 320–329. [Google Scholar] [CrossRef]
  31. Wang, Q.; Lu, H.; Chen, J.; Hong, H.; Liu, J.; Li, J.; Yan, C. Spatial Distribution of Glomalin-Related Soil Protein and Its Relationship with Sediment Carbon Sequestration across a Mangrove Forest. Sci. Total Environ. 2018, 613, 548–556. [Google Scholar] [CrossRef]
  32. Koorem, K.; Gazol, A.; Oepik, M.; Moora, M.; Saks, Ü.; Uibopuu, A.; Sober, V.; Zobel, M. Soil Nutrient Content Influences the Abundance of Soil Microbes but Not Plant Biomass at the Small-Scale. PLoS ONE 2014, 9, e91998. [Google Scholar] [CrossRef] [PubMed]
  33. Masebo, N.; Birhane, E.; Takele, S.; Belay, Z.; Lucena, J.J.; Anjulo, A. Richness of Arbuscular Mycorrhizal Fungi Under Different Agroforestry Practices in the Drylands of Southern Ethiopia. BMC Plant Biology 2023, 23, 634. [Google Scholar] [CrossRef] [PubMed]
  34. Wang, C.; Ma, L.; Zuo, X.; Ye, X.; Wang, R.; Huang, Z.; Liu, G.; Cornelissen, J.H.C. Plant Diversity Has Stronger Linkage with Soil Fungal Diversity than with Bacterial Diversity across Grasslands of Northern China. Glob. Ecol. Biogeogr. 2022, 31, 886–900. [Google Scholar] [CrossRef]
  35. Zhang, Z.; Wang, Q.; Wang, H.; Nie, S.; Liang, Z. Effects of Soil Salinity on the Content, Composition, and Ion Binding Capacity of Glomalin-Related Soil Protein (GRSP). Sci. Total Environ. 2017, 581, 657–665. [Google Scholar] [CrossRef] [PubMed]
  36. Yuan, B.; Lin, L.; Hong, H.; Li, H.; Liu, S.; Tang, S.; Lu, H.; Liu, J.; Yan, C. Enhanced Cr (VI) Stabilization by Terrestrial-Derived Soil Protein: Photoelectrochemical Properties and Reduction Mechanisms. J. Hazard. Mater. 2024, 465, 133153. [Google Scholar] [CrossRef]
  37. Burns, R.G.; DeForest, J.L.; Marxsen, J.; Sinsabaugh, R.L.; Stromberger, M.E.; Wallenstein, M.D.; Weintraub, M.N.; Zoppini, A. Soil enzymes in a changing environment: Current knowledge and future directions. Soil Biol. Biochem. 2013, 58, 216–234. [Google Scholar] [CrossRef]
  38. Wang, Q.; Wang, W.; He, X.; Zhang, W.; Song, K.; Han, S. Role and Variation of the Amount and Composition of Glomalin in Soil Properties in Farmland and Adjacent Plantations with Reference to a Primary Forest in North-Eastern China. PLoS ONE 2015, 10, e0139623. [Google Scholar] [CrossRef]
  39. Van Geel, M.; Verbruggen, E.; De Beenhouwer, M.; Van Rennes, G.; Lievens, B.; Honnay, O. High Soil Phosphorus Levels Overrule the Potential Benefits of Organic Farming on Arbuscular Mycorrhizal Diversity in Northern Vineyards. Agric. Ecosyst. Environ. 2017, 248, 144–152. [Google Scholar] [CrossRef]
  40. Gosling, P.; Mead, A.; Proctor, M.; Hammond, J.P.; Bending, G.D. Contrasting arbuscular mycorrhizal communities colonizing different host plants show a similar response to a soil phosphorus concentration gradient. New Phytol. 2013, 198, 546–556. [Google Scholar] [CrossRef]
  41. Rillig, M.C.; Wright, S.F.; Nichols, K.A.; Schmidt, W.F.; Torn, M.S. Large Contribution of Arbuscular Mycorrhizal Fungi to Soil Carbon Pools in Tropical Forest Soils. Plant Soil 2001, 233, 167–177. [Google Scholar] [CrossRef]
Figure 1. The percentages of C (a) and N (b), the ratio of C to N (c), and the content of C (d) and N (e) in GRSP under long-term fertilization regimes. CK, no fertilizer; NPK, mineral N, P, K fertilizer; M, pig manure; NPKM, NPK + pig manure. The data (n = 3) show the means with standard errors. Significant differences across fertilization treatments are shown by different letters (p < 0.05).
Agriculture 14 01510 g001
Figure 2. Four fluorescent components identified using PARAFAC analysis under fertilization regimes. The spectral shapes of emission and excitation are shown in contour plots (ad). The split-half validation findings for the appropriate component are presented in line plots on the right side of each contour plot (eh). C1: humic acid-like substance; C2: fulvic acid-like substance; C3: humic acid-like substance; C4: protein-like substance.
Agriculture 14 01510 g002
Figure 3. Fluorescent excitation–emission matrix fluorescence spectroscopy (EEMs) spectra under CK (a), NPK (b), M (c), and NPKM (d) treatments. CK, no fertilizer; NPK, mineral N, P, K fertilizer; M, pig manure; NPKM, NPK + pig manure.
Agriculture 14 01510 g003
Figure 4. Comparison of fluorescence intensity of four components (C1 (a), C2 (b), C3 (c), and C4 (d)) in glomalin-related soil proteins (GRSP) under different fertilization regimes. CK, no fertilizer; NPK, mineral N, P, K fertilizer; M, pig manure; NPKM, NPK + pig manure. The data (n = 3) show the means with standard errors. Significant differences across fertilization treatments are shown by different letters (p < 0.05). C1: humic acid-like substance; C2: fulvic acid-like substance; C3: humic acid-like substance; C4: protein-like substance.
Agriculture 14 01510 g004
Figure 5. Comparison of relative percentages of four components in glomalin-related soil proteins (GRSP) across different fertilization regimes (a). Differences in the biological index (BIX) (b) and the humification index (HIX) (c) across fertilization regimes. CK, no fertilizer; NPK, mineral N, P, K fertilizer; M, pig manure; NPKM, NPK + pig manure. The data (n = 3) show the means with standard errors. Significant differences across fertilization treatments are shown by different letters (p < 0.05).
Agriculture 14 01510 g005
Figure 6. Relationships between compositional traits of glomalin-related soil proteins (GRSP) and soil properties. * represents p < 0.05; ** represents p < 0.01; *** represents p < 0.001. GRSP-C (N), the content of C (N) in GRSP; C% and N%, the percentage of C and N in GRSP; HIX, humification index; BIX, biological index. C1–C4, four fluorescence components in GRSP; SOC, soil organic carbon; TN, total nitrogen; AP, available phosphorus.
Agriculture 14 01510 g006
Figure 7. Partial least squares path modeling showing impacts of edaphic and biotic factors on element composition (a) and fluorescence components (b) in glomalin-related soil protein (GRSP). Positive and negative effects are shown by blue and green arrows, respectively, and significant and insignificant correlations are displayed by dashed and continuous arrows. The strength of the relationship is positively associated with the thickness of the arrow. GRSP-C (N), the content of C (N) in GRSP; C% and N%, the percentage of C and N in GRSP; SOC, soil organic carbon; TN, total nitrogen; AP, available phosphorus. GOF, goodness of fit. * represents p < 0.05; ** represents p < 0.01; *** represents p < 0.001.
Agriculture 14 01510 g007
Figure 8. Conceptual diagram illustrating variations of fluorescence components and elements in glomalin-related soil protein (GRSP) under 29-year fertilization regimes. The up arrow “” indicates a positive response.
Agriculture 14 01510 g008
Table 1. Fertilizer application amounts under different treatments.
TreatmentsFertilization (kg ha−1)
MaizeWheat
NP2O5K2OFresh ManureNP2O5K2OFresh Manure
CK--------
NPK2108484 903636-
M---42,000---18,000
NPKM63848429,40027363612,600
Notes: The water content of pig manure is about 70%. CK, no fertilizer; NPK, mineral nitrogen, phosphorus, potassium fertilizer; M, pig manure; NPKM, NPK plus pig manure.
Table 2. Characteristics of the four components of glomalin-related soil proteins identified by PARAFAC of excitation–emission matrices.
ComponentExcitation Max (nm)Emission Max (nm)Likely Structure
C1320390UVA humic acid-like
C2200385Fulvic acid-like
C3274460UVA humic acid-like
C4222290Protein-like substance
(tyrosine)
Disclaimer/Publisher’s Note: The statements, opinions and data contained in all publications are solely those of the individual author(s) and contributor(s) and not of MDPI and/or the editor(s). MDPI and/or the editor(s) disclaim responsibility for any injury to people or property resulting from any ideas, methods, instructions or products referred to in the content.

