
Exploring the Physicochemical and Antioxidant Characteristics of Honey from Eastern Morocco: Insights into Potential Health Benefits and Molecular Docking Analysis

 , ,
, ,
Abstract
:1. Introduction
2. Materials and Methods
2.1. Honey Samples
2.2. Physicochemical Analysis
2.3. Total Phenolics
2.4. Total Flavonoids
2.5. DPPH Free Radical-Scavenging Activity
2.6. HPLC and GC-MS Analysis
2.7. Molecular Docking Study
2.8. DFT Calculations
3. Results
3.1. Physicochemical Properties
3.2. Total Polyphenol Content
3.3. Flavonoid Content
3.4. Antioxidant Activity
3.5. Correlation Amongst Biochemical Parameters and Antioxidant Properties
3.6. Molecular Docking
3.7. Molecular Docking
3.8. DFT Study
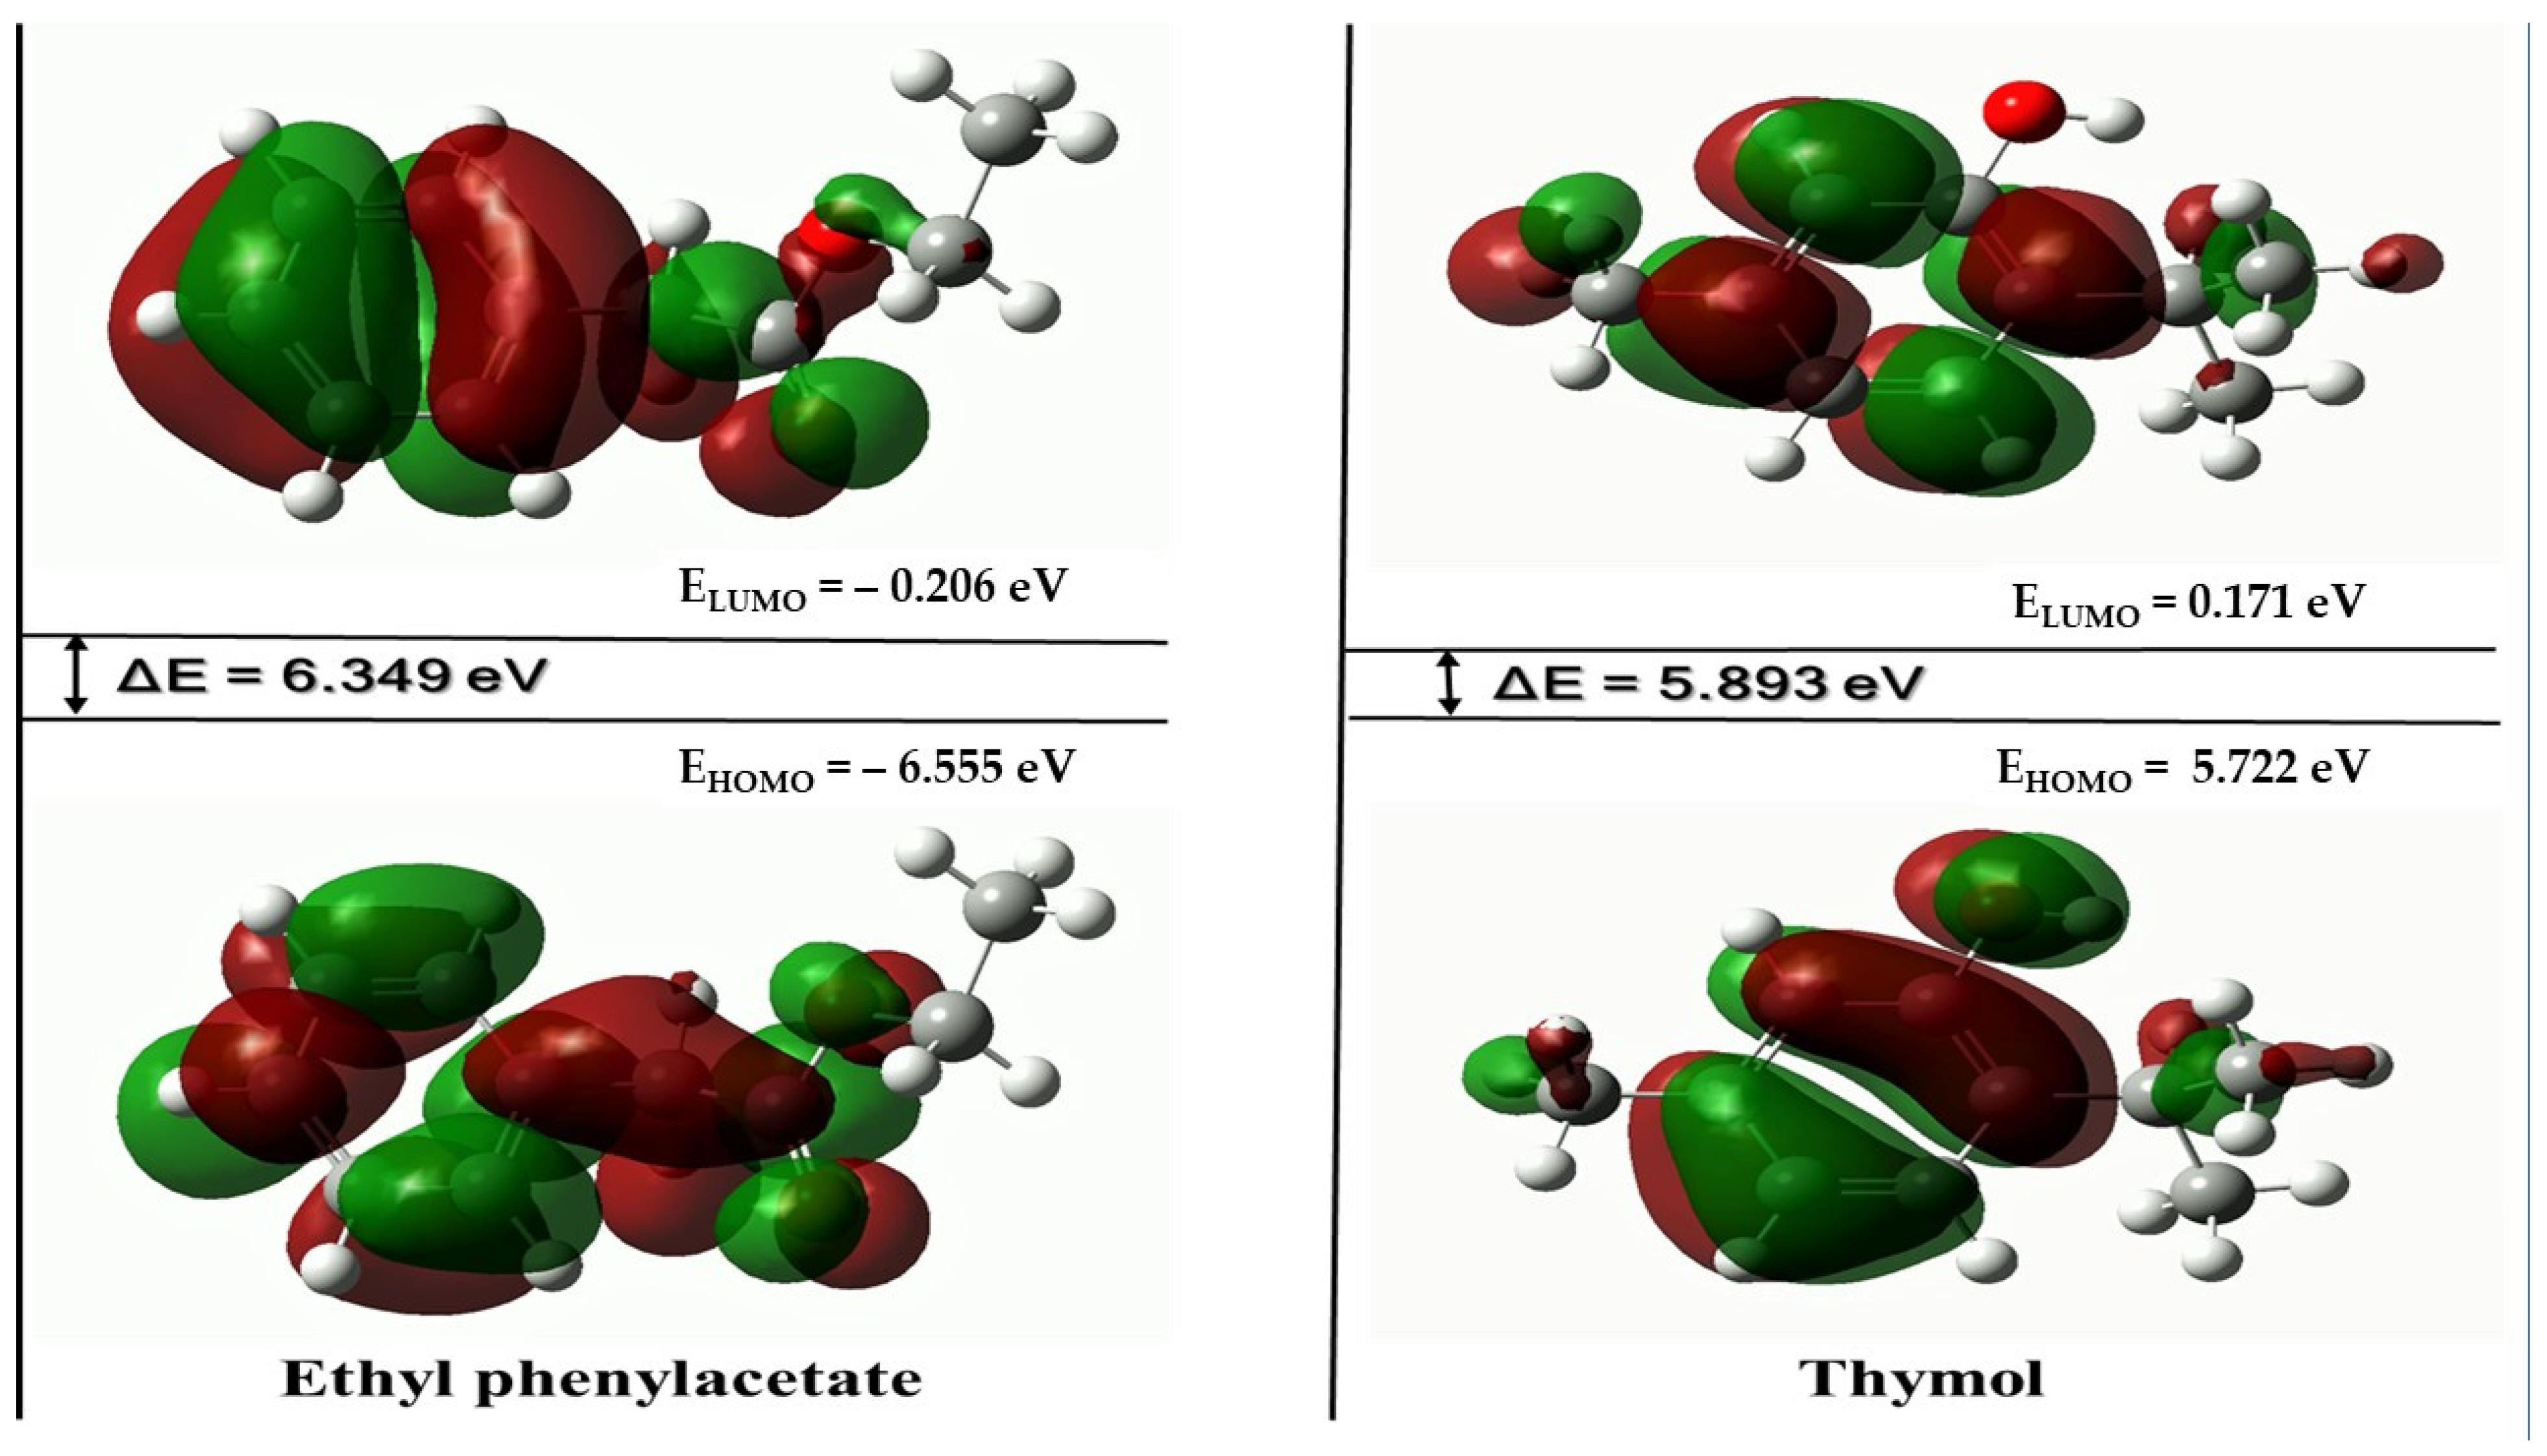
3.8.1. HOMO-LUMO Analysis
3.8.2. Global Reactivity Descriptors
3.8.3. Molecular Electrostatic Potential
4. Conclusions
Supplementary Materials
Author Contributions
Funding
Data Availability Statement
Acknowledgments
Conflicts of Interest
References
- Gheldof, N.; Engeseth, N.J. Antioxidant capacity of honeys from various floral sources based on the determination of oxygen radical absorbance capacity and inhibition of in vitro lipoprotein oxidation in human serum samples. J. Agric. Food Chem. 2002, 50, 3050–3055. [Google Scholar] [CrossRef]
- Blasa, M.; Candiracci, M.; Accorsi, A.; Piacentini, M.P.; Albertini, M.C.; Piatti, E. Raw Millefiori honey is packed full of antioxidants. Food Chem. 2006, 97, 217–222. [Google Scholar] [CrossRef]
- Beretta, G.; Granata, P.; Ferrero, M.; Orioli, M.; Facino, R.M. Standardization of antioxidant properties of honey by a combination of spectrophotometric/fluorimetric assays and chemometrics. Anal. Chim. Acta 2005, 533, 185–191. [Google Scholar] [CrossRef]
- D’Arcy, R. Antioxidants in Australian Floral Honeys: Identification of Health-Enhancing Nutrient Components: A Report for the Rural Industries Research and Development Corporation; Bruce; Rural Industries Research and Development Corporation: Wagga Wagga, Australia, 2005; pp. 68–73. [Google Scholar]
- Inoue, K.; Murayama, S.; Seshimo, F.; Takeba, K.; Yoshimura, Y.; Nakazawa, H. Identification of phenolic compound in manuka honey as specific superoxide anion radical scavenger using electron spin resonance (ESR) and liquid chromatography with coulometric array detection. J. Sci. Food Agric. 2005, 85, 872–878. [Google Scholar] [CrossRef]
- Fahey, J.W.; Stephenson, K.K. Pinostrobin from honey and Thai ginger (Boesenbergia pandurata): A potent flavonoid inducer of mammalian phase 2 chemoprotective and antioxidant enzymes. J. Agric. Food Chem. 2002, 50, 7472–7476. [Google Scholar] [CrossRef]
- Frankel, S.; Robinson, G.E.; Berenbaum, M.R. Antioxidant capacity and correlated characteristics of 14 unifloral honeys. J. Apic. Res. 1998, 37, 27–31. [Google Scholar] [CrossRef]
- Schramm, D.D.; Karim, M.; Schrader, H.R.; Holt, R.R.; Cardetti, M.; Keen, C.L. Honey with high levels of antioxidants can provide protection to healthy human subjects. J. Agric. Food Chem. 2003, 51, 1732–1735. [Google Scholar] [CrossRef]
- Aljadi, A.M.; Kamaruddin, M.Y. Evaluation of the phenolic contents and antioxidant capacities of two Malaysian floral honeys. Food Chem. 2004, 85, 513–518. [Google Scholar] [CrossRef]
- Palma-Morales, M.; Huertas, J.R.; Rodríguez-Pérez, C. A Comprehensive Review of the Effect of Honey on Human Health. Nutrients 2023, 15, 3056. [Google Scholar] [CrossRef]
- Ranneh, Y.; Akim, A.M.; Hamid, H.A.; Khazaai, H.; Fadel, A.; Zakaria, Z.A.; Albujja, M.; Abu Bakar, M.F. Honey and its nutritional and anti-inflammatory value. BMC Complement. Med. Ther. 2021, 21, 30. [Google Scholar] [CrossRef]
- Leoni, V.; Panseri, S.; Giupponi, L.; Pavlovic, R.; Gianoncelli, C.; Sala, S.; Zeni, V.; Benelli, G.; Giorgi, A. Formal analyses are fundamental for the definition of honey, a product representing specific territories and their changes: The case of North Tyrrhenian dunes (Italy). Sci. Rep. 2023, 13, 17542. [Google Scholar] [CrossRef]
- Ahmed, A.; Tul-Noor, Z.; Lee, D.; Bajwah, S.; Ahmed, Z.; Zafar, S.; Syeda, M.; Jamil, F.; Qureshi, F.; Zia, F.; et al. Effect of honey on cardiometabolic risk factors: A systematic review and meta-analysis. Nutr. Rev. 2023, 81, 758–774. [Google Scholar] [CrossRef]
- Moniruzzaman, M.; Khalil, M.I.; Sulaiman, S.A.; Gan, S.H. Advances in the analytical methods for determining the antioxidant properties of honey: A review. Afr. J. Tradit. Complement. Altern. Med. AJTCAM 2012, 9, 36–42. [Google Scholar] [CrossRef]
- Nurbianto, A.T.; Christian, T.F.; Surabaya, U.C. Marketing strategies through product awareness, service quality and product quality. Devot. J. Community Serv. 2024, 5, 461–470. [Google Scholar]
- da Costa, I.F.; Toro, M.J.U. Evaluation of the antioxidant capacity of bioactive compounds and determination of proline in honeys from Pará. J. Food Sci. Technol. 2021, 58, 1900–1908. [Google Scholar] [CrossRef]
- Codex Alimentarius. Revised Codex Standard for Honey, Standards and Standard Methods. Codex Aliment. Comm. FAO/OMS 2001, 11, 7. [Google Scholar]
- Bogdanov, S.; Ruoff, K.; Oddo, L.P. Physico-chemical methods for the characterisation of unifloral honeys: A review. Apidologie 2004, 38, 67–76. [Google Scholar] [CrossRef]
- Kirk, P.L. Kjeldahl Method for Total Nitrogen. Anal. Chem. 1950, 22, 354–358. [Google Scholar] [CrossRef]
- Chakir, A.; Romane, A.; Marcazzan, G.L.; Ferrazzi, P. Physicochemical properties of some honeys produced from different plants in Morocco. Arab. J. Chem. 2016, 9, S946–S954. [Google Scholar] [CrossRef]
- Singleton, V.L.; Orthofer, R.; Lamuela-Raventós, R.M. Analysis of total phenols and other oxidation substrates and antioxidants by means of folin-ciocalteu reagent. Methods Enzymol. 1999, 299, 152–178. [Google Scholar]
- Ferreira, I.C.F.R.; Aires, E.; Barreira, J.C.M.; Estevinho, L.M. Antioxidant activity of Portuguese honey samples: Different contributions of the entire honey and phenolic extract. Food Chem. 2009, 114, 1438–1443. [Google Scholar] [CrossRef]
- Hatano, T.; Kagawa, H.; Yasuhara, T.; Okuda, T. Two new flavonoids and other constituents in licorice root: Their relative astringency and radical scavenging effects. Chem. Pharm. Bull. 1988, 36, 2090–2097. [Google Scholar] [CrossRef]
- Murphy, E.J.; Metcalfe, C.L.; Basran, J.; Moody, P.C.E.; Raven, E.L. Engineering the substrate specificity and reactivity of a heme protein: Creation of an ascorbate binding site in cytochrome c peroxidase. Biochemistry 2008, 47, 13933–13941. [Google Scholar] [CrossRef]
- Frisch, M.J.; Trucks, G.W.; Schlegel, H.B.; Scuseria, G.E.; Robb, M.A.; Cheeseman, J.R.; Scalmani, G.; Barone, V.; Mennucci, B.; Petersson, G.A.; et al. Gaussian 09, Revision B.01. Gaussian 09, Revis B01; Gaussian, Inc.: Wallingford, CT, USA, 2009; pp. 1–20. Available online: https://gaussian.com/g09citation/ (accessed on 10 April 2024).
- Dennington, R.; Keith, T.; MillamSemichem, J.; Shawnee Mission, K. GaussView, Version 5; Semichem Inc.: Shawnee Mission, KS, USA, 2009.
- Hameed, O.M.; Shaker, O.M.; Ben Slima, A.; Makni, M. Biochemical Profiling and Physicochemical and Biological Valorization of Iraqi Honey: A Comprehensive Analysis. Molecules 2024, 29, 671. [Google Scholar] [CrossRef]
- Codex Alimentarius. STANDARD FOR HONEY CXS 12-19811 Adopted Adopted in 1981; Revised in 1987, 2001; Amended in 2019, 2022. Int. Foods Standars. 2022. [Google Scholar]
- Kahraman, K.; Göcenler, O.; Dağ;, Ç. Characterization of Turkish Pine honey and differentiation from floral honeys by NMR spectroscopy and chemometric analysis. J. Food Compos. Anal. 2024, 127, 105983. [Google Scholar] [CrossRef]
- Mehdi, R.; Zrira, S.; Vadalà, R.; Nava, V.; Condurso, C.; Cicero, N.; Costa, R. A Preliminary Investigation of Special Types of Honey Marketed in Morocco. J. Exp. Theor. Anal. 2023, 1, 1–20. [Google Scholar] [CrossRef]
- Prica, N.; Baloš, M.Ž.; Jakšić, S.; Mihaljev, Ž.; Kartalović, B.; Babić, J.; Savić, S. Moisture and Acidity as Indicators of the Quality of Honey Originating from Vojvodina Region. Arch. Vet. Med. 2015, 7, 99–109. [Google Scholar] [CrossRef]
- Azeredo, L.D.C.; Azeredo, M.A.A.; De Souza, S.R.; Dutra, V.M.L. Protein contents and physicochemical properties in honey samples of Apis mellifera of different floral origins. Food Chem. 2003, 80, 249–254. [Google Scholar] [CrossRef]
- Pauliuc, D.; Oroian, M.; Ciursá, P. Organic acids content, sugars content and physicochemical parameters of Romanian acacia honey. Ukr. Food J. 2021, 10, 158–170. [Google Scholar] [CrossRef]
- Pasias, I.N.; Kiriakou, I.K.; Proestos, C. HMF and diastase activity in honeys: A fully validated approach and a chemometric analysis for identification of honey freshness and adulteration. Food Chem. 2017, 229, 425–431. [Google Scholar] [CrossRef]
- Bodó, A.; Radványi, L.; Kőszegi, T.; Csepregi, R.; Nagy, D.U.; Farkas, Á.; Kocsis, M. Quality Evaluation of Light- and Dark-Colored Hungarian Honeys, Focusing on Botanical Origin, Antioxidant Capacity and Mineral Content. Molecules 2021, 26, 2825. [Google Scholar] [CrossRef]
- Khalil, M.I.; Moniruzzaman, M.; Boukraâ, L.; Benhanifia, M.; Islam, M.A.; Islam, M.N.; Sulaiman, S.A.; SiewHua, G. Physicochemical and antioxidant properties of algerian honey. Molecules 2012, 17, 11199–11215. [Google Scholar] [CrossRef]
- Pauliuc, D.; Dranca, F.; Oroian, M. Antioxidant activity, total phenolic content, individual phenolics and physicochemical parameters suitability for Romanian honey authentication. Foods 2020, 9, 306. [Google Scholar] [CrossRef]
- Jasicka-Misiak, I.; Poliwoda, A.; Dereń, M.; Kafarski, P. Phenolic compounds and abscisic acid as potential markers for the floral origin of two Polish unifloral honeys. Food Chem. 2012, 131, 1149–1156. [Google Scholar] [CrossRef]
- Özkök, A.; D’arcy, B.; Sorkun, K. Total Phenolic Acid and Total Flavonoid Content of Turkish Pine Honeydew Honey. J. ApiProduct. ApiMedical. Sci. 2010, 2, 65–71. [Google Scholar] [CrossRef]
- Miranda, I.R.; Acevedo-Fernández, J.; Negrete-Leon, E.; Betancur-Ancona, D.A.; Moguel-Ordoñez, Y.B. In Vivo Wound-Healing and Anti-Inflammatory Activities of Honey Produced by Melipona beecheii Bees. Jundishapur J. Nat. Pharm. Prod. 2024, 19, e143682. [Google Scholar]
- Khalil, M.I.; Alam, N.; Moniruzzaman, M.; Sulaiman, S.A.; Gan, S.H. Phenolic acid composition and antioxidant properties of Malaysian honeys. J. Food Sci. 2011, 76, C921–C928. [Google Scholar] [CrossRef]
- Sweilam, S.H.; Abdel Bar, F.M.; Foudah, A.I.; Alqarni, M.H.; Elattal, N.A.; El-Gindi, O.D.; El-Sherei, M.M.; Abdel-Sattar, E. Phytochemical, Antimicrobial, Antioxidant, and In Vitro Cytotoxicity Evaluation of Echinops erinaceus Kit Tan. Separations 2022, 9, 447. [Google Scholar] [CrossRef]
- Taibi, M.; Elbouzidi, A.; Ou-Yahia, D.; Dalli, M.; Bellaouchi, R.; Tikent, A.; Roubi, M.; Gseyra, N.; Asehraou, A.; Hano, C.; et al. Assessment of the Antioxidant and Antimicrobial Potential of Ptychotis verticillata Duby Essential Oil from Eastern Morocco: An In Vitro and In Silico Analysis. Antibiotics 2023, 12, 655. [Google Scholar] [CrossRef]
- Ludington, J.L. Protein binding site analysis for drug discovery using a computational fragment-based method. Methods Mol. Biol. 2015, 1289, 145–154. [Google Scholar]
- Ismail, C.M.K.H.; Abdul Hamid, A.A.; Abdul Rashid, N.N.; Lestari, W.; Mokhtar, K.I.; Mustafa Alahmad, B.E.; Razake, M.R.M.A.; Ismail, A. An ensemble docking-based virtual screening and molecular dynamics simulation of phytochemical compounds from Malaysian Kelulut Honey (KH) against SARS-CoV-2 target enzyme, human angiotensin-converting enzyme 2 (ACE-2). J. Biomol. Struct. Dyn. 2024, 1–30. [Google Scholar] [CrossRef]
- Sun, Z.; Lin, Y.; Yang, H.; Zhao, R.; Zhu, J.; Wang, F. Characterization of honey-like characteristic aroma compounds in Zunyi black tea and their molecular mechanisms of interaction with olfactory receptors using molecular docking. LWT 2024, 191, 115640. [Google Scholar] [CrossRef]
- Bazaid, A.S.; Alsolami, A.; Patel, M.; Khateb, A.M.; Aldarhami, A.; Snoussi, M.; Almusheet, S.M.; Qanash, H. Antibiofilm, Antimicrobial, Anti-Quorum Sensing, and Antioxidant Activities of Saudi Sidr Honey: In Vitro and Molecular Docking Studies. Pharmaceutics 2023, 15, 2177. [Google Scholar] [CrossRef]
- Abu-Rayyan, A.; Suleiman, M.; Daraghmeh, A.; Al Ali, A.; Zarrouk, A.; Kumara, K.; Sawafta, A.; Warad, I. Synthesis, characterization, E/Z-isomerization, DFT, optical and 1BNA docking of new Schiff base derived from naphthalene-2-sulfonohydrazide. Moroccan J. Chem. 2023, 11, 613–622. [Google Scholar]
- Toubi, Y.; Abrigach, F.; Radi, S.; Souna, F.; Hakkou, A.; Alsayari, A.; Bin Muhsinah, A.; Mabkhot, Y.N. Synthesis, Antimicrobial Screening, Homology Modeling, and Molecular Docking Studies of a New Series of Schiff Base Derivatives as Prospective Fungal Inhibitor Candidates. Molecules 2019, 24, 3250. [Google Scholar] [CrossRef]
- Kumar, S.; Saini, V.; Maurya, I.K.; Sindhu, J.; Kumari, M.; Kataria, R.; Kumar, V. Design, synthesis, DFT, docking studies and ADME prediction of some new coumarinyl linked pyrazolylthiazoles: Potential standalone or adjuvant antimicrobial agents. PLoS ONE 2018, 13, e0196016. [Google Scholar] [CrossRef]
- Youssefi, Y.; Oucheikh, L.; Ou-Ani, O.; Jabha, M.; Oubair, A.; Znini, M.; Ebenso, E.E.; Hammouti, B. Synthesis, Characterization and Corrosion Inhibition Potential of Olefin Derivatives for Carbon Steel in 1M HCl: Electrochemical and DFT Investigations. Moroccan J. Chem. 2023, 11, 155–187. [Google Scholar]
- El Hadki, A.; El Hadki, H.; Tazi, R.; Komiha, N.; Zrineh, A.; El Hajjaji, S.; Kabbaj, O.K. DFT and Molecular docking study of natural molecules proposed for COVID-19 treatment. Moroccan J. Chem. 2021, 9, 198–209. [Google Scholar]
- El-Shamy, N.T.; Alkaoud, A.M.; Hussein, R.K.; Ibrahim, M.A.; Alhamzani, A.G.; Abou-Krisha, M.M. DFT, ADMET and Molecular Docking Investigations for the Antimicrobial Activity of 6,6′-Diamino-1,1′,3,3′-tetramethyl-5,5′-(4-chlorobenzylidene) bis[pyrimidine-2,4(1H,3H)-dione. Molecules 2022, 27, 620. [Google Scholar] [CrossRef]
- Edim, M.M.; Enudi, O.C.; Asuquo, B.B.; Louis, H.; Bisong, E.A.; Agwupuye, J.A.; Chioma, A.G.; Odey, J.O.; Joseph, I.; Bassey, F.I. Aromaticity indices, electronic structural properties, and fuzzy atomic space investigations of naphthalene and its aza-derivatives. Heliyon 2021, 7, e06138. [Google Scholar] [CrossRef] [PubMed]
- Moran, G.S.; Cardona, W.V.; Candia, L.G.; Mendoza-Huizar, L.H.; Abdizadeh, T. Identification of Novel Coumarin Based Compounds as Potential Inhibitors of the 3-Chymotrypsin-Like Main Protease of SARS-CoV-2 Using Dft, Molecular Docking and Molecular Dynamics Simulation Studies. J. Chil. Chem. Soc. 2022, 67, 5521–5536. [Google Scholar] [CrossRef]
- Okulik, N.; Jubert a, H. Theoretical Analysis of the Reactive Sites of Non–steroidal Anti–inflammatory Drugs. Internet Electron. J. Mol. Des. 2005, 4, 17–30. [Google Scholar]
- Panicker, C.Y.; Varghese, H.T.; Narayana, B.; Divya, K.; Sarojini, B.K.; War, J.A.; Van Alsenoy, C.; Fun, H.K. FT-IR, NBO, HOMO-LUMO, MEP analysis and molecular docking study of Methyl N-({[2-(2-methoxyacetamido)-4-(phenylsulfanyl)phenyl] amino} [(methoxycarbonyl) imino] methyl) carbamate. Spectrochim. Acta A Mol. Biomol. Spectrosc. 2015, 148, 29–42. [Google Scholar] [CrossRef]


| Flora | pH |
Free Acidity (meq/kg) | Moisture (%) |
Diastase
(Gothe) | Proteins (%) | HMF mg/kg | ABS450 (mAU; 50 w/v) |
|---|---|---|---|---|---|---|---|
| Jujube | 4.94 ± 0.68 b | 5.77 ± 1.77 c | 15.39 ± 0.64 b | 21.17 ± 2.33 c | 0.34 ± 0.05 a | 3.98 ± 4.67 d | 675.12 ± 2.12 c |
| Multifloral | 4.30 ± 0.2 b | 15.07 ± 7.89 d | 17.17 ± 1.63 c | 17.82 ± 6.45 d | 0.40 ± 0.14 b | 10.02 ± 4.66 c | 795.15 ± 3.57 c |
| Citrus | 3.79 ± 0.10 a | 14.97 ± 2.89 c | 17.76 ± 1.43 c | 12.71 ± 1.60 c | 0.31 ± 0.02 a | 27.15 ± 8.73 d | 560.03 ± 0.74 b |
| Eucalyptus | 4.22 ± 0.59 b | 13.68 ± 4.93 c | 19.37 ± 2.17 c | 11.96 ± 9.20 d | 0.30 ± 0.01 a | 38.55 ± 5.60 d | 734.60 ± 2.82 c |
| Thyme | 4.36 ± 0.03 a | 12.04 ± 0.94 b | 16.85 ± 0.36 b | 18.72 ± 2.48 c | 0.39 ± 0.01 a | 10.16 ± 3.63 c | 318.02 ± 0.72 b |
| Carob | 4.20 ± 0.44 b | 14.10 ± 1.71 c | 15.59 ± 1.23 c | 15.28 ± 8.37 d | 0.42 ± 0.1 a | 3.34 ± 3.36 c | 847.10 ± 1.46 c |
| Rosemary | 3.68 ± 0.1 a | 6.01 ± 1.33 c | 17.92 ± 1.98 c | 6.98 ± 2.36 c | 0.22 ± 0.01 a | 15.14 ± 4.86 c | 198.01 ± 2.36 c |
| Range | 3.79–4.94 | 5.77–15.07 | 15.39–19.37 | 6.98–21.17 | 0.22–0.42 | 3.98–38.55 | 198–847 |
| Mean | 4.21 ± 0.4 | 11.66 ± 2.60 | 17.15 ± 0.31 | 14.94 ± 1.40 | 0.41 ± 0.02 | 15.47 ± 4.10 | 589.65 ± 1.05 |
| Honey | Total Polyphenols (mg gallic acid/kg) | Flavonoids (mg catechin/kg) | DPPH Radical-Scavenging Activity (%) |
|---|---|---|---|
| Jujube | 579.99 ± 0.8 a | 50.80 ± 1.5 b | 57.57 ± 0.7 a |
| Multifloral | 643.33 ± 1.3 b | 70.67 ± 0.5 a | 60.39 ± 1.1 b |
| Citrus | 493.33 ± 0.4 a | 40.30 ± 1.7 c | 45.47 ± 1.6 c |
| Eucalyptus | 608.45 ± 1.1 b | 60.90 ± 0.3 a | 53.33 ± 0.8 a |
| Thyme | 454.99 ± 1.2 b | 50.30 ± 0.5 a | 43.33 ± 0.9 a |
| Carob | 720.16 ± 0.5 a | 90.50 ± 1.1 b | 63.50 ± 1.3 a |
| Rosemary | 266.66 ± 0.9 a | 25.01 ± 0.9 a | 36.15 ± 1.5 b |
| Phenolics | Flavonoids | DPPHRSA | ABS450 | Protein | |
|---|---|---|---|---|---|
| Phenolics | 1 | 0.925 a | 0.961 a | 0.963 a | 0.763 b |
| Flavonoids | 0.925 a | 1 | 0.894 a | 0.839 b | 0.826 b |
| DPPH(RSA) | 0.961 a | 0.894 a | 1 | 0.952 b | 0.721 c |
| ABS450 | 0.963 a | 0.839 b | 0.952 b | 1 | 0.593 d |
| Protein | 0.763 b | 0.826 b | 0.721 c | 0.593 d | 1 |
| Type of Honey | Jujube | Multifloral | Citrus | Eucalyptus | Thyme | Carob | Rosemary | ||||||||
|---|---|---|---|---|---|---|---|---|---|---|---|---|---|---|---|
| Compounds | RT | Pa | Area % | Pa | Area % | Pa | Area % | Pa | Area % | Pa | Area % | Pa | Area % | Pa | Area % |
| Phenol | 38.75 | 99.07 | 4.10 | 99.36 | 4.30 | 98.52 | 1.70 | 82.30 | 0.20 | - | - | 99.85 | 2.60 | 99.50 | 12.50 |
| 2-butanol | 37.95 | 23.49 | 0.10 | - | - | 98.82 | 1.80 | - | - | - | - | - | - | 99.74 | 12.60 |
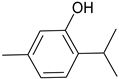
| Thymol | 36.64 | - | - | - | - | - | - | - | - | 99.15 | 16.40 | - | - | - | - |
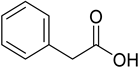
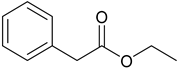
| Ethyl phenylacetate | 33.58 | 99.43 | 14.70 | - | - | - | - | 99.95 | 5.50 | 99.53 | 3.70 | - | - | 86.14 | 0.60 |
| 2-butanone | 32.30 | - | - | - | - | - | - | 98.87 | 3.90 | - | - | 85.54 | 0.30 | 98.61 | 13.40 |
| Isophorone | 30.11 | 99.09 | 9.20 | 98.33 | 3.10 | 97.05 | 1.10 | 95.40 | 0.70 | 93.66 | 0.40 | 86.05 | 1.10 | 98.47 | 4.10 |
| Linalool oxide | 23.74 | - | - | - | - | 99.53 | 16.20 | - | - | - | - | - | - | - | - |
| Phenylacetaldehyde | 22.18 | 99.26 | 4.50 | 99.75 | 15.40 | 99.64 | 3.10 | 95.89 | 0.40 | 99.28 | 10.22 | 99.49 | 27.20 | 98.57 | 1.20 |
| 1-octene | 18.61 | - | - | - | - | - | - | 99.20 | 33.90 | - | - | - | - | - | - |
| Phenylacetic acid | 17.23 | - | - | 99.42 | 5.80 | - | - | 99.95 | 17.60 | - | - | 90.22 | 1.20 | - | - |
| Benzaldehyde | 16.30 | 99.68 | 2.80 | 99.49 | 12.90 | 99.03 | 6.30 | 99.77 | 1.70 | 98.64 | 14.40 | 98.28 | 8.80 | 99.19 | 9.90 |
| 3-furaldehyde | 9.74 | 99.48 | 3.40 | 99.90 | 4.50 | 98.42 | 2.10 | 99.34 | 9.70 | 93.42 | 1.10 | 90.92 | 8.10 | 98.62 | 2.10 |
| Compound | Score (kcal/mol) | Involved Receptor Residues | Distance (Å) |
|---|---|---|---|
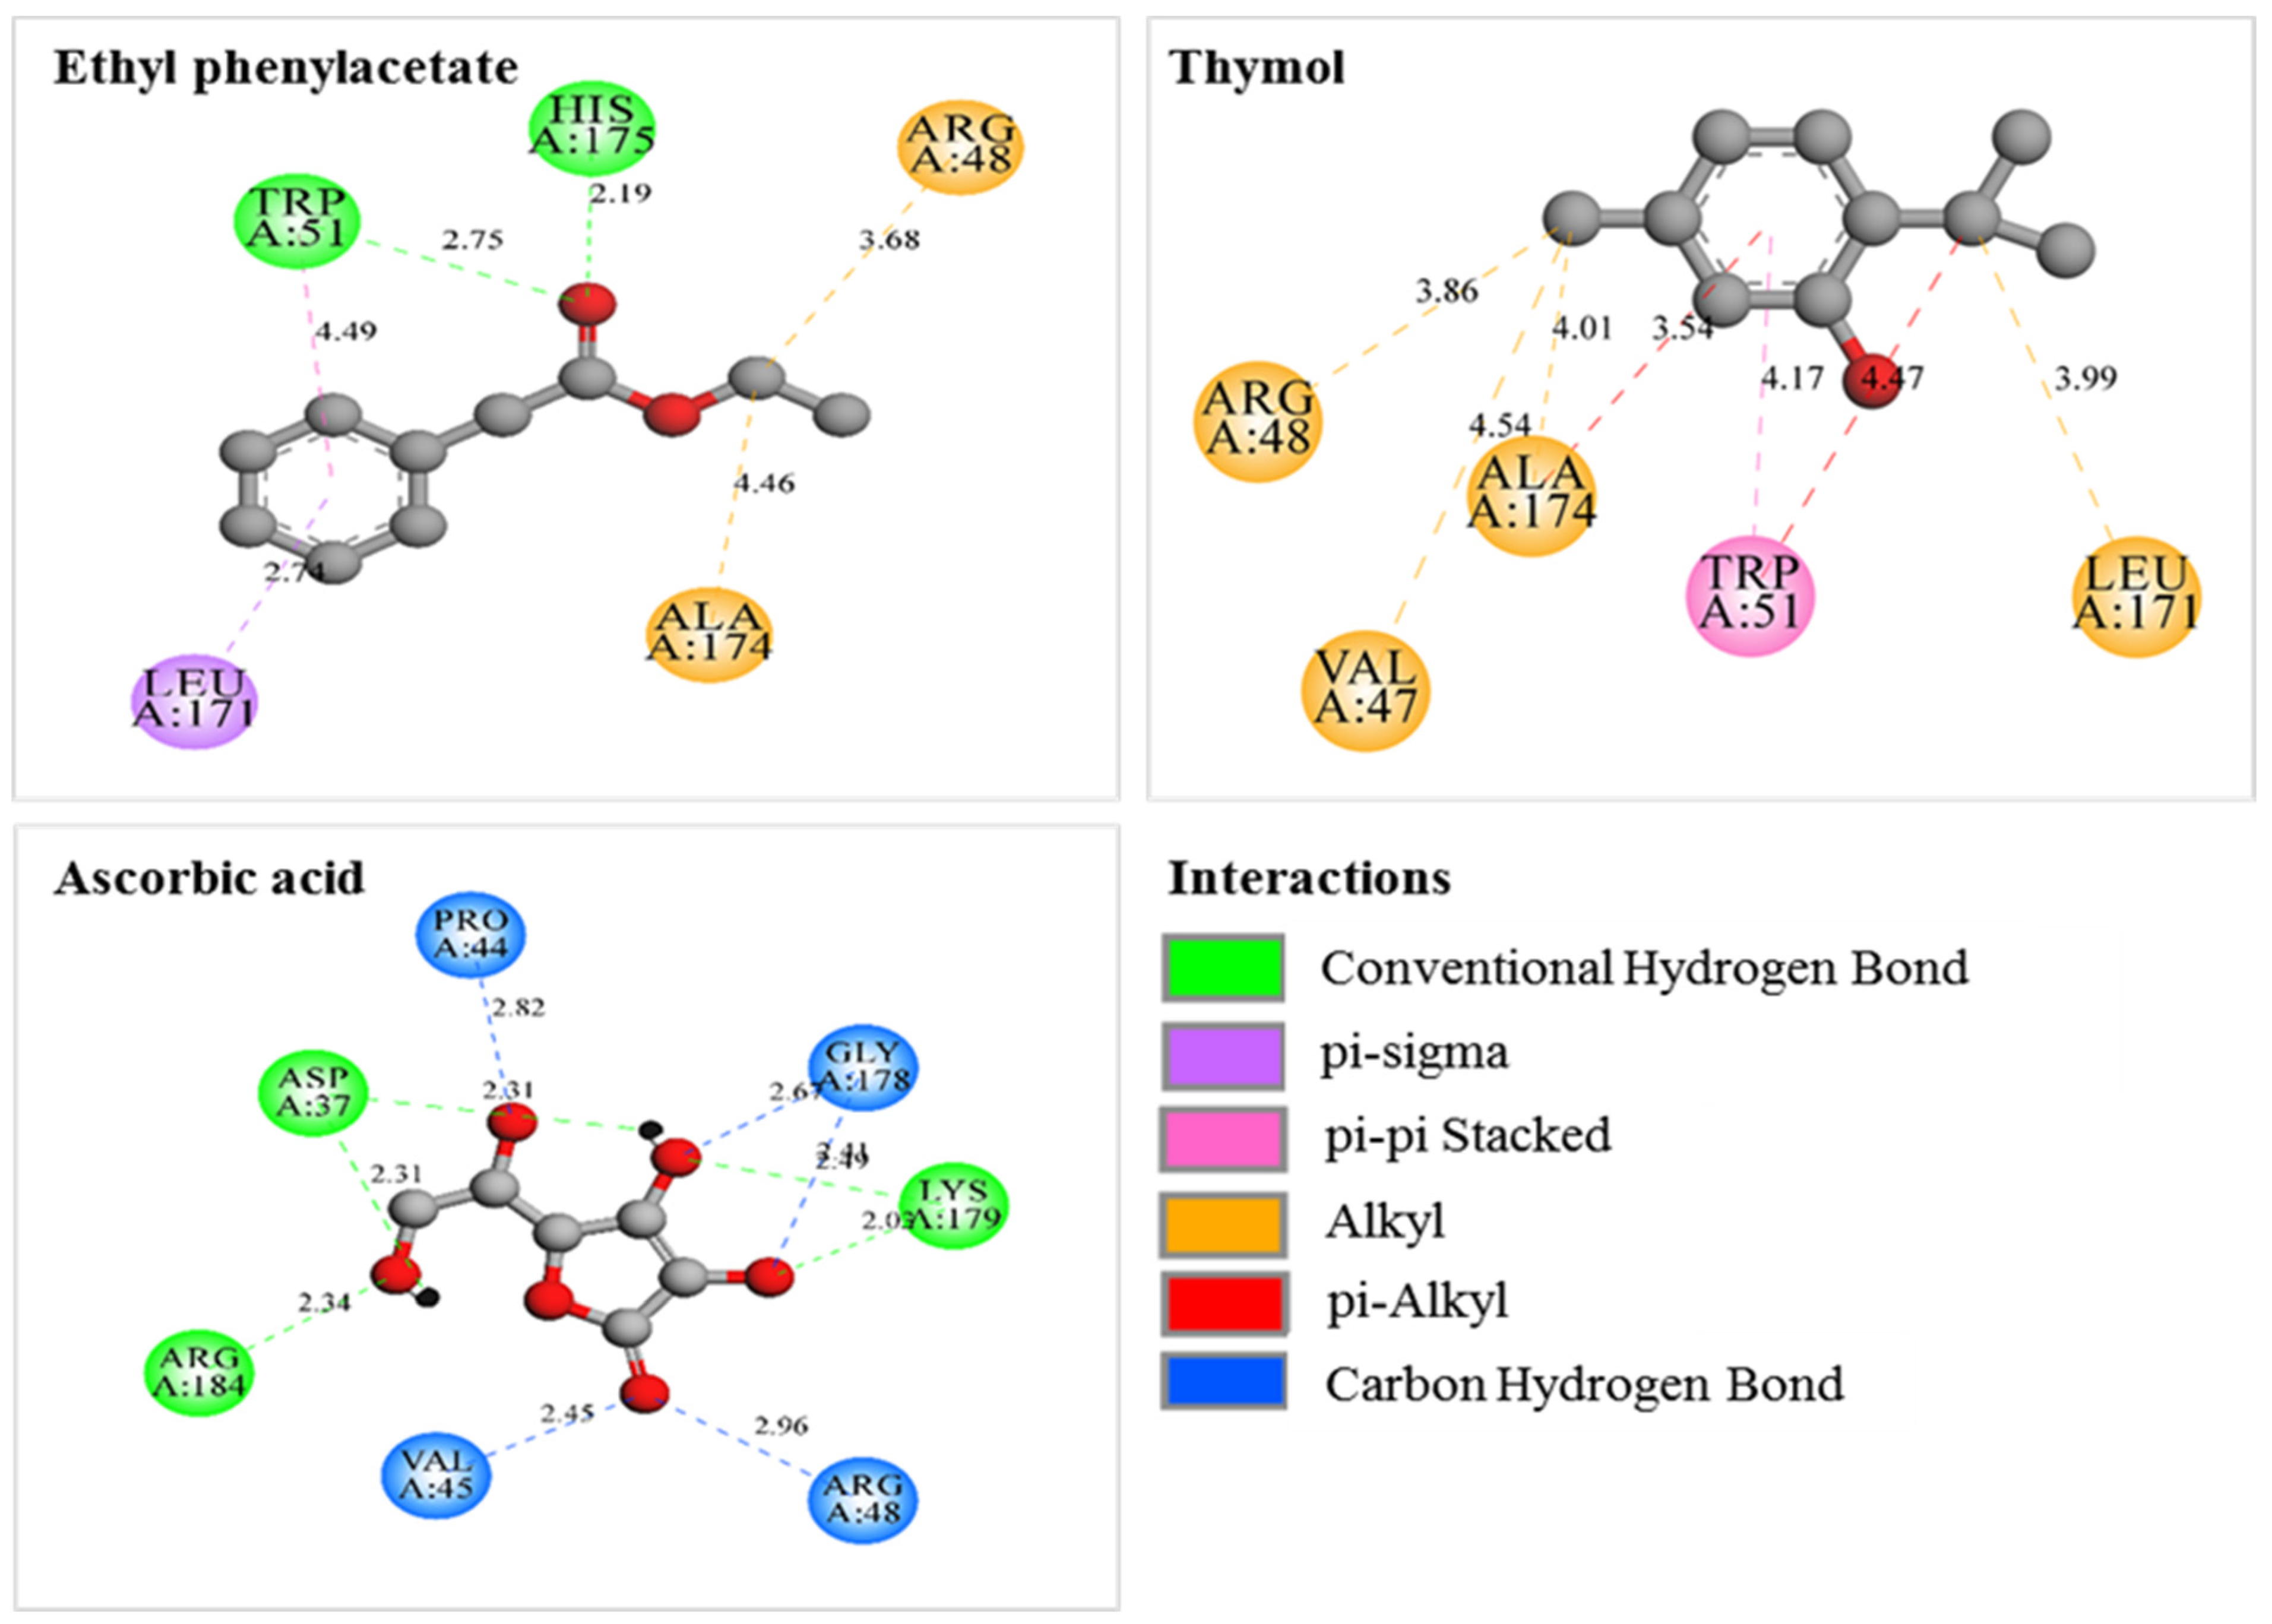
 Benzaldehyde | −6.2 | His299/HB Trp51/HB and pi-pi Leu171/pi-alkyl Ala174/pi-alkyl | 2.46 2.80 and 4.31 4.44 4.75 |
 Phenylacetaldehyde | −6.2 | His175/HB Trp51/HB and pi-pi Leu171/pi-sigma Ala174/pi-alkyl | 2.54 2.51 and 4.49 2.81 4.90 |
 Phenylacetic acid | −6.3 | His175/UDD Trp51/HB and pi-pi Leu171/pi-sigma Ala174/pi-alkyl | 1.37 2.32 and 4.54 2.82 4.90 |
 Thymol | −6.7 | Trp51/pi-pi and pi-alkyl Leu171/alkyl Ala174/pi-alkyl and alkyl Arg48/alkyl Val47/alkyl | 4.17 and 4.47 3.99 3.54 and 4.01 3.86 4.54 |
 Ethyl phenylacetate | −6.9 | His175/HB Trp51/HB; pi-pi Leu171/pi-sigma Ala174/alkyl Arg48/alkyl | 2.19 2.75 and 4.49 2.74 4.46 3.68 |
 1-Octene | −5.3 | Trp51/pi-alkyl Leu171/alkyl Ala174/alkyl Arg48/alkyl Val47/alkyl Phe158/pi-alkyl Phe266/pi-alkyl | 4.39; 4.39 and 4.08 4.47 and 4.88 3.84 4.22 4.54 4.67 3.87 |
 Ascorbic Acid | −5.8 | Lys179/HB Asp37/HB Arg184/HB Pro44/CHB Val45/CHB Arg48/CHB Gly178/CHB | 2.03 and 2.49 2.31 2.34 2.82 2.45 2.96 2.41 and 2.67 |
| Chemical Reactivity Indices (eV) | Ethyl Phenylacetate | Thymol |
|---|---|---|
| EHOMO | −6.555 | −5.722 |
| ELUMO | −0.206 | 0.171 |
| ΔE = ELUMO − EHOMO | 6.349 | 5.893 |
| Chemical hardness (η = (ELUMO − EHOMO)/2) | 3.174 | 2.893 |
| Softness (σ = 1/η) | 0.315 | 0.345 |
| Electronegativity (χ = −(ELUMO + EHOMO)/2) | 3.380 | 2.775 |
| Chemical potential (μ = −χ) | −3.380 | −2.775 |
| Electrophilicity index (ω = μ2/2η) | 2.274 | 1.330 |
Disclaimer/Publisher’s Note: The statements, opinions and data contained in all publications are solely those of the individual author(s) and contributor(s) and not of MDPI and/or the editor(s). MDPI and/or the editor(s) disclaim responsibility for any injury to people or property resulting from any ideas, methods, instructions or products referred to in the content. |
© 2024 by the authors. Licensee MDPI, Basel, Switzerland. This article is an open access article distributed under the terms and conditions of the Creative Commons Attribution (CC BY) license (https://creativecommons.org/licenses/by/4.0/).
Share and Cite
Abeslami, A.; El Farissi, H.; El Bachiri, A.; Sindic, M.; Fauconnier, M.-L.; Bruneau, E.; Talhaoui, A. Exploring the Physicochemical and Antioxidant Characteristics of Honey from Eastern Morocco: Insights into Potential Health Benefits and Molecular Docking Analysis. Agriculture 2024, 14, 1540. https://doi.org/10.3390/agriculture14091540
Abeslami A, El Farissi H, El Bachiri A, Sindic M, Fauconnier M-L, Bruneau E, Talhaoui A. Exploring the Physicochemical and Antioxidant Characteristics of Honey from Eastern Morocco: Insights into Potential Health Benefits and Molecular Docking Analysis. Agriculture. 2024; 14(9):1540. https://doi.org/10.3390/agriculture14091540
Chicago/Turabian StyleAbeslami, Azzedine, Hammadi El Farissi, Ali El Bachiri, Mariane Sindic, Marie-Laure Fauconnier, Etienne Bruneau, and Abdelmonaem Talhaoui. 2024. "Exploring the Physicochemical and Antioxidant Characteristics of Honey from Eastern Morocco: Insights into Potential Health Benefits and Molecular Docking Analysis" Agriculture 14, no. 9: 1540. https://doi.org/10.3390/agriculture14091540