Article

Colombian Crop Resilience: Evaluating National Yield Stability for Fruit and Vegetable Systems

by
Sebastian Parra-Londono
*,
Jaime Andres Tigreros
and
Carlos Alberto Montoya-Correa
Instituto Técnico Agrícola, Red de Transformación Productiva, Programas Agrícolas, Carrera 12 Nº 26 C-64, Guadalajara de Buga 763041, Colombia
*
Author to whom correspondence should be addressed.
Agriculture 2024, 14(9), 1546; https://doi.org/10.3390/agriculture14091546
Submission received: 12 September 2023 / Revised: 30 September 2023 / Accepted: 3 October 2023 / Published: 6 September 2024

Abstract

:
In recent years the yield of fruits and vegetables has been decreasing, threatening Colombia’s food security. Analysis of crop production data may lead to identifying cropping systems that have shown better adaptability to changes in climatic and non-climatic factors associated with agricultural production. The open database AGRONET keeps data on the agricultural activities conducted in Colombia, allowing us to find the information organized by crops, regions and years. Aiming to identify resilient crop systems in Colombia, agricultural data on fruits and vegetables were analyzed. First, trends in crop production were studied by year and location, detecting the regions and crops with the highest yields in the period from 2006 until 2020. Then, mixed linear regression and principal components analysis were applied to elucidate the relation between non-climatic factors and crop yield. In Colombia, vegetable production was more efficient than fruits, observing yields of 10.23 and 13.33 t ha−1, respectively. On the other hand, the Colombian central region showed high yields for vegetables, while for fruits this was exhibited in northern and eastern locations. In the present study, yield variation responded to changes in the location of crop systems, while years had no effect on vegetable production. Furthermore, the price of the agricultural product and the cost of fertilizers were associated with the yield of the analyzed crop systems. In Colombia, carrots, cabbage, tomato papaya and pineapple are resilient crops whose yield increases, especially in the regions where they are cultivated.

1. Introduction

Colombia is one of the most biodiverse countries in the world and has the third most plant species. This biodiversity is represented in the different crops grown nationally as well. In recent years, the fruit and vegetable species with higher export amounts have been lemon, pineapple, onions and tomato, generating earnings of USD 36 million [1]. In 2021 Colombia’s GDP increased by 11% compared to 2020 and agricultural activities sharing from 2005 to 2021 has been 7.0% on average [2]. In the country, around 50 million hectares are used for cattle, forest and crop production and cultivated area in 2019 was about 4.6 million. For the same year, the fruits and vegetables system covered approximately 505.164 and 288.212 hectares, respectively [3].
Since fruit and vegetable production is very important for the country to improve economic development and national food security, a comprehensive knowledge of these crops is crucial, especially a description of the yield trends during this time. Recently, this is becoming predominant to understand how food and crops are produced and to determine the impact of environmental, social and economic factors on the cultivation system [4]. Furthermore, it is important to consider the challenges imposed by climate change, which have affected agricultural activity worldwide and are threatening global food security [5,6]. It has been estimated that by 2050, crop yield should increase up to 60–110% to fulfill food needs, while negative impacts of agriculture on the environment and climate changes must be reduced [7,8,9].
The improvement of national agricultural activities may start by analyzing historical data on crop yields [10,11], leading to identifying the resilience of agricultural systems based on climate and non-climate changes [12]. Most of this type of research has been conducted with cereals, where it has been found that yield reductions respond to rainfall and temperature variability resulting from CO2 increases, which produces agricultural management changes, mainly in sowing and harvest time [13,14].
Since climatic and non-climatic factors affect crop development and yield, optimal crop management must improve agricultural productivity by increasing the efficiency of the cultivated area. For instance, Deryng et al. [15] simulated the effect of climate and agricultural management on global agricultural production, modeling global crop yield and demonstrating the effect of planting and cultivar choices avoiding productivity losses. Colombia has a large environmental variability along its land extension and crop yields may change when different locations are compared since a location’s productivity is determined by both climatic and non-climatic factors [16]. It is crucial to elucidate the effect of climatic and non-climatic variables on fruit and vegetable productivity, achieving a deeper knowledge of the different factors that induce variability in crop yields. In Colombia, several fruits and vegetables are produced in hillside areas, where the environmental and social conditions are quite different from the lowlands. Hillside agricultural systems deal with technical, technological, environmental, social and economic challenges [17]. For instance, the Colombian Andes show steep slopes, heavy rainfall, fragile soils, adverse geographic conditions for tillage and low incomes in the population [18]. The most determinant factors on crop productivity on hillside systems are degraded soils and soil erosion, which increase with the slope inclination and inappropriate agricultural practices [19]. Although hillside farming is one of the oldest agricultural techniques, there are practical challenges. For instance, cultivation systems have low technification, and farmers still use simple tools, low inputs and local traditional practices, which increase the labor requirement in agricultural management. Hillside farming shows low yields compared to highly technified farming systems in flat areas, resulting in low incomes for the smallholders and poor economic and social development [20].
The assessment of yield stability may be used to determine the importance of a crop system and its resilience over time. This evaluation reflects the effect of agricultural and environmental factors on crop production, which can be used to make important decisions for improving farmers’ practices [21] and identifying the influence of climate change on crop performance [22,23]. Yield stability can be evaluated using several methods, which are mainly focused on the analysis of plant–environment interaction and its effect on productivity. For instance, the yield variable has been used to evaluate crop stability over time and responses to climatic and non-climatic parameters. Yield means and variance of maize, soybean and wheat in Canada were calculated to examine the effect of agricultural practices on the cultivation system. The analysis showed that input amounts and technification levels have impacts on crop yields [23]. Research in this field is focused on understanding the effect of climate variables on crop yield, especially in cereal species [22,24,25]. Also, the effect of temperature, rainfall and solar radiation on crop productivity and stability has been analyzed and predicted using database analysis [26,27,28].
Crop yield prediction under climate change is crucial for food production [29]. This kind of information is quite important for national food security and might be used to make decisions about food distribution and the import and export rates of agricultural products. Agricultural databases are widely distributed and implemented to uncover trends and design national crop management strategies based on data analytics. Farmers may use this information to improve agricultural practices and investment decisions [25]. The information on the national crop productivity is crucial in other industries such as seed, fertilizer and agricultural machine production [11,30]. Linear regression models are an approach to examine crop production data. These are extensively used to predict yields and observe the effect of different variables [21]. Furthermore, mixed linear models (MLM) are utilized to understand crop–environment interactions, determining the outcome of fixed and random effects on productivity. Mixed linear models are used to visualize crop yield stability and the impact of associated factors, as well [26]. Recently, multivariate analyses have been used to analyze crop productivity, combining several climatic and non-climatic variables. Principal component analysis is implemented to understand productivity changes, identifying the effect of environmental variability on crop yields [31].
The objectives of the present research are: (i) characterize fruit and vegetable productivity in Colombia from 2006 to 2020; (ii) identify fruit and vegetable crops with high yield stability; and (iii) determine differences among national regions and the effect of non-climate variables on crop productivity.

2. Materials and Methods

2.1. Description of the Database and the Collected Information

Colombian agricultural data on crop productivity by farms were collected from the AGRONET database [32]. This database was developed and administered by the National Agricultural Ministry. The variables available in the database were: (i) crop agricultural productivity; (ii) agricultural commodity prices; and (iii) agro-inputs prices of fertilizers, fungicides, herbicides and insecticides. This information is grouped by regions, locations and crop species, and it is also organized by years from 2006 until 2020. Since the database contains information for all the crop species produced in Colombia, the data was filtered by crop species category, selecting only fruits and vegetables. The data was analyzed using the R software [33] as described as follows.
Data analyses were conducted using descriptive and inferential statistics. These were implemented to describe the agricultural productivity of fruits and vegetables crops in Colombia for 15 years, and also to uncover the trends of different non-climatic factors associated with the industry. Multivariate analysis was used to study the collected data. First, data variability was analyzed to identify outliers in the sample, which were filtered using an outlier test. The filtered data set was used to describe fruit and vegetable productivity in Colombia from 2006 until 2020.
An additional database showing agricultural practices in Colombia for the year 2018 [32] was used to validate the results observed when agricultural trends from 2006 until 2020 were analyzed. This database stores information on agricultural practices for 36 different major crops, showing the number of agri-inputs used by farms, crop yield and selling information of the agricultural products.

2.2. Description of Agricultural Productivity for Fruits and Vegetables in Colombia

Data variability of fruits and vegetables cropping systems was analyzed for the variables cultivated area (CAR), harvested area (HAR), total production (PRO) and yield (YIE). Then, trends of the agricultural productivity by type of crop were compared using annual means to display the current Colombia situation for fruits and vegetables. Comparisons among regions were conducted using the variable YIE to identify national regions with strengthened fruit and vegetable systems. The analysis was targeted at YIE because the result of this variable reflects the impact of climatic and non-climatic factors associated with the agricultural system [21]. Crop species contrasting was used to describe the local situation for fruits and vegetables in Colombia. Crops with the highest YIE were analyzed thoroughly. Similar analyses were conducted for the variables: commodity price (CPR), fertilizers price (FRP), fungicides price (FUP), herbicides price (HEP) and insecticides prices (INP). These variables were regarded as associated with the system production and used to explain the variation in crop productivity. Prices of the agricultural inputs are determinants of the practices applied by farmers in the system management, especially for smallholders, which have a lower accessibility to these products.

2.3. Evaluation of the Crop Yields to Analyze Agricultural Systems Stability

Yield data from 2006 until 2020 was used to determine the highest productive agricultural system in Colombia among regions. First, fruit and vegetable crops with the largest means for the YIE variable over time were identified; then, those that were cultivated at least in 15 different regions, were selected. Mixed linear models (MLM) were applied to those crops previously selected to assess the stability of the cropping systems in the country. The variation caused by time (year) and location (department) in the agricultural systems was determined (Equation (1)). This methodology is described by Piepho [21]. The stability of the yield variable accounts for a random effect that is not considered by the model, high values imply low stability of the crop. The MLM for each selected crop was applied using the R lme4 package [34]:
y i j = μ i + υ j + e i j
where y i j is the mean of the yield of a crop by a certain year and region, μ i is the fixed effect caused by the region where the crop was cultivated, υ j is the random effect due to the year when the crop was cultivated and e i j is the residual effect of the model. Since agricultural practices used by farmers may be controlled but differ among regions, locations were considered as a fixed effect. On the other hand, changes in climate conditions by year may be stochastic, and then year was used as a random effect in the model.

2.4. Analysis of Non-Climatic Factors on Agricultural Productivity among Colombian Regions

Principal component analysis (PCA) was used to determine the impact of non-climatic variables, CPR, FRP, FUP, HEP and INP on crop variables CAR, HAR, PRO and YIE. The PCA merged all the data used in the analysis to calculate independent composite variables (principal components) that account for the variance in the original data set. PCA may be used to identify which variables are more related to them. Before the analysis, a database combining agricultural productivity and non-climatic variable prices was constructed. This was conducted assuming that CPR, FRP, FUP, HEP and INP are related to CAR, HAR, PRO and YIE by the crop cultivation region and year. Then, this database was used to conduct PCA on standardized data. Data standardization was done using the z-score [35]. The PCA was run in R software using the package Factominer [36]. This analysis was done to complete the fruit and vegetable data set and also to the previously selected crops.
The results obtained with the data set for agricultural production from 2006 until 2020, were compared to a data set of agricultural practices in Colombia for the year 2018. This data contains information on agricultural activity in Colombian farms, showing holders’ practices about agri-inputs application. First, selected fruits and vegetables crops were analyzed by comparing YIE means among Colombia regions. Analysis of variance (ANOVA) was applied to determine the significant difference in crop productivity. Then, data on the amount of fertilizers, herbicides, fungicides and insecticides were correlated to yield. This data was collected and structured by Colombia’s National Administrative Department of Statistics (DANE), selecting 1942 farmers and assessing yield and several agricultural practices by farm, like the amount of agricultural inputs used and management costs. The data set of 2018 was used to compare the results of the agriculture sector observed from 2006 to 2020 in the country.

2.5. Conceptual Framework Applied in the Study

The methodology applied in the present research is presented in the following conceptual framework, which shows the rationale used to identify resilient fruit and vegetable systems in Colombia and the impact of locations and non-climatic variables (Figure 1).

3. Results

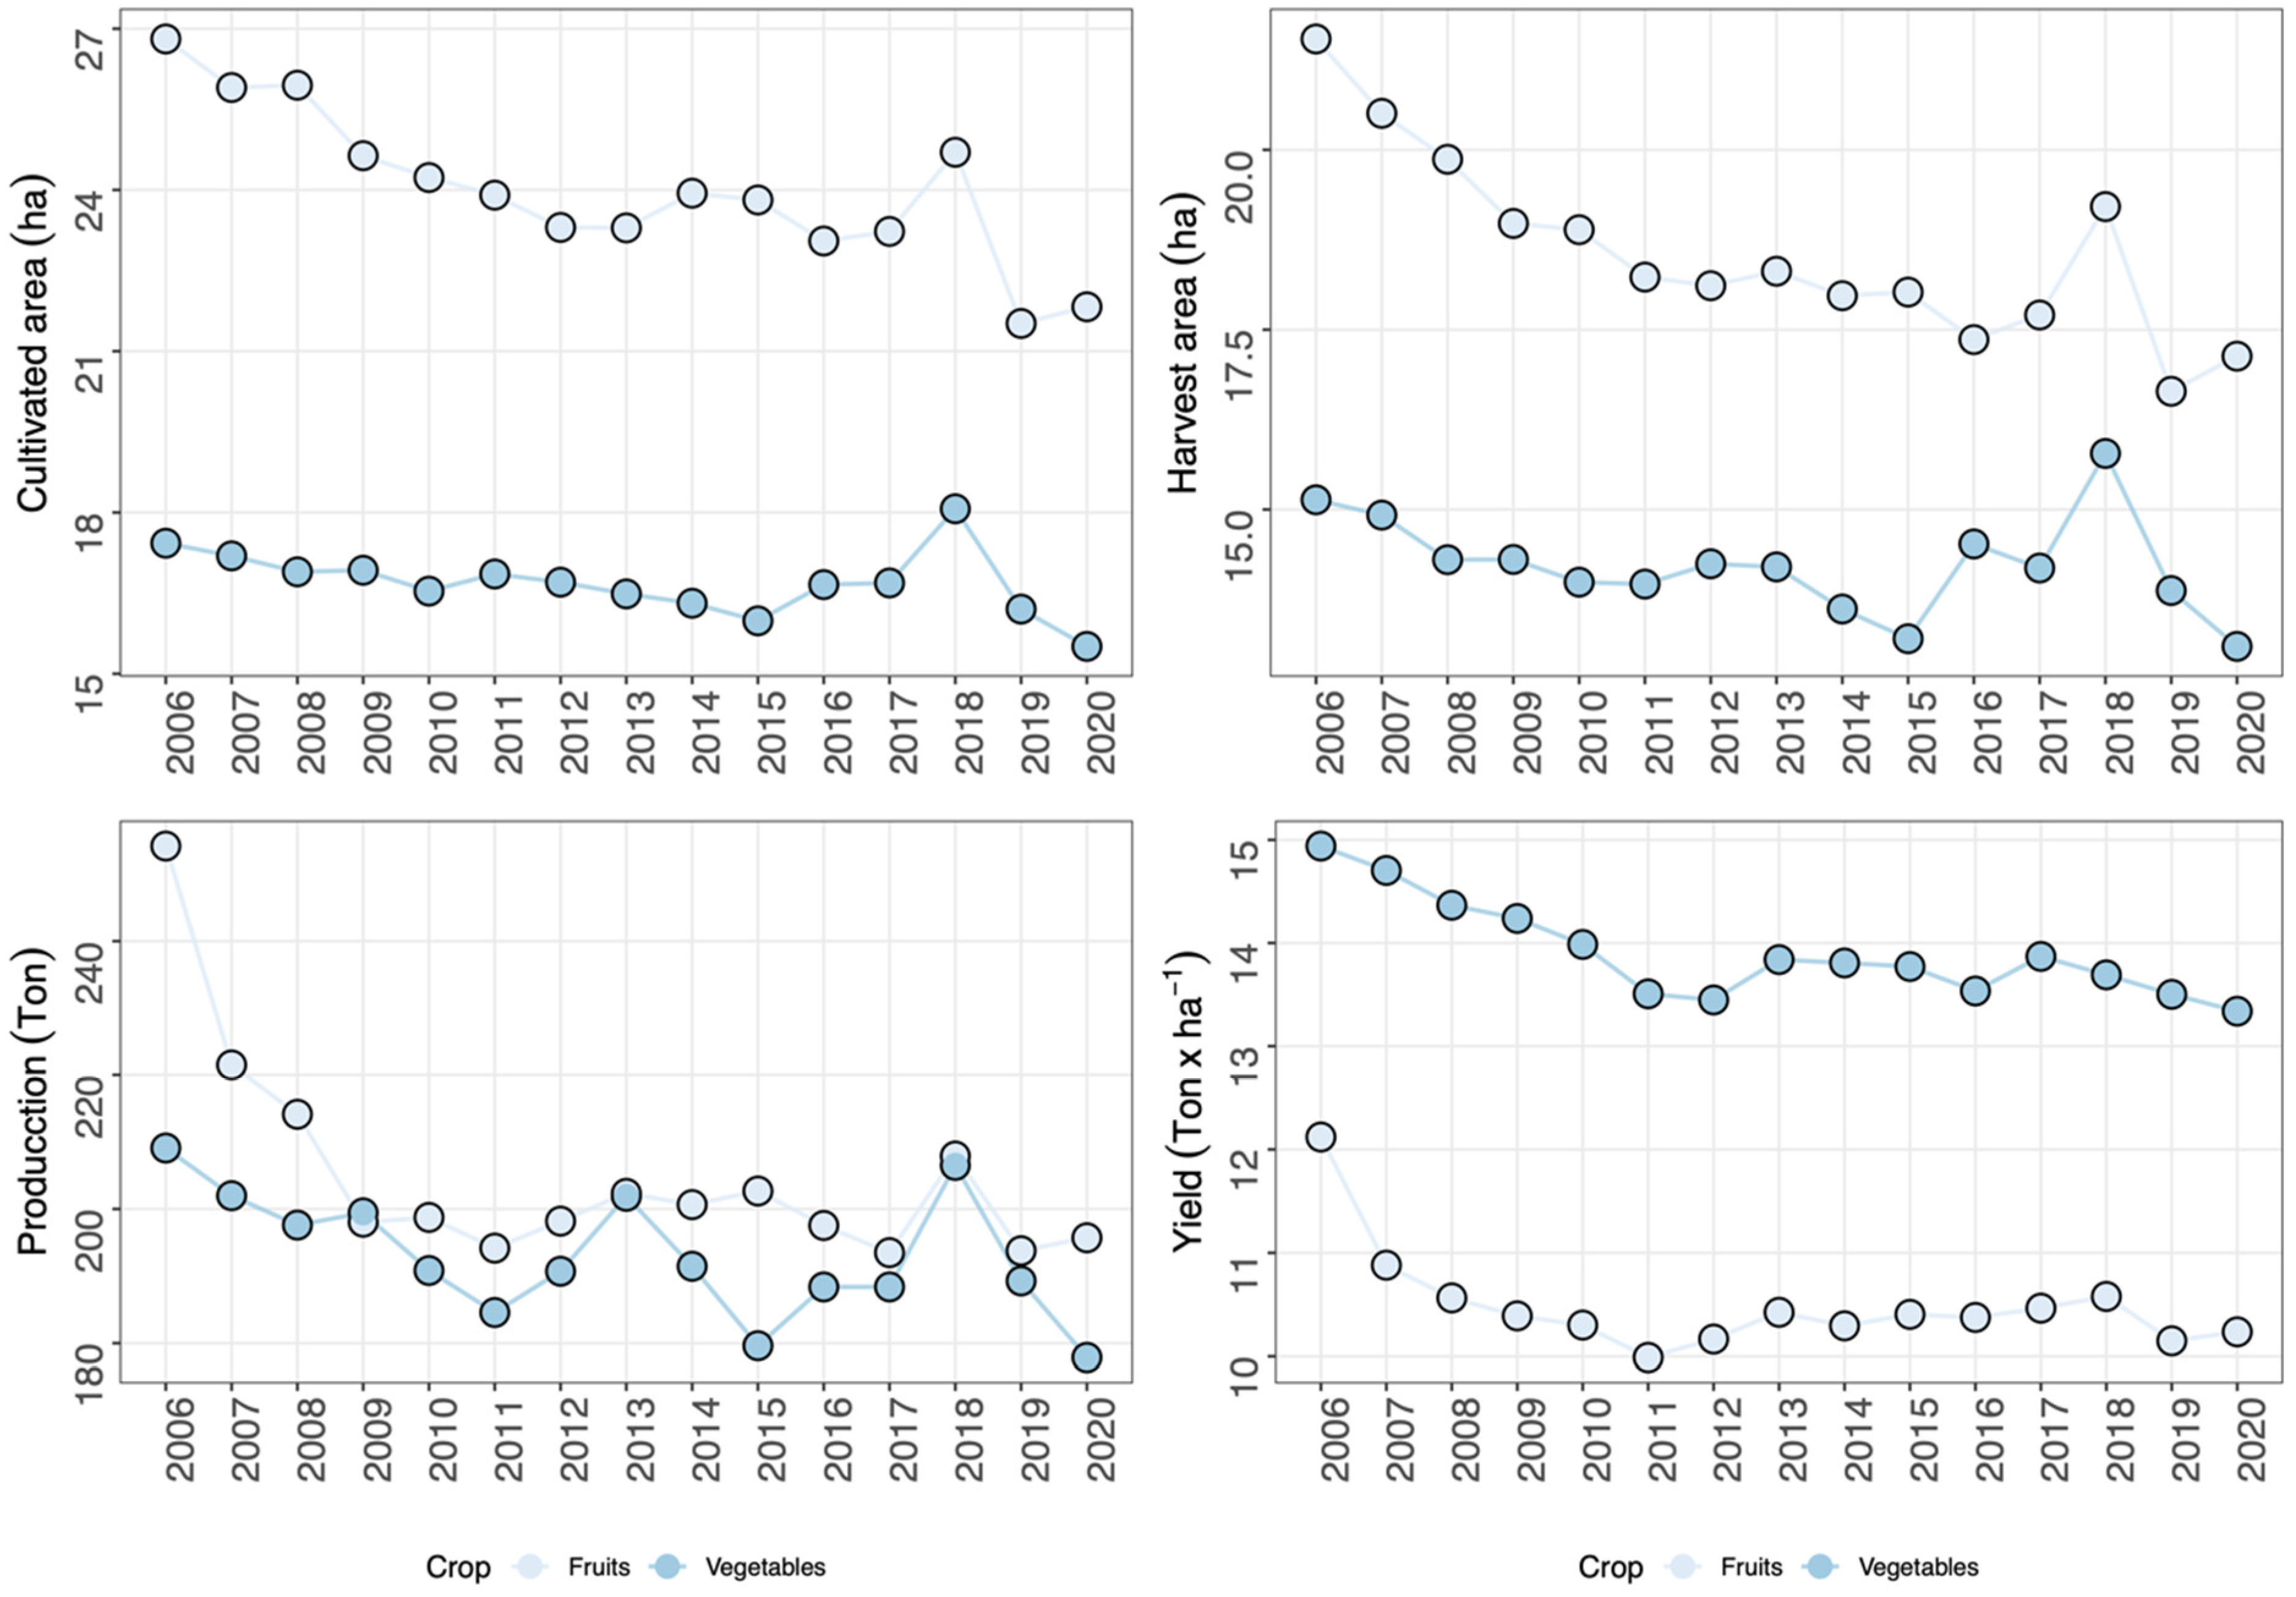
3.1. Decreases of Fruits and Vegetables Yield in Colombia

Data trends for vegetable and fruit systems were analyzed, initially, grouping the information by type of crop; then, variables were arranged by year and region, to understand agricultural tendencies in Colombia by time and location. Data distribution of the variables cultivated area (CAR), harvest area (HAR), production (PRO) and yield (YIE) show wide variability for fruits and vegetables in Colombia from 2006 until 2020 (Figure S1). In the last 15 years, it was observed that CAR in Colombian farms may diverge from one to more than 100 hectares for both fruit and vegetable cropping systems. This means that CAR, HAR and PRO have been higher for fruits than vegetables; however, YIE has been higher for the second at the same time. Furthermore, data shows that vegetable systems used less area than fruits for sowing (Figure S1). On the other hand, the means of analyzed variables decreased from 2006 until 2020, with a minor increase in 2018. Nonetheless, it is clear that the YIE of fruits and vegetables has widely decreased in Colombia, reaching values of 10.23 and 13.33 tons × ha−1, respectively, in 2020. CAR and HAR showed similar trends during the time (Figure 2), which might be a national concern for the agricultural sector. In 2018 the amount of fruit and vegetable production increased in Colombia; however, YIE remains similar to previous years, indicating such increases relied on larger cultivated areas by farms (Figure 2).

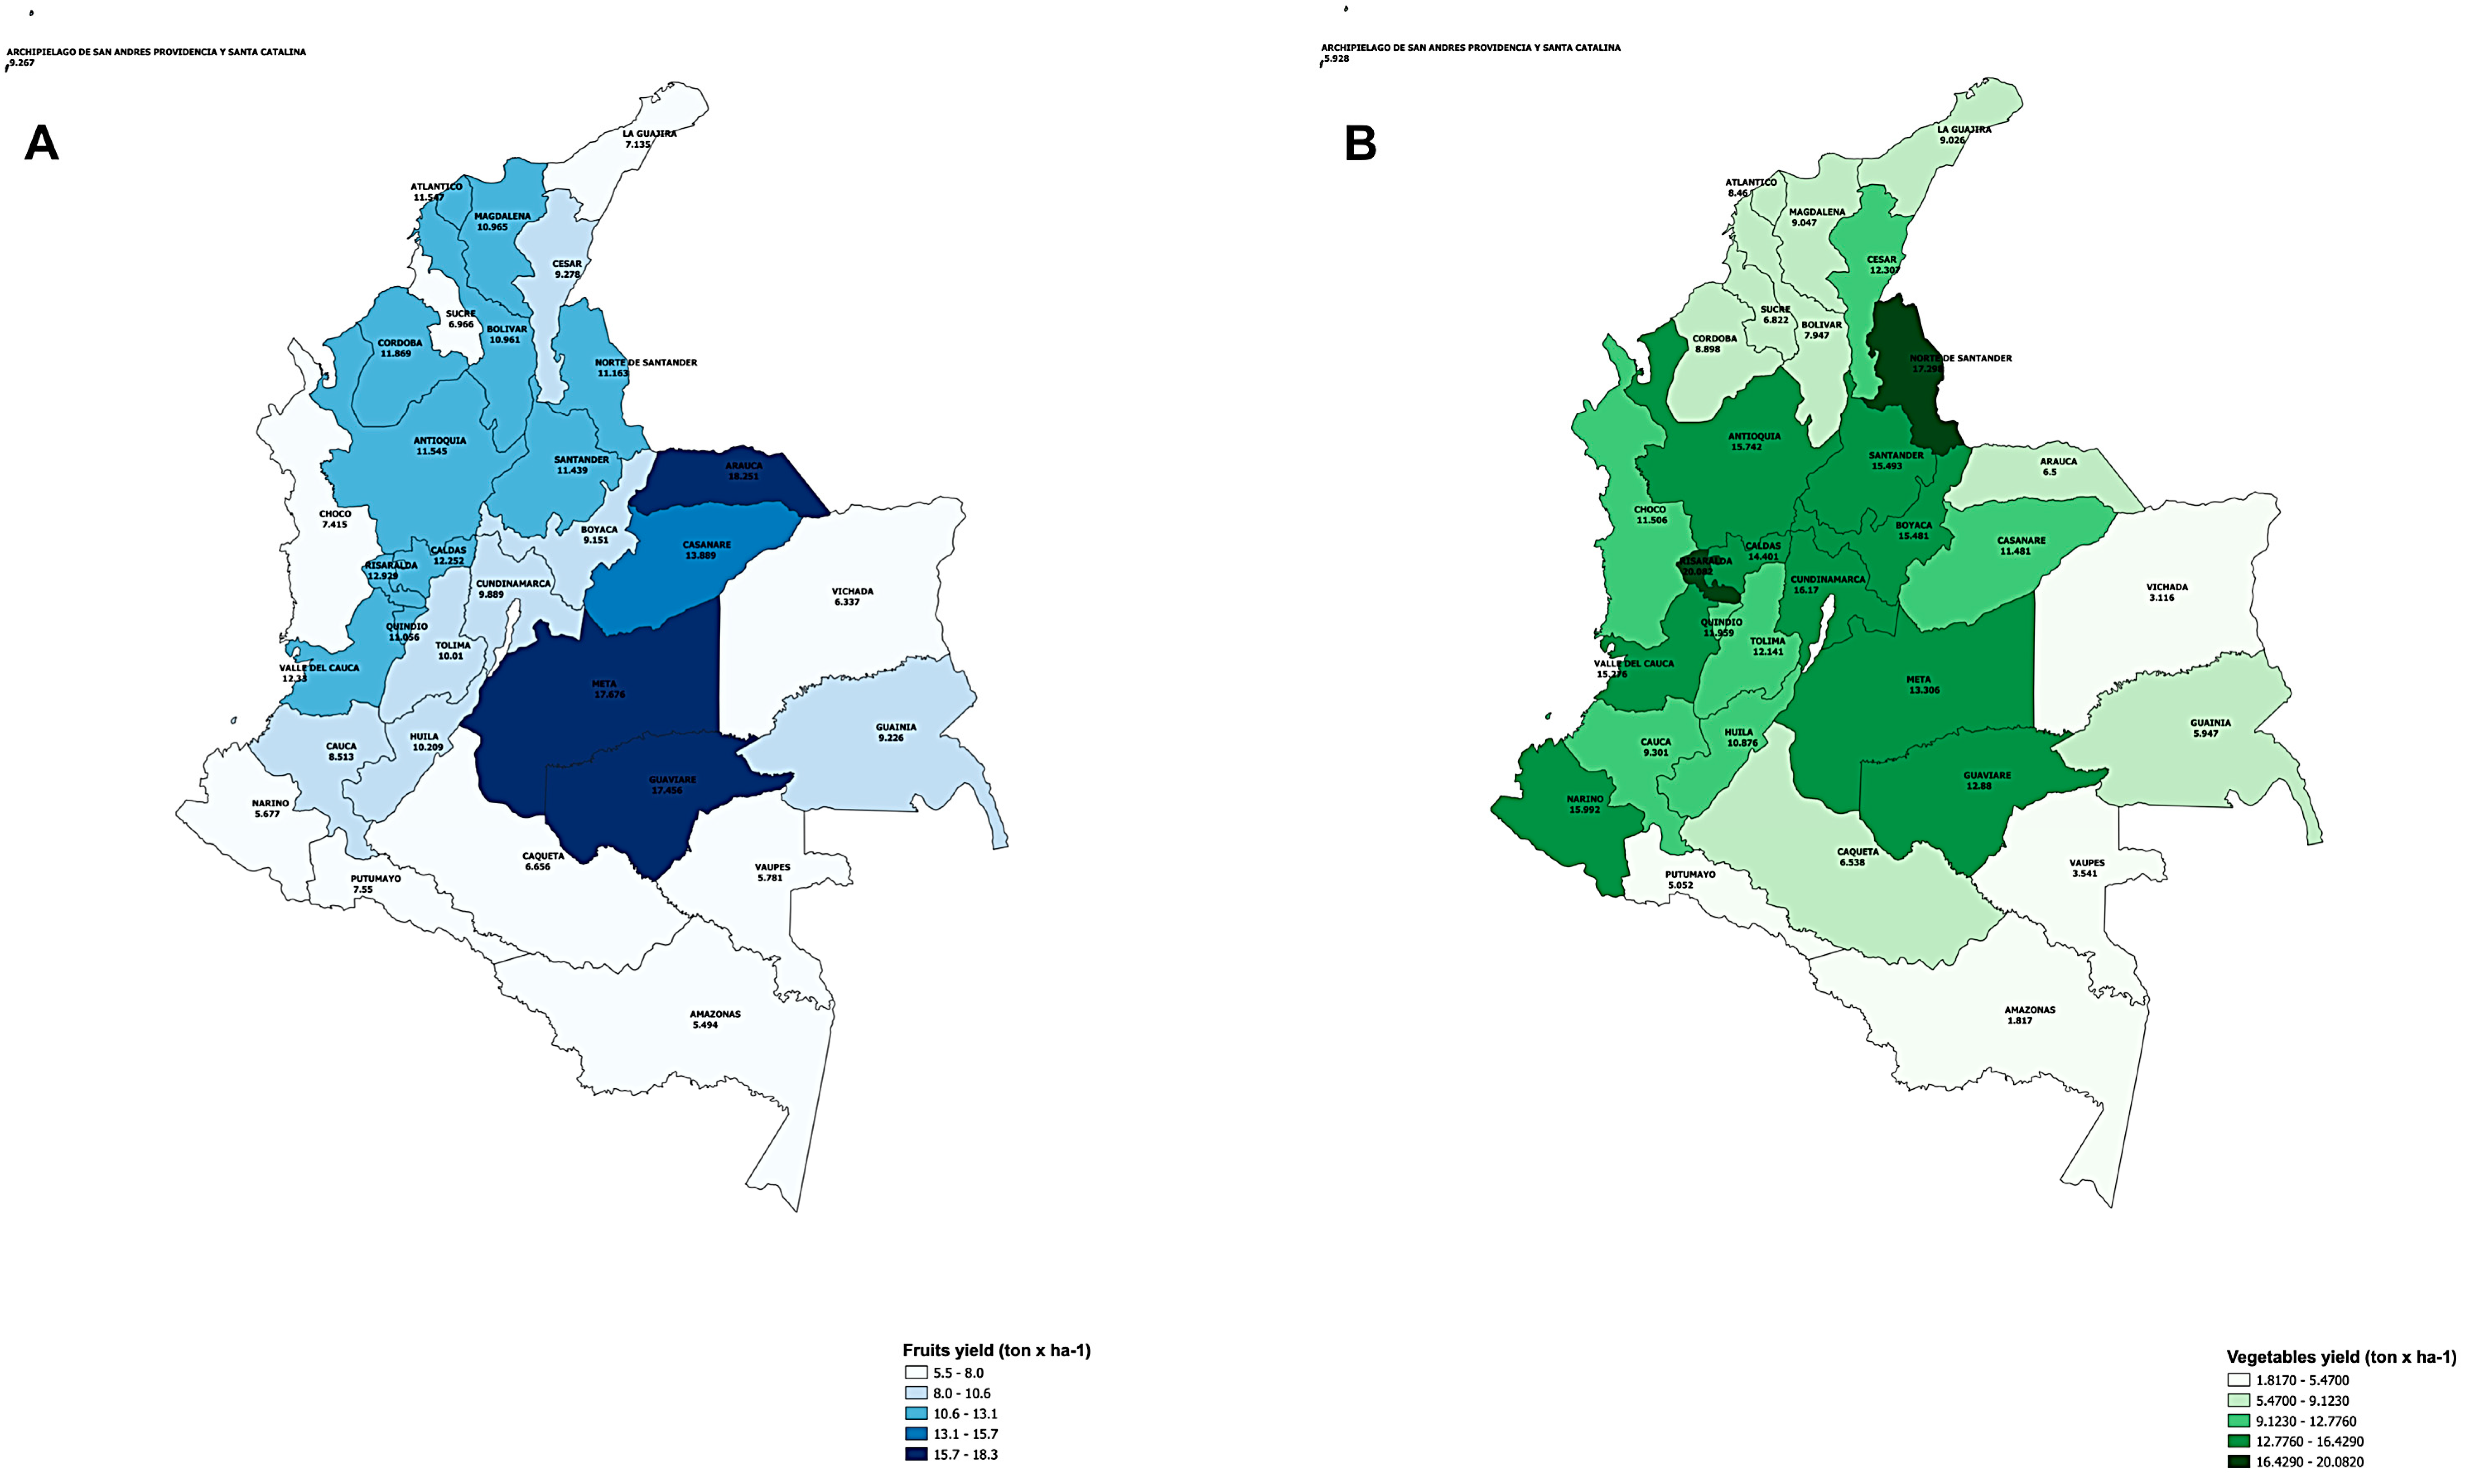
3.2. Local Production of Fruits and Vegetables in Colombia

Yield analysis for fruit and vegetable systems in the last 15 years shows that farms in Arauca and Risaralda have the largest values, with an average of 18.25 y 20.08 tons × ha−1 for fruits and vegetables, respectively. Furthermore, farms at locations such as Valle del Cauca, Antioquia and Santander, among others, had higher YIE for both fruit and vegetable crop systems. Amazonas, Vaupes, Vichada and other regions located in southeastern Colombia showed the lowest values for YIE. For fruit production, western locations showed higher YIE values, while for vegetables this was observed in central regions (Figure 3). In Colombia, the fruit crop with the highest yield is papaya with mean values of 17.57 tons × ha−1, while cauliflower, with 20.63 tons × ha−1, is the vegetable showing the largest values. Farms cultivating strawberry, grapefruit, pineapple, carrot, cabbage and tomato showed high yield values as well. Larger variabilities in YIE were observed for crops like carrot, cabbage, grapefruit, strawberry, melon and lime, while leek and badea showed less variation (Figure 4).
Yield comparison between fruits and vegetables exhibits a wide difference for these two kinds of crops. This result shows vegetable systems are more productive than fruit systems in Colombia, using the CAR more efficiently. On the other hand, fruit species with the highest YIE were those typically cultivated in farms of lowlands such as papaya, grapefruit and pineapple. The stability analysis, conducting a MLM for the productivity of Colombian farms, displays that time (random factor) had a small variance across the farms at different locations on YIE of fruit and vegetable systems. However, the fixed factor showed a large variance, indicating that the locations of the agricultural system considerably impacted the YIE augmentation. Model residual values were high and indicate that other factors should be used to understand the variability in the evaluated crops (Table 1). Locations showed a large positive impact on crops like tomato, papaya, pineapple and other citrus, which are mainly cultivated in lowlands. Departments such as Boyaca, Caldas, Cauca, Cundinamarca, Norte de Santander, Santander, Tolima and Valle del Cauca, had a diversity of agricultural systems; however, for some crops the impact of the location was negative. The largest negative effect was observed for cabbage in Cauca. For lettuce and passion fruit, location was a determinant in increases and decreases of YIE (Table 1).
The database from 2018, which contains information about agricultural activities, practices and management of 1942 farms in Colombia, was used to contrast the trends observed in the data for fruit and vegetable production from 2006 to 2020. When the selected crops were compared, it was observed that the location of the farms had an effect on all the cropping systems, except for lime (Figure 5). Meta showed the highest YIE for papaya, melon and passion fruit, while Risaralda for tomato and pineapple. Arauca shows high values of production for passion fruit, papaya and other citrus. Large variability on YIE was observed in the cropping systems of onion, lime, melon, papaya and tomato located at Quindio, Narino, Caldas, Bolivar and Putumayo, respectively. For fruits, the highest YIE was obtained in pineapple, with values over 30 tons × ha−1, while for vegetables, tomato reached yields over 25 tons × ha−1 (Figure 5).

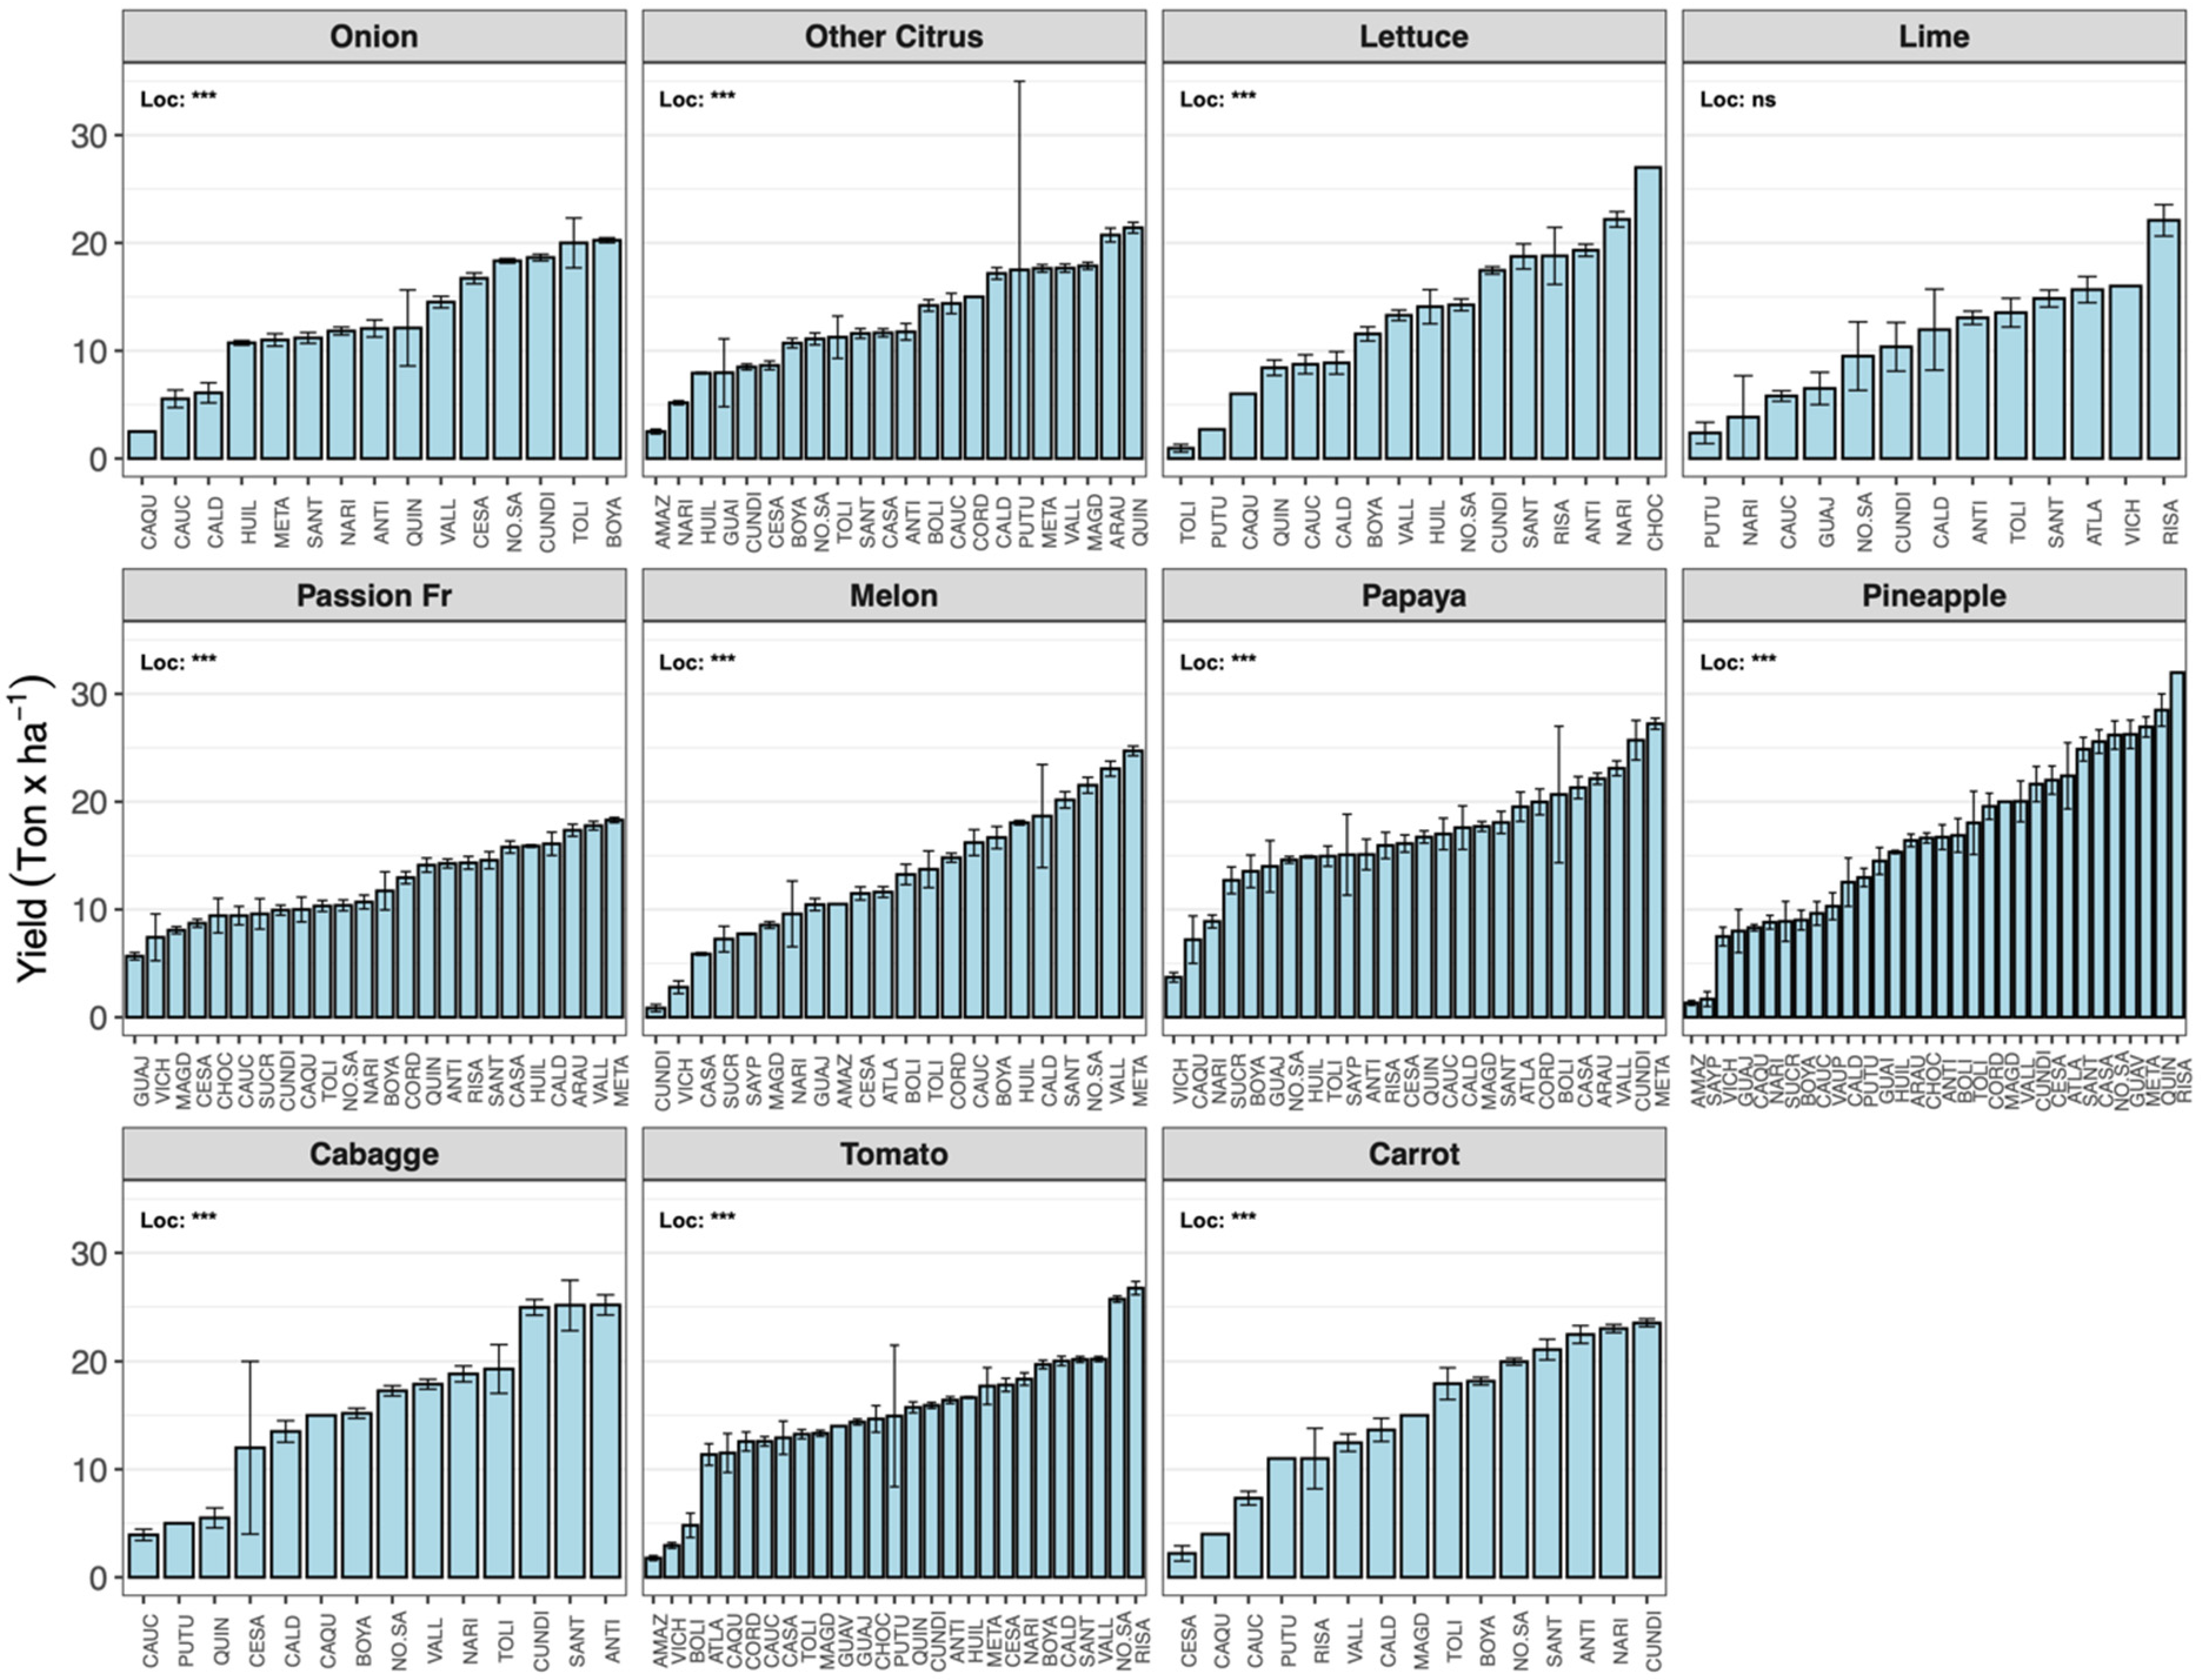
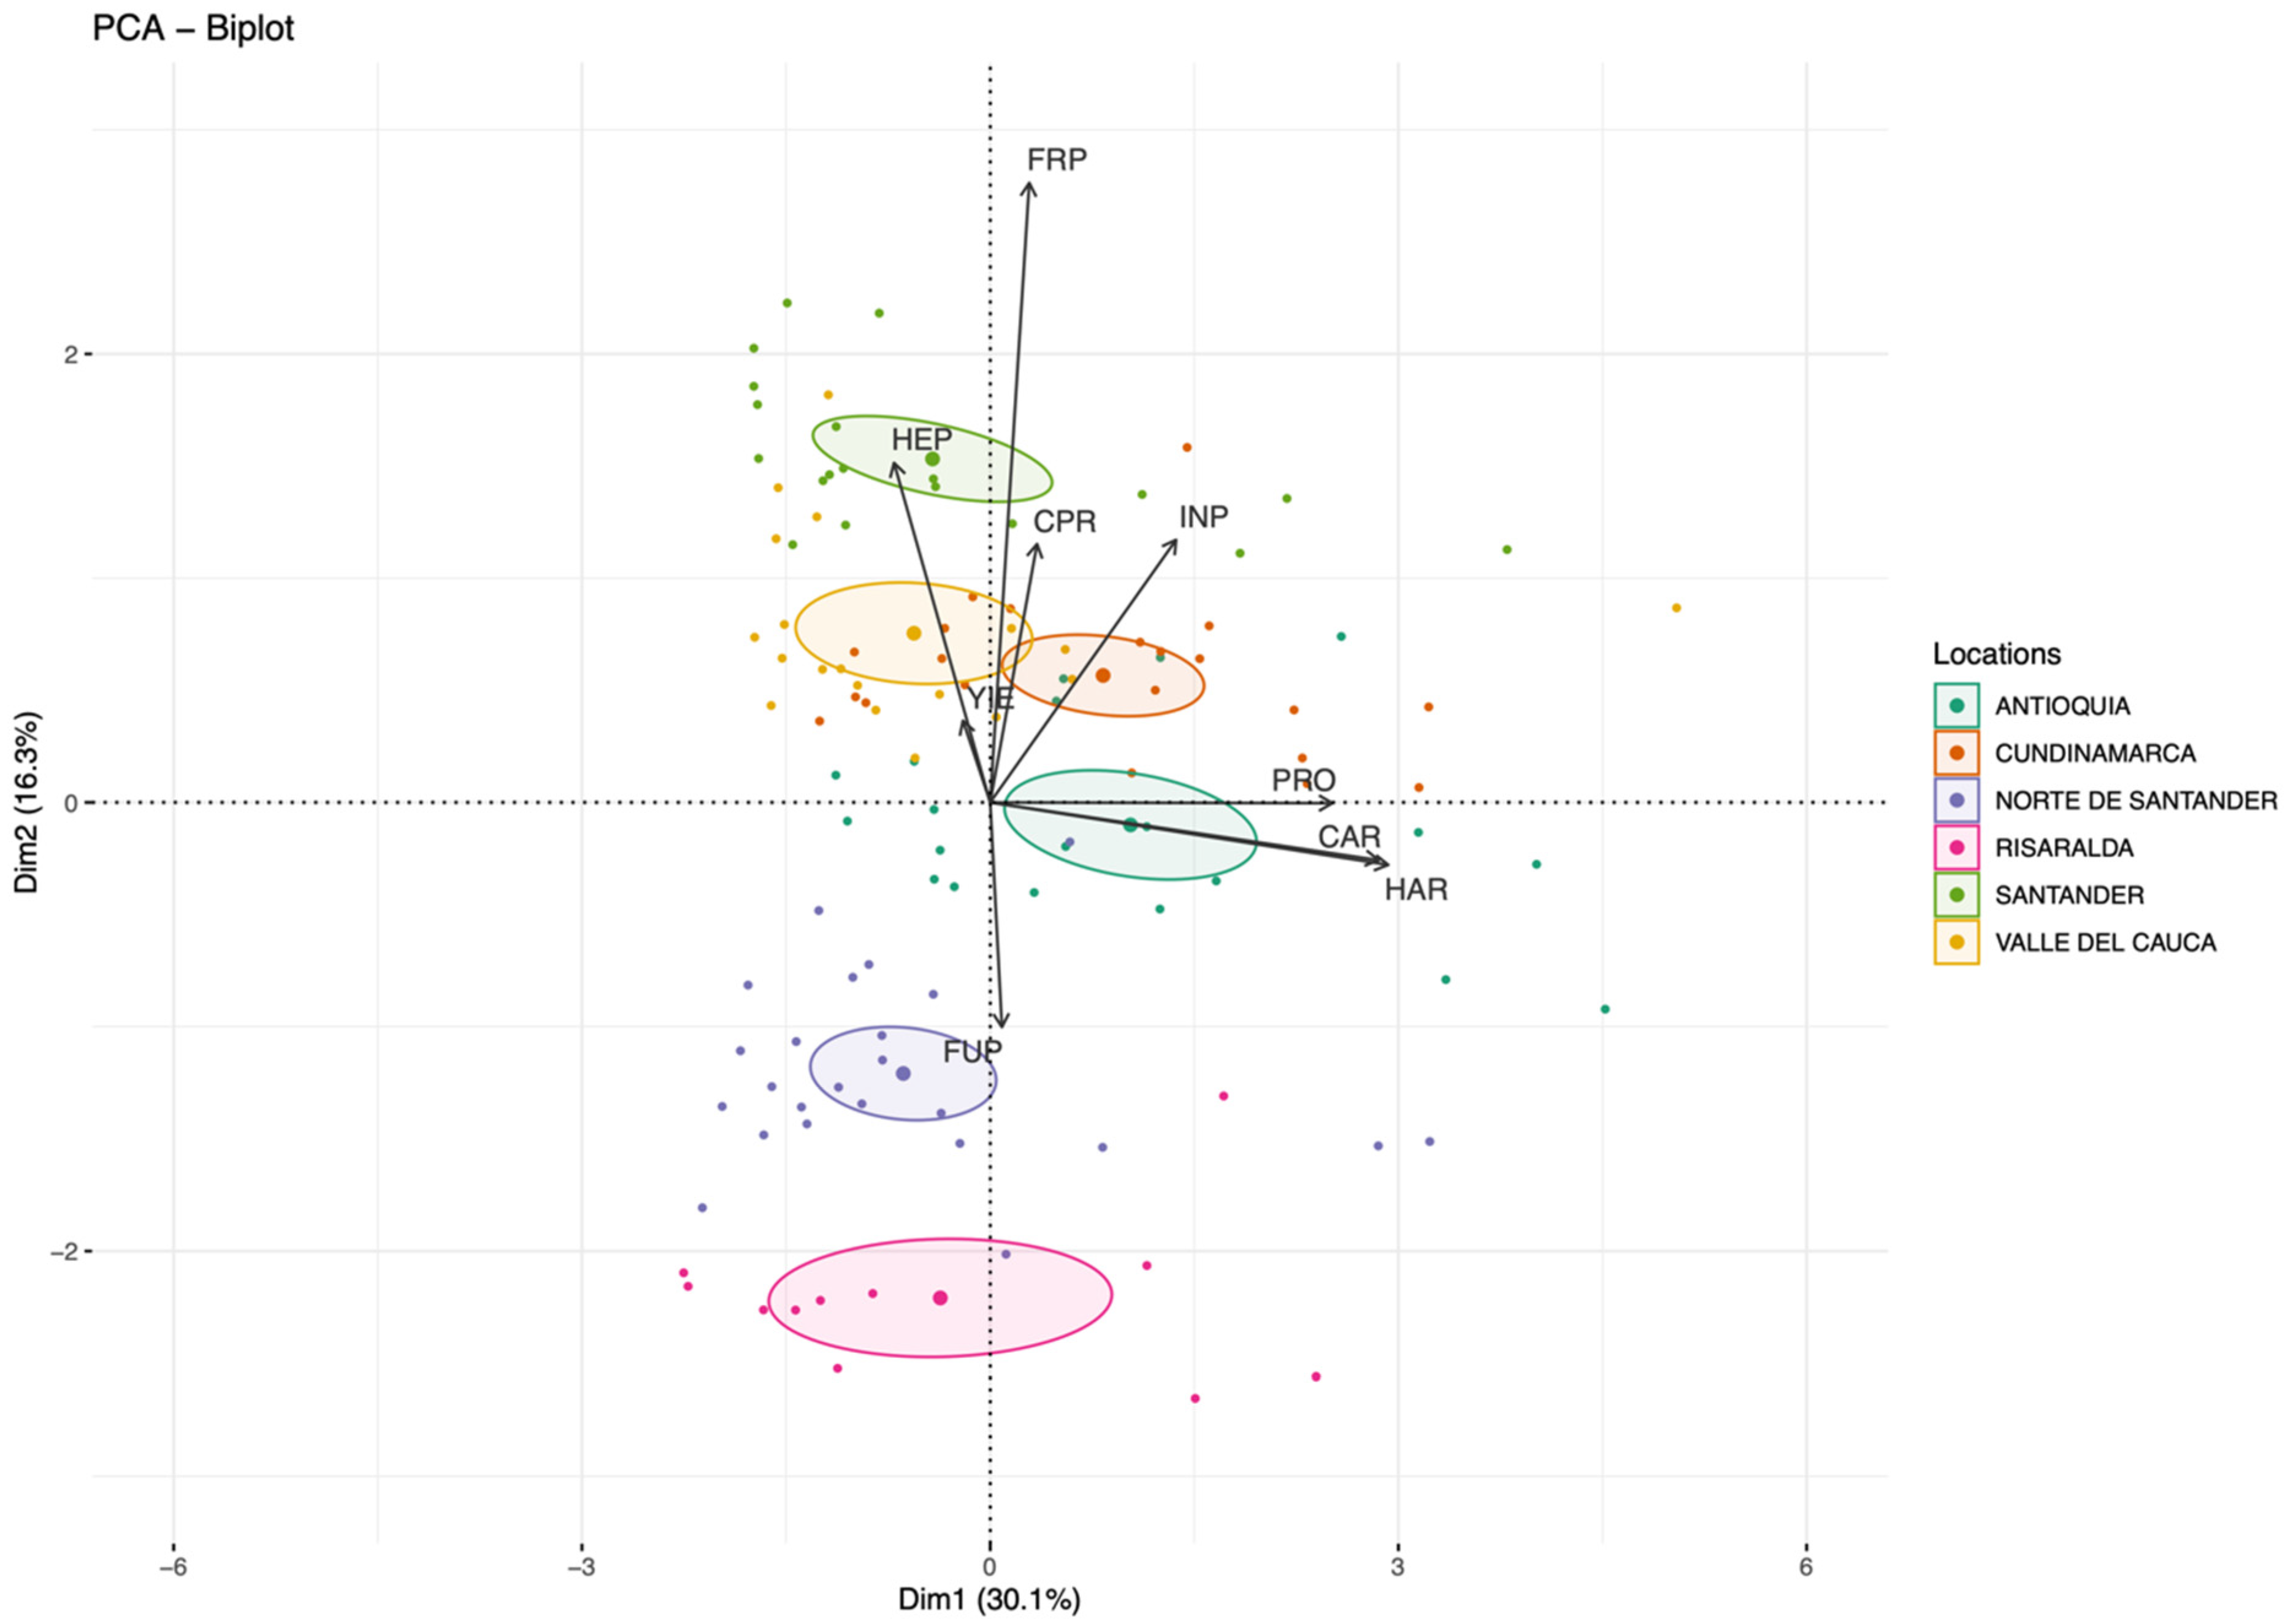
3.3. Yield Evaluation and the Impact of Non-Climate Factors on the Agricultural Systems

A large variability was observed for the crop prices (CPR) and the agri-input values in Colombia from 2015 to 2019. Crops such as lemon, onion and cantaloupe showed the largest variability in commodity prices during this time, due to the unsteadiness of markets (Figure S2). Otherwise, crops like pineapple and carrots had stability in commodity prices, even when they were low. The lowest prices were observed for papaya, green beans and tomato for the evaluated time in Colombia (Figure S2).
Agri-input prices in Colombia have large variability and several outliers in the evaluated locations. The highest prices were especially observed for biocide products. Arauca is the location with the largest mean for fertilizers and herbicides, while fungicides and insecticides were low. Locations such as Antioquia, Valle del Cauca and Cundinamarca showed middle values for prices of all the agro-inputs (Figure S3).
The analysis of the effect of these variables, described above, on the agricultural systems variables CAR, HAR, PRO and YIE was conducted using PCA. First, mean prices for all the agri-inputs and commodities were matched with the means for agricultural data based on the locations and years. The final data set comprised information for Antioquia, Cundinamarca, Norte de Santander, Risaralda and Santander y Valle del Cauca. After data standardization, the evaluated variables were merged into independent composite variables (principal components). The analysis shows that two principal components (PC1 and PC2) accounted for 46% of total variation in agricultural data. Crop production, sowing area and harvest area (PRO, CAR and HAR) showed a higher vector loading to PC1 (0.82, 0.93 and 0.95, respectively). Variables YIE, CPR, INP, HEP and FRP showed high vector loading to PC2 (0.12, 0.37, 0.38, 0.49 and 0.90, respectively) and were more related to each other. Vectors for agricultural input prices were larger than vectors for YIE, indicating higher variability for these variables. On the other hand, the results show that most of the locations change especially along the second dimension, while Antioquia, Cundinamarca and Valle del Cauca to the first (Figure 6). When crops were used to group along dimensions one and two, a particular trend was not observed (Figure S4).
These results, the direct influence of agri-input application on yield increase among locations in Colombia, were compared using a database with agricultural data for 2018. The selected crops were used for such validation, finding significant correlations of the yield with the amount of fertilizer applied before crop sowing and during cultivation (Figure 7A,B). The yield was also correlated with herbicide and fungicide applications during crop growth (Figure S5). Highest yields were observed for pineapple during 2018 as well as the amount of fertilizer used for the cropping system. The lowest amounts of fertilizer were used on lime and onion systems before sowing and during cultivation (Figure 7A,B).

4. Discussion

Usually, the selection of a species for the establishment of an agricultural system is based on its economic importance. However, the identification of national strong crop systems may be developed by analyzing productivity trends and the influences of non-climatic variables. The analysis of the fruits and vegetables crops from 2006 to 2020 shows a large variation in agricultural data as a decreasing trend in the variables SAR, HAR, PRO and YIE as well (Figure S1). The described situation is opposite to the food security approach, and it could be an issue for the country in the mid and long term. Considering that the population is growing, the changes in diet habits and the agricultural area are limited, crop systems should be more efficient and productive, focusing on increasing yield [37,38]. For instance, in Colombia, the population has increased by 4.2% while the agricultural land 1.6% [39] in recent years, escalating the pressure on the national food system. On the other hand, crop productivity and yield may be reduced by changes in the rural population in the country. It was observed that agricultural activity in Colombia is mainly done by adults between 41 and 64 years old, due to the migration of youths and young adults to urban areas who look for better academic and working options [40]. This situation is decreasing the agricultural activity in Colombia, especially fruit and vegetable crops.
When yield for crops like tomato and orange is compared to the yield in other countries such as Brazil and Chile, it is observed that Colombia had lower values in 2018; however, for lettuce and banana, the same variable is higher [39]. Then, a specific analysis for each crop was conducted, which allowed a comprehensive understanding of the yield stability of fruit and vegetable systems. The data analysis shows that vegetable systems are more efficient than fruit systems, reaching higher harvests in less sowing areas. Since agricultural land is a limited resource, crops with higher productivity in less cultivated areas are meaningful to solve agricultural issues. Even though yield increases can be achieved by enhancing the use of agro-inputs, developing more efficient crop cultivars that suitably grow under sub-optimal conditions is a long-term sustainable approach.
As it is shown by the AGRONET database, Colombia has a large diversity of fruits and vegetables agricultural systems. The foods obtained from these crops provide bioactive compounds to human nutrition, like flavonoids and carotenoids, which enhance human health, improving cardiovascular conditions and protecting against metabolic syndromes [41]. In developing countries, where diet is based on cereals, bioactive and micronutrient intake is deficient, resulting in a hidden hunger. One of the approaches to solve this issue might be nutritional-sensitive agriculture, which relies on the diversification of the agricultural systems and the cultivation of underutilized crops [41,42].
The fruit crops cultivated in the locations Arauca, Meta, Casanare, Guaviare and Risaralda had the highest yields, while for vegetables this situation was observed in Risaralda, Norte de Santander, Cundinamarca, Narino and Antioquia (Figure 3). On the other hand, the strongest crop systems, based on the mean of the yield observed for 15 years, were carrots, cauliflower, cabbage, papaya, strawberry and grapefruit (Figure 4). This calculation, developed using yield data, may reflect the impact of climatic and non-climatic data and agricultural practices. For instance, in Risaralda, where high yield was observed for fruits and vegetables, also the prices of fertilizers were low. A similar situation occurred in Arauca as well, where the yield for vegetables was high and the prices of fungicides and insecticides were low (Figure S2). Agricultural systems such as papaya and tomato had high yields, but the commercialization prices were low in the last years (Figure S1). The described situation displays the issues for analyzing the impact of individual non-climatic variables on crop productivity, which interferes with the identification of stable crop systems for the country’s development. Then, a comprehensive description of fruit and vegetable crops was achieved with further analysis, where agricultural data and non-climatic variables were combined.
The MLM applied to analyze crop production stability, considered Colombian locations as a fixed factor or systematic part, while year a random factor or stochastic part and their relation to YIE. Generally, fixed factor includes classification variable such as region and are used to represent specific conditions assessing a contrast of interest in the study. In comparison with fixed factors, random factors do not represent conditions to meet the aims of the research [43]. Therefore, using the applied model, it was tested how regions and their variation in system management determine agricultural productivity, whereas changes each year are unpredictable. Otherwise, PCA is a useful methodology for conducting a data-driven classification and the biplot can be used to conclude based on a multivariate analysis [44]. In the present study, dimension 2 of the biplot (Figure 6) composed mainly of YIE, CPR, FPR, HPR and FUP was a determinant in the observed variation by locations, indicating such variables may be determinants for farmers in the agricultural management and productivity. Then, the Colombian government must improve agricultural information, achieving data as shown in the database from 2018, where the correlation between crop yield and agricultural practices was tested (Figure 7 and Figure S5).
The results obtained with the mixed regression model and the multivariate analysis indicate that cultivated regions determine productivity regardless of crop species and year (Table 1) for fruit and vegetable systems. The low variance displayed by time, indicates stability in crop productivity, even when the yields were low. Differences in agricultural practices among Colombia regions may explain such variability in yield, affecting national productivity. Otherwise, crops with the largest sowing area showed low productivity due to the use of marginal land that reduces crop yield [23,45]. A similar situation was observed in the present study with fruit and vegetable crops in Colombia. With the PCA, it was found that SAR, HAR and PRO are related to each other positively, and when one increases the others as well. However, YIE is more related to non-climatic variables, indicating that at higher prices of fertilizers and insecticides, yield is largest at the different locations. This situation is observed for the commodity prices and the efficiency of the agricultural system as well (Figure 5). Although PRO improves by increasing SAR and HAR, YIE is reduced, which may indicate agricultural management issues. This result has been previously observed in other investigations, especially when cereal crops are analyzed [46].
Cabas et al. [23], found that non-climatic factors like the units of applied agro-inputs increase the mean of the yield for maize, soybean and wheat. They utilized the “change in input use” that was calculated using the input price and the quantity of purchased input, finding that fluctuations in this variable can influence productivity and cultivated area [23]. Studies conducted in rice systems, using production data from 1992 to 2018 in China, found the expected rice price impacted yield [47]. Also, a study conducted in Canada, where fertilizer prices were evaluated, showed that the increases in this product reduce yield for both crops [48].
Usually, small farmers’ agricultural management relies on increasing fertilizer use; however, research has shown that despite the increased use of inputs, low productivity is observed due to poor soil quality and erratic rainfalls [49]. Increases in agri-inputs prices may decrease the accessibility to these products reducing crop yield. In the present research, a direct relation between YIE and these product prices was observed (Figure 6). This could be explained considering two approaches: (i) a large offer of products and brands, can be found in the database, which differ in prices (data not shown). Then, smallholders have the possibility of buying less expensive products to manage the crop system. (ii) In the last few years, local Colombian authorities have led several subsidy programs for the agricultural sector, that are mainly focused on purchasing fertilizers and pesticides for farmers [50]. These programs allow agri-inputs accessibility, but do not assure adequate management of them.
In the present study crops like carrot, cabbage, tomato papaya, pineapple and passion fruit had the highest yields and low variability caused by the sowing year, this value increases especially in the regions where they are cultivated instead (Figure 4, Table 1). Therefore, a comprehensive understanding of such cropping systems may lead to the development of a reliable strategy to increase national agricultural and food production. Results obtained in the MLM analysis, showing resilient cropping systems such as tomato, papaya and pineapple, might be used to identify better agricultural practices that could be extended nationally, improving knowledge about crop production for the development of innovative, resilient, sustainable and high-nutrition quality fruit and vegetable growing systems.
Previous studies have determined that non-climatic factors such as poverty are related to environmental factors like soil erosion, and decreasing yield of coffee, forages and sugarcane in Colombia’s rural areas [18]. On the other hand, in blackberry agricultural systems, it has been observed that productivity increases when appropriate management practices are applied, even at similar climatic conditions [16]. Also, agricultural management variables like planting and harvesting dates and cultivar choice may reduce yield losses [15]. Based on the results of the present research, Colombia’s national authorities may develop management strategies that strengthen the fruits and vegetables agricultural systems, following the practices applied to regions with the highest yields. For instance, since there is a relationship between the price of the fertilizers and the crop yield (Figure 6), it is crucial to apply plant nutrition handling addressed by crop requirements, optimizing the money investment and reducing soil erosion [8]. Furthermore, it is possible to understand the adaptation of these crops and the agricultural practices to the issues caused by climate change [12], improving the development of the agricultural sector. Therefore, it is important for Colombian authorities and researchers to identify agricultural solutions that may address low productivity in fruits and vegetable crops. Improving fruit and vegetable yields will increase food security that depends on the sustainable use and management of resources [51]. Improving fruit and vegetable cropping systems might be a good strategy to meet the food needs of rising populations and diet shifts [52]. Furthermore, understanding the impacts of climatic and non-climatic factors on fruit and vegetable quality may help to combat “hidden hunger” [53].

5. Conclusions

Based on the results shown by this research, it is concluded that for selecting those agricultural systems to be prioritized and promoted by national authorities, non-climate factors like agro-inputs prices and commodity prices might be considered when modeling agricultural activities. Government organizations like the Ministry of Agriculture and Rural Development should keep monitoring and evaluating crop productivity in Colombia. However, social, economic and cultural parameters should be assessed as well, for improving predictive models, increasing food security and promoting sustainable development goals. Future strategies, designed based on the understanding of resilient cropping systems that may lead to increased crop yields, farm income and input-use efficiency, should be transferred and adopted by smallholders, which is very low in farmers from developing countries [54]. As it is shown in this research, studies at the regional level are crucial, since the information can be used to develop strategies adapted to local communities. On the other hand, national authorities should promote greater crop diversity to reach year-to-year stability of the national yield [26] and improve food security. Agricultural subsidy programs of governments, that have paid around USD 600 billion per year worldwide [55], might be an approach to influence agricultural activities, supporting farmers’ accession to fertilizers, pesticides and improved seeds. Nevertheless, the assistance should be focused on crop production research and development as well, especially on the local development of biologicals as an alternative to traditional products. Then, worldwide and Colombian authorities should minimize the agricultural yield gap and the environmental impact, adapting and elaborating on systems resilience to climate change risks, sustainability and high nutrition quality.

Supplementary Materials

The following supporting information can be downloaded at: https://www.mdpi.com/article/10.3390/agriculture14091546/s1, Figure S1: data distribution and mean (crossed circle) per crop type, fruits and vegetables, of the variables cultivated area (CAR), harvest area (HAR), production (PRO) and yield (YIE) by Colombian farms. Figure S2: data distribution and mean (crossed circle) of commodity prices for fruits and vegetables. Figure S3: data distribution and mean (crossed circle) of agri-inputs prices in Colombia’s national locations. Figure S4: biplots generated from PCA with the percentage of variance explained by the first two components for agricultural and non-climatic variables observed at different locations. Colors of the dots display the values grouped by analyzed fruits and vegetable crops. The analyzed variables were cultivated area (CAR), harvested area (HAR), production (PRO), yield (YIE), commodity price (CPR), fertilize price (FRP), herbicide price (HEP), insecticide price (INP) and fungicide price (FUP). Figure S5: heatmap showing correlation results among agri-input variables and yield of an agricultural database for the year 2018.

Author Contributions

Conceptualization: S.P.-L. Data Curation: S.P.-L., J.A.T. and C.A.M.-C. Formal Analysis: S.P.-L., J.A.T. and C.A.M.-C. Methodology: S.P.-L., J.A.T. and C.A.M.-C. Writing—Original Draft: S.P.-L. Writing—Review and Editing: S.P.-L., J.A.T. and C.A.M.-C. All authors have read and agreed to the published version of the manuscript.

Funding

This research received no external funding.

Institutional Review Board Statement

Not applicable.

Data Availability Statement

Original data used for this reseach can be accesed in the AGRONET database at this link: https://www.agronet.gov.co/estadistica/Paginas/home.aspx. However, files in “.txt” format are provided with the supplementary data. R script used to conduct the analysis of the data is provided as well. A text file explaining he dtabases is provided.

Conflicts of Interest

The authors declare no conflict of interest.

References

  1. Legiscomex Cifras de Comercio Exterior y Acuerdos Comerciales. Available online: http://www.legiscomex.com (accessed on 20 January 2023).
  2. DANE. Boletín Estadístico Sectorial Agropecuario 2022. Available online: https://upra.gov.co/es-co/Documents/Bolet%c3%adn%20Estad%c3%adstico%20Sectorial%20Agropecuario%202022%202%5b3%5d.pdf (accessed on 29 September 2023).
  3. DANE. Encuestan Nacional Agropecuaria 2019. Boletín Técnico. Available online: https://www.dane.gov.co/files/investigaciones/agropecuario/enda/ena/2019/boletin_ena_2019.pdf (accessed on 29 September 2023).
  4. Kamble, S.S.; Gunasekaran, A.; Gawankar, S.A. Achieving Sustainable Performance in a Data-Driven Agriculture Supply Chain: A Review for Research and Applications. Int. J. Prod. Econ. 2020, 219, 179–194. [Google Scholar] [CrossRef]
  5. Gurgel, A.C.; Reilly, J.; Blanc, E. Challenges in Simulating Economic Effects of Climate Change on Global Agricultural Markets. Clim. Chang. 2021, 166, 29. [Google Scholar] [CrossRef]
  6. Dumortier, J.; Carriquiry, M.; Elobeid, A. Impact of Climate Change on Global Agricultural Markets under Different Shared Socioeconomic Pathways. Agric. Econ. 2021, 52, 963–984. [Google Scholar] [CrossRef]
  7. Cui, Z.; Zhang, H.; Chen, X.; Zhang, C.; Ma, W.; Huang, C.; Zhang, W.; Mi, G.; Miao, Y.; Li, X.; et al. Pursuing Sustainable Productivity with Millions of Smallholder Farmers. Nature 2018, 555, 363–366. [Google Scholar] [CrossRef] [PubMed]
  8. Chen, X.-P.; Cui, Z.-L.; Vitousek, P.M.; Cassman, K.G.; Matson, P.A.; Bai, J.-S.; Meng, Q.-F.; Hou, P.; Yue, S.-C.; Römheld, V.; et al. Integrated Soil–Crop System Management for Food Security. Proc. Natl. Acad. Sci. USA 2011, 108, 6399–6404. [Google Scholar] [CrossRef] [PubMed]
  9. Tester, M.; Langridge, P. Breeding Technologies to Increase Crop Production in a Changing World. Science 2010, 327, 818–822. [Google Scholar] [CrossRef]
  10. Meuwissen, M.P.M.; Feindt, P.H.; Spiegel, A.; Termeer, C.J.A.M.; Mathijs, E.; de Mey, Y.; Finger, R.; Balmann, A.; Wauters, E.; Urquhart, J.; et al. A Framework to Assess the Resilience of Farming Systems. Agric. Syst. 2019, 176, 102656. [Google Scholar] [CrossRef]
  11. Majumdar, J.; Naraseeyappa, S.; Ankalaki, S. Analysis of Agriculture Data Using Data Mining Techniques: Application of Big Data. J. Big Data 2017, 4, 20. [Google Scholar] [CrossRef]
  12. Reidsma, P.; Ewert, F.; Oude Lansink, A. Analysis of Farm Performance in Europe under Different Climatic and Management Conditions to Improve Understanding of Adaptive Capacity. Clim. Chang. 2007, 84, 403–422. [Google Scholar] [CrossRef]
  13. Olesen, J.E.; Trnka, M.; Kersebaum, K.C.; Skjelvåg, A.O.; Seguin, B.; Peltonen-Sainio, P.; Rossi, F.; Kozyra, J.; Micale, F. Impacts and Adaptation of European Crop Production Systems to Climate Change. Eur. J. Agron. 2011, 34, 96–112. [Google Scholar] [CrossRef]
  14. Challinor, A.J.; Ewert, F.; Arnold, S.; Simelton, E.; Fraser, E. Crops and Climate Change: Progress, Trends, and Challenges in Simulating Impacts and Informing Adaptation. J. Exp. Bot. 2009, 60, 2775–2789. [Google Scholar] [CrossRef] [PubMed]
  15. Deryng, D.; Sacks, W.J.; Barford, C.C.; Ramankutty, N. Simulating the Effects of Climate and Agricultural Management Practices on Global Crop Yield. Glob. Biogeochem. Cycles 2011, 25, GB2006. [Google Scholar] [CrossRef]
  16. Jiménez, D.; Cock, J.; Satizábal, H.F.; Barreto S, M.A.; Pérez-Uribe, A.; Jarvis, A.; Van Damme, P. Analysis of Andean Blackberry (Rubus Glaucus) Production Models Obtained by Means of Artificial Neural Networks Exploiting Information Collected by Small-Scale Growers in Colombia and Publicly Available Meteorological Data. Comput. Electron. Agric. 2009, 69, 198–208. [Google Scholar] [CrossRef]
  17. Chapagain, T.; Raizada, M.N. Agronomic Challenges and Opportunities for Smallholder Terrace Agriculture in Developing Countries. Front. Plant Sci. 2017, 8, 331. [Google Scholar] [CrossRef] [PubMed]
  18. Agudelo, C.; Rivera, B.; Tapasco, J.; Estrada, R. Designing Policies to Reduce Rural Poverty and Environmental Degradation in a Hillside Zone of the Colombian Andes. World Dev. 2003, 31, 1921–1931. [Google Scholar] [CrossRef]
  19. Camas Gómez, R.; Turrent Fernández, A.; Cortes Flores, J.I.; Livera Muñóz, M.; González Estrada, A.; Villar Sánchez, B.; López Martínez, J.; Espinoza Paz, N.; Cadena Iñiguez, P. Erosión Del Suelo, Escurrimiento y Pérdida de Nitrógeno y Fósforo En Laderas Bajo Diferentes Sistemas de Manejo En Chiapas, México. Rev. Mex. Cienc. Agric. 2018, 3, 231–243. [Google Scholar] [CrossRef]
  20. Devkota, R.; Pant, L.P.; Gartaula, H.N.; Patel, K.; Gauchan, D.; Hambly-Odame, H.; Thapa, B.; Raizada, M.N. Responsible Agricultural Mechanization Innovation for the Sustainable Development of Nepal’s Hillside Farming System. Sustainability 2020, 12, 374. [Google Scholar] [CrossRef]
  21. Piepho, H.-P. Methods for Comparing the Yield Stability of Cropping Systems. J. Agron. Crop Sci. 1998, 180, 193–213. [Google Scholar] [CrossRef]
  22. Elavarasan, D.; Vincent, D.R.; Sharma, V.; Zomaya, A.Y.; Srinivasan, K. Forecasting Yield by Integrating Agrarian Factors and Machine Learning Models: A Survey. Comput. Electron. Agric. 2018, 155, 257–282. [Google Scholar] [CrossRef]
  23. Cabas, J.; Weersink, A.; Olale, E. Crop Yield Response to Economic, Site and Climatic Variables. Clim. Chang. 2010, 101, 599–616. [Google Scholar] [CrossRef]
  24. van Klompenburg, T.; Kassahun, A.; Catal, C. Crop Yield Prediction Using Machine Learning: A Systematic Literature Review. Comput. Electron. Agric. 2020, 177, 105709. [Google Scholar] [CrossRef]
  25. Khaki, S.; Wang, L. Crop Yield Prediction Using Deep Neural Networks. Front. Plant Sci. 2019, 10, 621. [Google Scholar] [CrossRef] [PubMed]
  26. Renard, D.; Tilman, D. National Food Production Stabilized by Crop Diversity. Nature 2019, 571, 257–260. [Google Scholar] [CrossRef] [PubMed]
  27. Mishra, S.; Mishra, D.; Santra, G.H. Applications of Machine Learning Techniques in Agricultural Crop Production: A Review Paper. Indian J. Sci. Technol. 2016, 9, 1–14. [Google Scholar] [CrossRef]
  28. Lobell, D.B.; Bänziger, M.; Magorokosho, C.; Vivek, B. Nonlinear Heat Effects on African Maize as Evidenced by Historical Yield Trials. Nat. Clim. Chang. 2011, 1, 42–45. [Google Scholar] [CrossRef]
  29. Grieve, B.D.; Duckett, T.; Collison, M.; Boyd, L.; West, J.; Yin, H.; Arvin, F.; Pearson, S. The Challenges Posed by Global Broadacre Crops in Delivering Smart Agri-Robotic Solutions: A Fundamental Rethink Is Required. Glob. Food Secur. 2019, 23, 116–124. [Google Scholar] [CrossRef]
  30. Konduri, V.S.; Vandal, T.J.; Ganguly, S.; Ganguly, A.R. Data Science for Weather Impacts on Crop Yield. Front. Sustain. Food Syst. 2020, 4, 52. [Google Scholar] [CrossRef]
  31. Juhos, K.; Szabó, S.; Ladányi, M. Influence of Soil Properties on Crop Yield: A Multivariate Statistical Approach. Int. Agrophys. 2015, 29, 433–440. [Google Scholar] [CrossRef]
  32. AGRONET. Estadísticas Agropecuarias. Available online: https://www.agronet.gov.co/Paginas/inicio.aspx (accessed on 13 September 2023).
  33. R Core Team. R Core Team 2021 R: A Language and Environment for Statistical Computing; R Foundation for Statistical Computing: Vienna, Austria, 2022; Available online: https://www.r-project.org/ (accessed on 20 January 2023).
  34. Bates, D.; Mächler, M.; Bolker, B.; Walker, S. Fitting Linear Mixed-Effects Models Using Lme4. J. Stat. Softw. 2015, 67, 1–48. [Google Scholar] [CrossRef]
  35. Kreyszig, E. Advanced Engineering Mathematics, 4th ed.; Wiley: Hoboken, NJ, USA, 1979. [Google Scholar]
  36. Lê, S.; Josse, J.; Husson, F. FactoMineR: An R Package for Multivariate Analysis. J. Stat. Softw. 2008, 25, 1–18. [Google Scholar] [CrossRef]
  37. Alexander, P.; Rounsevell, M.D.A.; Dislich, C.; Dodson, J.R.; Engström, K.; Moran, D. Drivers for Global Agricultural Land Use Change: The Nexus of Diet, Population, Yield and Bioenergy. Glob. Environ. Chang. 2015, 35, 138–147. [Google Scholar] [CrossRef]
  38. Spiertz, H. Challenges for Crop Production Research in Improving Land Use, Productivity and Sustainability. Sustainability 2013, 5, 1632–1644. [Google Scholar] [CrossRef]
  39. Roser, M.; Ritche, H.; Ortiz-Ospina, E. World Population Growth. Available online: https://ourworldindata.org/world-population-growth (accessed on 20 January 2023).
  40. DANE National Census of Population and Living Place. Available online: https://www.dane.gov.co/index.php/estadisticas-por-tema/demografia-y-poblacion/censo-nacional-de-poblacion-y-vivenda-2018 (accessed on 20 January 2023).
  41. Ali, A.; Bhattacharjee, B. Nutrition Security, Constraints, and Agro-Diversification Strategies of Neglected and Underutilized Crops to Fight Global Hidden Hunger. Front. Nutr. 2023, 10, 1144439. [Google Scholar] [CrossRef] [PubMed]
  42. Bamji, M.S.; Murty, P.V.V.S.; Sudhir, P.D. Nutritionally Sensitive Agriculture—An Approach to Reducing Hidden Hunger. Eur. J. Clin. Nutr. 2021, 75, 1001–1009. [Google Scholar] [CrossRef]
  43. Salinas Ruíz, J.; Montesinos López, O.A.; Hernández Ramírez, G.; Crossa Hiriart, J. Elements of Generalized Linear Mixed Models. In Generalized Linear Mixed Models with Applications in Agriculture and Biology; Springer International Publishing: Cham, Switzerland, 2023; pp. 1–42. [Google Scholar]
  44. Bodner, G.; Leitner, D.; Nakhforoosh, A.; Sobotik, M.; Moder, K.; Kaul, H.-P. A Statistical Approach to Root System Classification. Front. Plant Sci. 2013, 4, 292. [Google Scholar] [CrossRef]
  45. Kuang, W.; Liu, J.; Tian, H.; Shi, H.; Dong, J.; Song, C.; Li, X.; Du, G.; Hou, Y.; Lu, D.; et al. Cropland Redistribution to Marginal Lands Undermines Environmental Sustainability. Natl. Sci. Rev. 2022, 9, nwab091. [Google Scholar] [CrossRef]
  46. Omara, P.; Aula, L.; Oyebiyi, F.; Raun, W.R. World Cereal Nitrogen Use Efficiency Trends: Review and Current Knowledge. Agrosyst. Geosci. Environ. 2019, 2, 1–8. [Google Scholar] [CrossRef]
  47. Yu, Y.; Clark, J.S.; Tian, Q.; Yan, F. Rice Yield Response to Climate and Price Policy in High-Latitude Regions of China. Food Secur. 2022, 14, 1143–1157. [Google Scholar] [CrossRef]
  48. Xu, Q.; Sarker, R.; Fox, G.; Mckenney, D. Effects Of Climatic And Economic Factors On Corn And Soybean Yields In Ontario: A County Level Analysis. Int. J. Food Agric. Econ. 2019, 7, 1–17. [Google Scholar]
  49. Jagustović, R.; Papachristos, G.; Zougmoré, R.B.; Kotir, J.H.; Kessler, A.; Ouédraogo, M.; Ritsema, C.J.; Dittmer, K.M. Better before Worse Trajectories in Food Systems? An Investigation of Synergies and Trade-Offs through Climate-Smart Agriculture and System Dynamics. Agric. Syst. 2021, 190, 103131. [Google Scholar] [CrossRef]
  50. Acevedo Osorio, Á.; Schneider, S. Agricultura Campesina, Familiar y Comunitaria: Una Perspectiva Renovada Del Campesinado Para La Construcción de Paz En Colombia. Luna Azul 2020, 50, 132–155. [Google Scholar] [CrossRef]
  51. Grote, U.; Fasse, A.; Nguyen, T.T.; Erenstein, O. Food Security and the Dynamics of Wheat and Maize Value Chains in Africa and Asia. Front. Sustain. Food Syst. 2021, 4, 617009. [Google Scholar] [CrossRef]
  52. Tilman, D.; Balzer, C.; Hill, J.; Befort, B.L. Global Food Demand and the Sustainable Intensification of Agriculture. Proc. Natl. Acad. Sci. USA 2011, 108, 20260–20264. [Google Scholar] [CrossRef]
  53. Leisner, C.P. Review: Climate Change Impacts on Food Security- Focus on Perennial Cropping Systems and Nutritional Value. Plant Sci. 2020, 293, 110412. [Google Scholar] [CrossRef] [PubMed]
  54. Aggarwal, P.K.; Jarvis, A.; Campbell, B.M.; Zougmoré, R.B.; Khatri-Chhetri, A.; Vermeulen, S.J.; Loboguerrero, A.M.; Sebastian, L.S.; Kinyangi, J.; Bonilla-Findji, O.; et al. The Climate-Smart Village Approach: Framework of an Integrative Strategy for Scaling up Adaptation Options in Agriculture. Ecol. Soc. 2018, 23, art14. [Google Scholar] [CrossRef]
  55. Laborde Debucquet, D.; Mamun, A.; Martin, W.; Piñeiro, V.; Vos, R. Agricultural Subsidies and Global Greenhouse Gas Emissions. Nat. Commun. 2020, 12, 2601. [Google Scholar] [CrossRef]
Figure 1. Conceptual framework of the research conducted to analyze fruit and vegetable agricultural productivity in Colombia.
Agriculture 14 01546 g001
Figure 2. Trends for the means of cultivated area (CAR), harvest area (HAR), production (PRO) and yield (YIE) in fruits (light blue) and vegetables (gray-blue) in Colombia from 2006 until 2020 by farms.
Agriculture 14 01546 g002
Figure 3. Colombia maps showing yields (ton × ha−1) of the fruits (blue) and vegetables (green) by locations from 2006 until 2020. Values in the map indicate mean yield at every national location.
Agriculture 14 01546 g003
Figure 4. Boxplot of fruits and vegetables with highest mean for yield in Colombia from 2006 until 2020. Crossed circle indicates means for yield of each crop.
Agriculture 14 01546 g004
Figure 5. Comparison of yield means among farms in different Colombian locations of selected fruits and vegetables cropping systems. Black vertical lines indicate the standard error of the means. *** indicates significant differences for yield means at p < 0.001; ns indicates non-significant difference.
Agriculture 14 01546 g005
Figure 6. Biplots generated from PCA with the percentage of variance explained by the first two components for agricultural and non-climatic variables observed at different locations. Colors of the dots display the values grouped by Colombian regions. The analyzed variables were cultivated area (CAR), harvested area (HAR), production (PRO), yield (YIE), commodity price (CPR), fertilize price (FRP), herbicide price (HEP), insecticide price (INP), fungicide price (FUP).
Agriculture 14 01546 g006
Figure 7. Yield and fertilizer application correlations for selected crops with Colombia agricultural data for 2018. First fertilizer application carried out before crop cultivation (A) and second fertilizer application carried out during cultivation (B). Pearson correlation coefficient (r) and significance test (***) with p < 0.001.
Agriculture 14 01546 g007
Table 1. Values for the fixed (region) and random (year) effect of the mixed linear model adjusted to selected crops. *** p < 0.001, ** p < 0.01, * p < 0.05 and ns, not significant. - indicates no data registered for the crop in the region for the evaluated years.
PredictorsCarrotCabaggeTomatoOnionLettucePapayaPineapplePassion frMelonLimeOther Citrus
Antioquia----14.92***--8.32ns12.24ns16.04***------8.77***
Arauca----6.74ns----19.27**15.75***3.16**----17.70***
Atlantico----9.83***----16.70*21.35***--2.91ns2.47ns--
Bolivar----3.20ns----17.91*16.46***--4.21ns--11.18***
Boyaca−4.34***−10.02***18.15***8.17***0.56ns10.65ns8.16***−2.38*7.99ns−12.86ns7.61**
Caldas−8.84***−11.69***18.55***−5.96***−2.13ns14.73*11.94***1.66*9.68ns−1.71ns14.09***
Caqueta−18.37***−10.07ns10.25***−9.55*−5.00ns4.35ns7.49***−4.49ns------
Casanare--- 11.58***----18.44*24.54***1.44*−4.76ns−8.07ns8.62***
Cauca−15.18***−21.31***11.07***−6.55***−2.26ns14.15*9.57***−4.94***7.37ns−7.24*11.42***
Cesar−20.37***−13.29*16.20***4.63***−8.50ns13.24ns22.19***−5.73***2.33ns--5.41*
Choco----13.18***--16.00ns 15.96***−4.68*-ns----
Cordoba----10.97***----17.12*19.13***−1.47*5.61ns2.14ns12.37**
Cundinamarca1.05ns−0.26ns14.34***6.57***6.45ns22.84**20.95***−4.37***−8.34ns−2.43ns5.45*
Guainia---- ---- 14.19***------4.77ns
Guaviare----11.89*---- 25.75***--------
Huila----15.16***−1.35ns3.08ns12.03ns14.61***1.50**9.09ns--4.93*
La Guajira----12.85***----11.17ns6.64ns−8.73***1.68ns−5.92ns--
Magdalena−7.93ns--11.80***−1.13ns--14.83**21.39***−6.29***−0.24ns--14.87***
Meta----16.08***−0.25ns--24.37**26.45***3.93***14.08*--14.64***
Nariño0.56ns−6.35***16.83***--11.19ns6.03ns8.15***−3.64***−0.51ns−8.58ns2.20ns
Norte de Santander−2.52**−7.95***24.20***6.27***3.26ns11.73ns25.79***−3.94***12.94*−3.35ns7.83**
Putumayo−11.81*−20.33**13.61**--−8.30ns7.08ns12.23***----−10.05*14.18**
Quindio2.63ns−19.56***14.29***−0.02ns−2.58ns13.86ns27.03***−0.28ns----18.40***
Risaralda−11.45***−0.36ns25.29***--7.80ns13.11ns32.01***0.10ns--8.96***--
San Andres y Providencia---- ----12.24ns1.56ns−13.85*−2.03ns----
Santander−1.38ns−0.04ns18.68***−0.89ns7.75ns15.22*24.08***0.28ns11.32*1.87ns8.53***
Sucre---- -----9.85ns8.55***−4.87***−1.59ns----
Tolima−4.53***−5.91**11.76***7.97**−10.05ns12.04ns17.63***−3.97***4.97ns0.74ns7.95**
Valle del Cauca−10.05***−7.32***18.71***2.45*2.29ns20.23**19.74***3.42***14.47**2.14ns14.66***
Vaupes----3.58ns------9.57***--------
Vichada----1.49ns37.36 --0.88ns6.58**−6.86*−5.28ns3.36ns--
Year0.14 0.12 0.40 0.04 0.00 0.08 1.51 0.18 1.46 1.75 0.35
Residual54.10 66.20 54.20 37.36 50.49 50.85 46.79 33.69 50.74 58.38 29.99
r20.24 0.22 0.21 0.28 0.26 0.33 0.43 0.24 0.33 0.17 0.47
Disclaimer/Publisher’s Note: The statements, opinions and data contained in all publications are solely those of the individual author(s) and contributor(s) and not of MDPI and/or the editor(s). MDPI and/or the editor(s) disclaim responsibility for any injury to people or property resulting from any ideas, methods, instructions or products referred to in the content.

