Article

A Method for Cropland Layer Extraction in Complex Scenes Integrating Edge Features and Semantic Segmentation

1
Faculty of Geomatics, Lanzhou Jiaotong University, Lanzhou 730070, China
2
Key Laboratory of Remote Sensing and Digital Earth, Aerospace Information Research Institute, Chinese Academy of Sciences, Beijing 100101, China
3
National-Local Joint Engineering Research Center of Technologies and Applications for National Geographic State Monitoring, Lanzhou 730070, China
4
Key Laboratory of Science and Technology in Surveying & Mapping, Gansu Province, Lanzhou 730070, China
5
The Center of Agriculture Information of Chongqing, Chongqing 401121, China
*
Author to whom correspondence should be addressed.
Agriculture 2024, 14(9), 1553; https://doi.org/10.3390/agriculture14091553
Submission received: 27 July 2024 / Revised: 25 August 2024 / Accepted: 6 September 2024 / Published: 8 September 2024
(This article belongs to the Special Issue Applications of Remote Sensing in Agricultural Soil and Crop Mapping)

Abstract

:
Cultivated land is crucial for food production and security. In complex environments like mountainous regions, the fragmented nature of the cultivated land complicates rapid and accurate information acquisition. Deep learning has become essential for extracting cultivated land but faces challenges such as edge detail loss and limited adaptability. This study introduces a novel approach that combines geographical zonal stratification with the temporal characteristics of medium-resolution remote sensing images for identifying cultivated land. The methodology involves geographically zoning and stratifying the study area, and then integrating semantic segmentation and edge detection to analyze remote sensing images and generate initial extraction results. These results are refined through post-processing with medium-resolution imagery classification to produce a detailed map of the cultivated land distribution. The method achieved an overall extraction accuracy of 95.07% in Tongnan District, with specific accuracies of 92.49% for flat cultivated land, 96.18% for terraced cultivated land, 93.80% for sloping cultivated land, and 78.83% for forest intercrop land. The results indicate that, compared to traditional methods, this approach is faster and more accurate, reducing both false positives and omissions. This paper presents a new methodological framework for large-scale cropland mapping in complex scenarios, offering valuable insights for subsequent cropland extraction in challenging environments.

1. Introduction

Cultivated land is the cornerstone of China’s food and ecological security, playing a critical role in the nation’s survival and development. As living standards improve and agricultural modernization accelerates in China, the demands and structure of agricultural development are undergoing profound changes, driven by the need to ensure food security, adapt to changing dietary habits, and address the challenges of sustainable development [1,2,3,4]. For instance, in recent years, China has increased investment in agricultural infrastructure, promoting the construction of high-standard farmland and the application of smart agricultural technologies to meet the challenges posed by population growth and climate change. In this context, the rapid and accurate acquisition of information regarding the area and distribution of cultivated land has become increasingly important. This information is not only crucial for agricultural production planning [5], yield forecasting [6], crop structure adjustment [7], and pest and disease monitoring [8], but it also plays an indispensable strategic role in ensuring national food security, enhancing agricultural productivity, and achieving sustainable agricultural development. Traditional field surveys for obtaining cultivated land information are time-consuming and labor-intensive and have long acquisition cycles, which makes it difficult to update real-time conditions. With the advancement of remote sensing technology, researchers have predominantly employed land cover classification methods for the extraction of cultivated land using medium- and low-resolution remote sensing imagery. Stibig et al. constructed land cover maps for South and Southeast Asia using SPOT-VEGETATION data, providing valuable data resources for regional-scale cultivated land extraction [9]. Li et al. applied decision tree classification algorithms to remote sensing imagery, demonstrating their flexibility and high computational efficiency [10]. Chen et al. proposed a POK (Pyramid, Object, and Knowledge)-based operational approach that improved the land cover classification accuracy and resolution, offering new methods for detailed cultivated land coverage [11]. Due to limitations in image resolution, classification results often lack precision and fail to meet the accuracy requirements of actual production. The advent of high-resolution remote sensing satellites has made sub-meter high-resolution imagery the primary data source for cultivated land extraction, effectively meeting the needs for detailed plot extraction [12].
Currently, the mainstream method for obtaining plot information in agricultural information services relies on professional personnel conducting a visual interpretation of high-resolution imagery, which is labor-intensive, costly, and difficult to update. With the advancement of technology, remote sensing imagery interpretation has become a primary method for cultivated land extraction. Remote sensing technology utilizes various types of sensors, including optical, radar, and infrared, to monitor diverse aspects of land surface coverage. For instance, optical sensors capture visible and near-infrared wavelengths to assess vegetation health and land cover types, while radar sensors provide valuable data on the surface roughness and moisture content. The integration of these data sources enables comprehensive land cover classification and monitoring [13]. Remote sensing technology plays a crucial role in agricultural production. The acquisition of the spatial distribution information of agricultural resources through remote sensing is not only a practical need for agricultural production management but also an essential guarantee for achieving informatization and precision in agriculture. Cord et al. found that remote sensing variables are more effective than classified land cover data in modeling plant distribution patterns [14]. Valjarević A et al. used remote sensing and GIS technologies to estimate cloud cover characteristics and analyze precipitation conditions, which offer crucial information for agricultural production [15]. In the extraction of land features using remote sensing imagery, Hernandez et al. proposed a Random Forest classification method integrating spatial metrics and texture analysis for urban land use mapping, which improved the accuracy of the land cover classification [16]. Li et al. employed support vector machines to enhance the accuracy and reliability of cultivated land extraction [17]. In addition to traditional classification methods like Random Forests, sophisticated techniques such as sub-pixel and pixel-based approaches have become increasingly important in remote sensing. Singh et al. utilized neural networks for the pixel-based classification of Landsat 8 OLI multispectral satellite imagery [18]. Pixel-based classification through deep learning semantic segmentation allows for the rapid analysis of deep semantic information in images, making it one of the most advanced techniques in the current field of image segmentation. As artificial intelligence technology matures, Convolutional Neural Networks (CNNs) have made significant progress in image object detection and scene classification, leading researchers to increasingly apply CNNs to semantic segmentation tasks in remote sensing imagery [19]. Deep learning technologies have been widely used in land cover classification, including the extraction of buildings [20], roads [21], and water bodies [22]. However, using CNNs requires the input images to be resized, which limits the effective utilization of contextual information between pixels, thereby affecting the classification accuracy [23]. To address these issues, Long proposed Fully Convolutional Networks (FCNs), which replace the fully connected layers with convolutional layers to achieve end-to-end image segmentation through skip connections and deconvolution, improving the segmentation precision [24]. In the field of remote sensing imagery for cultivated land extraction, Cheng et al. used multispectral remote sensing data combined with vegetation index time series features to accurately identify fallow areas [25]. Zhenrong Du et al. applied the DeepLab v3+ model to cultivated land extraction, demonstrating that deep learning semantic segmentation techniques achieve higher precision compared to traditional classification methods [26]. As edge detection technology has advanced, models such as Holistically-Nested Edge Detection (HED) [27] and Richer Convolutional Features (RCF) [28] have been proposed, achieving near-human performances in various fields. Li et al. developed the Full Dilated-RCF (FD-RCF) model for edge detection in remote sensing imagery to extract cultivated land boundaries [29]. Zhou et al. proposed a cascaded semantic segmentation and edge detection model to enhance boundary detection and improve the extraction accuracy [30].
Despite significant progress, the current research on cultivated land extraction primarily focuses on flat and regular plains. For complex surface structures typical of the southwestern mountainous regions in China, issues such as complex terrains, fragmented plots, and diverse planting types lead to significant variation in the image features. This makes single deep learning models perform poorly in these areas, resulting in unclear boundaries, salt-and-pepper noise, and poor model transferability across different regions [31,32,33].
Therefore, this study addressed the characteristics of cultivated land in complex scenarios by incorporating the geographic zoning and stratification approach. Combining spectral, index, and polarization features from medium-resolution imagery with the terrain conditions, this approach determined the cultivated land extent and stratification [34,35,36]. Subsequently, based on the specific features of different types of cultivated land, edge detection methods represented by the Dense Extreme Inception Network for Edge Detection (DexiNed) and RCF, as well as semantic segmentation methods represented by U-net++ and DeepLab v3+, were applied to extract flatland and terraced fields. Finally, the integration of the extraction results based on stratification was performed to achieve the intelligent extraction of plots in the complex region of Tongnan.

2. Materials and Methods

2.1. Study Area and Data

2.1.1. Study Area

This study focused on Tongnan District, located in the northwest of Chongqing Municipality, China. Positioned along the middle and lower reaches of the Fujiang and Qiongjiang rivers, Tongnan District spans from 105°31′41″ E to 106°00′20″ E longitude and from 29°47′33″ N to 30°26′28″ N latitude (Figure 1). The region is predominantly characterized by hilly and mountainous terrain, with hills accounting for 79.4% of the total area, resulting in significant topographical variation. Although there are some plains within the district, the overall terrain is quite rugged. Tongnan District is characterized by a subtropical monsoon climate, which is highly conducive to agricultural production. The region experiences distinct seasons, with sufficient rainfall throughout the year. The average annual temperature ranges from 16 °C to 18 °C. The area receives an average annual precipitation of approximately 1000 to 1200 mm, primarily concentrated between May and September. This seasonal rainfall pattern significantly influences the planting and harvesting cycles of various crops. The region also maintains high humidity, with an average relative humidity ranging between 60% and 80%. These climatic conditions, especially the temperature and precipitation patterns, create favorable conditions for cultivating a variety of crops, including rice, corn, and various vegetables. Agriculture is the mainstay of Tongnan District, which hosts the National Agricultural Science and Technology Park and the National Modern Agricultural (Lemon) Industrial Park. The district has a substantial amount of cultivated land; however, the land is characterized by scattered distribution, local concentration, small plot sizes, and irregular shapes. These conditions pose considerable challenges to the extraction of cultivated land information.

2.1.2. Data and Processing

The data used in this study included remote sensing imagery and other auxiliary data. The medium-resolution imagery used in this study consisted of Sentinel-2A/B remote sensing data, including multiple bands from Sentinel-2 satellite imagery, such as red, green, blue, and near-infrared, as well as radar reflectance data from Sentinel-1 with VV and VH bands. The Sentinel imagery data we used were sourced from the Google Earth Engine (GEE) platform’s Sentinel-1 SAR GRD and Harmonized Sentinel-2 MSI datasets. Specifically, the Sentinel-1 imagery has a resolution of 10 m, while in the Sentinel-2 dataset, the red, green, blue, and near-infrared bands are at a 10 m resolution, and the SWIR 1 and SWIR 2 bands are at a 20 m resolution. The preprocessing based on the GEE platform included resampling and cloud processing. This involved resampling the SWIR 1 and SWIR 2 bands of the Sentinel-2 imagery to a 10 m resolution, and the cloud processing included cloud cover screening and cloud removal. Multiple images from the same month were combined by calculating the median to form a single image, and linear interpolation was used to fill in missing monthly data, resulting in stable and continuous monthly composite imagery [37]. In the study, the time span for Sentinel-2 image compositing was from 1 March 2022 to 1 October 2022. We selected Sentinel-2 images with less than 30% cloud cover in this cloudy and rainy study area for processing. Between 1 March 2022 and 1 October 2022, the study area was covered by 109 images, of which 32 remained after cloud filtering. The images for June and September 2022 were missing, accounting for 2/7 of the months. To address this, the retained images were first processed for cloud removal using the QA60 band. Subsequently, we computed the median of the remaining images to create a composite image, and we used linear interpolation to fill in the missing data. The high-resolution remote sensing imagery used in this study were obtained from the GF-2 satellite, with spatial resolutions of 0.81 m for the panchromatic band and 3.24 m for the multispectral bands. The imagery was sourced from the Chongqing Municipal Bureau of Planning and Natural Resources. Due to the frequent cloudy and foggy weather in the southwestern region and considering the impact of crop growth on cultivated land extraction, GF-2 images from January to July 2022 were selected. We used ENVI 5.3 software to perform geometric correction, atmospheric corrections, radiometric correction, and fusion on the GF-2 imagery. We selected GF-2 images from January 2022 to July 2022 with less than 20% cloud cover. We extracted the cloud-free regions from multiple images, and we then re-fused, mosaicked, and color-corrected them to create a single composite cloud-free image. The relevant information of the images used in the experiment is shown in Table 1.
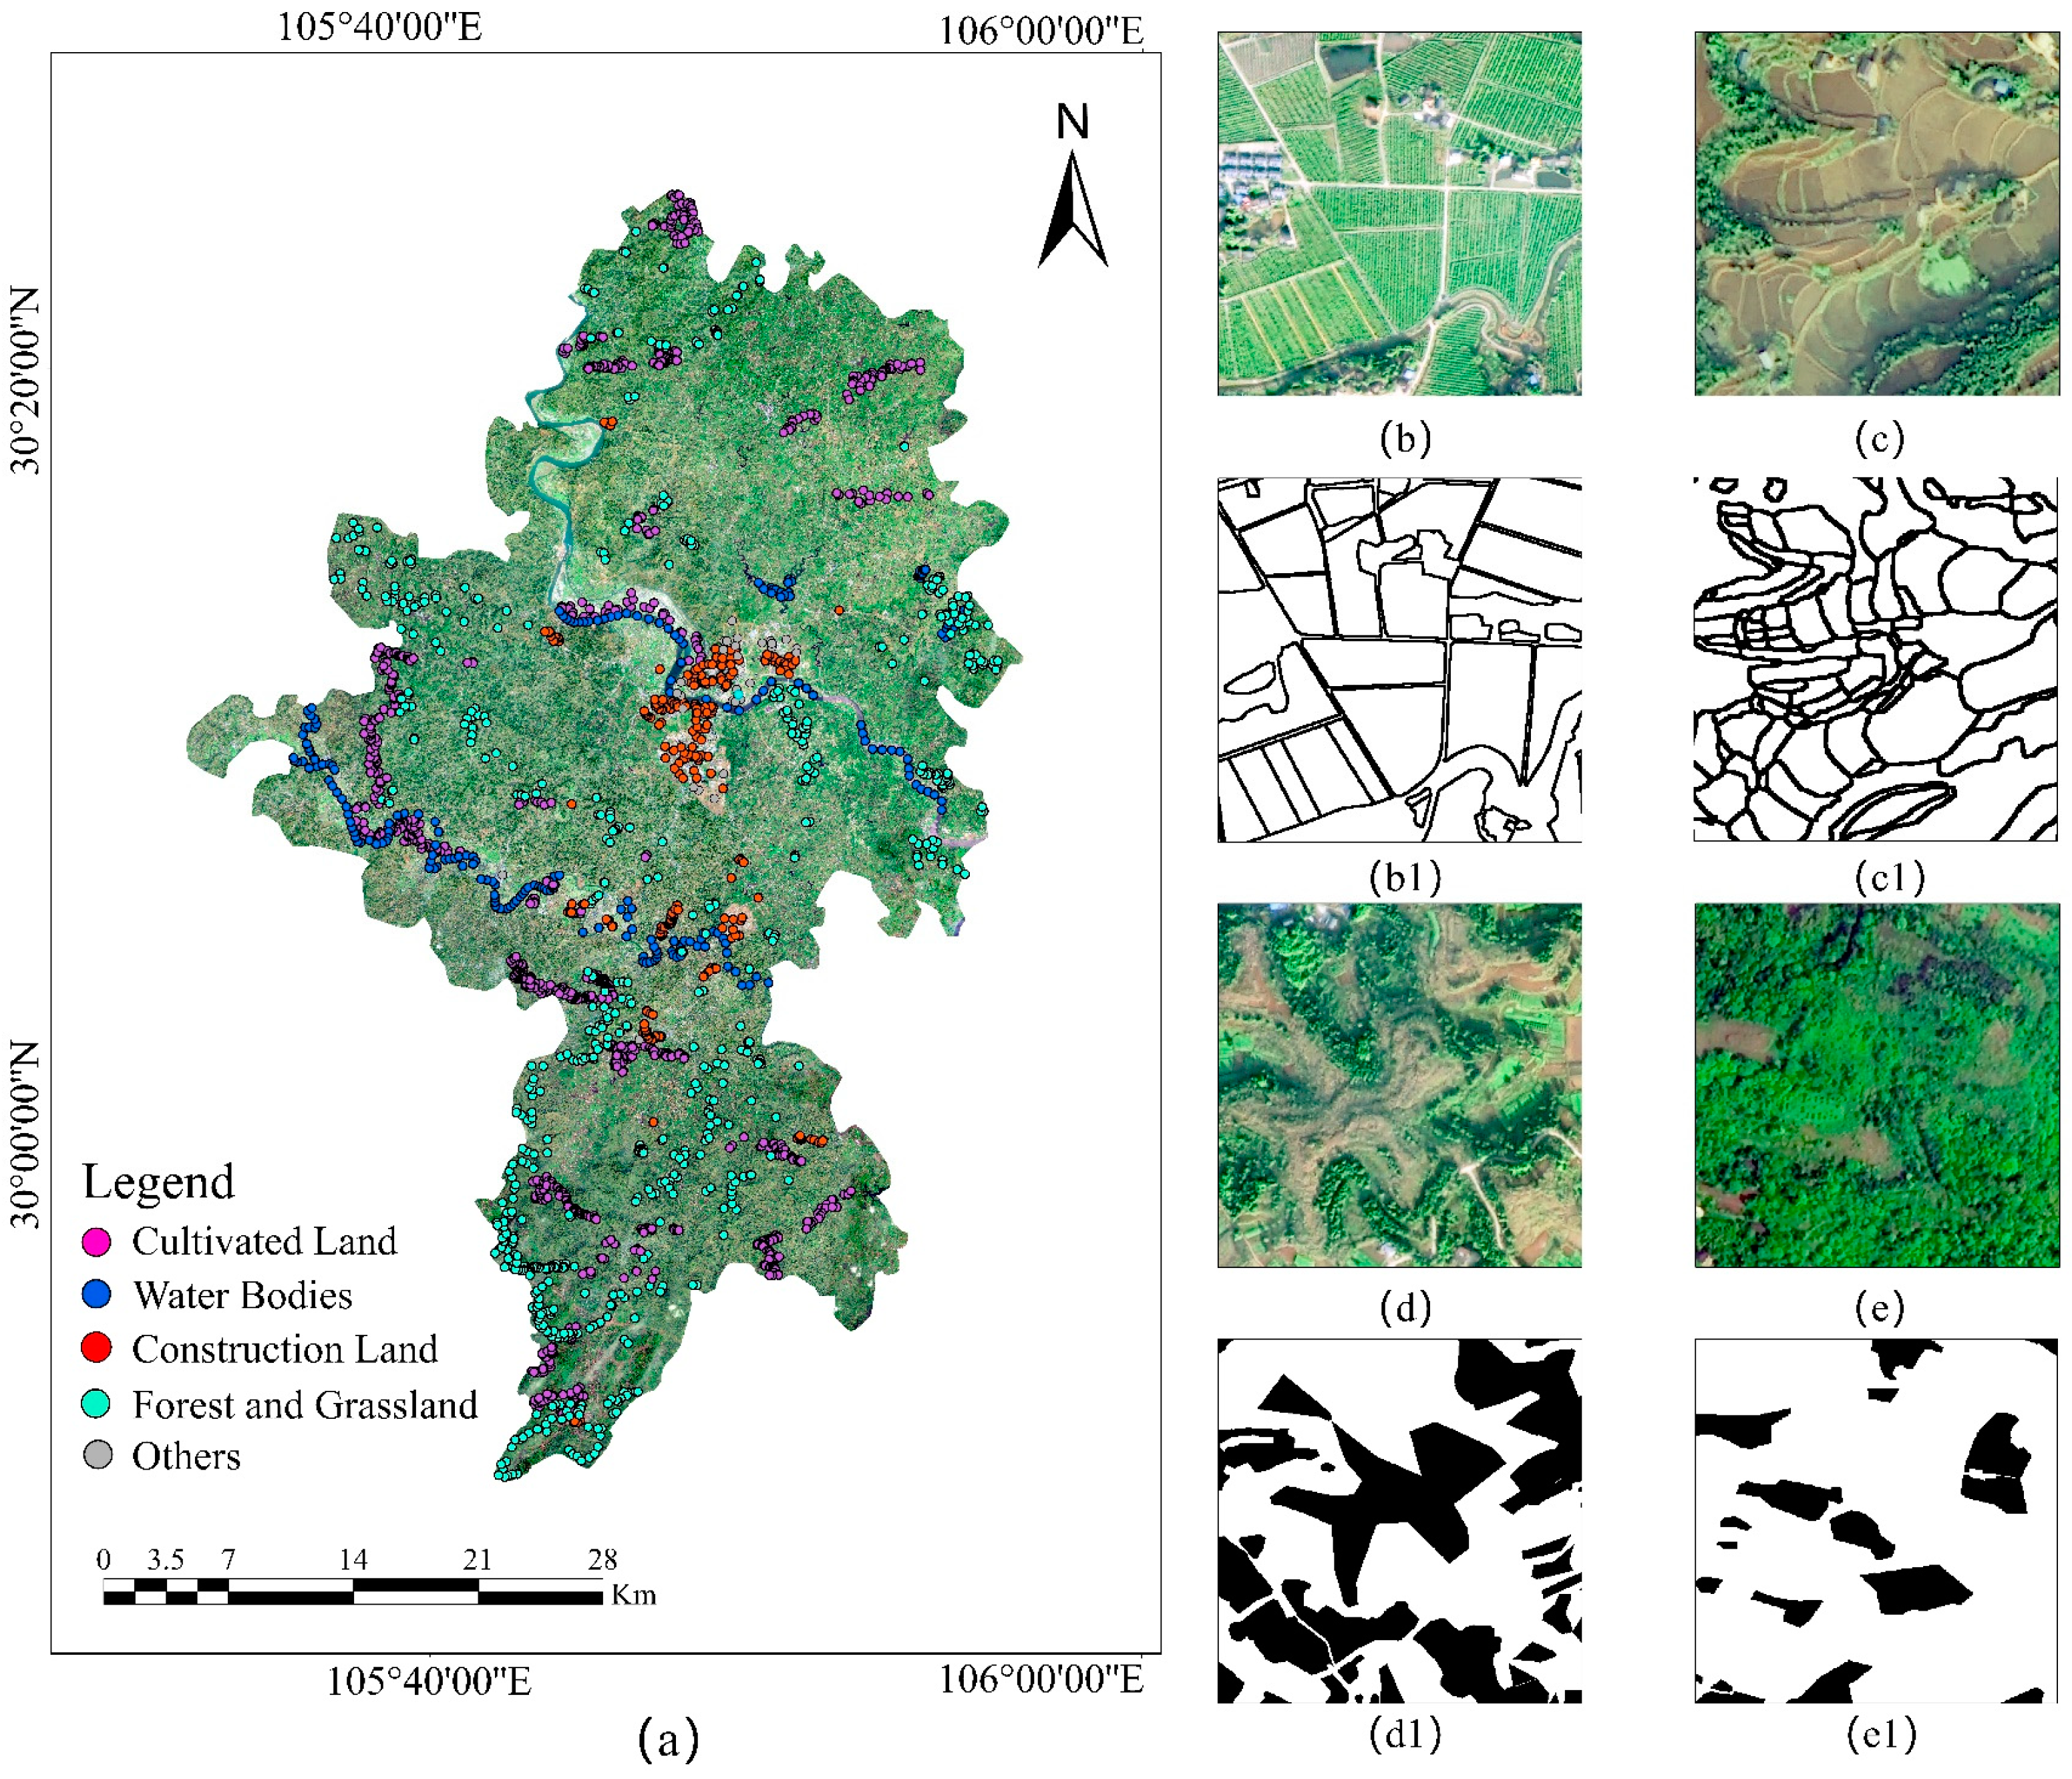
Auxiliary data include the county-level boundary vector map of Tongnan District, DEM data, land cover type samples, and cultivated land sample data. The county-level boundary vector map of Chongqing Municipality was sourced from the Chongqing Municipal Planning and Natural Resources Bureau. The DEM data utilized in this study were derived from the Shuttle Radar Topography Mission (SRTM) and accessed through the NASA SRTM Digital Elevation 30 m dataset available on the Google Earth Engine (GEE) platform. The SRTM DEM provides a resolution of 30 m, with a systematic error of 2.36 ± 16.48 m and a root-mean-square error (RMSE) of 16.65 m [38]. The land cover type samples were generated using invariant points from the European Space Agency (ESA)’s WorldCover 2020 dataset [39], with an accuracy of 74.4 ± 0.1%, and the ESA WorldCover 2021 dataset [40], with an accuracy of 76.7 ± 0.5%. These were combined with field survey results and classification outcomes from the CLCD dataset for 2019 and 2020, which has an accuracy of 79.30% ± 1.99% [41]. Given the inherent limitations in the dataset’s accuracy, we first selected invariant points from multiple datasets as the foundation for our samples to minimize the introduction of subsequent errors. We further refined the sample selection by incorporating characteristics from 350 sample points obtained during ground surveys conducted between 2021 and 2022. This process yielded five categories of samples: cropland, forest and grassland, construction land, water bodies, and other land features, totaling 2100 samples. The distribution of each land use type sample point is shown in Figure 2a. Cultivated land sample data were created based on GF-2 imagery and the results of the third national land survey. The sample dataset includes images and labels, selecting typical cultivated land types within each geographic division. The samples were required to be sufficient in number and evenly distributed, with labels divided into edge labels and semantic labels. Sample images were obtained by cropping GF-2 imagery with a resolution of 0.8 m from the study area, and sample labels were annotated and cropped using ArcGIS10.8 software, ultimately generating a deep learning cultivated land sample dataset. As shown in Figure 2, the edge detection model for flat cultivated land and terraced cultivated land required input from the remote sensing images and edge labels shown in Figure 2b,c,b1,c1, while the semantic segmentation model for sloping cultivated land and inter-forest cultivated land required input from the remote sensing images and texture labels shown in Figure 2d,e,d1,e1.

2.2. Research Methodology

The study area features a diverse topography and varied farming practices, resulting in a wide range of cultivated land shapes and textures across different regions and seasons, creating a complex visual and spatial landscape for mountainous cultivated land. This paper proposes a differentiated parcel extraction method tailored for such complex mountainous terrains, based on the geographic partitioning and layering theory and utilizing deep learning semantic segmentation and edge detection models. The methodology is organized into four main components: First, the extent of the cultivated land is identified using medium-resolution remote sensing imagery, which includes spectral, index, and polarization features for classification, providing a preliminary range of cultivated land to guide subsequent error correction. Second, the study area is geographically partitioned into plains, mountainous regions, and forest–grass regions, with the further classification of the cultivated land within these zones into four types based on their visual and spatial characteristics: flat cultivated land, sloping cultivated land, terraced cultivated land, and forest intercrop land. Third, different deep learning models are designed or selected to extract these various types of cultivated land, each with specific workflows tailored to the characteristics of the land type. Finally, the extraction results from these models are integrated, and post-processing and fusion are performed based on the initial cultivated land identification to produce a final map of the identified cultivated land parcels for the study period.

2.2.1. Extraction of Cultivated Land Areas

First, medium-resolution remote sensing imagery was used to identify the extent of cultivated land. Sentinel series data, including optical and SAR data, were selected as the data source. The features of medium-resolution remote sensing images are shown in Table 2. Monthly composites were chosen for feature calculation and identification based on the satellite revisit cycle and the characteristics of the study area. Medium-resolution remote sensing imagery has achieved high accuracy in the broad classification of land cover types [42]. Therefore, using it as the basis for subsequent layering and boundary delineation has little impact on the final extraction results. GEE is currently the most widely used cloud computing platform for remote sensing, known for its automatic parallel processing and rapid computation capabilities, making it the most popular platform for big Earth data processing [43,44,45]. This step was specifically implemented on the GEE platform, where monthly composite images were used to calculate features such as the spectral, index, and SAR polarization. Various vegetation and surface indices were calculated from the Sentinel-2 imagery, including the Normalized Difference Vegetation Index (NDVI), Land Surface Water Index (LSWI), Modified Normalized Difference Water Index (MNDWI), Normalized Difference Yellowness Index (NDYI), and Normalized Difference Soil Index (NDSI) [46,47,48,49,50]. For the Sentinel-1 imagery, the VH/VV polarization ratio was calculated as a key feature for distinguishing different land cover types. After obtaining various monthly composite feature data, a Random Forest model was used to classify the land cover and identify the extent of the cultivated land in the study area.

2.2.2. Regional Partitioning and Cultivated Land Layering

Considering the complex geographic environment and planting structures in the southwestern mountainous regions of China, the concept of geographic zoning was introduced into the experiment. First, based on the topographic and geomorphological differences within the study area, classification was performed using elevation, slope, aspect, and remote sensing imagery. Elevation data were used in ArcGIS10.8 to extract valley and ridge lines, while road and water system distribution maps, matched with high-resolution remote sensing imagery, were utilized. Several line layers were overlaid to delineate the study area into regions with relatively uniform internal geographic conditions. Subsequently, combining elevation data with classification results from medium-resolution imagery, these regions were categorized into plains, mountainous areas, and forest–grass regions. Plains are primarily flat areas located in intermontane basins and along gently sloping river valleys, characterized by low elevation and gentle slopes, which are suitable for agricultural production. Mountainous areas encompass complex terrain such as ridges, slopes, and valleys, typically found on the sloping surfaces between peaks and plains, and they are regions without extensive forest or grassland cover between mountaintops and valleys. Forest–grass regions are mainly situated at the edges of complex mountainous areas, including natural forest zones and grassy meadows. These areas may have mixed vegetation cover and generally represent transitional zones between forest landscapes and open areas.
The study area was classified into three distinct regions based on the spatial and visual characteristics of the remote sensing imagery. The extent of the cultivated land identified from medium-resolution imagery was compared with the texture and edge features from high-resolution imagery. Due to the varying terrain across different regions within the complex landscape of the study area, the cultivated land exhibits different visual characteristics in remote sensing imagery. Therefore, based on the geometric and texture features of the cultivated land in high-resolution imagery, it was further categorized into four distinct types, resulting in a more detailed stratification of the cultivated land types within the study area. In the plains, flat cultivated land is suitable for large-scale crop planting and for serving as the core area for regional grain production. The cultivated land here is typically extensive and contiguous, with relatively simple edge and texture features. The distribution of the cultivated land in the mountainous regions is constrained, primarily concentrated in terraced fields or relatively flat areas on mountain slopes. Therefore, the cultivated land in these regions is categorized into terraced cultivated land and sloping cultivated land. In the forest–grass areas, the forest intercrop land is relatively scarce, mainly concentrated in small flat areas within the forests. The edges of the cultivated land in these areas are diverse and significantly influenced by vegetation cover and terrain variations, making it challenging to distinguish between the forest, grassland, and cultivated land boundaries in the imagery. Figure 3 shows the three geographical partitions and four types of cropland.

2.2.3. Layered Extraction of Cultivated Land

To improve the model adaptability for different types of cultivated land, differentiated deep learning models were selected for land extraction. U-Net++ is particularly adept at handling cultivated land types with complex boundaries and textures. By employing nested skip pathways and multi-scale feature capture, it enhances the recognition of fine details and boundaries, making it suitable for the precise segmentation of flat cultivated land and sloping cultivated land [51]. DeepLab v3+ excels in managing complex backgrounds and varying scales of cultivated land features. It is especially effective for segments with intricate spatial structures, such as terraced cultivated land and forest intercrop land. The use of dilated convolutions and decoder modules significantly improves the segmentation accuracy [52]. DexiNed excels at detecting well-defined boundaries and clear textures, making it particularly effective for identifying the edges of cultivated lands with distinct and regular shapes, such as flat cultivated land. Its high precision in edge detection is beneficial for delineating boundaries in areas with clear and consistent features [53]. RCF is highly effective at capturing fine boundaries and detecting narrow, elongated shapes, making it suitable for extracting terraced cultivated land. Its ability to preserve detailed spatial information and accurately identify narrow boundaries enhances the segmentation of complex and structured agricultural landscapes [54].
For flat cultivated land, which has a regular shape, clear boundaries, and distinct texture features, the DexiNed edge detection model was employed. After edge detection with DexiNed, the U-net++ semantic segmentation model was used to segment the overall area of the cultivated land. The edge strength map obtained was converted into vector boundaries and overlaid with the segmentation results to define the patches of plain cultivated land. For terraced cultivated land, which has prominent spatial features, clear boundaries, and narrow elongated shapes, the RCF edge detection model was chosen. The DeepLab v3+ semantic segmentation model was then used to handle the segmentation of terraced cultivated land. For sloping cultivated land, which has blurred edges and unique textures, the U-Net++ model was selected for segmentation. For forest intercrop land, which is sparsely distributed with no obvious boundaries, the DeepLab v3+ model was utilized, effectively extracting the distribution of forest edge farmland.

2.2.4. Integration of Extraction Results

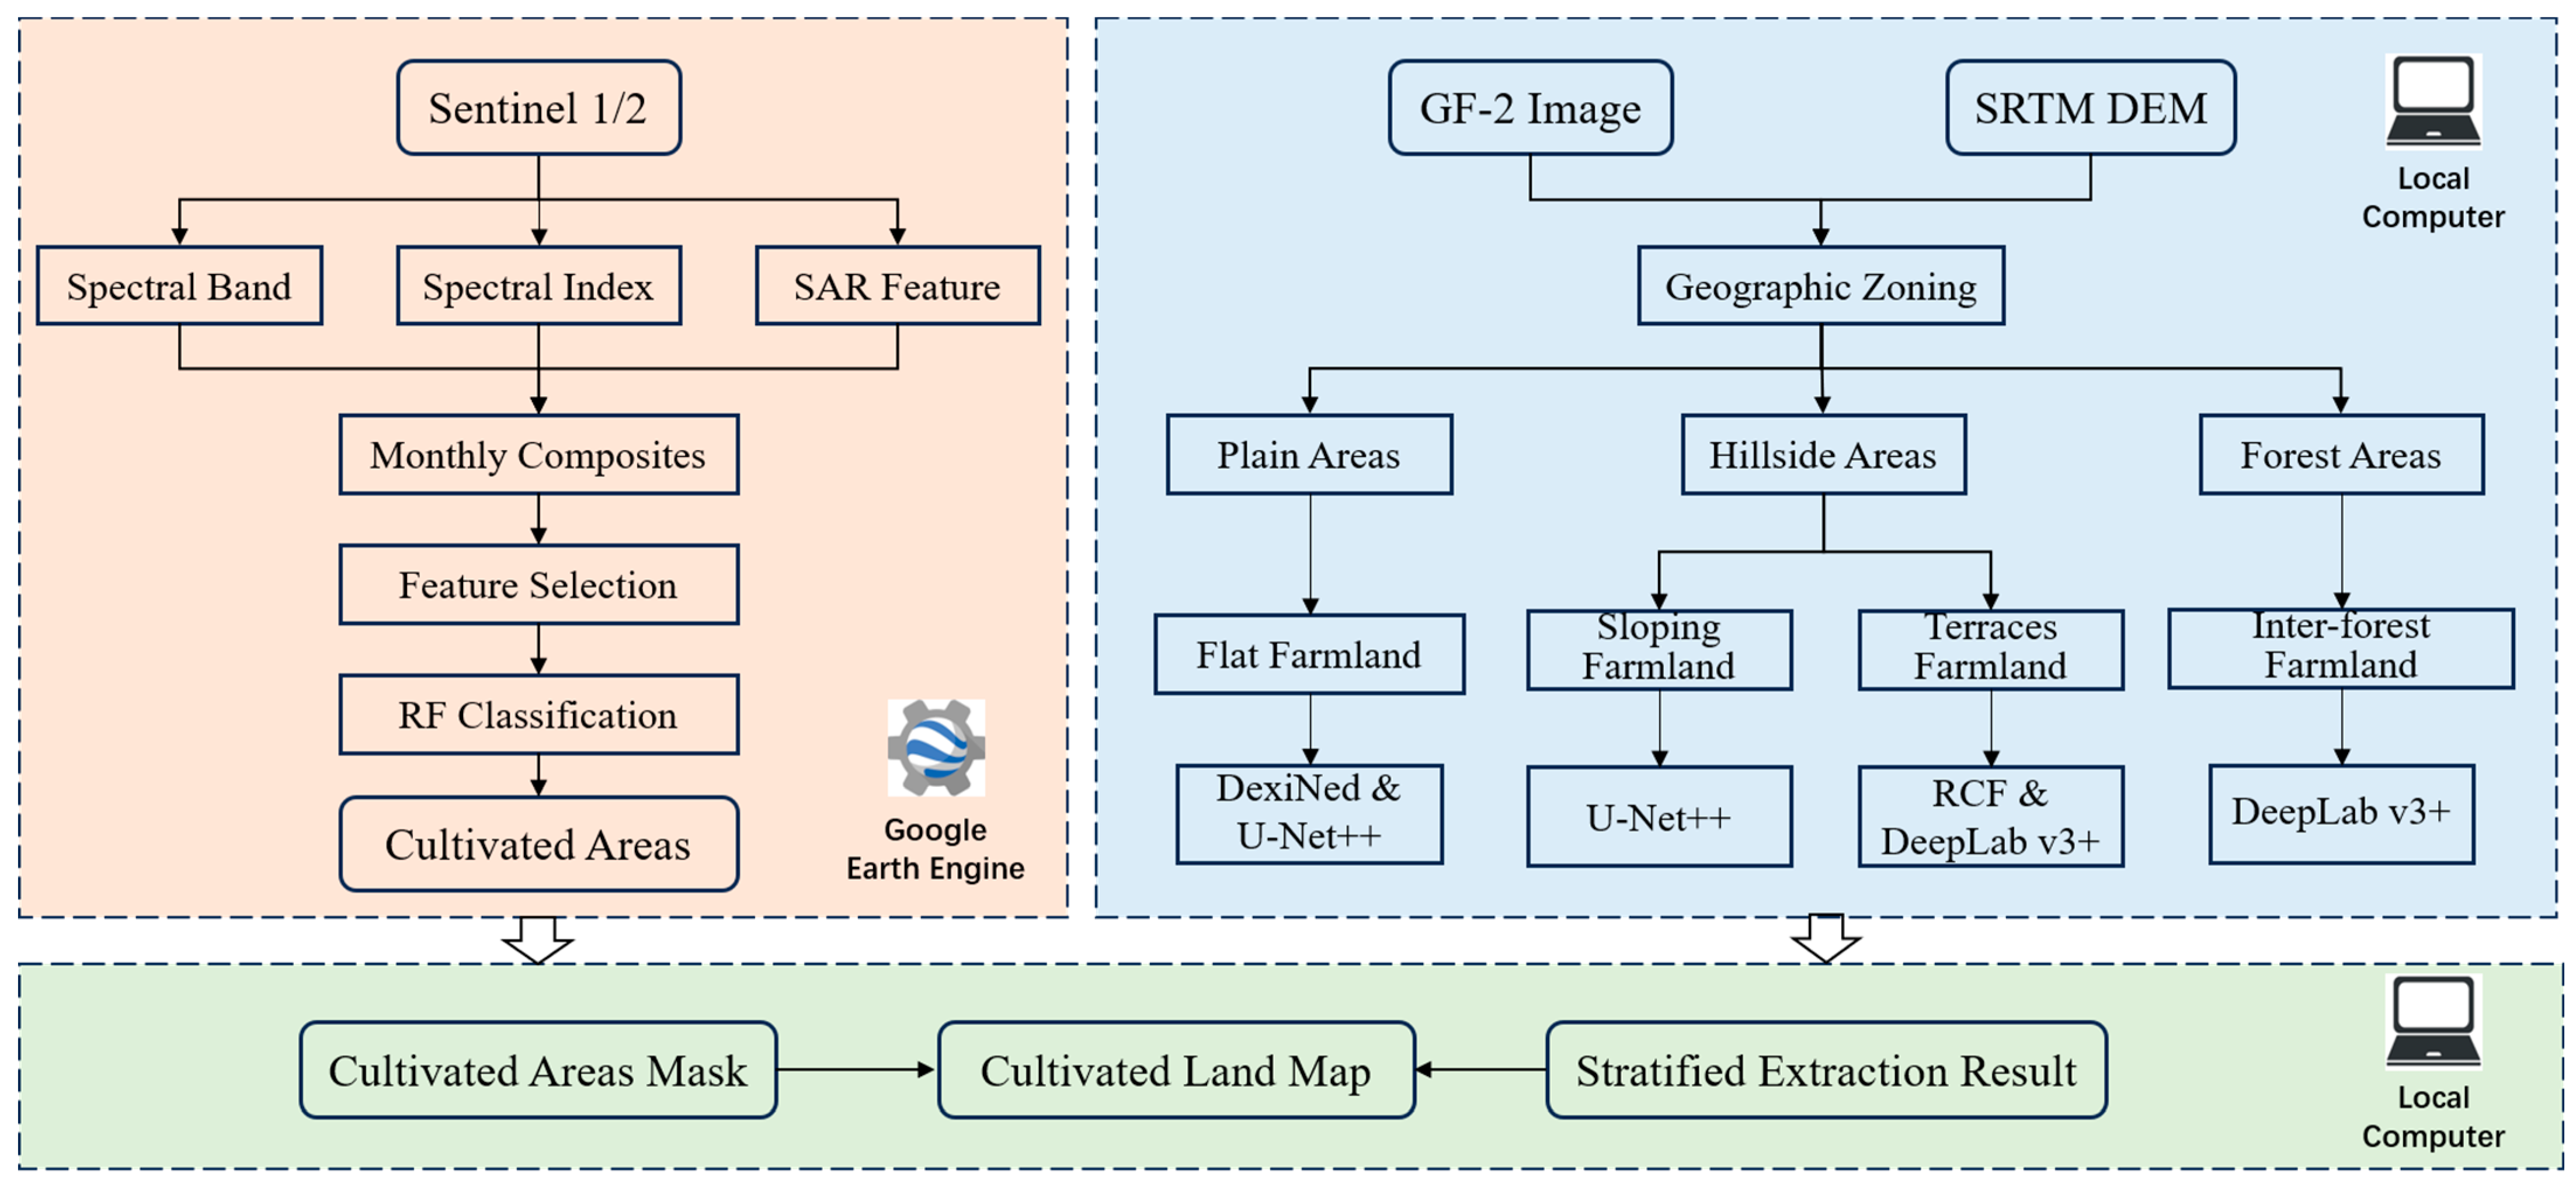
By applying the corresponding models to specific types of cultivated land, integrating the various extraction models, and combining them with medium-resolution imagery classification results, accurate plots of cultivated land could be obtained. For extracting flat and terraced fields using edge detection and semantic segmentation models, the segmentation results and edge extraction results were overlaid. Thresholds were set for the segmentation results within linear feature edges to filter and extract the correct plots, obtaining specific types of cultivated land plots. First, the DexiNed and U-net++ models were used to extract flat cultivated land, and the results of the two models were overlaid and analyzed to obtain preliminary extraction results for this type. These preliminary results were combined with the cultivated land range results, removing incorrect plots to obtain the final flat cultivated land results, which were then used as masks for extracting terraced fields. The same method was used to integrate the results of the RCF and DeepLab v3+ models for extracting terraced fields, which were then overlaid with the cultivated land range for analysis to obtain terraced field results. After masking, the U-net++ model was used to extract sloped cultivated land from the masked images. The preliminary sloped land results were overlaid with the cultivated land range to remove errors. Then, in forested areas, the DeepLab v3+ model was used to extract forest-interspersed cultivated land. The results from the RCF and DexiNed edge detection models yielded edge strength maps, which accurately delineated the boundaries of flat and terraced cultivated lands. These edge strength maps were skeletonized and converted into line vector formats. In contrast, the semantic segmentation models, U-net++ and DeepLabV3+, produced raster classification results. For flat cultivated land and terraced cultivated land, the raster classification results were overlaid with the boundary vector results to obtain polygon vector outputs for these two types. For sloping cultivated land and forest intercrop lands, the raster classification results were directly converted into polygon vector formats. The four polygon layers were merged using ArcGIS 10.8, followed by the topological checking and processing of the merged results, ultimately producing the cultivated land distribution map for the study area. The overall technical roadmap is shown in Figure 4.

3. Result

3.1. Overall Distribution Mapping of Cultivated Land

Based on a zonal and hierarchical approach integrating edge features and semantic segmentation models, distribution maps of the various types of cultivated land in Tongnan District were obtained, with the four representative areas selected shown in Figure 5. The area statistics for each type of cultivated land in these regions are summarized in Table 3. An analysis of the extraction results indicates that the cultivated land in the study area is widespread, with diverse landforms and a high degree of fragmentation. Spatially, flat cultivated land is predominantly found in plain areas along river valleys and in relatively flat hilly regions reclaimed by human activity. This type is characterized by regular shapes and an orderly distribution, accounting for the largest proportion of cultivated land at 72.42% (Figure 5C). Sloping cultivated land and terraced cultivated land are located in hilly and mountainous areas with significant elevation changes, mostly distributed among valleys and slopes. Terraced cultivated land is relatively orderly and covers 13.60% of the total cultivated land (Figure 5A), while sloping cultivated land is more scattered and fragmented, comprising 9.96% (Figure 5D). Forest intercrop land is primarily situated in densely forested mountainous regions at higher altitudes, often difficult to distinguish from forest and grassland areas and exhibiting the highest degree of fragmentation. This type represents the smallest proportion of cultivated land at 4.02% (Figure 5B).

3.2. Analysis of Different Types of Cultivated Land Extraction

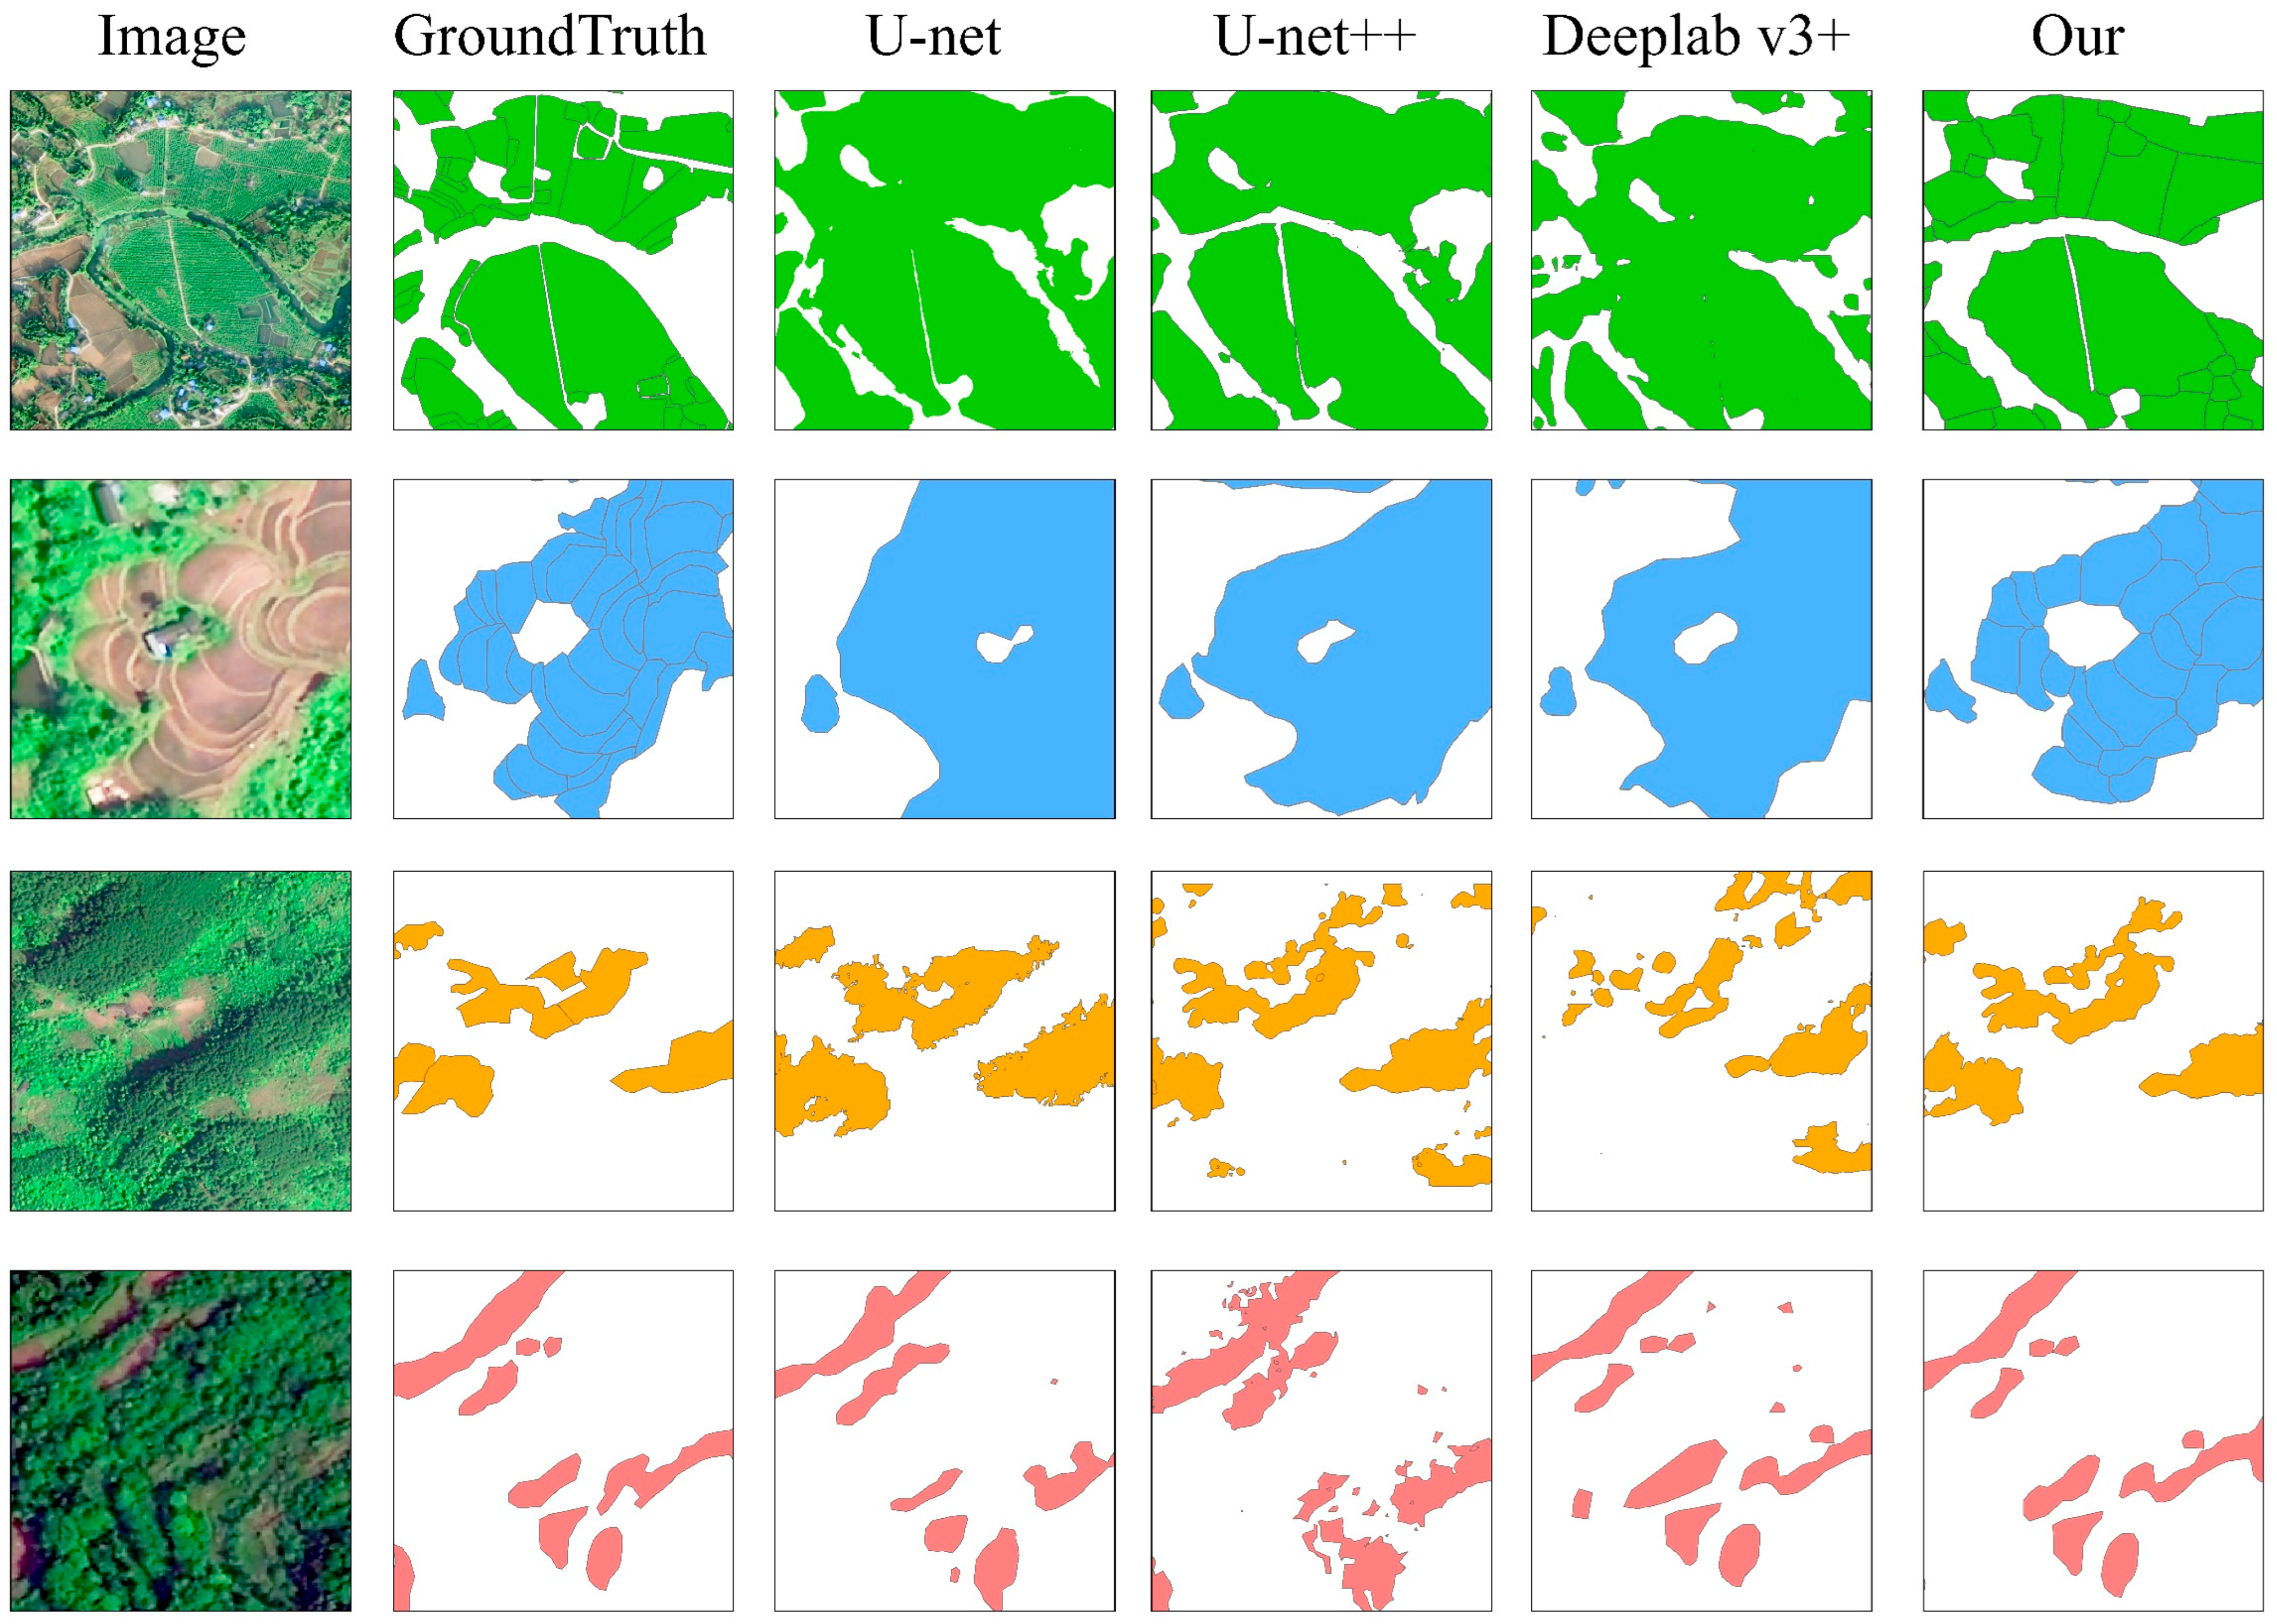
The research area was partitioned and stratified following the aforementioned procedure, resulting in the distribution of cropland parcels within the study area. To verify the superiority of the partitioned model integration extraction method, an accuracy comparison of the experimental results was conducted. Typical regions within the study area were selected as validation zones for each type of cropland. Since field survey data could only validate the overall cropland boundaries and were insufficient for accurately distinguishing between different types of cropland, we opted to obtain the actual parcel information through the visual interpretation of the remote sensing imagery. Professionals visually interpreted and annotated the cropland within these four validation zones to obtain actual cropland parcel data. Based on this, the cropland extraction results from different partitions using the proposed method were compared with those obtained using commonly used models such as U-net, U-net++, and DeepLab v3+. The comparison of the extraction results with the actual parcels is shown in Figure 6. The comparison clearly indicates that the method adopted in this study, which integrates edge features and semantic segmentation models and overlays them with cropland extent analysis, yields results with relatively accurate boundaries and correct ranges, closely aligning with the actual situation.
The Intersection over Union (IoU), overall accuracy (OA), and Kappa coefficient were used as the quantitative evaluation indicators. The IoU is the ratio of the intersection to the union of the predicted result and ground truth, representing the degree of fit between the extracted cultivated land patches and the actual cultivated land plots. It is calculated based on the manually annotated plots and the extracted data. The OA is the ratio of correctly classified parts to the total. The Kappa coefficient is used to measure the degree of agreement between the classifier’s predictions and the true situation. The accuracies of the different methods for extracting various partitioned cultivated lands are shown in Table 4. The formulas for calculating the IoU and classification accuracy are as follows:
I o U = A B A B
O A = T P + T N T P + F N + F P + T N
where A represents the area of the extracted plot, B represents the area of the actual plot, TP represents the true positive, FN represents the false negative, FP represents the false positive, and TN represents the true negative.

3.3. Analysis of the Role of Partitioning and Layering

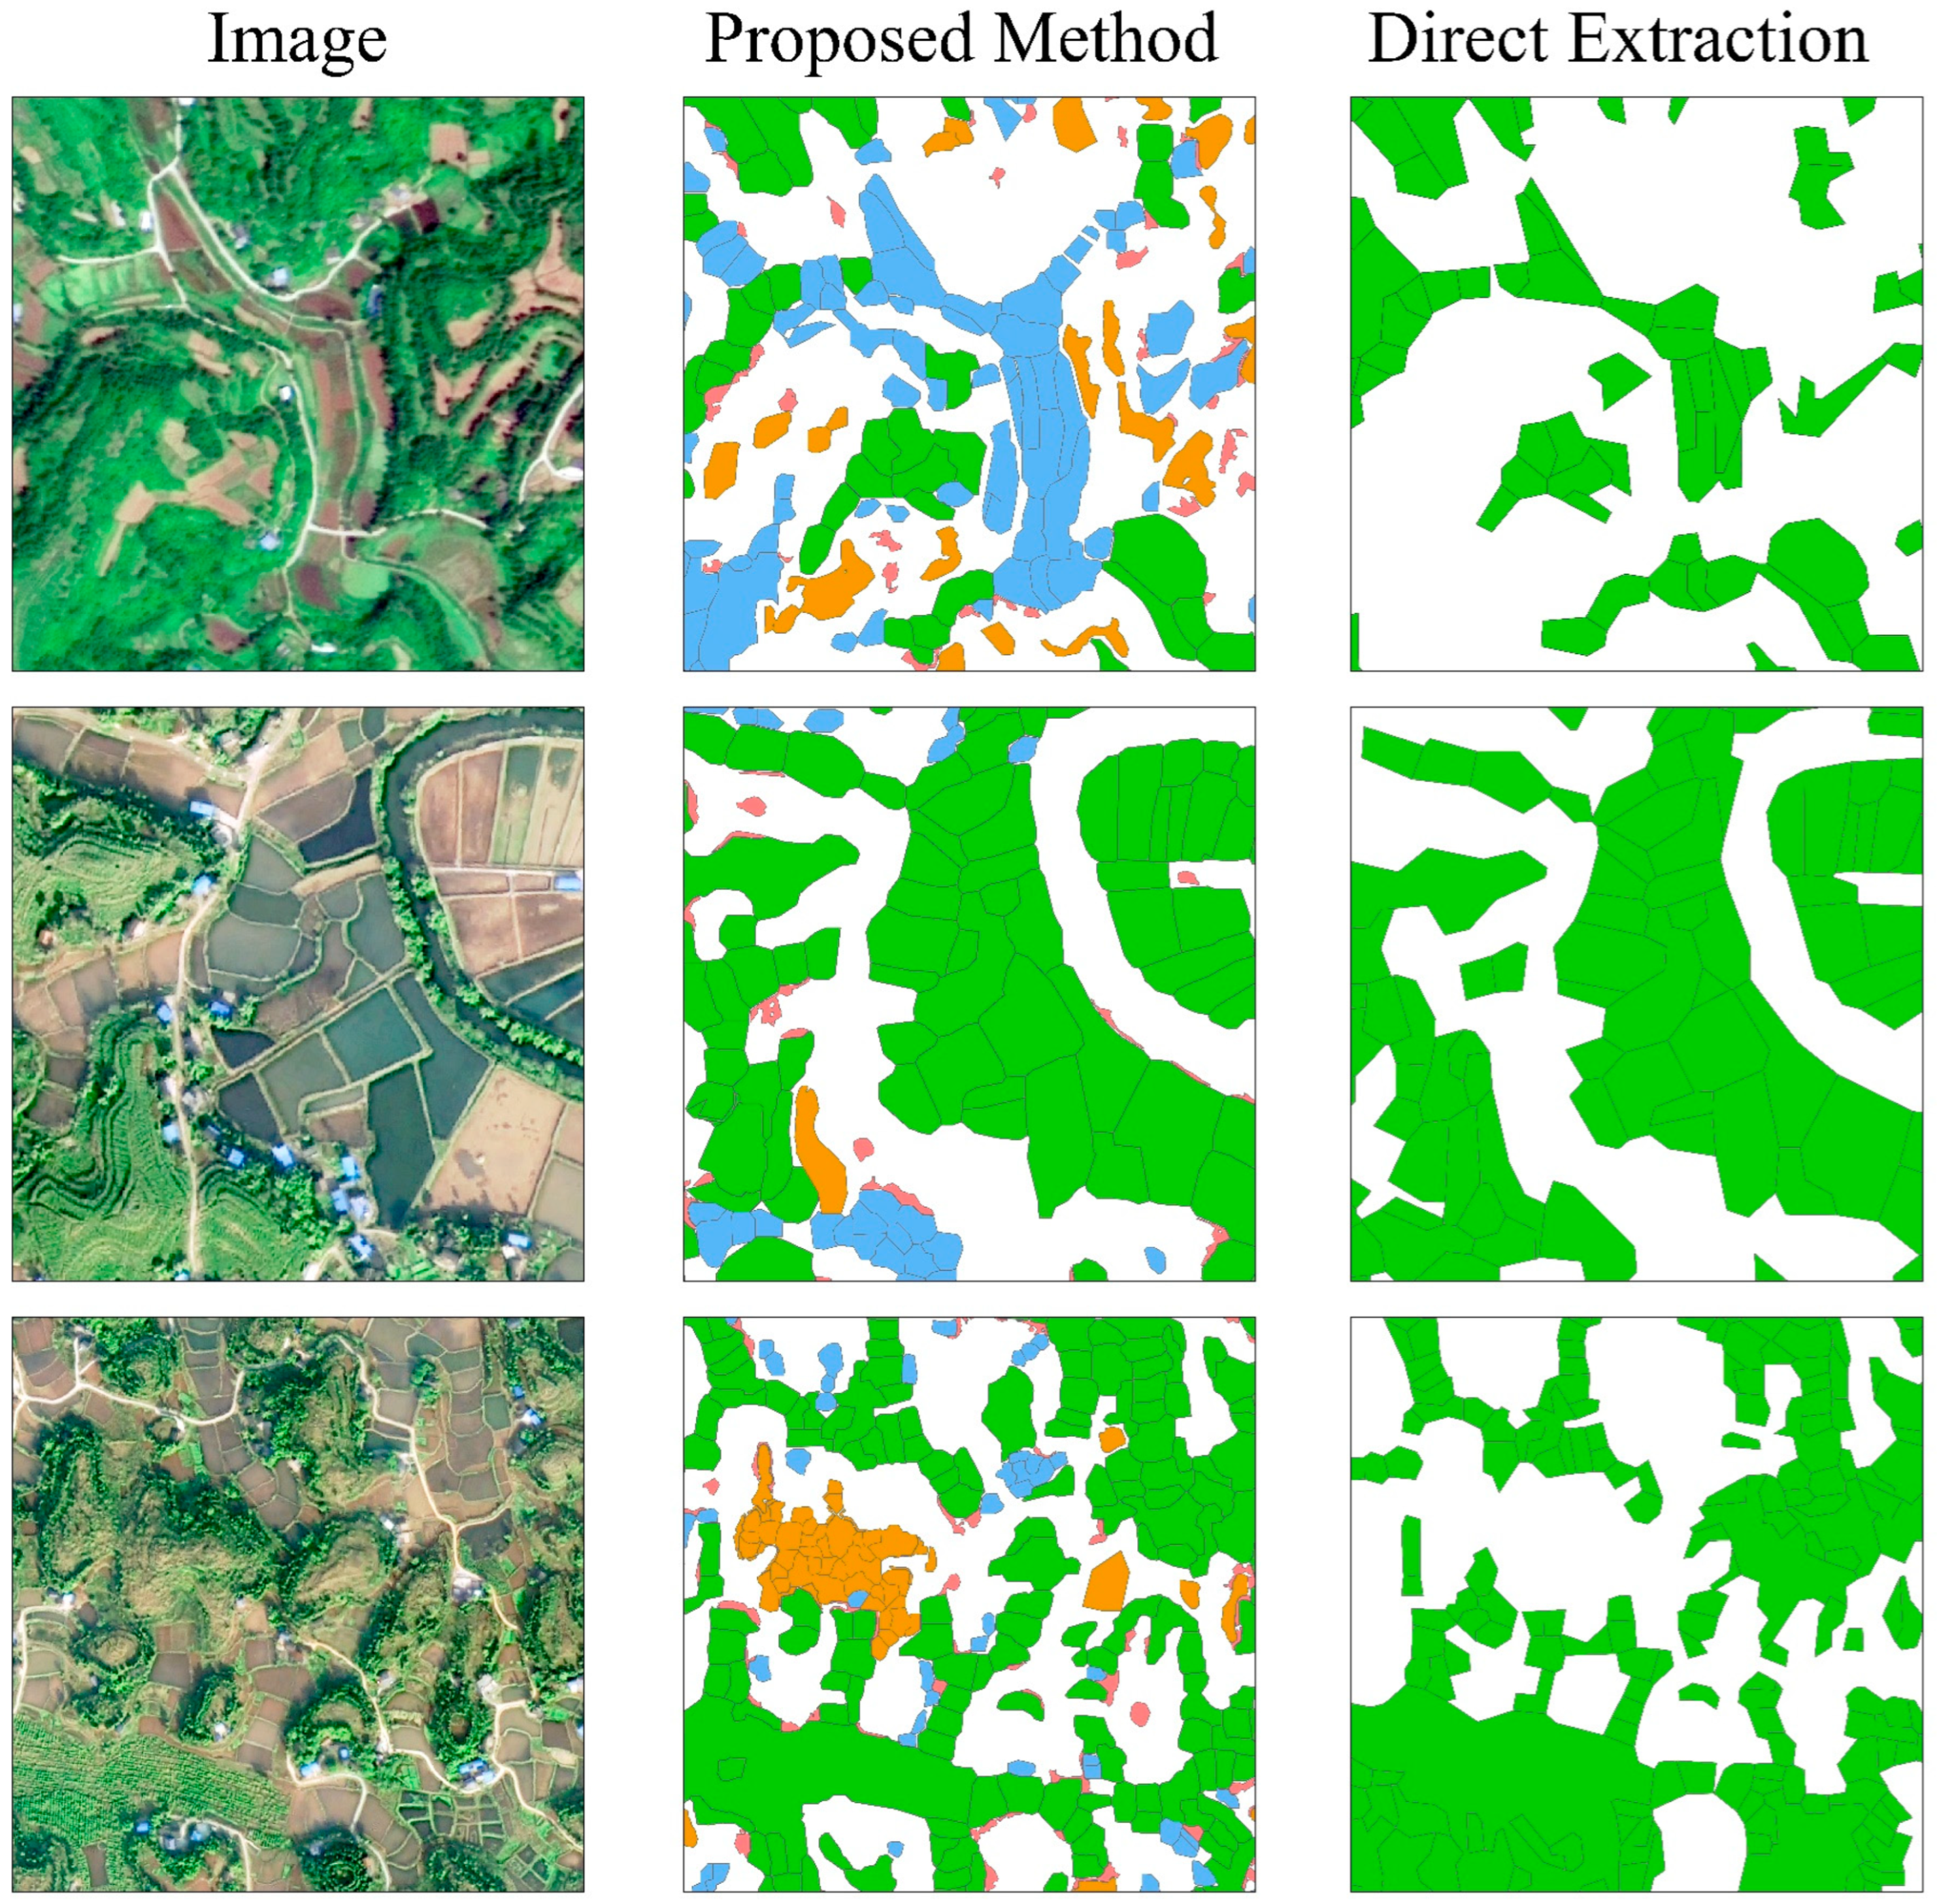
Due to the complex terrain in mountainous areas, the spatial morphology of cultivated land exhibits various characteristics, resulting in fragmented and diverse planting structures. By considering the geographical spatial heterogeneity, the study area was divided into plains, mountainous areas, and forest–grass regions. This approach effectively reduced the negative impact of the terrain complexity on the classification tasks, facilitating the classification and analysis of different types of cultivated land. The cultivated land within the three different regions was categorized into flat cultivated land, terraced cultivated land, sloping cultivated land, and forest intercrop land. Appropriate models were selected based on the characteristics of each cultivated land type. The layered extraction of cultivated land can reduce the mutual interference between different land types, thereby easing the difficulties in sample preparation and model training. To demonstrate the significant impact of partitioning and layering on the results of the cultivated land extraction, we conducted a comparative experiment. In this experiment, we compared our method, which involves partitioning and layering the study area, with a method that directly uses the U-net++ model and DexiNed model to perform a unified and direct extraction of all types of cultivated land without partitioning and layering the study area. A comparison of the results of the partitioned and layered extraction method with those of the non-partitioned and direct extraction method is shown in Table 5. As illustrated in Figure 7, the partitioned and layered extraction method effectively improves the extraction accuracy, reducing errors and omissions.

3.4. Efficiency Analysis of Cultivated Land Extraction

In terms of the extraction efficiency, this study’s method significantly reduces the labor and improves the extraction efficiency by using deep learning models instead of manual visual interpretation. The integrated process of edge detection and semantic segmentation models for extracting cultivated land includes steps such as sample preparation, model training, and model prediction. The experimental process involves creating samples for four distinct types of cropland, preparing semantic segmentation samples for each type, and additionally, generating boundary samples for flat cultivated land and terraced cultivated land for edge detection. Models are trained individually for each cropland type. For flat cultivated land and terraced cultivated land, both semantic segmentation and edge detection models are integrated for extraction, while semantic segmentation models alone are used for sloping cultivated land and forest intercrop land. The time consumed in each step is influenced by objective factors such as the equipment conditions.
Manual visual interpretation requires knowledgeable and experienced professionals to delineate land boundaries using specialized geographic information software, resulting in accurate cultivated land plots. The manual process includes tasks such as staff training and plot delineation. For example, when producing cultivated land plots for Tongnan District, the time spent on each step of the two methods was compared and is summarized in Table 6. It is evident that, for producing plots in the same area with similar accuracy, the proposed method offers a significant advantage in time savings, improving efficiency while reducing labor and material costs. Additionally, in the sample creation process, we primarily considered the major types of cultivated land in complex scenarios. For future applications in larger or similar regions, only a small number of typical samples would need to be added, eliminating the need to create an entirely new sample dataset. Consequently, this method is expected to save significantly more time compared to manual visual interpretation at the application level.

4. Discussion

The study results indicate that integrating edge detection and semantic segmentation models significantly enhances the accuracy and efficiency of cultivated land extraction tasks. By incorporating the theoretical framework of geographical zonal stratification, the integration of edge detection and semantic segmentation models allows for a more detailed understanding of the fragmented and diverse distribution of the cultivated land within the study area. This effectively mitigates common issues in single-model approaches, such as the loss of edge details and poor model adaptability. Using this method, the overall accuracy for cultivated land extraction in the study area reached 95.07%, which is an improvement of 15.78% compared to the 79.57% accuracy achieved by methods that did not employ geographic partitioning and layering. Additionally, it surpasses the 92.91% accuracy achieved by methods that did not use medium-resolution remote sensing imagery for land classification by 2.16%. These comparative results indicate that integrating geographic partitioning and layering with medium-resolution remote sensing imagery significantly enhances the accuracy of cultivated land extraction. This study provides a new framework for the intelligent extraction of cultivated land in complex regions, demonstrating the potential of integrating geographical techniques with agricultural production. Despite these advancements, the proposed method has certain limitations. In complex mountainous regions, the high dispersion of cultivated land and the diversity of planting structures can lead to significant intraclass variation, making it challenging to distinguish between different types of cultivated land during zonal stratification. Furthermore, similarities between certain types of cultivated land, such as flat fields, terraces, sloping fields, and forestland, may result in misclassification. The presence of numerous small, fragmented plots in hilly and mountainous areas can lead to omissions during edge detection and segmentation, potentially excluding some small plots from the final map.
To enhance the accuracy of cultivated land extraction, future research should focus on refining deep learning models tailored to different types of cultivated land. This effort is anticipated to yield significant improvements in the extraction accuracy. Future studies should also explore advanced partitioning methods for deep learning tasks in complex regions to minimize the impact of inaccurate partitioning on the boundary extraction accuracy, thereby reducing the post-processing workload. Utilizing multi-temporal, high-resolution remote sensing imagery to analyze the temporal variation characteristics of land features could further enhance the differentiation between cultivated and non-cultivated plots. To improve the accuracy of forest intercrop land extraction, we plan to enhance our approach in two key areas: (1) We will modify the existing models or design new deep learning models tailored to the unique characteristics of forest-interspersed cultivated land, enabling the better exploration and learning of the texture and edge features specific to these areas. (2) In cases where high-resolution data do not reveal significant edge or texture features, we will integrate multi-source remote sensing images, leveraging phenological differences to enhance the differentiation accuracy of forest-interspersed cultivated land. Finally, enhancing the transferability of the models to reduce reliance on annotated data will be crucial for improving the overall performance and applicability of the models. Simultaneously, we plan to extend the application of this research method to other fields in the future, encompassing three levels: first, we will apply it to similar regions, such as mountainous areas, where it can be adapted to the regional characteristics by supplementing a small number of typical samples and making simple parameter adjustments; second, we will apply it to other types of regions, such as plains, where a single model can be selected based on the regional characteristics; third, we will expand it to other fields, such as extracting forest and other land cover categories, where the primary focus would be on the technical framework and specific models, by integrating relevant technical processes and training corresponding models for application.

5. Conclusions

This study introduces the concept of geographic partitioning and stratification to control and extract farmland in complex mountainous regions. By employing temporally resolved medium-resolution remote sensing imagery, we effectively identified the farmland extents. This method integrates edge detection models with semantic segmentation models to separately extract different types of farmland plots within complex terrains, ultimately generating a comprehensive farmland distribution map for the study area. The significance of this research lies in its ability to address challenges posed by fragmented land parcels and diverse cropping types in complex mountainous settings, substantially reducing the workload and enabling the rapid and accurate automated extraction of farmland distributions in such environments.
The study’s findings indicate the following: First, through the partitioning of the study area’s complex environment, we obtained farmland types with consistent internal characteristics, fully accounting for the heterogeneity of the geographic environment. This approach not only minimizes the interference between the boundaries and internal textures of different farmland types but also significantly reduces the difficulty of model training. Second, the classification of medium-resolution remote sensing imagery, combined with its short revisit period, allows for the precise identification of farmland extents, effectively reducing false positives and omissions and improving the extraction accuracy. Third, the integration of edge detection and semantic segmentation models for processing high-resolution imagery fully leverages the advantages of deep learning in intelligent remote sensing interpretation. Compared to manual interpretation results, the integrated extraction method demonstrates a similar accuracy in boundary and extent delineation but with significantly higher efficiency, highlighting its clear advantages in farmland extraction applications.
In conclusion, this study’s method, which combines multi-source remote sensing data with deep learning algorithms, effectively utilizes the various characteristics of farmland in complex mountainous regions. By integrating edge detection and semantic segmentation models, the method rapidly and accurately generates farmland distribution maps for the study area. This approach provides valuable insights for remote sensing and precision agriculture research and holds practical significance for monitoring farmland, particularly in smallholder farming systems in complex mountainous environments.

Author Contributions

Conceptualization, Y.L., W.D., and X.Z.; formal analysis, Y.L. and W.D.; investigation, Y.L., T.W., and M.L.; methodology, Y.L. and Y.Z.; resources, L.L.; software, Y.Z. and J.Z.; supervision, X.Z.; validation, L.L., T.W., and M.L.; writing—original draft, Y.L.; writing—review and editing, W.D. All authors have read and agreed to the published version of the manuscript.

Funding

This research was funded by National Key R&D Program of China, grant number 2021YFB3900501; Major Special Project of the High-Resolution Earth Observation System, grant number 86-Y50G27-9001-22/23; Chongqing Agricultural Industry Digital Map Project, grant number 21C00346.

Institutional Review Board Statement

Not applicable.

Data Availability Statement

The original contributions presented in the study are included in the article.

Acknowledgments

We would like to thank the Chongqing Planning and Natural Resources Bureau for their support in providing the data.

Conflicts of Interest

The authors declare no conflicts of interest.

References

  1. Dong, J.W.; Wu, W.B.; Huang, J.X.; You, N.S.; He, Y.L.; Yan, H.M. State of the art and perspective of agricultural land use remote sensing information extraction. J. Geo-Inf. Sci. 2020, 22, 772–783. [Google Scholar]
  2. Chen, Z.X.; Ren, J.Q.; Tang, H.J.; Shi, Y.; Leng, P.; Liu, J.; Wang, L.M.; Wu, W.B.; Yao, Y.M. Hashtuya. Progress and perspectives on agricultural remote sensing research and applications in China. J. Remote Sens. 2016, 20, 748–767. [Google Scholar]
  3. Tilman, D.; Cassman, K.G.; Matson, P.A.; Naylor, R.; Polasky, S. Agricultural sustainability and intensive production practices. Nature 2002, 418, 671–677. [Google Scholar] [CrossRef] [PubMed]
  4. Wu, B.; Zhang, F.; Liu, C.; Zhang, L.; Luo, Z.M. An integrated method for crop condition monitoring. J. Remote Sens. 2004, 8, 498–514. [Google Scholar]
  5. Wang, J.; Xin, L. Spatial-temporal variations of cultivated land and grain production in China based on GlobeLand30. Trans. Chin. Soc. Agric. Eng. 2017, 33, 1–8. [Google Scholar]
  6. Chen, J.; Huang, J.; Lin, H.; Pei, Z.Y. Rice yield estimation by assimilation remote sensing into crop growth model. Sci. Chin. Inf. Sci. 2010, 40, 173–183. [Google Scholar]
  7. Ozdogan, M. The spatial distribution of crop types from MODIS data: Temporal unmixing using Independent Component Analysis. Remote Sens. Environ. 2010, 114, 1190–1204. [Google Scholar] [CrossRef]
  8. Zhang, G.; Zhu, Y.; Zhai, B. WebGIS-based warning information system for crop pest and disease. Trans. Chin. Soc. Agric. Eng. 2007, 23, 176–181. [Google Scholar]
  9. Stibig, H.J.; Belward, A.S.; Roy, P.S.; Rosalina-Wasrin, U.; Agrawal, S.; Joshi, P.K.; Hildanus Beuchle, R.; Fritz, S.; Mubareka, S.; Giri, C. A land-cover map for South and Southeast Asia derived from SPOT-VEGETATION data. J. Biogeogr. 2007, 34, 625–637. [Google Scholar] [CrossRef]
  10. Li, S.; Zhang, R. The decision tree classification and its application in land cover. Areal Res. 2003, 22, 17–21. [Google Scholar]
  11. Chen, J.; Chen, J.; Liao, A.P.; Cao, X.; Chen, L.J.; Chen, X.H.; He, C.Y.; Han, G.; Peng, S.; Lu, M.; et al. Global land cover mapping at 30 m resolution: A POK-based operational approach. ISPRS J. Photogramm. Remote Sens. 2015, 103, 7–27. [Google Scholar] [CrossRef]
  12. Zhang, X.; Huang, J.; Ning, T. Progress and Prospect of Cultivated Land Extraction from High-Resolution Remote Sensing Images. Geomat. Inf. Sci. Wuhan Univ. 2023, 48, 1582–1590. [Google Scholar]
  13. Li, S.T.; Li, C.Y.; Kang, X.D. Development status and future prospects of multi-source remote sensing image fusion. Natl. Remote Sens. Bull. 2021, 25, 148–166. [Google Scholar] [CrossRef]
  14. Cord, A.F.; Klein, D.; Mora, F.; Dech, S. Comparing the suitability of classified land cover data and remote sensing variables for modeling distribution patterns of plants. Ecol. Model. 2014, 272, 129–140. [Google Scholar] [CrossRef]
  15. Valjarević, A.; Popovici, C.; Štilić, A.; Radojković, M. Cloudiness and water from cloud seeding in connection with plants distribution in the Republic of Moldova. Appl. Water Sci. 2022, 12, 262. [Google Scholar] [CrossRef]
  16. Hernandez, I.E.R.; Shi, W.Z. A Random Forests classification method for urban land-use mapping integrating spatial metrics and texture analysis. Int. J. Remote Sens. 2018, 39, 1175–1198. [Google Scholar] [CrossRef]
  17. Li, C.J.; Huang, H.; Li, W. Research on agricultural remote sensing image cultivated land extraction technology based on support vector. Instrum. Technol. 2018, 11, 5–8. [Google Scholar]
  18. Singh, M.; Tyagi, K.D. Pixel based classification for Landsat 8 OLI multispectral satellite images using deep learning neural network. Remote Sens. Appl. Soc. Environ. 2021, 24, 100645. [Google Scholar] [CrossRef]
  19. Krizhevsky, A.; Sutskever, I.; Hinton, G. ImageNet Classification with Deep Convolutional Neural Networks. Adv. Neural Inf. Process. Syst. 2012, 25, 1097–1105. [Google Scholar] [CrossRef]
  20. Saito, S.; Yamashita, T.; Aoki, Y. Multiple Object Extraction from Aerial Imagery with Convolutional Neural Networks. Electron. Imaging 2016, 28, 10402-1–10402-9. [Google Scholar] [CrossRef]
  21. Wei, Y.; Zhang, K.; Ji, S. Simultaneous Road Surface and Centerline Extraction From Large-Scale Remote Sensing Images Using CNN-Based Segmentation and Tracing. IEEE Trans. Geosci. Remote Sens. 2020, 58, 8919–8931. [Google Scholar] [CrossRef]
  22. Wang, G.J.; Hu, Y.F.; Zhang, S.; Ru, Y.; Chen, K.N.; Wu, M.J. Water identification from the GF-1 satellite image based on the deep Convolutional Neural Networks. Natl. Remote Sens. Bull. 2022, 26, 2304–2316. [Google Scholar] [CrossRef]
  23. Farabet, C.; Couprie, C.; LeCun, Y. Learning hierarchical features for scene labeling. IEEE Trans. Pattern Anal. Mach. Intell. 2013, 35, 1915–1929. [Google Scholar] [CrossRef] [PubMed]
  24. Long, J.; Shelhamer, E.; Darrell, T. Fully Convolutional Networks for Semantic Segmentation. IEEE Trans. Pattern Anal. Mach. Intell. 2015, 39, 640–651. [Google Scholar]
  25. Cheng, W.F.; Zhou, Y.; Wang, S.X.; Han, Y.; Wang, F.T.; Pu, Q.Y. Study on the Method of Recognizing Abandoned Farmlands Based on Multispectral Remote Sensing. Spectrosc. Spectral Anal. 2011, 31, 1615–1620. [Google Scholar]
  26. Du, Z.; Yang, J.; Ou, C.; Zhang, T.T. Smallholder Crop Area Mapped with a Semantic Segmentation Deep Learning Method. Remote Sens. 2019, 11, 888. [Google Scholar] [CrossRef]
  27. Xie, S.; Tu, Z. Holistically-Nested Edge Detection. In Proceedings of the 2015 IEEE International Conference on Computer Vision, Santiago, Chile, 7–13 December 2015. [Google Scholar]
  28. Liu, Y.; Shen, C.; Lin, G.; Reid, I. Richer Convolutional Features for Edge Detection. IEEE Trans. Pattern Anal. Mach. Intell. 2019, 41, 1939–1946. [Google Scholar] [CrossRef] [PubMed]
  29. Li, S.; Peng, L.; Hu, Y.; Chi, T. FD-RCF-Based Boundary Delineation of Agricultural Fields in High Resolution Remote Sensing Images. J. Univ. Chin. Acad. Sci. 2020, 37, 483–489. [Google Scholar]
  30. Zhou, N.; Yang, P.; Wei, C.; Shen, Z.F.; Yu, J.J.; Ma, X.Y.; Luo, J.C. Accurate Extraction Method for Cropland in Mountainous Areas Based on Field Parcel. Trans. Chin. Soc. Agric. Eng. 2021, 37, 260–266. [Google Scholar]
  31. Ren, H.; Zhao, Y.; Li, X.; Ge, Y. Cultivated Land Fragmentation in Mountainous Areas Based on Different Resolution Images and Its Scale Effects. Geogr. Res. 2020, 39, 1283–1294. [Google Scholar]
  32. Jing, X.; Wang, J.D.; Wang, J.H.; Huang, W.J.; Liu, L.Y. Classifying Forest Vegetation Using Sub-Region Classification Based on Multi-Temporal Remote Sensing Images. Remote Sens. Technol. Appl. 2008, 23, 394–397. [Google Scholar]
  33. Liu, D.; Han, L.; Han, X. High Spatial Resolution Remote Sensing Image Classification Based on Deep Learning. Acta Opt. Sin. 2016, 36, 0428001. [Google Scholar]
  34. Wu, Z.F.; Luo, J.C.; Sun, Y.W.; Wu, T.J.; Cao, Z.; Liu, W.; Yang, Y.P.; Wang, L.Y. Research on Precision Agriculture Based on the Spatial-Temporal Remote Sensing Collaboration. J. Geo-Inf. Sci. 2020, 22, 731–742. [Google Scholar]
  35. Liu, W.; Wu, Z.F.; Luo, J.C.; Sun, Y.W.; Wu, T.J.; Zhou, N.; Hu, X.D.; Wang, L.Y.; Zhou, Z.F. A Divided and Stratified Extraction Method of High-Resolution Remote Sensing Information for Cropland in Hilly and Mountainous Areas Based on Deep Learning. Acta Geod. Cartogr. Sin. 2021, 50, 105–116. [Google Scholar]
  36. Luo, J.C.; Wu, T.J.; Wu, Z.F.; Zhou, Y.N.; Gao, L.J.; Sun, Y.W.; Wu, W.; Yang, Y.P. Methods of Intelligent Computation and Pattern Mining Based on Geo-Parcels. J. Geo-Inf. Sci. 2020, 22, 57–75. [Google Scholar]
  37. You, N.; Dong, J. Examining the Earliest Identifiable Timing of Crops Using All Available Sentinel-1/2 Imagery and Google Earth Engine. ISPRS J. Photogramm. Remote Sens. 2020, 161, 109–123. [Google Scholar] [CrossRef]
  38. Wan, J.; Liao, J.J.; Xu, T.; Shen, G. Accuracy evaluation of SRTM data based on ICESat/GLAS altimeter data: A case study in the Tibetan Plateau. Remote Sens. Land Resour. 2015, 27, 100–105. [Google Scholar]
  39. Zanaga, D.; Van De Kerchove, R.; De Keersmaecker, W.; Souverijns, N.; Brockmann, C.; Quast, R.; Wevers, J.; Grosu, A.; Paccini, A.; Vergnaud, S.; et al. ESA WorldCover 10 m 2020 v100. 2021. Available online: https://worldcover2020.esa.int (accessed on 1 August 2023).
  40. Zanaga, D.; Van De Kerchove, R.; Daems, D.; De Keersmaecker, W.; Brockmann, C.; Kirches, G.; Wevers, J.; Cartus, O.; Santoro, M.; Fritz, S.; et al. ESA WorldCover 10 m 2021 v200. 2022. Available online: https://worldcover2021.esa.int (accessed on 1 August 2023).
  41. Yang, J.; Huang, X. The 30 m annual land cover datasets and its dynamics in China from 1985 to 2023. Earth Syst. Sci. Data 2024, 13, 3907–3925. [Google Scholar] [CrossRef]
  42. Huang, X.; Meng, Q. Land Cover Classification of Sentinel-2 Image Based on Multi-feature Convolution Neural Network. J. Appl. Sci. 2023, 41, 766–776. [Google Scholar]
  43. Lobell, D.B.; Thau, D.; Seifert, C.; Engle, E.; Little, B. A Scalable Satellite-Based Crop Yield Mapper. Remote Sens. Environ. 2015, 164, 324–333. [Google Scholar] [CrossRef]
  44. Huang, H.; Chen, Y.; Clinton, N.; Wang, J.; Wang, X.; Liu, C.; Gong, P.; Yang, J.; Bai, Y.; Zheng, Y.; et al. Mapping Major Land Cover Dynamics in Beijing Using All Landsat Images in Google Earth Engine. Remote Sens. Environ. 2017, 202, 166–176. [Google Scholar] [CrossRef]
  45. Gorelick, N.; Hancher, M.; Dixon, M.; Ilyushchenko, S.; Thau, D.; Moore, R. Google Earth Engine: Planetary-Scale Geospatial Analysis for Everyone. Remote Sens. Environ. 2017, 202, 18–27. [Google Scholar] [CrossRef]
  46. Tucker, C.J. Red and photographic infrared linear combinations for monitoring vegetation. Remote Sens. Environ. 1979, 8, 127–150. [Google Scholar] [CrossRef]
  47. Xiang, K.; Yuan, W.; Wang, L.; Deng, Y. An LSWI-Based Method for Mapping Irrigated Areas in China Using Moderate-Resolution Satellite Data. Remote Sens. 2020, 12, 4181. [Google Scholar] [CrossRef]
  48. Xu, H. Modification of Normalized Difference Water Index (NDWI) to enhance open water features in remotely sensed imagery. Int. J. Remote Sens. 2006, 27, 3025–3033. [Google Scholar] [CrossRef]
  49. Sulik, J.J.; Long, D.S. Spectral considerations for modeling yield of canola. Remote Sens. Environ. 2016, 184, 161–174. [Google Scholar] [CrossRef]
  50. Kearney, M.S.; Rogers, A.S.; Townshend, J.R.G.; Rizzo, E.; Stutzer, D.; Stevenson, J.C.; Sundborg, K. Developing a model for determining coastal marsh “health”. In Proceedings of the Third Thematic Conference on Remote Sensing for Marine and Coastal Environments, Seattle, WA, USA, 18–20 September 1995. [Google Scholar]
  51. Lyu, S.Y.; Li, J.T.; A, X.H.; Yang, C.; Yang, R.C.; Shang, X.M. Res_ASPP_UNet++: Building an Extraction Network from Remote Sensing Imagery Combining Depthwise Separable Convolution with Atrous Spatial Pyramid Pooling. Nat. Remote Sens. Bull. 2023, 27, 502–519. [Google Scholar] [CrossRef]
  52. Zhang, J.; Chen, Y.Y.; Qin, Z.Y.; Zhang, M.Y.; Zhang, J. Remote Sensing Extraction Method of Terraced Fields Based on Improved DeepLab v3+. Smart Agric. 2024, 6, 46–57. [Google Scholar]
  53. Dong, D.; Ming, D.; Weng, Q.; Yang, Y.; Fang, K.; Xu, L.; Du, T.; Zhang, Y.; Liu, R. Building Extraction from High Spatial Resolution Remote Sensing Images of Complex Scenes by Combining Region-Line Feature Fusion and OCNN. IEEE J. Sel. Top. Appl. Earth Observ. Remote Sens. 2023, 16, 4423–4438. [Google Scholar] [CrossRef]
  54. Chen, Q.; Zhu, L.; Lyu, S.D.; Wu, J. Segmentation of High-Resolution Remote Sensing Image by Collaborating with Edge Loss. Enhancement. J. Image Graphics. 2021, 26, 674–685. [Google Scholar]
Figure 1. The location and topography of the study area.
Agriculture 14 01553 g001
Figure 2. Typical sample diagram: land cover sample points (a), edge detection samples (b,b1,c,c1), semantic segmentation samples (d,d1,e,e1).
Agriculture 14 01553 g002
Figure 3. Diagram of zoning and layering: plain area (A); mountainous area (B); forest–grass area (C); flat cultivated land (a); terraced cultivated land (b1); sloping cultivated land (b2); forest intercrop land (c).
Agriculture 14 01553 g003
Figure 4. Technology roadmap.
Agriculture 14 01553 g004
Figure 5. Overall distribution mapping: the distribution characteristics of terraced cultivated land (A), the distribution characteristics of forest intercrop land (B), the distribution characteristics of flat cultivated land (C), and the distribution characteristics of sloping cultivated land (D).
Agriculture 14 01553 g005
Figure 6. Comparison of different models.
Agriculture 14 01553 g006
Figure 7. A comparison of the results of the partitioned and layered extraction method with those of the non-partitioned and direct extraction method.
Agriculture 14 01553 g007
Table 1. Experimental image data information.
No.SatelliteResolution (m)Time RangeComposition Frequency
1GF-20.8 (panchromatic band)1 January 2022–1 July 2022Annual Composition
3.24 (multispectral bands)
2Sentinel-1101 March 2022–1 October 2022Monthly Composition
3Sentinel-2101 March 2022–1 October 2022Monthly Composition
Table 2. Features of medium-resolution remote sensing images.
Feature CategoryFeature Name
Spectral BandsRed Band
Green Band
Blue Band
Near-Infrared Band
SWIR1
SWIR2
Spectral IndexesNDVI
NDYI
NDSI
MNDWI
LSWI
SAR FeaturesVH
VV
VH/VV
Table 3. Extracted cultivated land information.
Cultivated Land TypeNumber of PlotsProportion of Plots (%)Area (km2)Area Proportion (%)
Flat Cultivated Land302,60946.93593.13472.42
Terraced Cultivated Land164,38225.49111.37613.60
Sloping Cultivated Land31,9594.9681.6029.96
Forest Intercrop Land145,90222.6232.9314.02
Table 4. Indicator comparison for different types of cultivated land.
Cultivated Land TypeMethodIoUOA (%)Kappa
Flat Cultivated
Land
Proposed Method0.878892.490.8461
U-net0.773284.210.6653
U-net++0.808287.400.7345
DeepLab v3+0.790684.460.6722
Terraced Cultivated
Land
Proposed Method0.883196.180.9112
U-net0.682185.660.7052
U-net++0.711987.220.7337
DeepLab v3+0.763690.180.7901
Sloping Cultivated
Land
Proposed Method0.733593.800.8017
U-net0.636389.010.7023
U-net++0.623690.050.7048
DeepLab v3+0.504482.700.5538
Forest Intercrop
Land
Proposed Method0.716478.830.5668
U-net0.526077.540.4709
U-net++0.465475.170.4051
DeepLab v3+0.705778.570.5280
Explanation: The bolded section indicates the best performing method under this indicator.
Table 5. Comparison of extraction accuracy with and without partitioning and layering.
IndicatorIoUOA (%)Kappa
Proposed Method0.818195.070.9004
Direct Extraction Method0.665479.290.5686
Table 6. Time comparison of two extraction methods.
Extraction MethodStepTime (hours)Total Time (hours)
Proposed MethodPersonnel Training8304
Sample Preparation72
Model Training144
Model Prediction30
Post-processing50
Manual InterpretationPersonnel Training82118
Feature Mapping2110
Disclaimer/Publisher’s Note: The statements, opinions and data contained in all publications are solely those of the individual author(s) and contributor(s) and not of MDPI and/or the editor(s). MDPI and/or the editor(s) disclaim responsibility for any injury to people or property resulting from any ideas, methods, instructions or products referred to in the content.