Abstract
As an essential component of the global economic crop, cotton is highly susceptible to the impact of diseases on its yield and quality. In recent years, artificial intelligence technology has been widely used in cotton crop disease recognition, but in complex backgrounds, existing technologies have certain limitations in accuracy and efficiency. To overcome these challenges, this study proposes an innovative cotton disease recognition method called CANnet, and we independently collected and constructed an image dataset containing multiple cotton diseases. Firstly, we introduced the innovatively designed Reception Field Space Channel (RFSC) module to replace traditional convolution kernels. This module combines dynamic receptive field features with traditional convolutional features to effectively utilize spatial channel attention, helping CANnet capture local and global features of images more comprehensively, thereby enhancing the expressive power of features. At the same time, the module also solves the problem of parameter sharing. To further optimize feature extraction and reduce the impact of spatial channel attention redundancy in the RFSC module, we connected a self-designed Precise Coordinate Attention (PCA) module after the RFSC module to achieve redundancy reduction. In the design of the classifier, CANnet abandoned the commonly used MLP in traditional models and instead adopted improved Kolmogorov Arnold Networks-s (KANs) for classification operations. KANs technology helps CANnet to more finely utilize extracted features for classification tasks through learnable activation functions. This is the first application of the KAN concept in crop disease recognition and has achieved excellent results. To comprehensively evaluate the performance of CANnet, we conducted extensive experiments on our cotton disease dataset and a publicly available cotton disease dataset. Numerous experimental results have shown that CANnet outperforms other advanced methods in the accuracy of cotton disease identification. Specifically, on the self-built dataset, the accuracy reached 96.3%; On the public dataset, the accuracy reached 98.6%. These results fully demonstrate the excellent performance of CANnet in cotton disease identification tasks.
1. Introduction
As an essential pillar of the global economic crop, cotton is pivotal in the international textile industry due to its abundant yield and low production costs [1]. As one of the world’s largest cotton-producing countries, China accounts for about 30% of the global total production. Xinjiang cotton is renowned worldwide for its soft and long fibers, good glossiness, and high strength. Its cotton production accounts for 92.4% of the total national output. However, the negative impact of cotton diseases poses a severe challenge to the cotton industry, as it not only threatens crop health but may also cause significant economic losses [2]. In traditional methods, the identification and inspection of diseases rely on experienced farmers for manual operation, which is not only time-consuming and labor-intensive but also has limitations in accuracy, making it challenging to meet the production needs of modern agriculture for scale and precision [3].
With the vigorous development of artificial intelligence technology, its application in crop disease recognition has opened up new horizons [4]. Traditional manual detection methods are gradually being replaced by intelligent recognition technologies, which have shown significant advantages in automation and accuracy. The intelligent recognition technology for cotton diseases is developing rapidly [5]. As an important economic crop, early diagnosis of cotton diseases is crucial for ensuring yield and quality. As cotton diseases’ most intuitive pathological feature, leaves provide rich recognition information for deep learning and computer vision technology. By inputting images of cotton leaves containing diseases into a deep learning model, automatic analysis and recognition of disease types significantly improves recognition accuracy and dramatically enhances the recognition process’s efficiency [6]. This artificial intelligence-based cotton disease recognition method effectively reduces labor costs in large-scale farm management while steadily improving disease recognition’s accuracy and response speed, making it the preferred method in the current cotton disease recognition field [7,8].
Pechuho et al. [9] developed a cross-platform recognition model using machine learning methods on a cotton dataset, achieving an accuracy rate of up to 90%. Sujatha et al. [10] compared the performance of machine learning algorithms (random forest, support vector machine, stochastic gradient descent) and deep learning algorithms through experiments on a cotton disease dataset. The analysis of experimental results shows that VGG-16 performs better than other comparative models, with an accuracy rate of 89.5%. Caldeira et al. [11] collected a dataset of 60,000 cotton leaf lesions divided into two categories: healthy and diseased. Through experiments using both machine learning and deep learning methods, it was found that the recognition accuracy of all models exceeded 70%, with SVM performing the best with an accuracy of 80%. Suriya et al. [12] proposed a cotton disease feature extraction method based on a Convolutional Neural Network (CNN) by cleverly combining convolutional layers and max pooling layers and developed a corresponding classification model. However, there is still room for improvement in the accuracy of this model in practical applications, and it is challenging to meet the high standard requirements of production practice. To address this issue, Zambare et al. [13] further optimized the model structure by introducing dense layers and flattening operations in CNN, significantly improving the model’s performance. The experimental results on public datasets show that the model achieves a recognition accuracy of 99%. Zekiwos et al. [14] developed an efficient cotton pest and disease detection mechanism based on CNN. This method was tested on a cotton dataset containing 2400 images, divided into four categories: underage leaves, spider mite leaves, healthy leaves, and bacterial withered leaves, achieving a recognition accuracy of 98%. Jajja et al. [15] proposed a network model based on Compact Convolutional Transform (CCT) and created a cotton disease dataset containing 5135 images. A high accuracy of 97.25% was achieved on this dataset. However, the above research is mainly based on stable environments and may not achieve ideal recognition results in actual production and life. Therefore, Rai et al. [16] achieved a high recognition accuracy of 97.98% on a cotton disease dataset with complex backgrounds by improving deep convolutional neural networks and studying different segmentation ratios and pooling layers.
Pankaj et al. [17] found that combining IoT technology and CNN can effectively promote the identification of cotton diseases and develop a predictive model to help farmers accurately identify and provide treatment suggestions through mobile devices. Shao et al. [18] found through their research that the bilinear coordinate attention mechanism can help the model better focus on the disease area and reduce the loss of feature information and the interference of redundant information. Based on this idea, they integrated this mechanism into CNN and proposed a deep-learning model to identify cotton diseases in natural environments accurately. Although these studies have made significant progress in cotton disease identification, the high demand for computing resources in the models has limited their popularity in practical production. To address the above challenges, Gao et al. [19] integrated Transformer technology and knowledge graph to design a cotton disease detection model with fast response speed and high recognition accuracy, meeting practical applications’ needs.
The above research provides a brief overview of the development of artificial intelligence technology in cotton disease identification in recent years. Research and development on other crops can also help us better develop intelligent cotton disease recognition technology.
Xu et al. [20] conducted an in-depth analysis of the limitations of existing grading methods in identifying crop diseases and proposed a new two-stage approach. This method performs disease recognition tasks by classifying potato leaves in the initial stage and accurately segmenting the leaves, disease sites, and background in the obtained images. It achieved a high accuracy recognition rate of 97.86% on publicly available potato datasets. The self-attention mechanism is the core of the Transformer architecture. Guo et al. [21] proposed a Convolutional Swin Transformer (CST) method based on the Swin Transformer, which effectively solves the problem of low accuracy in crop disease recognition in noisy environments. Zeng et al. [22] utilized a self-attention mechanism to focus on the characteristics of essential regions in images and developed a convolutional neural network that integrates a self-attention mechanism. The network achieved high accuracy recognition rates of 95.3% and 98% on the AES-CD9214 and MK-D2 datasets. Lee et al. [23] found that CNN can extract features from diseased areas and effectively utilize image backgrounds and healthy areas for classification operations. Based on this idea, they proposed a model based on a recursive neural network (RNN). Based on the analysis of experimental results, this model is more robust and has better generalization ability than traditional CNN methods. Wang et al. [24] significantly improved the accuracy of crop disease recognition, especially in fine-grained classification, by integrating the Convolutional Block Attention Module (CBAM) module into convolutional neural networks.
Although existing research has made some progress in stable environments, these results differ significantly from the complex and changing environmental conditions in actual agricultural production [25]. In practical production applications, the diversity of cotton diseases and their interaction with environmental factors pose higher requirements for disease identification [26]. Specifically, the yellow or yellow-brown spots of cotton leaf blight disease are easily confused with soil color in natural environments, and this similarity does not occur in stable environment experiments, which poses a challenge to the recognition ability of the model. Although there have been some studies on identifying cotton diseases under complex background conditions in recent years, there are still various problems. Firstly, the accuracy of recognition obtained from most studies cannot meet the high requirements of daily production and life. Secondly, although Rai et al. effectively identified cotton diseases in complex backgrounds, they used a large dataset with significant model parameters. This makes the model have high-performance requirements for device deployment and cannot be widely used among ordinary farmers. Therefore, developing a lightweight cotton disease recognition model that can maintain high recognition accuracy in complex backgrounds is particularly urgent.
To address the above challenges, this study proposes an innovative solution, the CANnet model, to improve the accuracy and efficiency of cotton disease identification in complex backgrounds. The CANent model is based on the ResNet [27] architecture and integrates the Reception Field Space Channel (RFSC) module, Precise Coordinate Attention (PCA) module, and Kolmogorov Arnold Networks-s (KANs) mechanism. The RFSC module effectively solves the parameter-sharing problem in traditional convolution by integrating dynamic receptive field features with conventional convolution features. It introduces a channel attention mechanism to combine spatial and channel attention effectively. The PCA module further utilizes the Spatial Redundancy Unit (SRU) and Channel Redundancy Unit (CRU) to optimize the spatial channel attention in the RFSC module, effectively reducing redundancy in feature representation. In this study, we first applied the Kolmogorov Arnold Networks (KAN) [28] concept to the field of crop disease identification and made lightweight improvements, forming the KANs mechanism. The KANs mechanism utilizes learnable activation functions instead of fixed activation functions, significantly eliminating the dependence on linear weight matrices and improving the model’s recognition and classification capabilities in complex backgrounds. The CANnet model demonstrates significant advantages in identifying cotton diseases in complex backgrounds while maintaining lightweight. The main contributions of this study are as follows:
- This study innovatively proposed a network model called CANnet, which achieved high recognition accuracy on two cotton disease datasets (mainly composed of diseases with few pests).
- We have designed an innovative PCA module that optimizes the performance of spatial channel attention through spatial channel redundancy reduction technology.
- For the first time, the KAN concept was applied to crop disease identification and lightweight improvements were made based on this concept, resulting in KANs. KANs can help the classifier part of the network model better adapt to complex background images and achieve better classification results.
- We independently collected and created a cotton dataset in Xinjiang, which includes 792 images and covers various diseases.
2. Materials and Methods
2.1. Datasets
To comprehensively evaluate the model’s performance, we used two datasets for testing: our self-made cotton disease dataset and a widely recognized publicly available cotton disease dataset. Table 1 provides a detailed distribution of two datasets.

Table 1.
Datasets image information and statistics.
2.1.1. Self-Built Cotton Disease Dataset
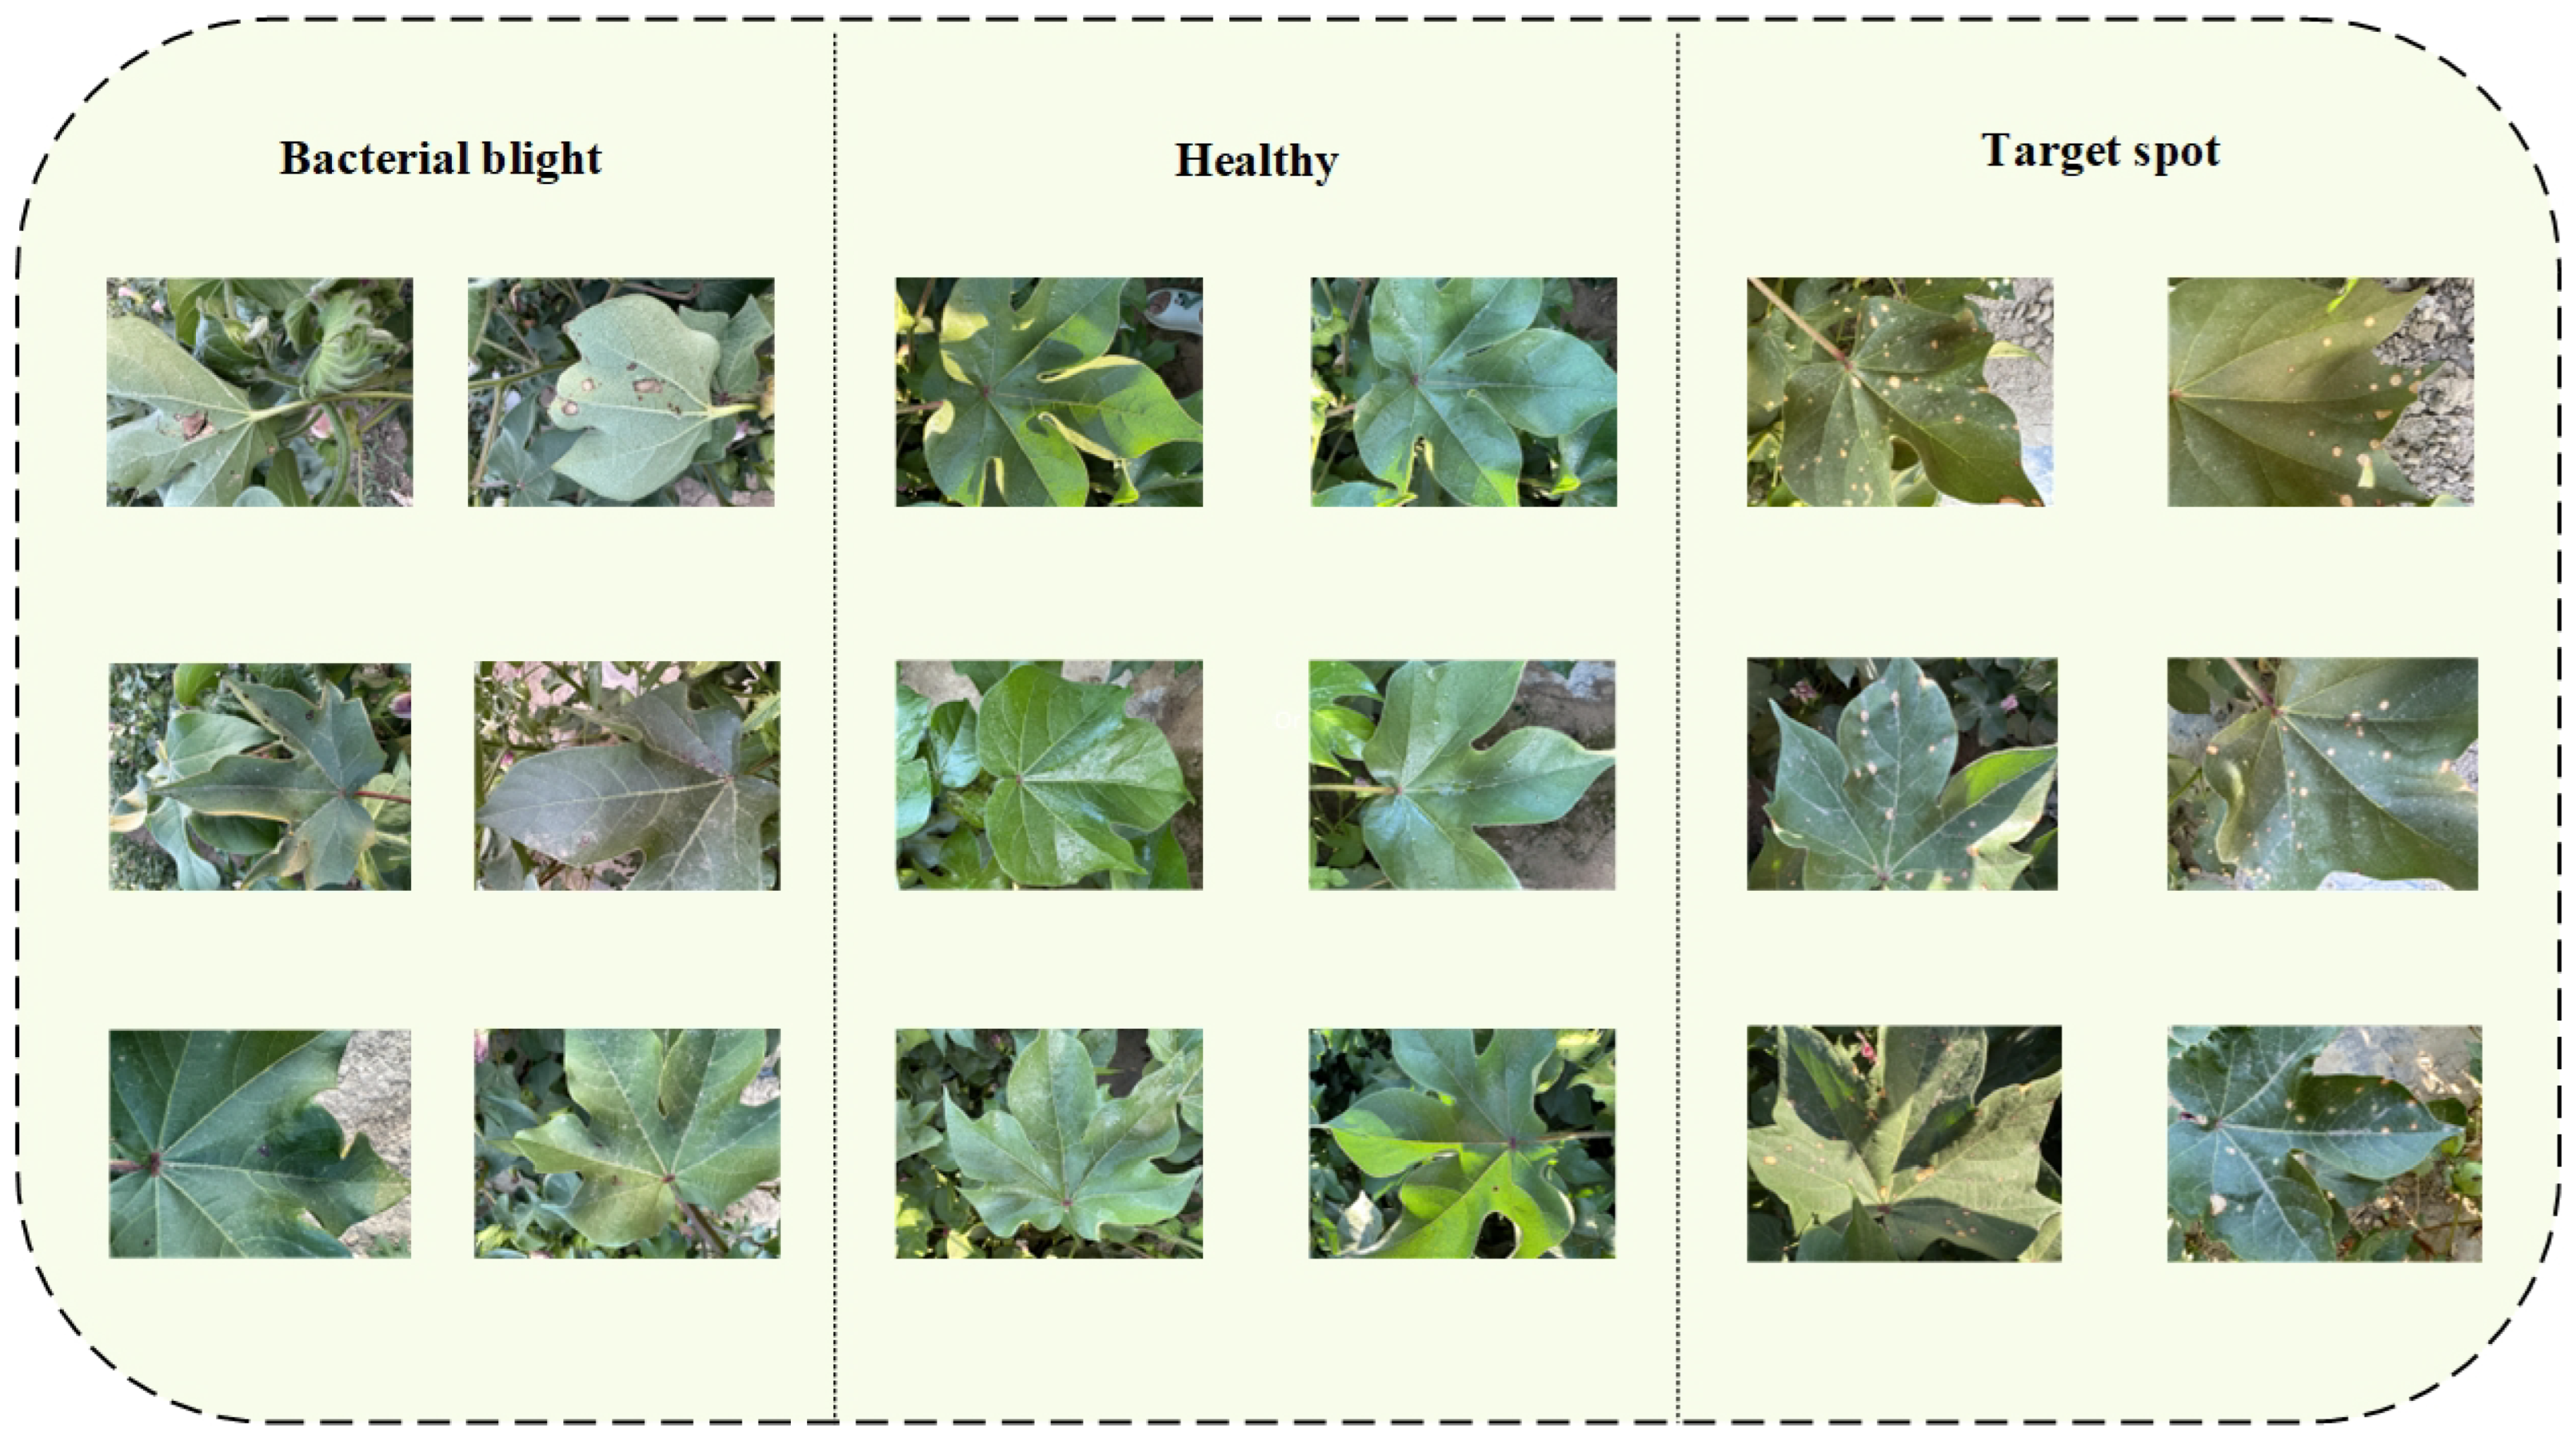
To address the limited availability of existing cotton disease datasets, our laboratory team conducted a comprehensive cotton disease image acquisition project at Huaxing Farm in Changji Hui Autonomous Prefecture, Xinjiang. Through this effort, we have successfully constructed an image dataset containing bacterial blight, target spot, and healthy leaves, including 792 high-resolution images of cotton leaves. As shown in Figure 1.
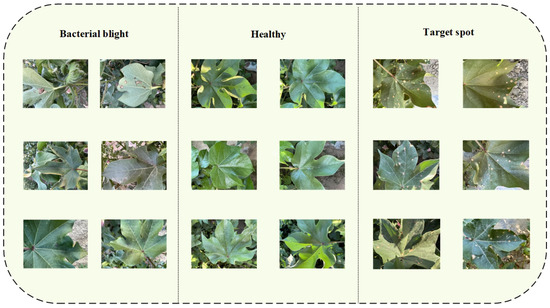
Figure 1.
Image display of self-built cotton disease dataset.
The images in this dataset are mainly composed of cotton leaves affected by diseases and the complex background of their natural growth, with a resolution of 4032 × 3024 pixels per image. To ensure that the dataset meets the requirements of model training, validation, and testing, we strictly divided the image data in a ratio of 7:2:1. Specifically, the partitioned dataset includes 553 training images, 157 validation images, and 82 test images. We believe that establishing this dataset provides a valuable resource for cotton disease identification and lays a solid foundation for future research and applications.
2.1.2. Public Cotton Disease Dataset
In addition to conducting experiments using our own constructed dataset, we also conducted further model performance evaluations using widely recognized public datasets [29]. This public dataset extensively labeled four cotton disease states and two insect pest states, providing rich samples for our experiments. The following discussion generally classifies two pest states as disease states. The images in the dataset are mainly composed of the natural state of cotton leaves and their background, with slightly different resolutions for each image, but generally maintained at around 700 × 500 pixels. We used a manual partitioning method to finely divide the dataset into 2182 training set images, 623 validation set images, and 313 test set images in a ratio of 7:2:1.
2.2. Image Pre-Processing
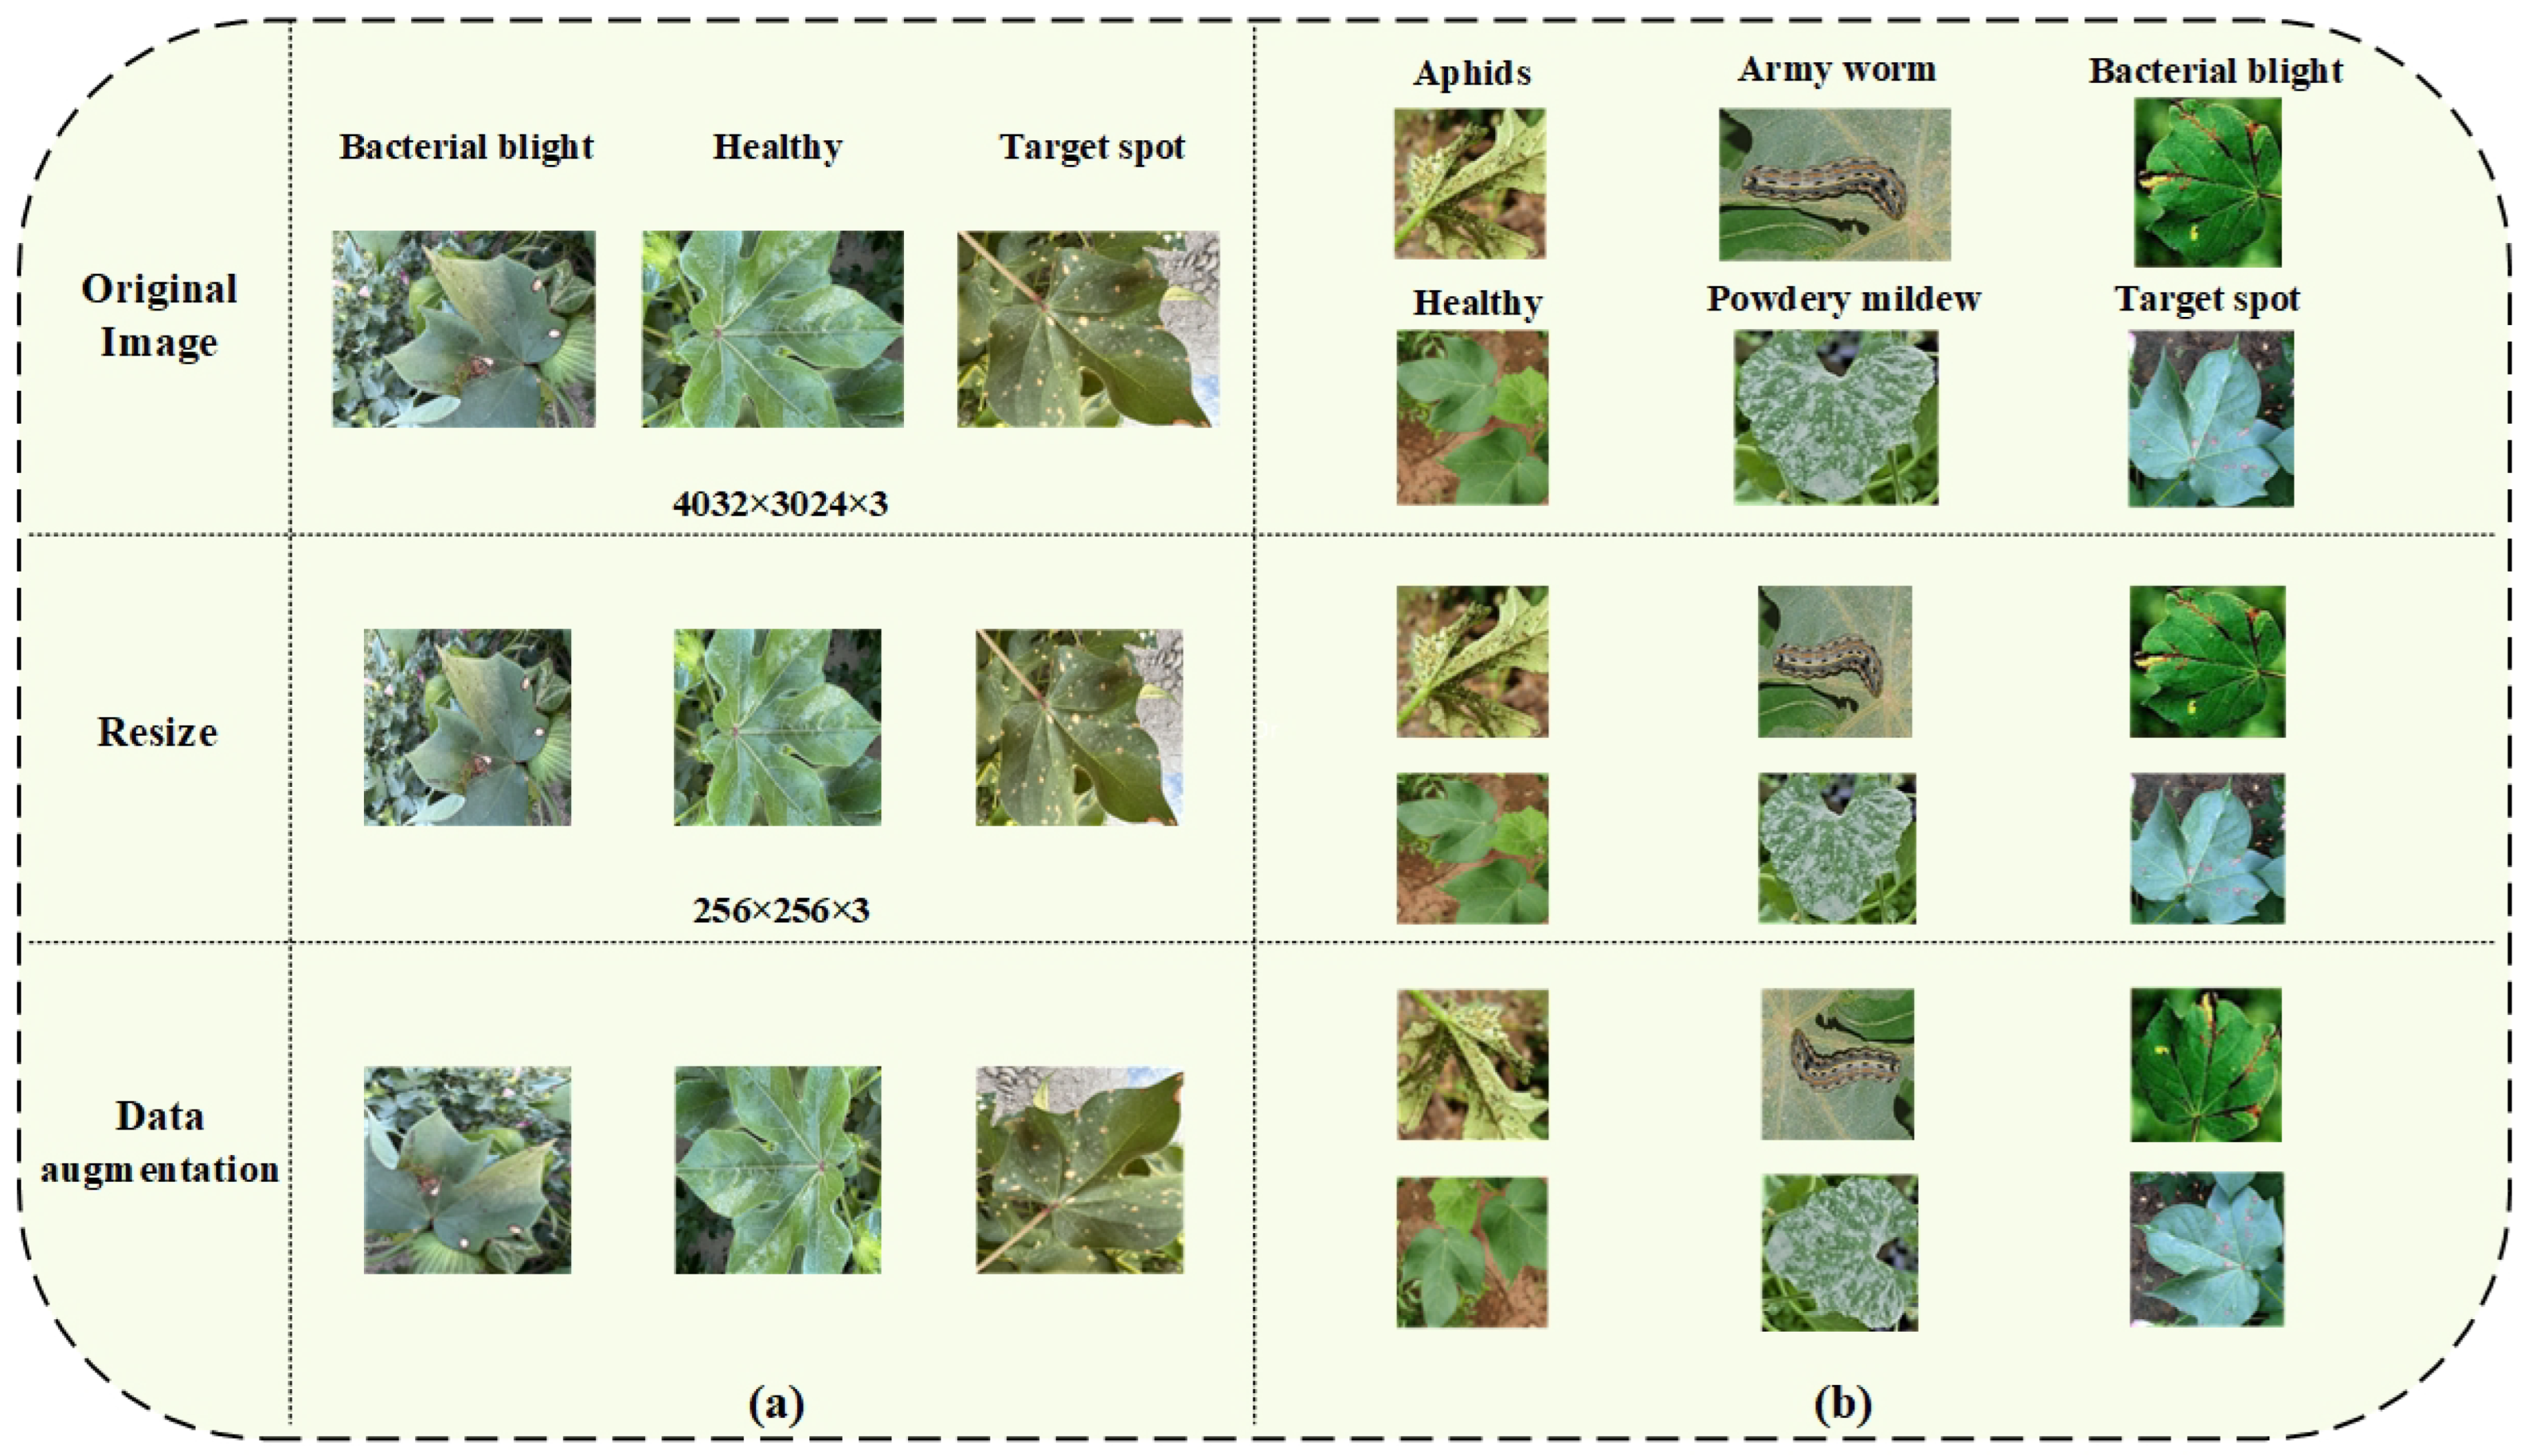
To ensure that the CANnet and related comparison models can receive standardized image inputs, we implemented a series of data preprocessing steps on the dataset images before the experiment. Firstly, we used bilinear interpolation [30] to resize the image and standardized the resolution of the input image to 256 × 256. Considering that the two datasets we are using may face the problem of insufficient sample size, which may lead to overfitting or underfitting during model training, we have adopted a data augmentation strategy to expand sample diversity. After adjusting the image size, we implemented two data augmentation techniques, random flipping and random translation, to increase the number and diversity of image samples. Both methods are applied with a probability of 0.5, ensuring the randomness and effectiveness of the data augmentation process. Figure 2 provides a detailed display of image examples from two cotton disease datasets after data preprocessing.
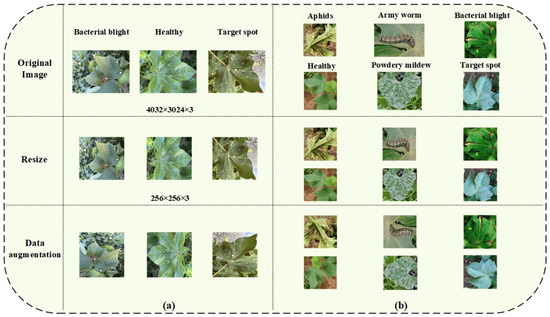
Figure 2.
Data preprocessing image display: (a) Self-built cotton disease dataset. (b) Public Cotton Disease Dataset.
2.3. Method
In this study, we propose an innovative deep learning network—CANnet—to achieve high-precision recognition of cotton leaf diseases. CANnet has been optimized and improved based on the ResNet architecture, enhancing recognition efficiency and accuracy. The network consists of three key modules: the RFSC module, the PCA module, and the classifier.
Firstly, we utilize the RFSC module for feature extraction in spatial and channel dimensions. With an improved design, this module introduces an attention mechanism to assign specific weights to each receptive field without adding additional computational burden or parameter quantity. This solves the parameter-sharing problem of traditional convolutional networks and effectively integrates spatial and channel attention. Then, the PCA module supplements the RFSC module by embedding spatial position information into channel attention. This module simultaneously removes redundant spatial and channel features and outputs more efficient spatial channel features. After four iterations, we obtained a feature representation that deeply integrates spatial and channel information. These deep features are then fed into a classifier, which uses KAN layers for classification. As an emerging network structure, KAN (Kolmogorov Arnold Network) has recently attracted widespread attention in the academic community. In this study, we first applied it to crop disease recognition, replacing the traditional MLP (Multi-Layer Perceptron) structure.
The network architecture of CANnet is shown in Figure 3, which clearly illustrates the various components of the network and their interconnections.
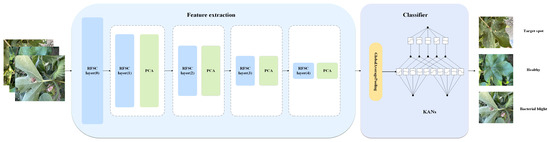
Figure 3.
CANnet network architecture diagram. The feature extraction part mainly comprises the RFSC and PCA modules, and the KANs in the classifier part are the main innovations.
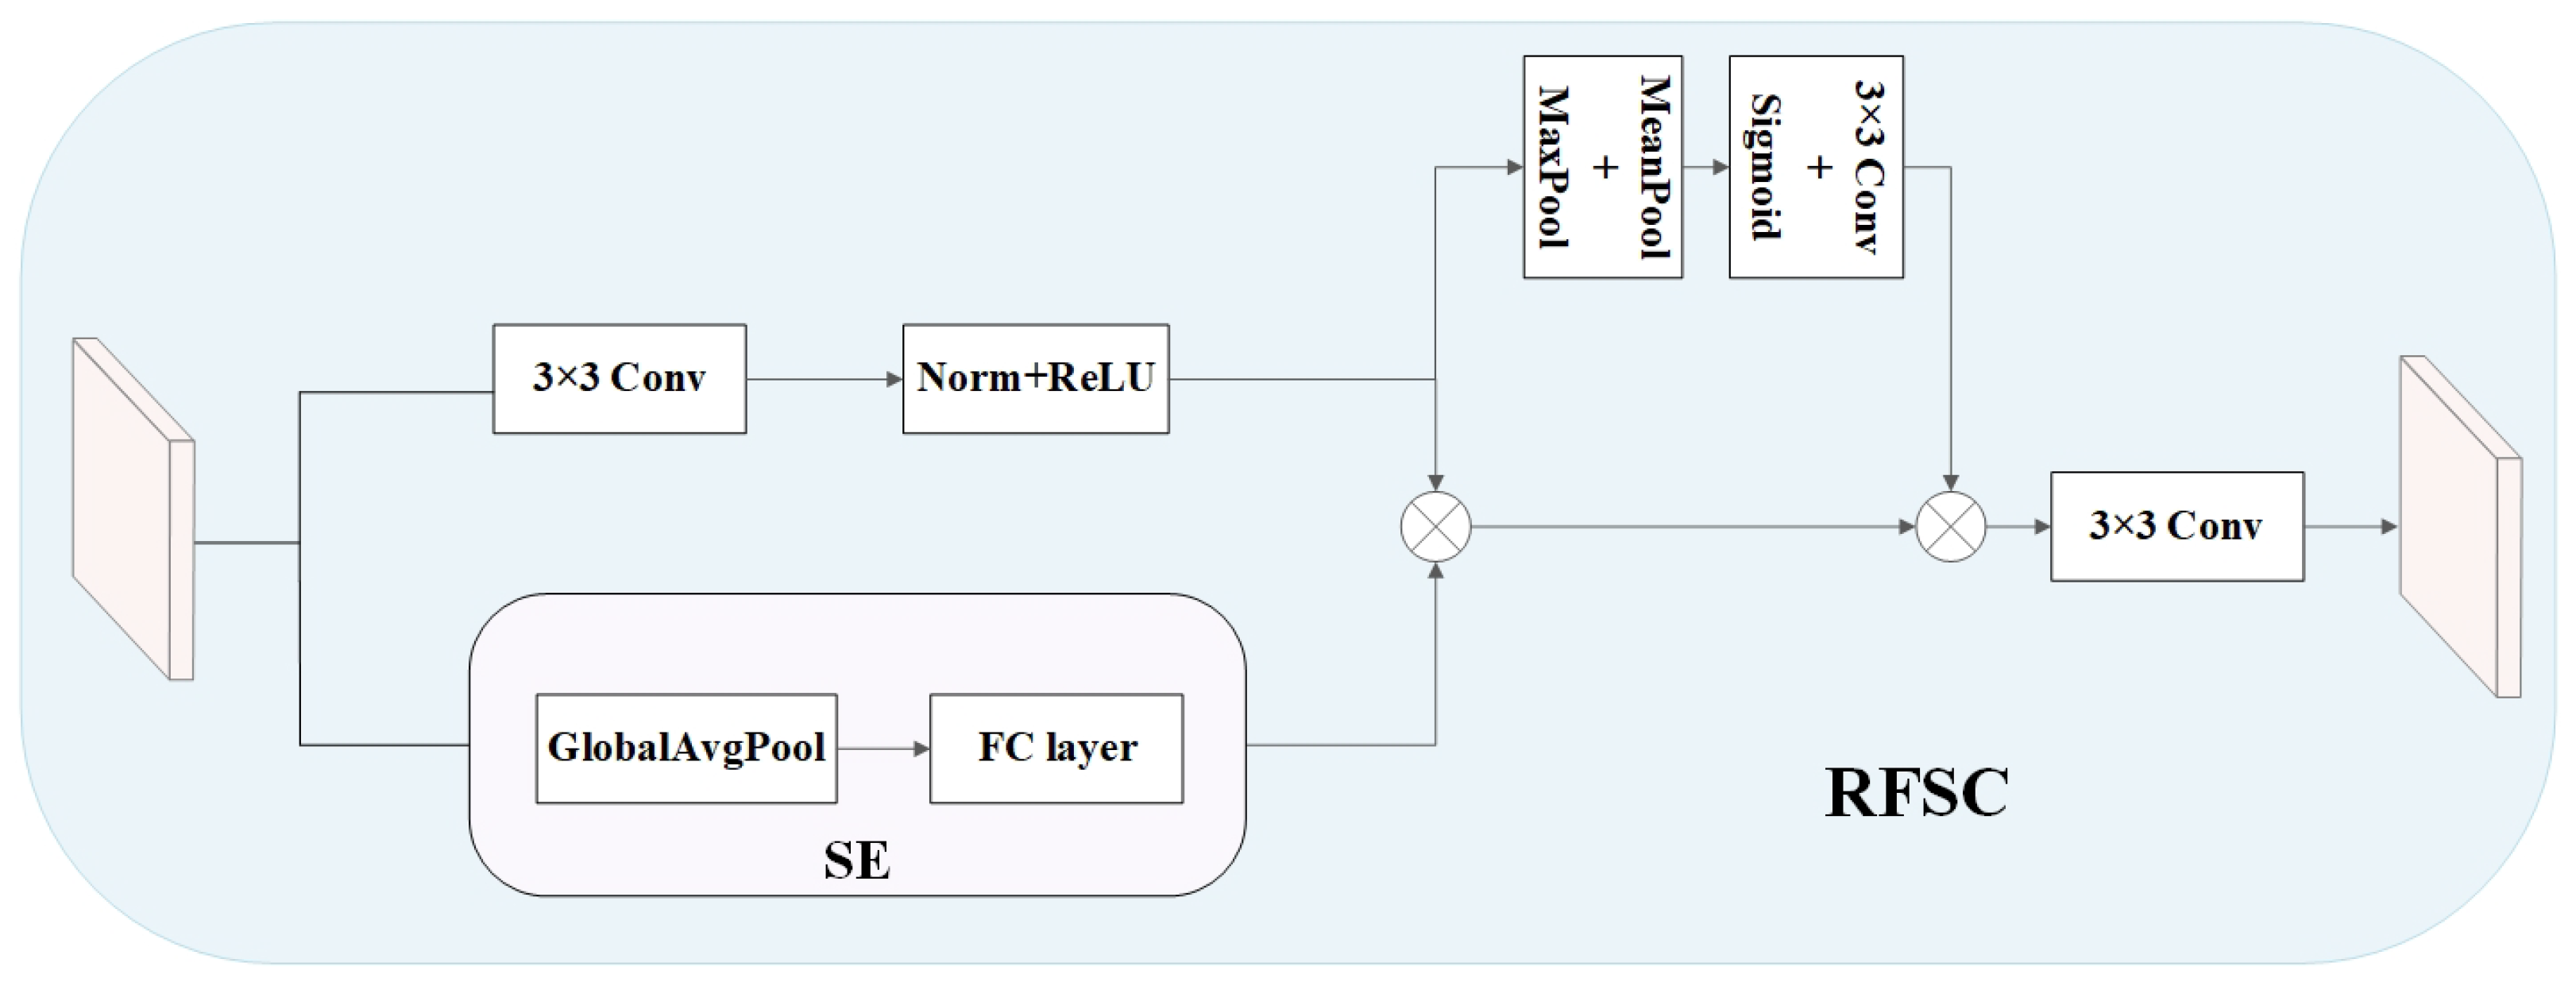
2.3.1. Reception Field Space Channel Module (RFSC)
We have delved into the limitations faced by traditional CNN in feature extraction, particularly in terms of parameter-sharing mechanisms and insufficient utilization of spatial channel features. To address these issues, RFAconv [31] inspired us, and we innovatively designed a new convolution module—the RFSC module. This module combines dynamic receptive field features with traditional convolution to achieve feature extraction, effectively solving the problem of parameter sharing. In addition, we have introduced a channel attention mechanism in the RFSC module, which effectively combines spatial channel attention. This innovative fusion strategy enhances the network’s sensitivity to local features and significantly improves its ability to capture global context.
Let the input feature be represented as x, and represents a 3 × 3 convolution operation. The calculation of receptive field feature is as follows:
Among them, ReLU represents the modified linear activation function, and Norm represents the normalization operation.
Meanwhile, we applied channel attention mechanism to input x and obtained channel attention :
Here, is an average pooling operation, FC represents the fully connected layer, and Sigmoid represents the Sigmoid activation function.
We multiply the receptive field features and channel attention calculated above to obtain a weighted feature map :
Next, we perform average pooling and maximum pooling operations on the receptive field feature and then multiply the two obtained features. Through a 3 × 3 convolution and Sigmoid operation, we obtain the receptive field attention :
Finally, the receptive field feature fused with channel attention is multiplied by the receptive field attention , and a convolution operation is performed to output the final feature map :
The detailed structure of the RFSC module is shown in Figure 4. Through this carefully designed module, we expect to improve the shortcomings of traditional convolutional neural networks and significantly enhance their feature extraction capabilities in complex visual tasks.
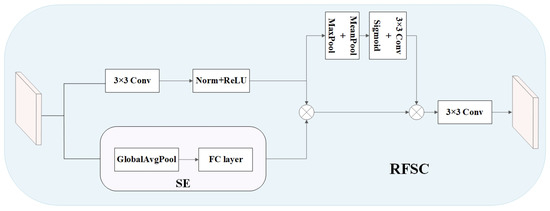
Figure 4.
RFSC module diagram.
2.3.2. Precise Coordinate Attention Module (PCA)
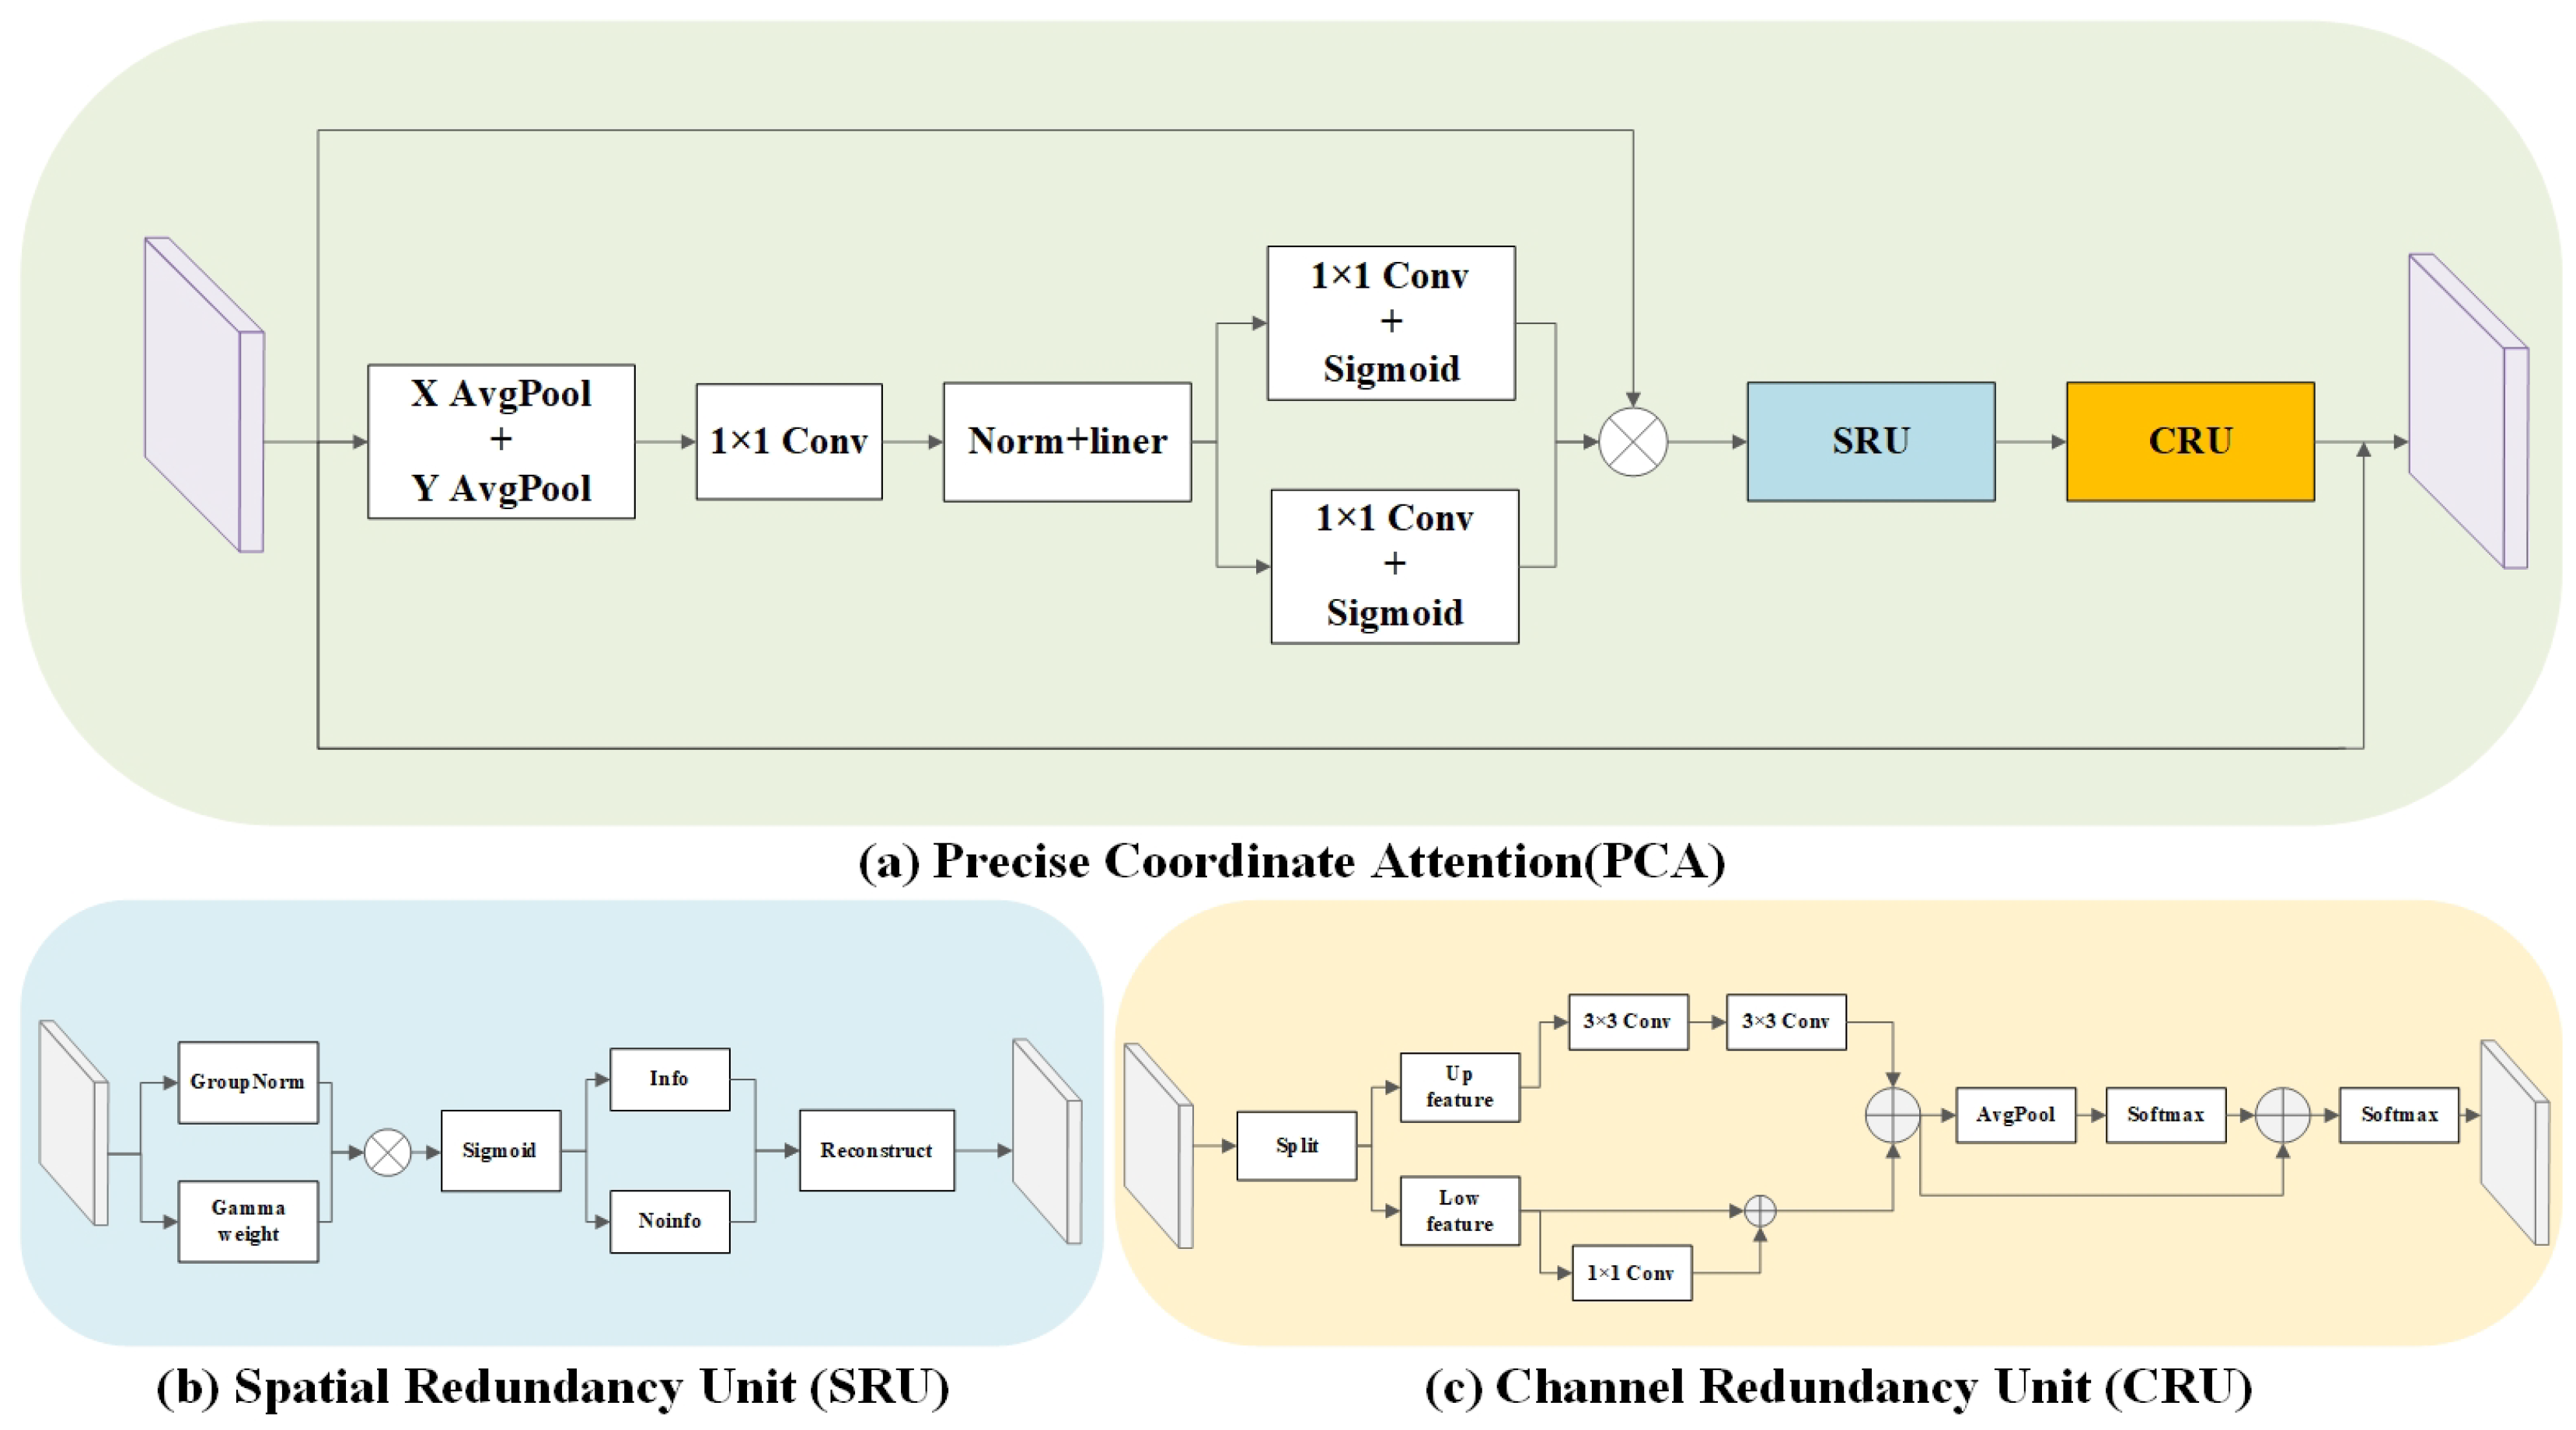
In the previous section, we used the RFSC module instead of the standard convolution operation to optimize the parameter-sharing mechanism and enhance the utilization efficiency of spatial channel attention. However, we found that the module has a significant spatial channel attention redundancy issue. To address this issue, we propose a PCA module to improve spatial attention utilization further and effectively reduce redundancy. The core design of the PCA module integrates position information and channel attention. Then, it uses a sophisticated network structure design to reduce spatial and channel attention redundantly using SRU and CRU modules. As shown in Figure 5a.
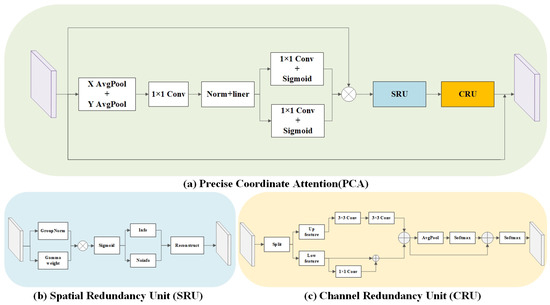
Figure 5.
(a) The overall architecture of the PCA module. (b) The specific architecture of the SRU module. (c) The specific architecture of the CRU module.
Specifically, we first perform average pooling operations on input feature i in width and height directions to capture global information on each channel. Subsequently, the information from these two directions is concatenated in the channel dimension to obtain the feature representation :
Next, we calculate the positional attention by applying standard convolution, normalization, and activation functions:
Furthermore, we divide the positional attention into height and width feature maps corresponding to the original input in the width direction and calculate the positional attention weights and through convolution and activation functions.
By multiplying the obtained two attention weights and with the input feature i, residual connection and attention weighting are achieved, and the channel attention feature containing rich spatial position information is output:
Finally, we use SRU and CRU to perform redundant deletion on the spatial and channel levels of the attention feature obtained above, and obtain the final output :
Figure 5b shows that the SRU module first normalizes the input features by grouping them. This operation aims to filter out features with higher information content from the overall features. Then, the features are distinguished through the set gate threshold to obtain adequate spatial information (Info) and redundant spatial information (Noinfo). The gate threshold here is set to 0.5. Finally, we integrate adequate and redundant spatial information through reconstruction operations to obtain spatial attention features with reduced redundancy.
Furthermore, as shown in Figure 5c, the CRU module follows closely behind the SRU module, and its function is to reduce the redundancy of channel attention. The input features are initially divided into practical channel information (Up feature) and redundant channel information (Low feature). The CRU module applies convolution operations to redundant channel information to extract valuable information further. Subsequently, we will re-fuse the adequate channel information with the processed redundant channel information. Finally, the fused features are processed through a series of operations, such as pooling and activation functions, to output efficient channel attention features that have undergone redundant deletion.
The output is an enhanced feature representation that exhibits higher efficiency and effectiveness in spatial and channel attention, providing more accurate feature support for subsequent deep learning tasks.
2.3.3. KANs
Kolmogorov Arnold Networks (KAN) has recently attracted widespread attention in deep learning research and application fields. Compared with multi-layer perceptrons (MLPs), KAN has two significant differences: (1) KAN applies activation functions to edges rather than nodes, providing more flexible feature transformation capabilities; (2) activation functions are parameterized and can be learned rather than fixed, allowing KAN to adjust their nonlinear characteristics adaptively. These innovative designs give KAN superior performance in handling complex data compared to traditional MLP.
Inspired by the KAN design concept, we have made a series of improvements to KAN, forming KANs (Improved KAN):
- In the original KAN, when executing different activation functions, all intermediate variables must be extended, which increases memory consumption. By redesigning and introducing activation inputs based on different basic functions and adopting a linear combination approach, we have significantly reduced memory costs and improved computational efficiency.
- We have modified the L1 regularization in the original KAN to the L1 regularization of weights. This modification aligns with standard regularization techniques in neural networks and matches our redesigned activation function calculation method, enhancing the model’s generalization ability.
- To better adapt KANs to the characteristics of agricultural datasets, we adopted Kaiming initialization as the parameter initialization method. This initialization method helps to provide good gradient flow in the early stages of training, thereby accelerating convergence speed and improving model performance.
After the above improvements, KANs have demonstrated higher accuracy and robustness in crop disease recognition tasks, meeting the demand for efficient and accurate recognition systems. These adjustments optimized the original structure of KAN and made it more suitable for specific application scenarios, further promoting the development of deep learning technology in the agricultural field.
3. Results and Discussion
3.1. Experimental Environment
The model’s construction, training, and testing are carried out on servers using the Linux operating system. The server is equipped with NVIDIA A40 graphics card, NVIDIA SMI version 460.106.00, driver version 460.10.6.00, CUDA version 11.2, Python version 3.7, Pytorch version 1.13.1, and Torchvision version 0.14.1.
3.2. Experimental Settings
We selected three key performance indicators to comprehensively evaluate the model’s performance: Precision, Top1 Acc, and F1 score for comprehensive comparative analysis. True positive (TP) refers to the number of leaves correctly identified as diseased; True negative (TN) refers to the number of leaves correctly identified as healthy leaves; False positive (FP) refers to the number of leaves incorrectly identified as diseased; False negative (FN) refers to the number of leaves incorrectly identified as healthy.
Top1 Acc, as a direct measure of model prediction accuracy, reflects the proportion of samples consistent with the actual labels predicted by the model and is suitable for various problems, including binary classification and multi-classification. The specific calculation formula for Top1 Acc is as follows:
Precision measures the proportion of samples predicted by the model as positive categories that are positive categories. In datasets with uneven distribution of positive and negative categories, this indicator can reflect the model’s ability to recognize minority categories. The mathematical expression for Precision is defined as:
In classification problems, the F1 score, as the harmonic mean of Precision and Recall, plays a significant role in handling imbalanced datasets or simultaneously considering both precision and recall. The following is the specific expression for the F1 score:
Through detailed analysis of these indicators, this study aims to deeply understand the model’s performance in cotton disease leaf recognition tasks and provide a scientific basis for further model optimization and application. The hyperparameters used in the experiments in this study are shown in Table 2.
Table 2.
Model training hyperparameters.
3.3. Model Comparison Experiment
We validate the effectiveness of our proposed method on cotton datasets with complex backgrounds by comparing CANnet with other advanced models. AlexNet [32], SqueezeNet [33], MobileNetV2 [34], and MobileNetV3 [35] based on convolutional neural networks. Pooling-based vision Transformer (PiT) [36], CF-ViT [37], Transformer in Transformer (TNT) [38], LeVit [39], CoAtNet [40], Vision Transformer(ViT) [41], and Swin Transformer [42] based on Transformer. Models such as CvT [43], and Mobile-Former [44] based on CNN + Transformer architecture. The experimental results are shown in Table 3 and Table 4.
Table 3.
Comparison experiment results of self-built cotton disease dataset. Black bold font is the best effect; blue font is the second best effect.
Table 4.
Comparison experiment results of public cotton disease dataset. Black bold font is the best effect; blue font is the second best effect.
The CANnet model performs well on two independent datasets, surpassing existing deep convolutional neural networks (CNNs). Specifically, on a self-built dataset with limited training samples, CANnet achieved recognition accuracy of 0.963, 0.971, and 0.961 on the three key evaluation metrics of Top1 Acc, Precision, and F1 score, respectively. Compared with the best-performing comparison model, MobileNetV2, the performance improvement of CANnet is 4.8%, 4.3%, and 4.2%, respectively. This result confirms that CANnet is superior to traditional convolutional neural networks in utilizing spatial self-attention and channel attention and has more robust training and testing capabilities on small datasets. On the public dataset, CANnet’s performance is more outstanding, with three indicators reaching 0.986, 0.988, and 0.986, respectively. Compared with MobileNetV2, it achieved performance improvements of 6.1%, 6%, and 6.4%, respectively. These data indicate that on larger datasets, CANnet’s recognition performance is more significant, with higher accuracy and relatively more remarkable improvement. Compared to traditional convolutional neural networks with poor recognition performance (AlexNet, SqueezeNet, and MobileNet), CANnet showed the highest improvement of 8.6% and 7.5% in recognition performance on two independent datasets, respectively. This significant improvement demonstrates the excellent capabilities of CANnet’s attention mechanism and KANs classification technology in feature extraction and classification recognition. The application of these technologies not only improves recognition accuracy compared to traditional CNNs but also enhances the model’s ability to capture essential information. The experimental results further validated the efficiency and reliability of the CANnet model in meeting daily production and living needs.
Compared with advanced models using Transformer architecture, CANnet’s performance on self-built datasets is particularly remarkable. Compared with the CF-ViT model, it has improved evaluation metrics by 9.8%, 9.8%, and 9.6%, respectively, which is significantly better than the CNN model. On the publicly available cotton disease dataset, the performance improvement of CANnet compared to the LeVit model is 6.3%, 5.7%, and 6.2%, respectively. The experimental results intuitively demonstrate that the spatial channel attention used by CANnet is more suitable for agricultural datasets than the Transformer architecture with a self-attention mechanism. We analyzed the reasons for the insufficient performance of Transformer architecture on two datasets. This may be due to the high demand for parameter quantity in transformer models and the possible phenomenon of attention saturation.
The latest research trend is integrating CNN and Transformer architectures to achieve better performance. By comparing CANnet with the best-performing Mobile-Former in the fusion model, we found that CANnet improved performance by 5.2%, 4.8%, and 4.9% on self-built datasets, and 5.5%, 4.5%, and 5% on public datasets, respectively. Analysis suggests that the performance of fusion model architectures on small-scale agricultural datasets could be better than CANnet, possibly due to their failure to thoroughly learn compelling features from the data, resulting in lower recognition accuracy.
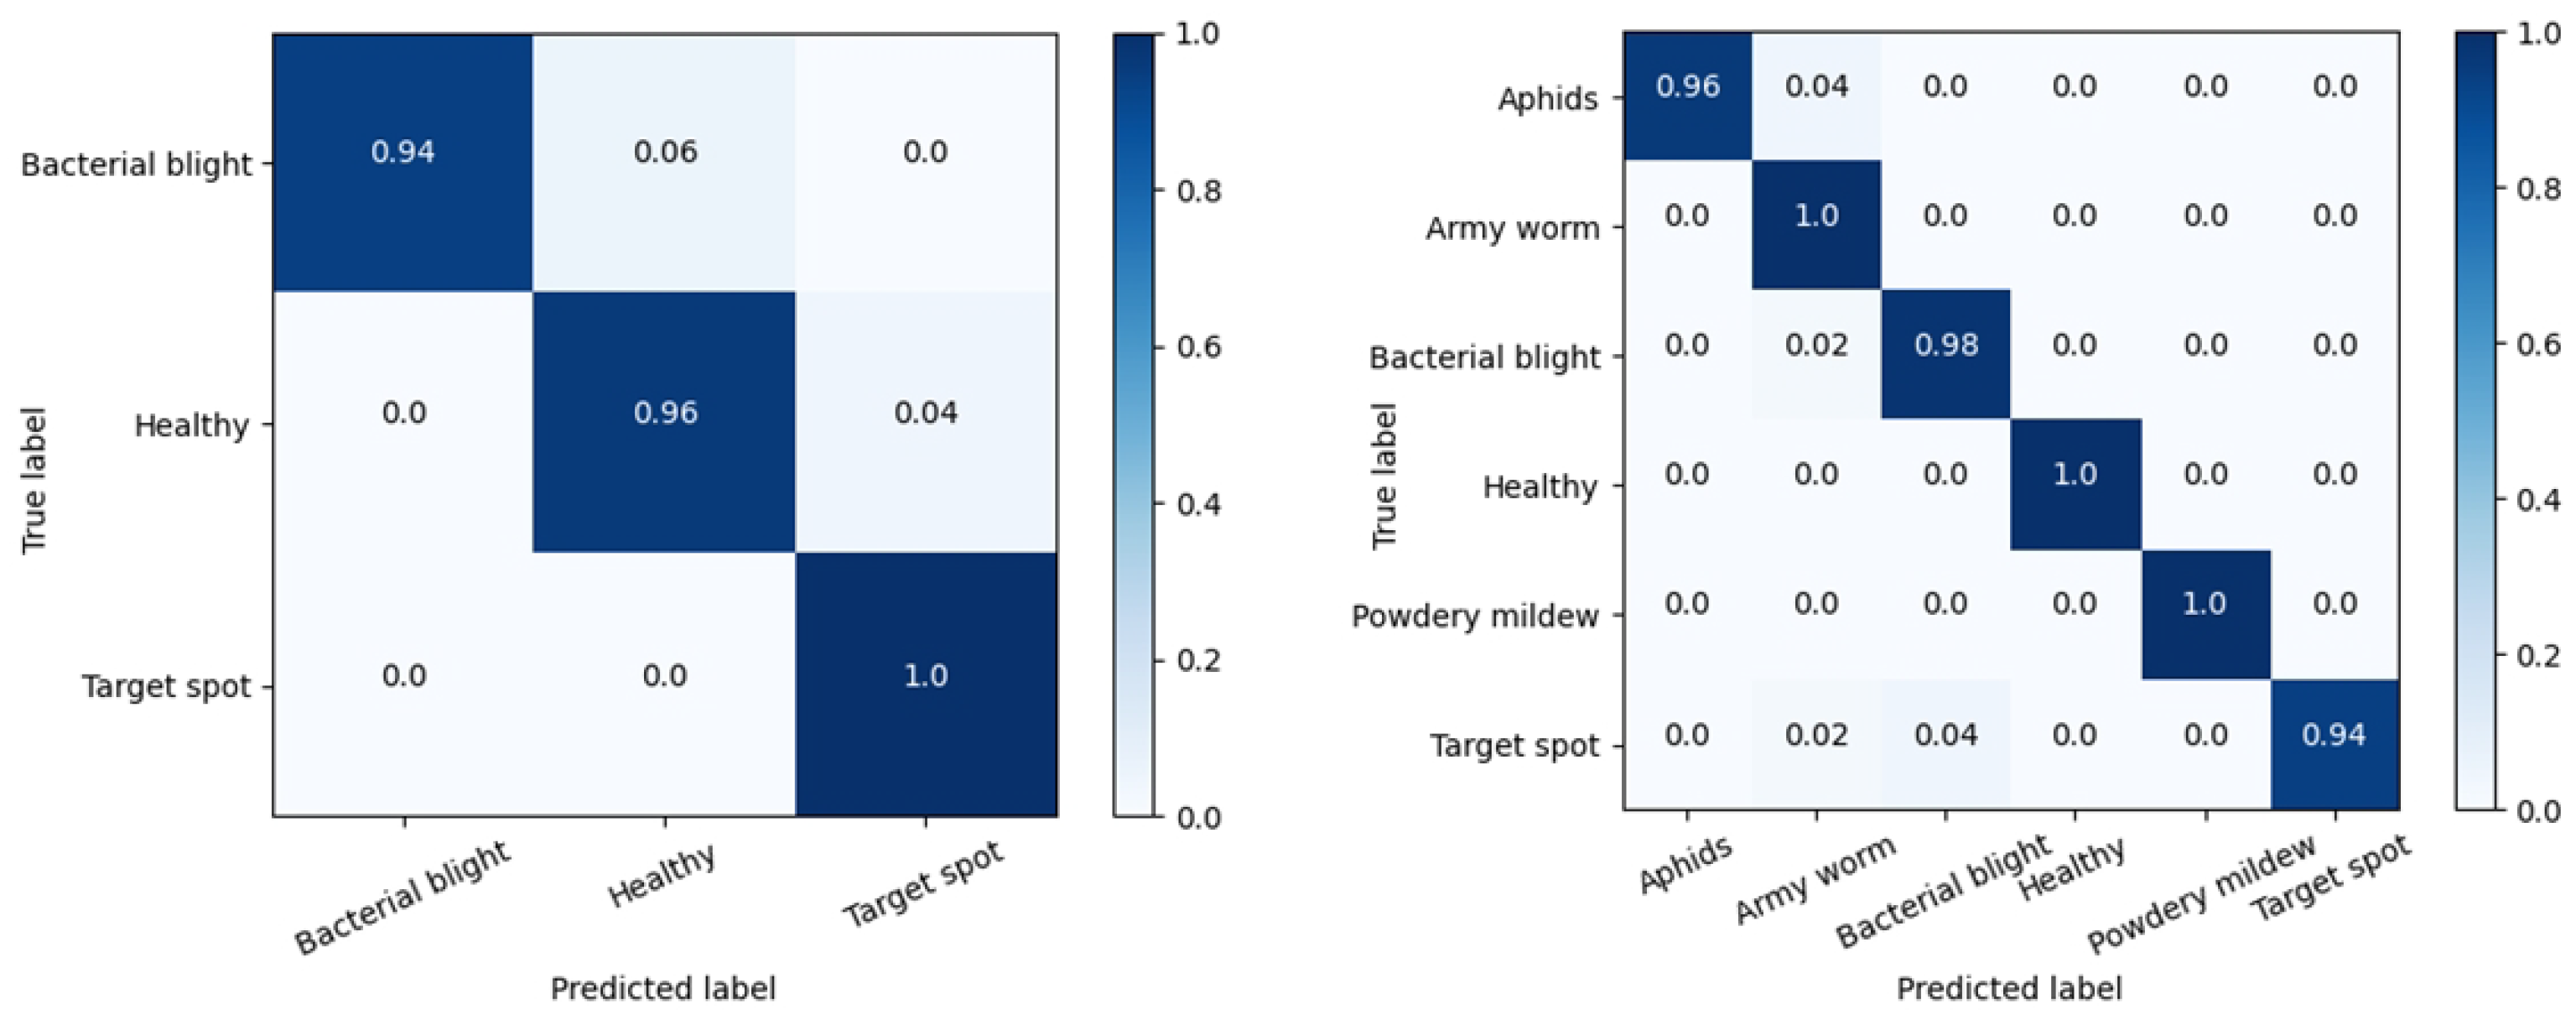
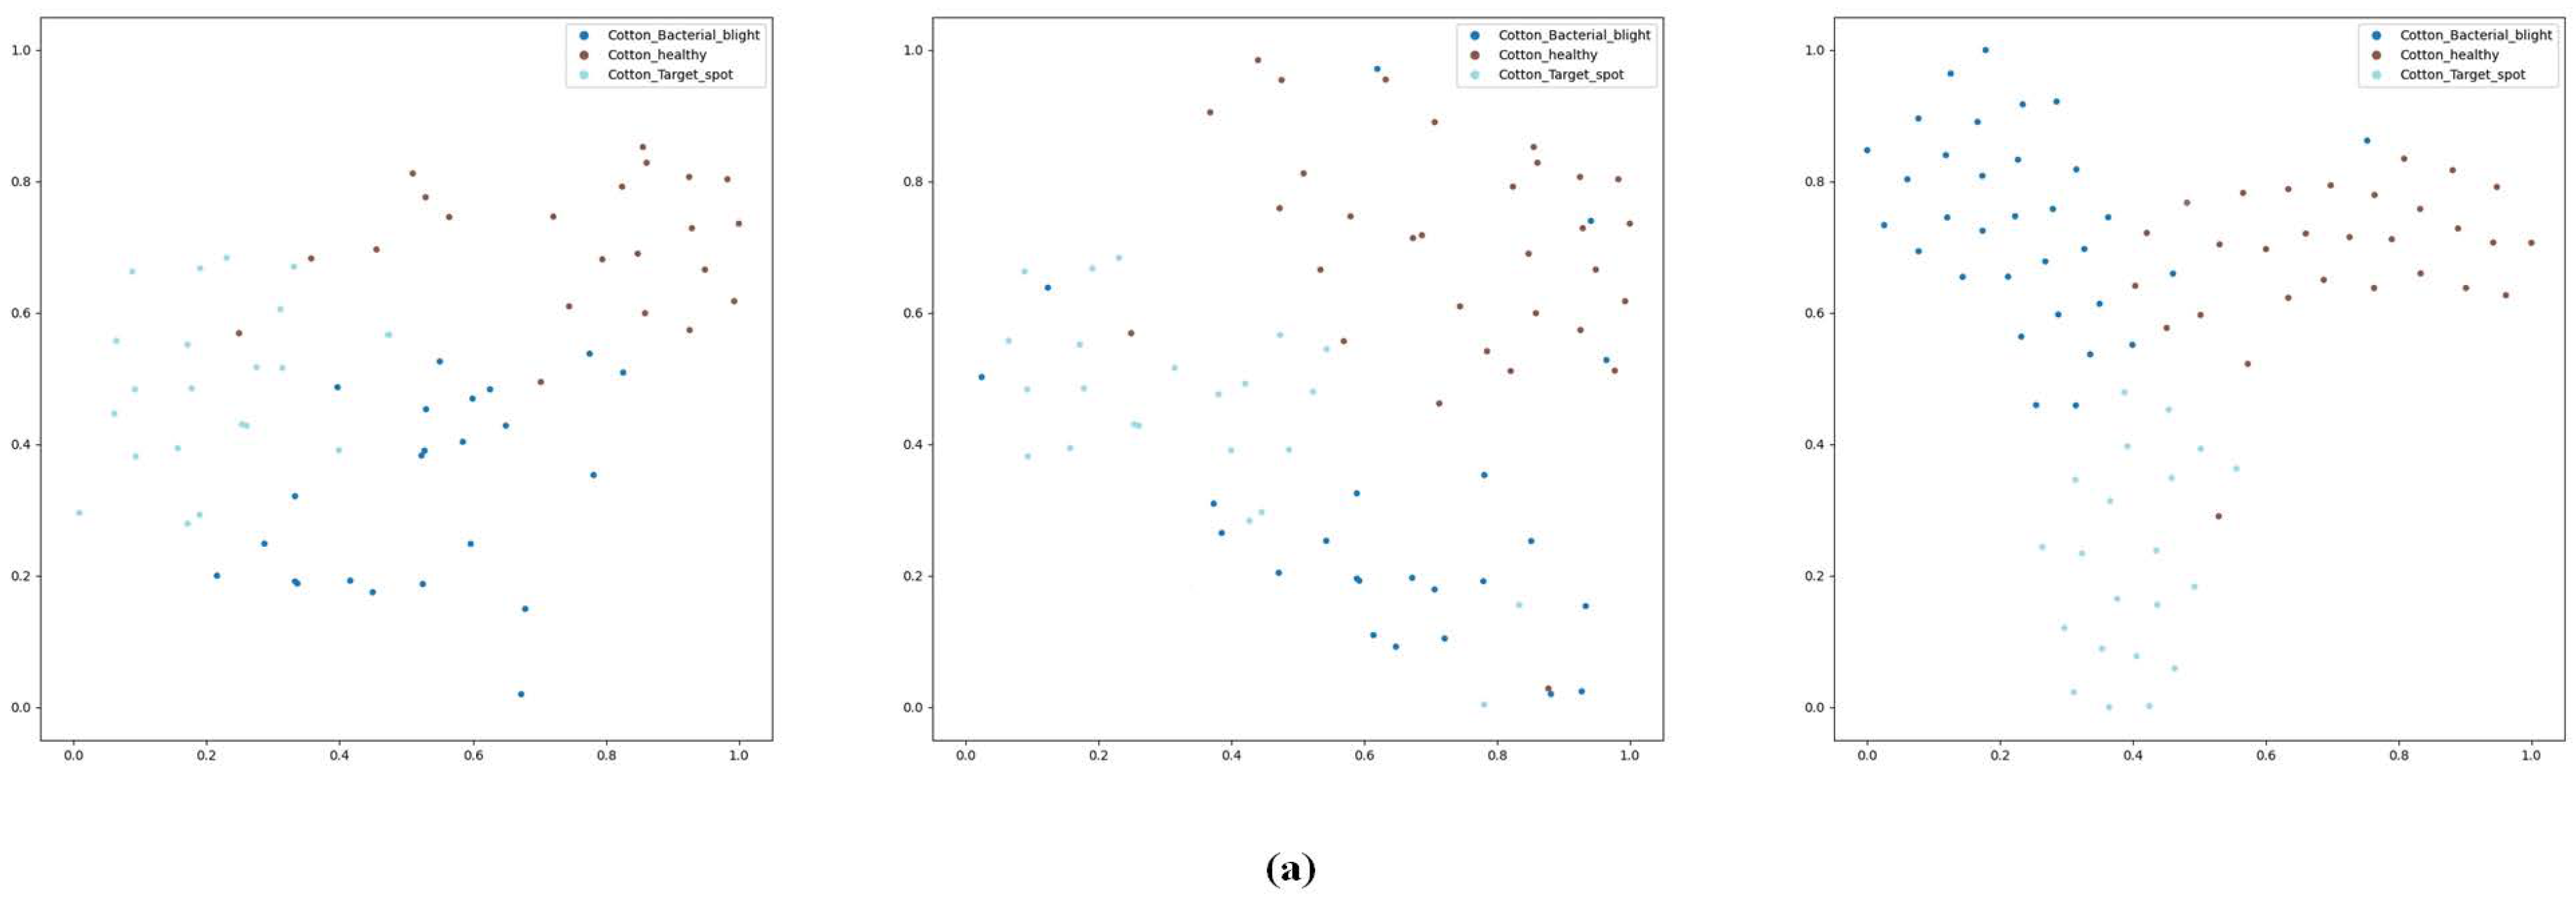
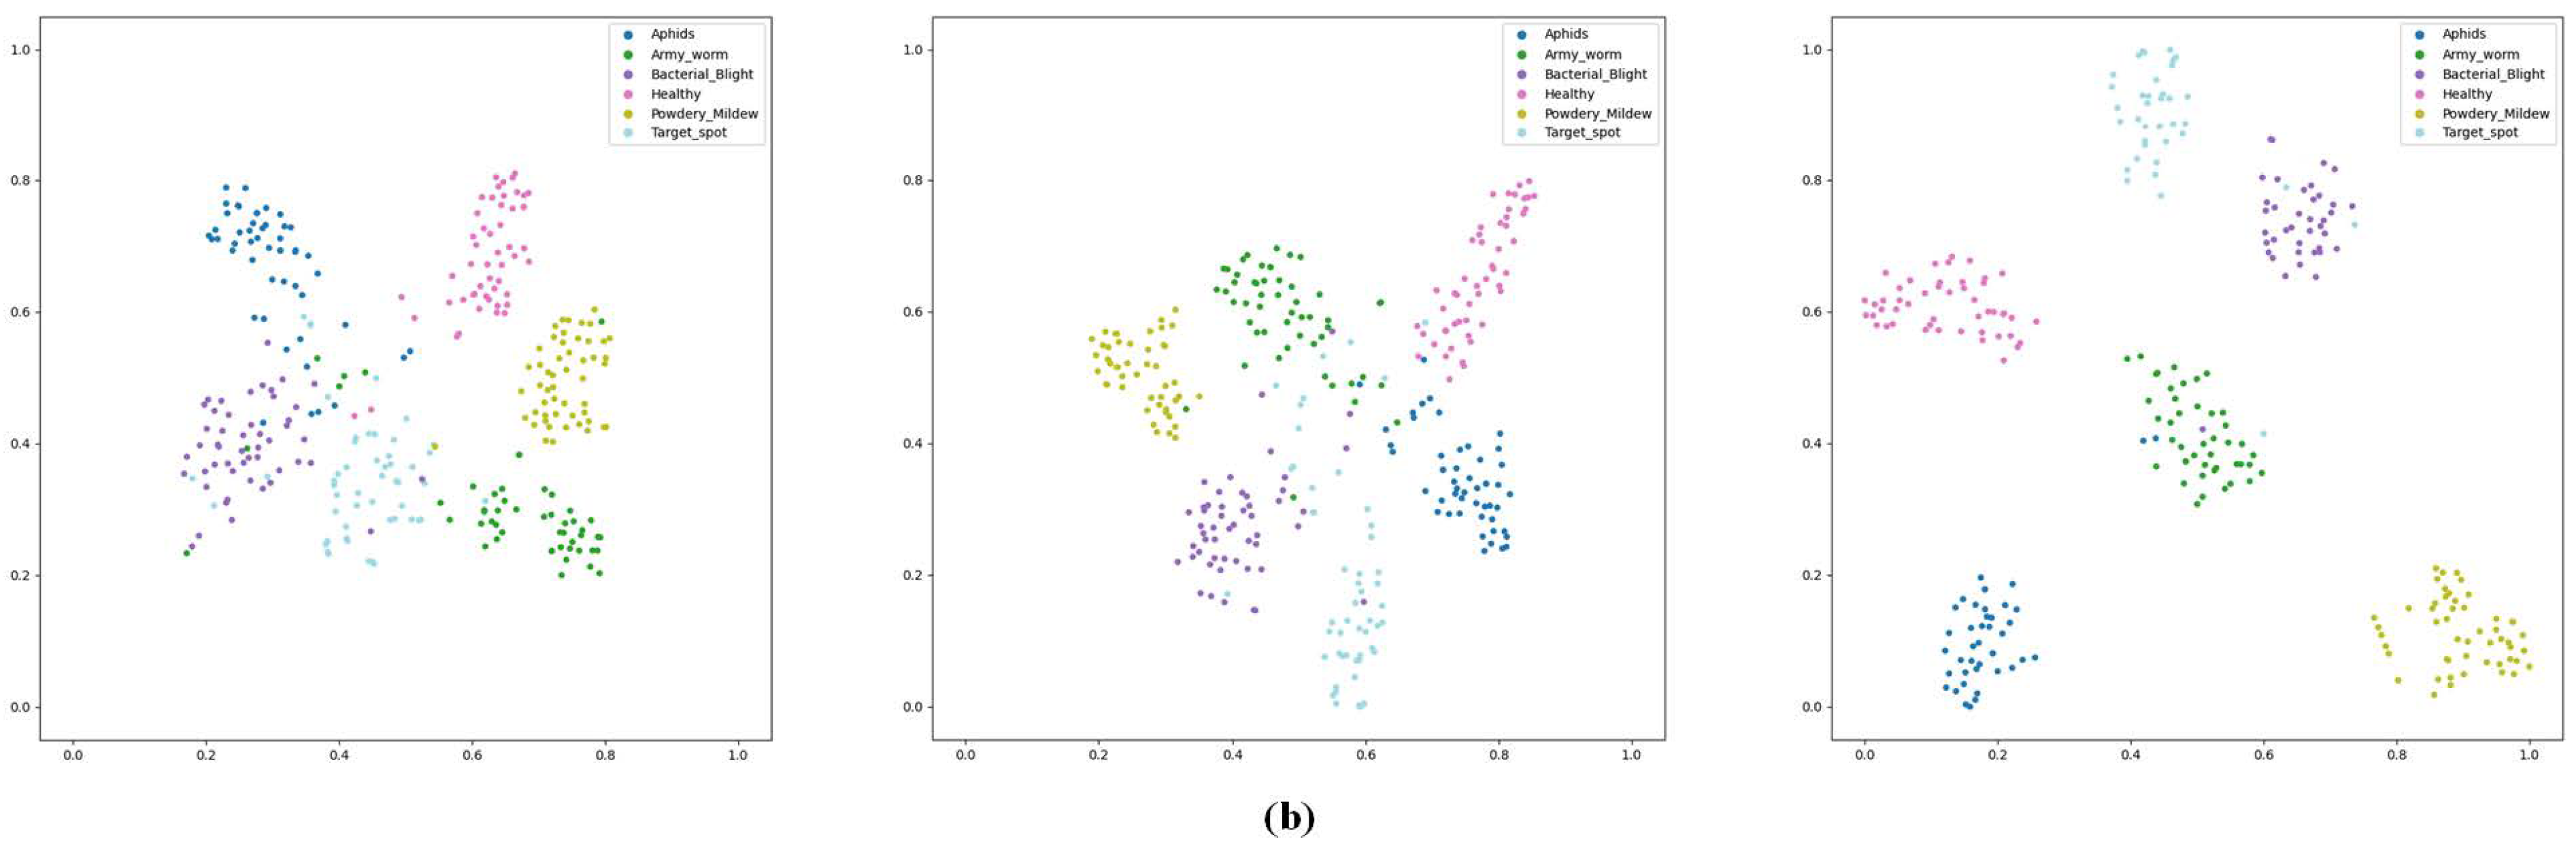
Figure 6 presents the performance of CANnet on two independent datasets in the form of a confusion matrix. Figure 7 shows the clustering comparison between CANnet and the backbone network and the high-dimensional feature space of the current optimal comparison model. Through the comparative analysis of these charts, we can observe the advantages of the CANnet model in maintaining internal compactness and inter-class separation. The design of CANnet integrates advanced feature learning (low redundancy spatial channel attention) and classification techniques (KANs), improving the model’s generalization ability and ensuring stable performance in complex environments. These achievements provide a new perspective on the field of agricultural disease identification.
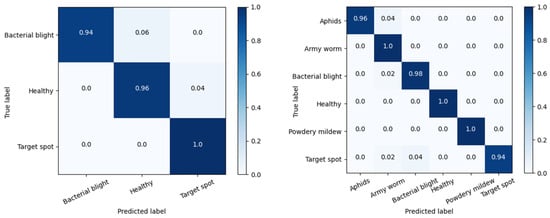
Figure 6.
The confusion matrix diagram of CANnet on two datasets.
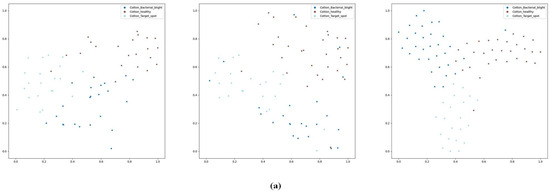
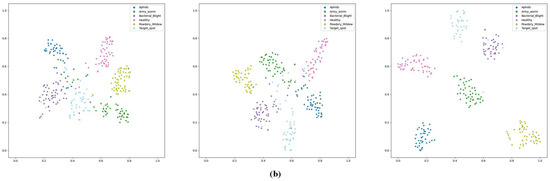
Figure 7.
(a) t-SNE plots of ResNet, MobileNetV2, and CANnet on self-built cotton disease datasets. (b) T-sne plots of ResNet, Mobile-Former, and CANnet on publicly available cotton disease datasets.
3.4. Ablation Experiment
We conducted ablation experiments on two cotton disease datasets using consistent random number seeds and the same experimental configuration. We also conducted ablation experiments on the hidden layer of KANs. In this experiment section, we mainly analyze the experimental results through the Top1 Acc performance indicators. ‘w/o’ indicates the operation of removing a module.
3.4.1. Dataset Ablation Experiment
Table 5 shows the results of the self-built dataset ablation experiment, and Table 6 shows the public dataset ablation experiment results. The specific analysis is as follows:
Table 5.
Self-built dataset ablation experiment.
Table 6.
Public dataset ablation experiment.
Specifically, ‘w/o PCA + KANs’ means that the PCA module and KANs module have been removed from the CANnet architecture, leaving only the RFSC module. Under this configuration, the accuracy on the two datasets reached 0.938 and 0.944, respectively, which were 3.7% and 3.3% higher than the baseline model. This result indicates that the RFSC module effectively improves the model’s disease recognition ability by integrating traditional convolution techniques with dynamic, receptive field kernels and incorporating channel attention mechanisms.
In the experimental setup of ‘w/o RFSC + KANs’, the model only uses the PCA module and does not include the RFSC and KANs modules. At this point, the accuracy on both datasets improved to 0.911 and 0.937, achieving performance gains of 1% and 2.6%, respectively, compared to the baseline model. This result reveals the performance of the PCA module when used independently. In the ‘w/o KANs’ experiment, the KANs module was removed, while the RFSC and PCA modules were retained. In this case, the accuracies on the two datasets were 0.952 and 0.968, respectively, which improved by 5.1% and 5.7% compared to the baseline model and by 1.4% and 2.4% compared to using only the RFSC module. This further confirms the effectiveness of the PCA module in spatial channel redundancy reduction and its essential role in improving the feature extraction of the RFSC module.
The ‘w/o RFSC + PCA’ experiment aims to verify the KANs module’s independent contribution by removing the RFSC module and PCA module. The experimental results showed that the accuracy was improved by 1.5% and 2.2% on self-built and publicly available datasets, respectively. This discovery fully demonstrates that in the field of crop disease recognition, improving and utilizing the learnable activation function concept in KANs in ResNet can effectively assist models in better recognition and classification. The experiments of ‘w/o PCA’ and ‘w/o RFSC’ removed the PCA module and RFSC module, respectively, to evaluate the performance of the KNAs module under different configurations. The results showed that the accuracy reached 0.947/0.962 and 0.949/0.951 on the two datasets, with performance improvements of 4.6%/5.1% and 4.8%/4%, respectively. These results indicate that the KANs module improves recognition accuracy on its own and maintains excellent performance when combined with PCA and RFSC modules.
3.4.2. KANs Ablation Experiment
We applied the KAN concept for the first time in crop disease identification and achieved good results. The hidden layers in KANs have the characteristics of enhancing the expressive power of the model and controlling the complexity of the model. We conducted a series of ablation experiments on the hidden layer to select the most suitable parameter configuration for this study. These experiments allow us to carefully evaluate the specific impact of each configuration on the experimental results by adjusting the hidden layer parameters one by one. The experimental results are shown in Table 7 and Table 8.
Table 7.
The ablation experiment of KANs hidden layer parameters in a self-built dataset. The blue font is the optimal result.
Table 8.
Experiments on the ablation of KAN hidden layer parameters in public datasets. The blue font is the optimal result.
From Table 7, it can be seen that when the hidden layer parameters are set to (512,3) and (512,256,3), the Top1 accuracy reaches 0.958 and 0.957, respectively. Compared with the optimal parameter configuration (512,128,3), the performance only decreases by 0.5% and 0.6% while still maintaining a high recognition accuracy, which is higher than the model without an integrated KANs module. However, when the hidden layer parameters were further expanded to (512,256,128,3), the Top1 accuracy decreased to 0.935, which was 2.8% lower than the optimal performance parameters. This result indicates that the parameter configuration may have a suppressive effect on the model’s performance. Based on the analysis of experimental results from publicly available datasets, we speculate that the reason for the decrease in accuracy caused by excessive hidden layer parameters may be related to the small size of the dataset, which may lead to overfitting of the model.
On the public dataset (Table 8), the Top1 accuracy configured with parameters (512,3) and (512,256,3) was 0.975 and 0.971, respectively, with performance degradation of 1.1% and 1.5%. Compared to self-built datasets, this decrease is more significant. These data further support the conclusion that KANs perform better in processing large datasets. When the hidden layer parameter is (512,256,128,3), the Top1 accuracy is 0.954. Compared to the model without the added KANs mechanism, the recognition performance decreased by 1.4%.
The above experimental results show that (512,128,3) is the most effective hidden layer parameter configuration. The number of hidden layer parameters is closely related to the dataset’s sample size. An appropriate number of hidden layer parameters is more suitable for small datasets, while for large datasets, the number of parameters can be appropriately increased to fully utilize the modeling capabilities of KANs.
3.5. Qualitative Analysis
This section analyzes the effectiveness of CANnet, backbone network, and optimal comparative experimental model in identifying specific plant disease types on two datasets.
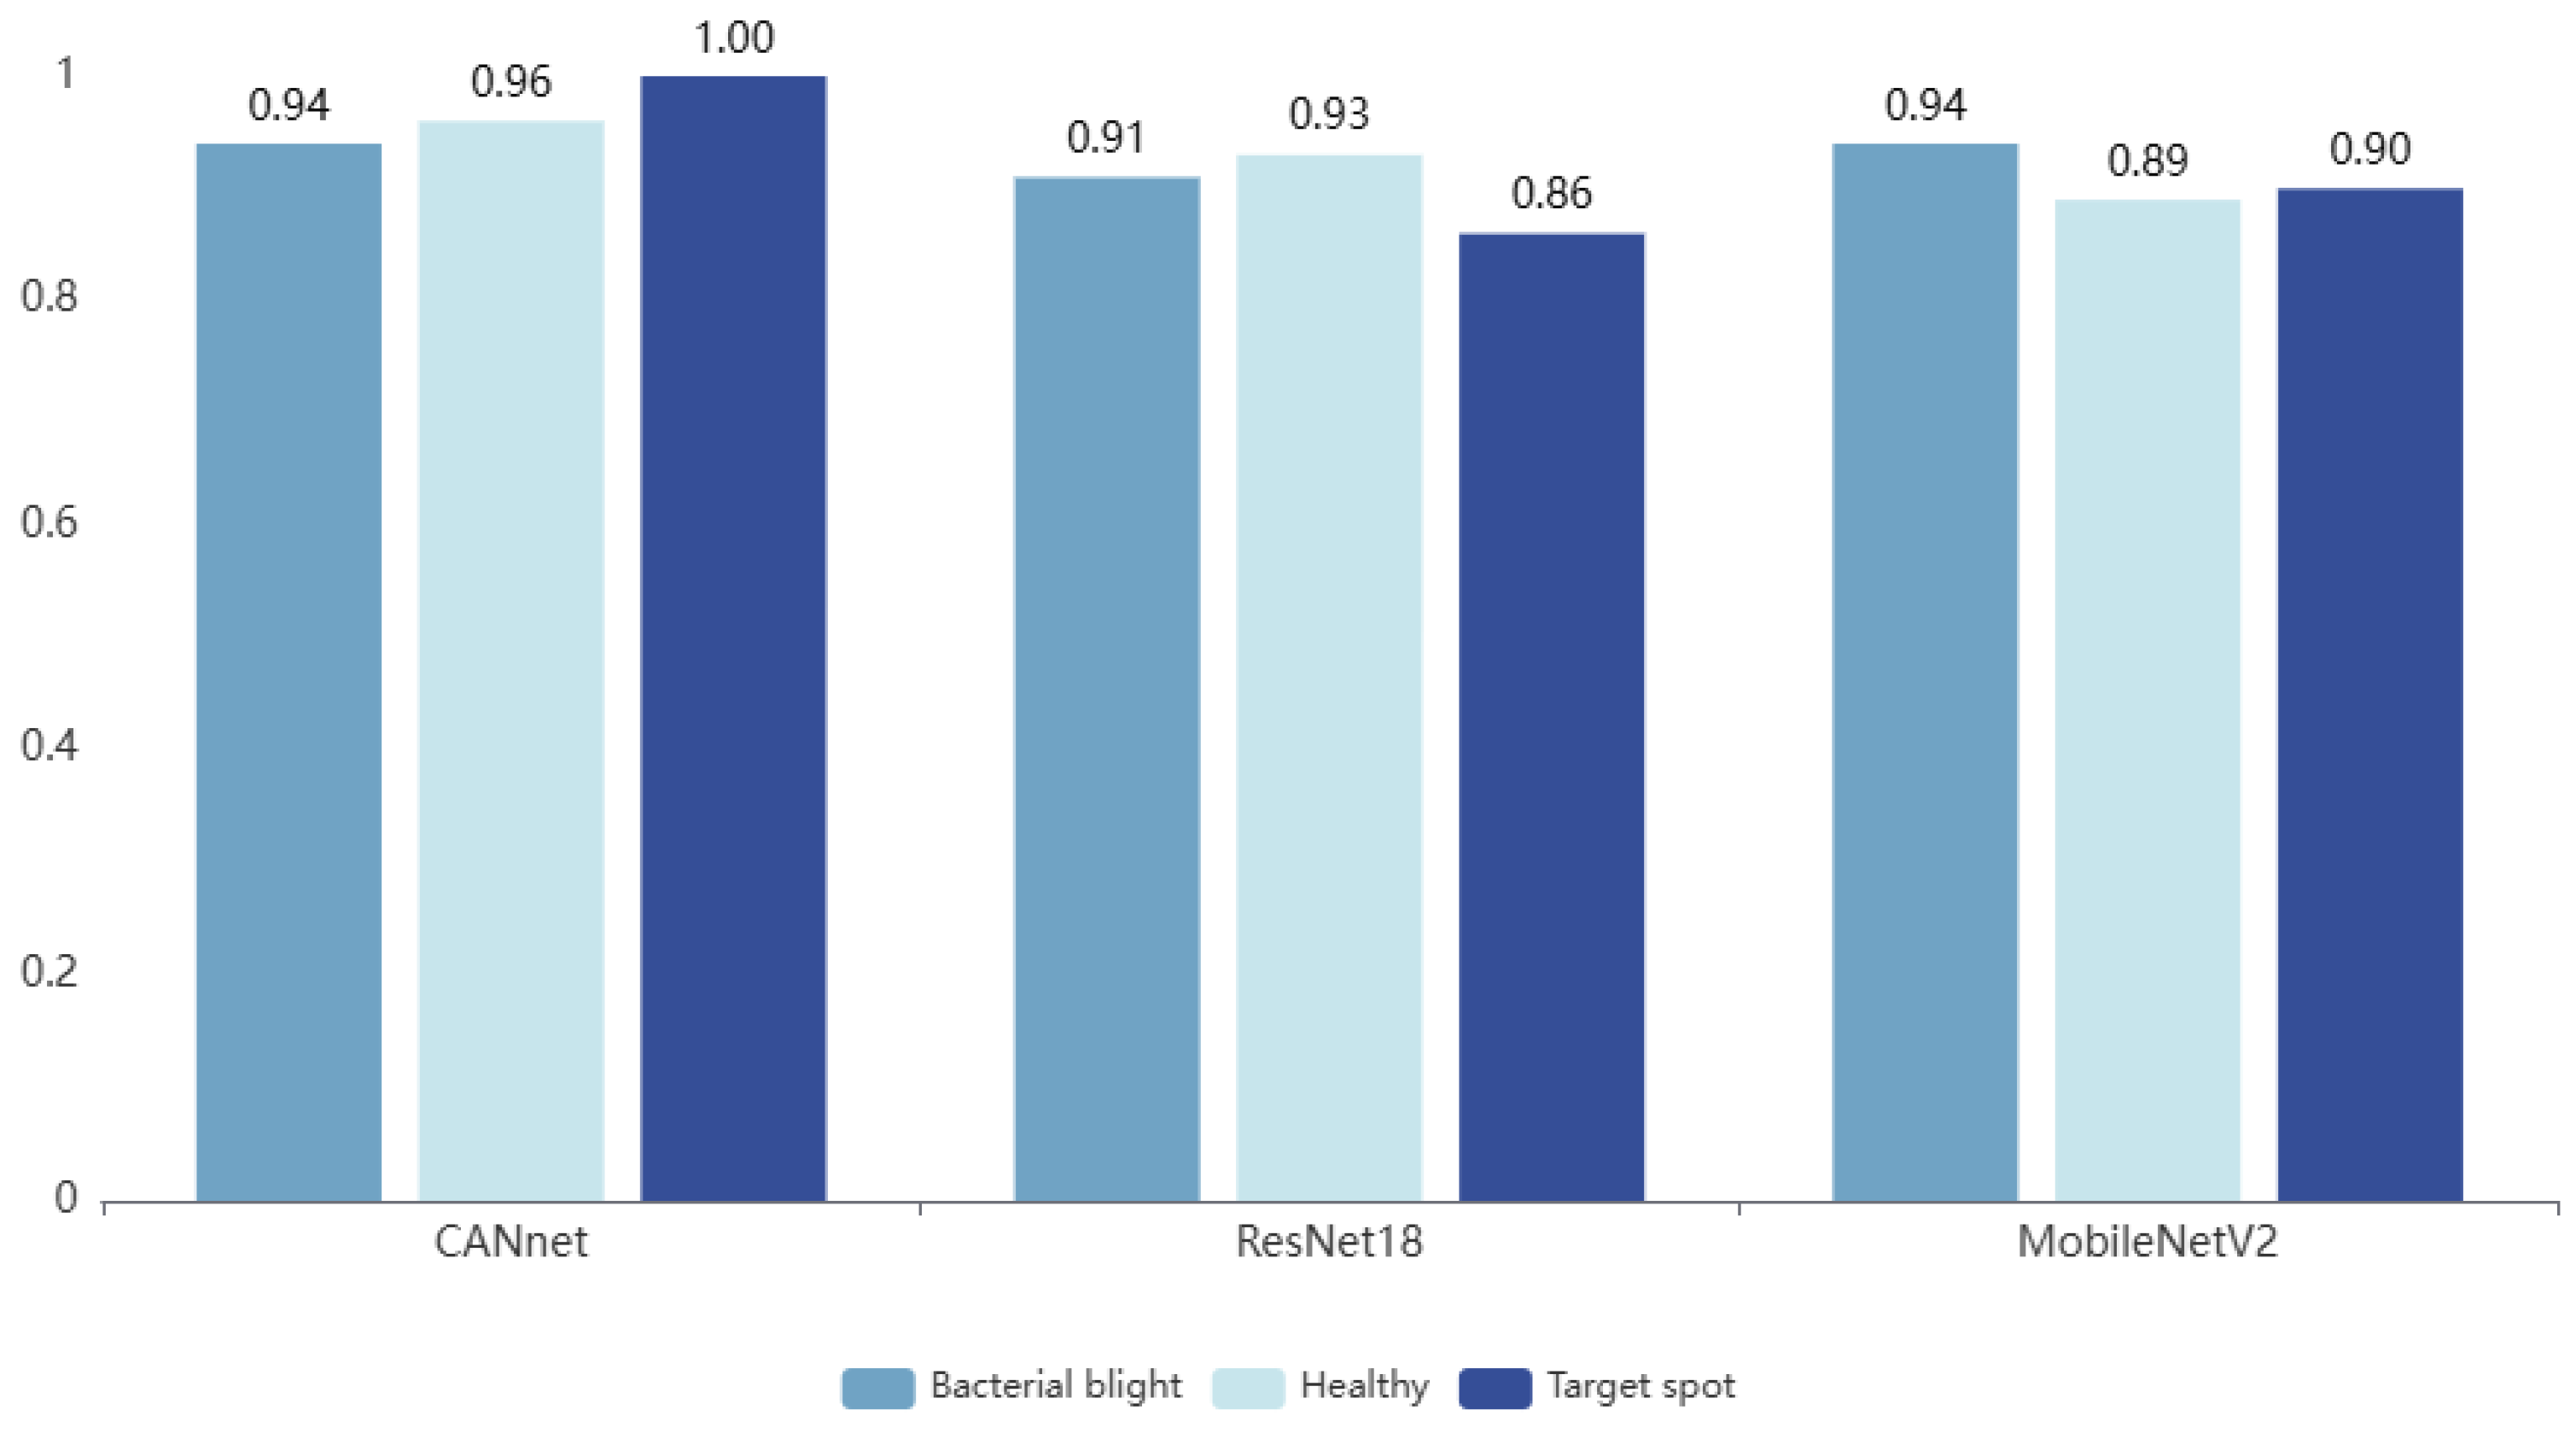
Based on the experimental results in Figure 8, we observed that CANnet performed excellently in all category recognition tasks. Specifically, the accuracy of CANnet in identifying Bacterial blight and Healthy categories is 0.94 and 0.96, respectively. Moreover, the recognition accuracy on the Target spot category has reached 1. These results highlight the high accuracy and excellent model performance of CANnet on self-built datasets. In contrast, ResNet18 achieved recognition accuracies of 0.91, 0.93, and 0.86 on the same dataset. Although ResNet18 performs well in the Bacterial blight and Healthy categories, its recognition accuracy in the Target spot category is 14% lower than that of CANnet. This significant difference may be attributed to the limitations of ResNet18 in identifying small targets. On the other hand, MobileNetV2, as a lightweight model, exhibits a high recognition accuracy of 0.94 in the Bacterial blight category. However, compared to CANnet, MobileNetV2 showed a 7% and 10% decrease in recognition accuracy for the Healthy and Target spot categories, respectively, indicating insufficient recognition ability for these categories. Based on the above experimental results, we can conclude a significant difference in recognition accuracy between ResNet18 and MobileNetV2 compared to CANnet. We speculate that this difference may be partially attributed to the rich background information in the dataset, which interferes with the feature extraction process and affects the model’s ability to recognize.
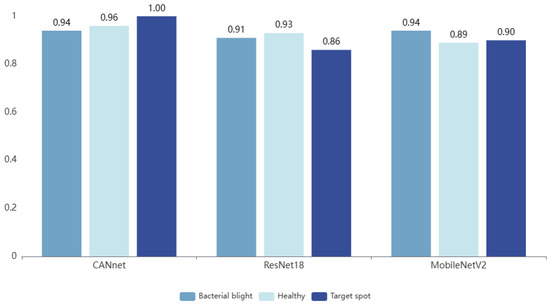
Figure 8.
Bar chart of specific species recognition accuracy using CANnet, ResNet18, and MobileNetV2 on a self-built cotton disease dataset.
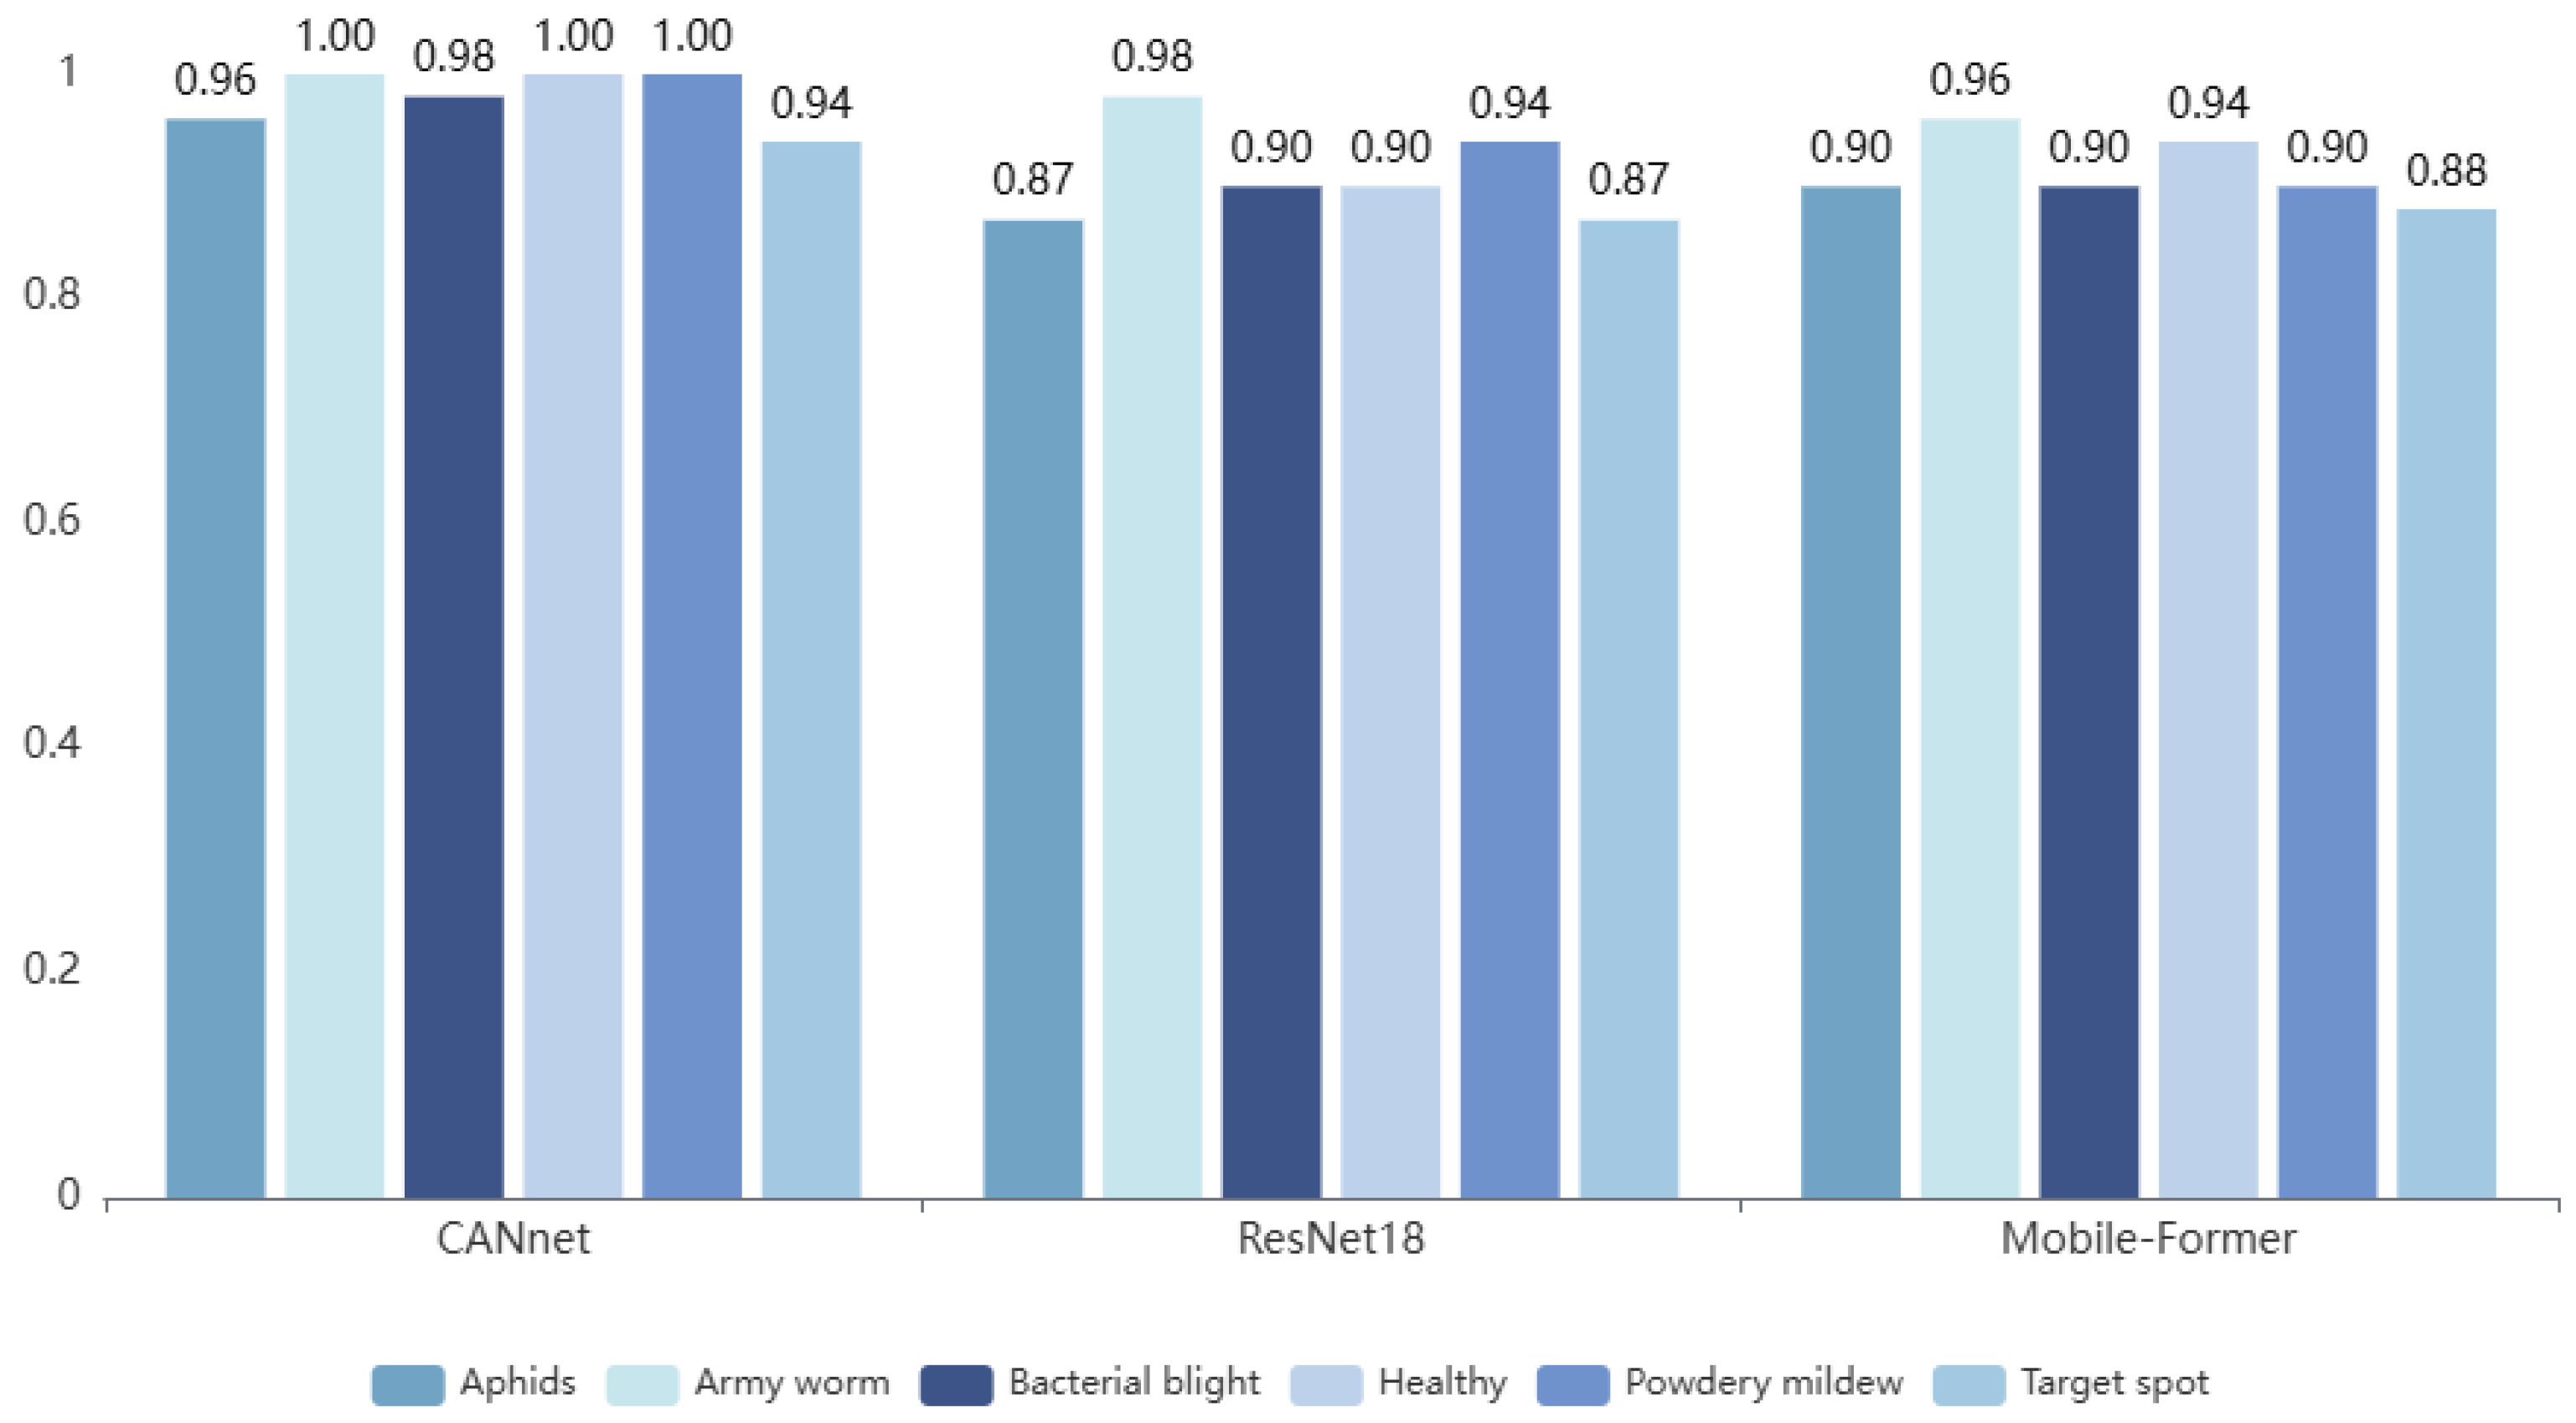
As shown in Figure 9, our analysis results demonstrate the outstanding performance of CANnet on public datasets. Specifically, CANnet achieved a recognition accuracy of 1 in the Army worm, Healthy, and Powdery mildew categories while achieving a recognition accuracy of 0.94 or higher in the other three categories, demonstrating extremely high classification ability. Compared with self-built datasets, public datasets have a larger sample size, which provides richer learning materials for the innovative spatial channel attention mechanism integrated into CANnet. Therefore, CANnet can more effectively capture features from many samples, achieving higher recognition accuracy. Although CANnet exhibits high recognition accuracy across all categories, ResNet18 and Mobile-Former models also demonstrate high recognition capabilities in specific categories. For example, in the categories of Army worm, Bacterial blight, Healthy, and Powdery mildew, the recognition accuracy of both models exceeded 0.9, demonstrating performance comparable to CANnet. However, in the Aphids category, the recognition accuracy of ResNet18 decreased to 0.87, while in the Target spot category, the recognition accuracy of ResNet18 and Mobile-Former were only 0.87 and 0.88, respectively. Based on the experimental results of our self-built dataset, we observed that both ResNet18 and MobileNetV2 had lower recognition accuracy in the Target spot category. We speculate that this may be due to the minor distinguishability differences between the Target spot category and other categories, which increases the difficulty of feature extraction for these two models and decreases recognition accuracy. In summary, the performance of the CANnet model on public datasets further confirms its superiority in cotton disease identification tasks.

Figure 9.
Bar chart of specific species recognition accuracy using CANnet, ResNet18, and Mobile-Former on a public cotton disease dataset.
3.6. Visualization Analysis
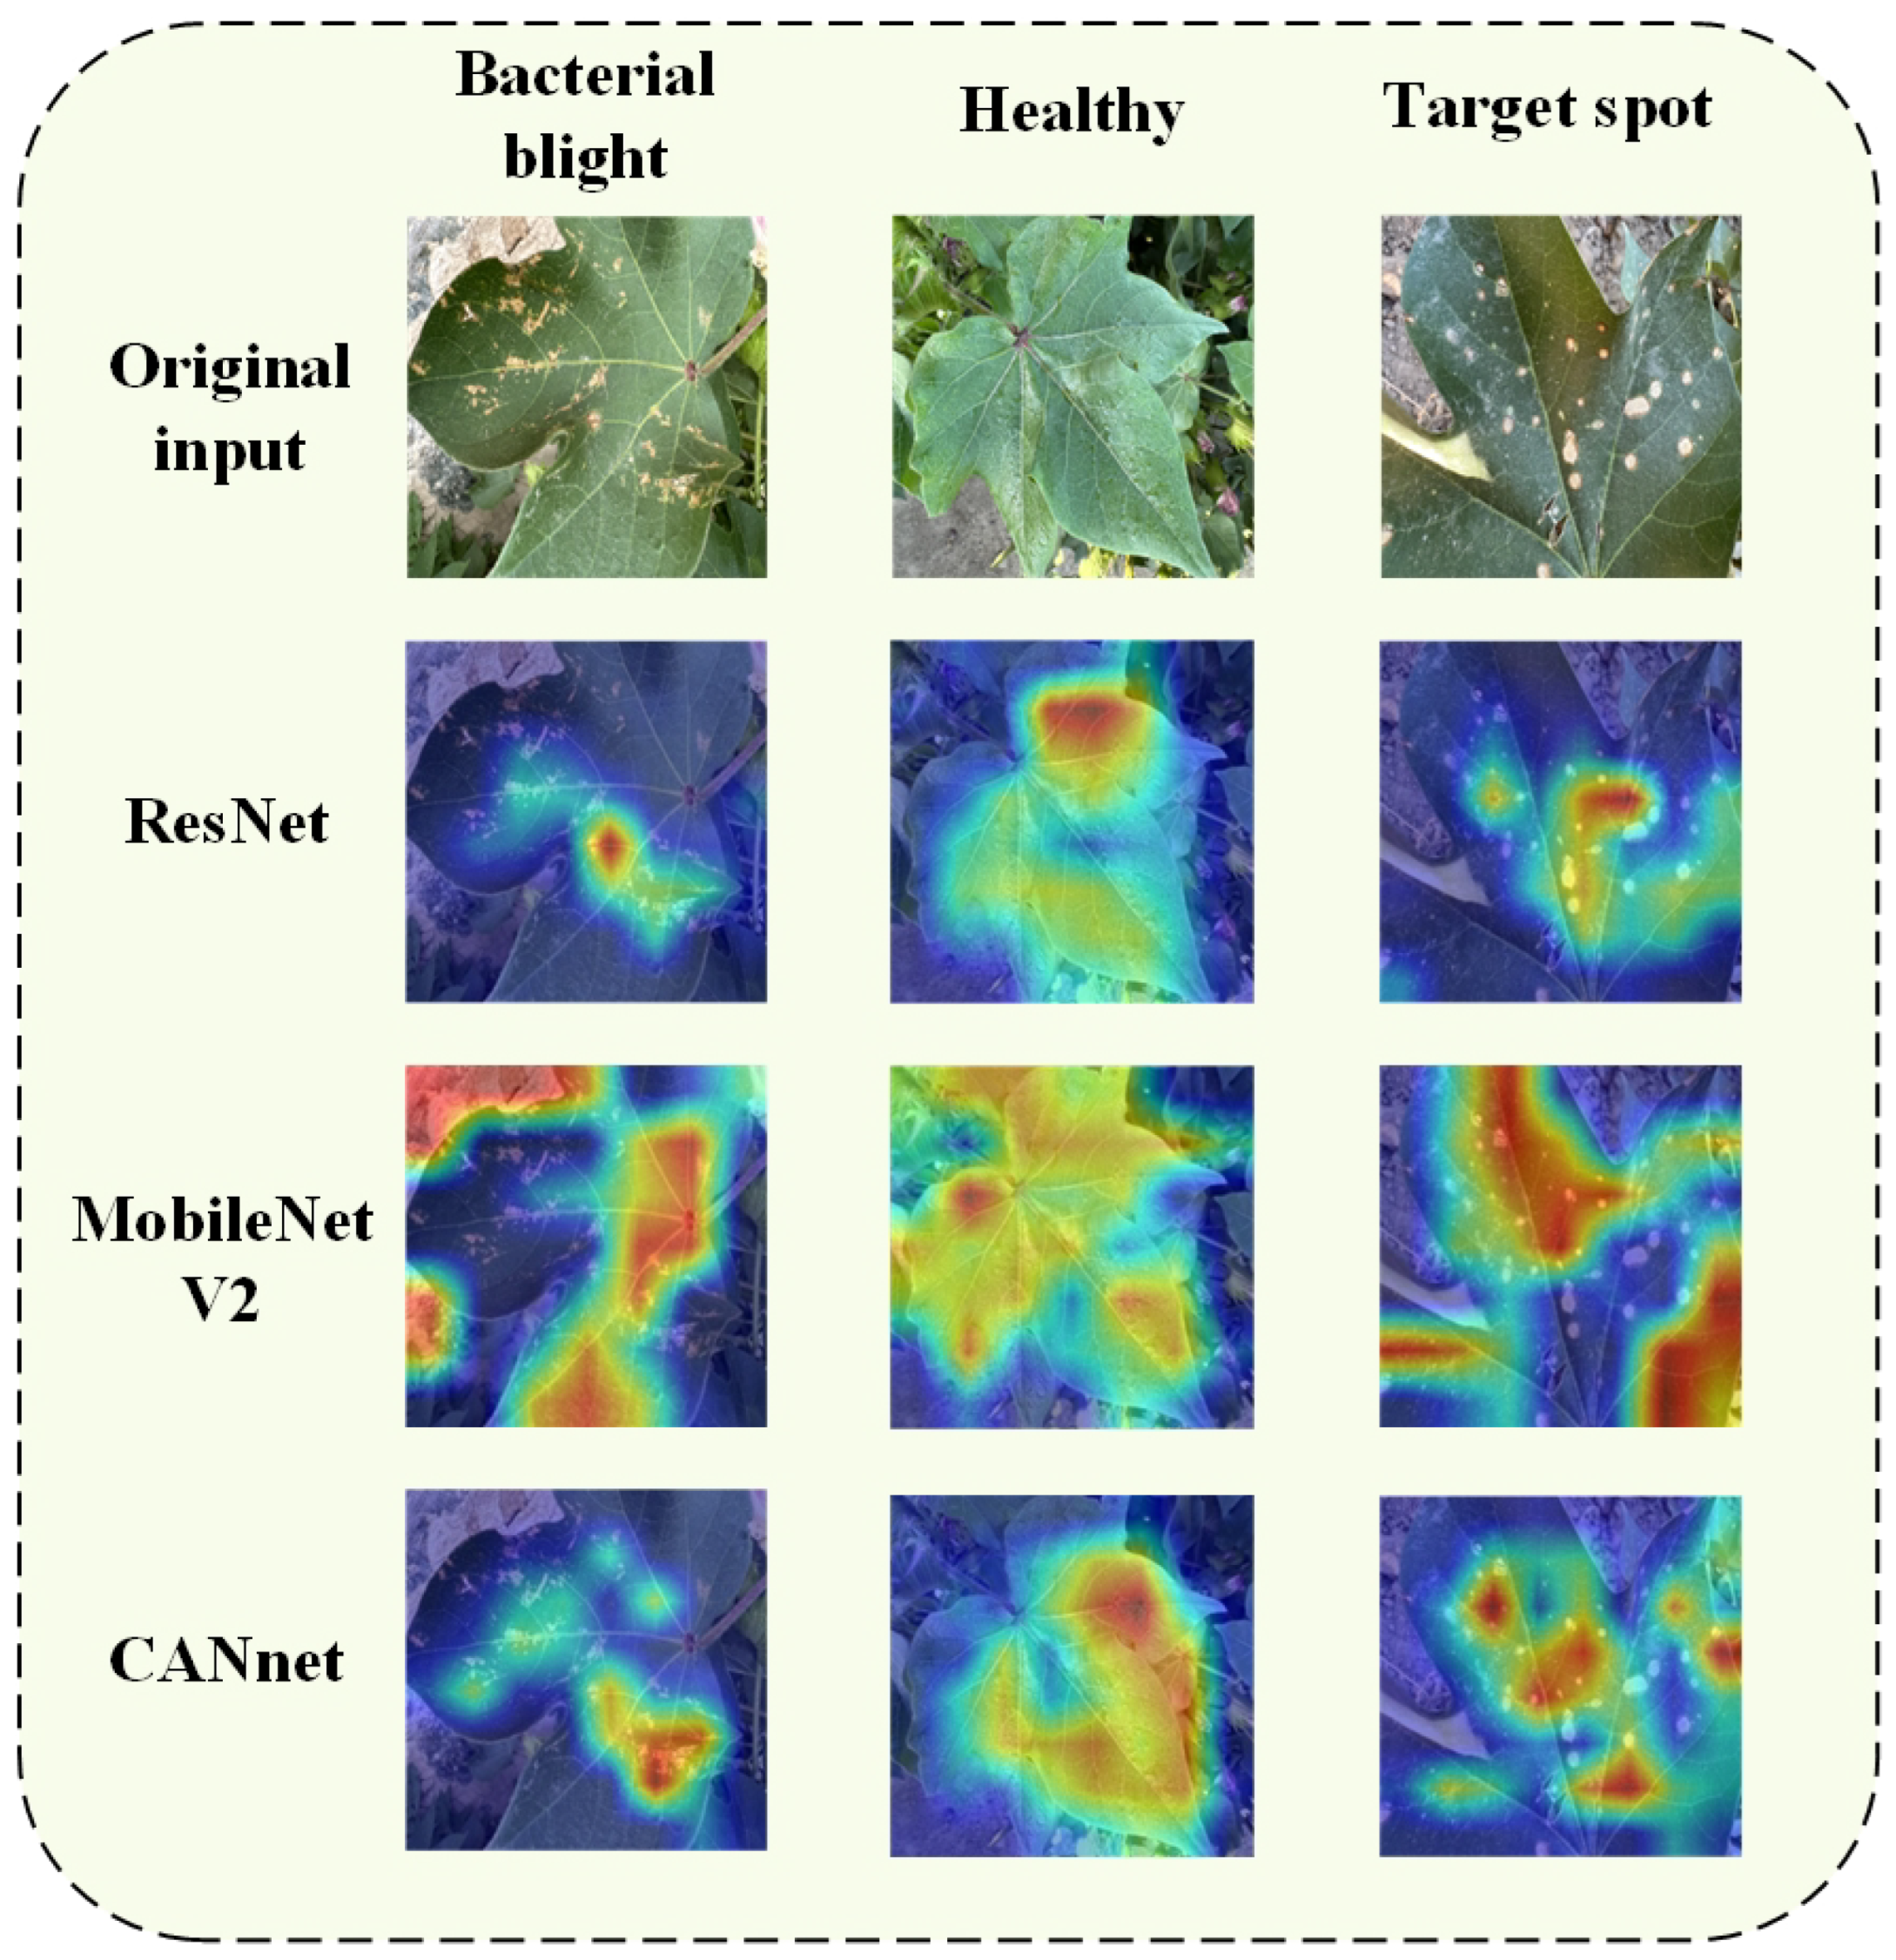
We used the Grad-CAM [45] method to visualize the attention region of the proposed CANnet model and compared it with the baseline and best-performing comparison models.
As shown in Figure 10, by comparing the attention regions of the three models on the self-built dataset, it can be observed that the ResNet model has problems with fewer attention regions and insufficient feature extraction. Complex backgrounds disrupt MobileNetV2’s attention and fail to focus on disease areas effectively. Compared with these two models, CANnet has demonstrated excellent performance in both the accuracy of the attention area and the handling of complex backgrounds. Among the two diseases, CANnet can accurately focus on the affected area rather than complex backgrounds or healthy tissues. In the health category, CANnet focuses entirely on the leaves, forming a clear boundary with the background.

Figure 10.
Attention visualization maps of ResNet, MobileNetV2, and CANnet on self-built cotton disease datasets. The darker the yellow, the better the attention effect.
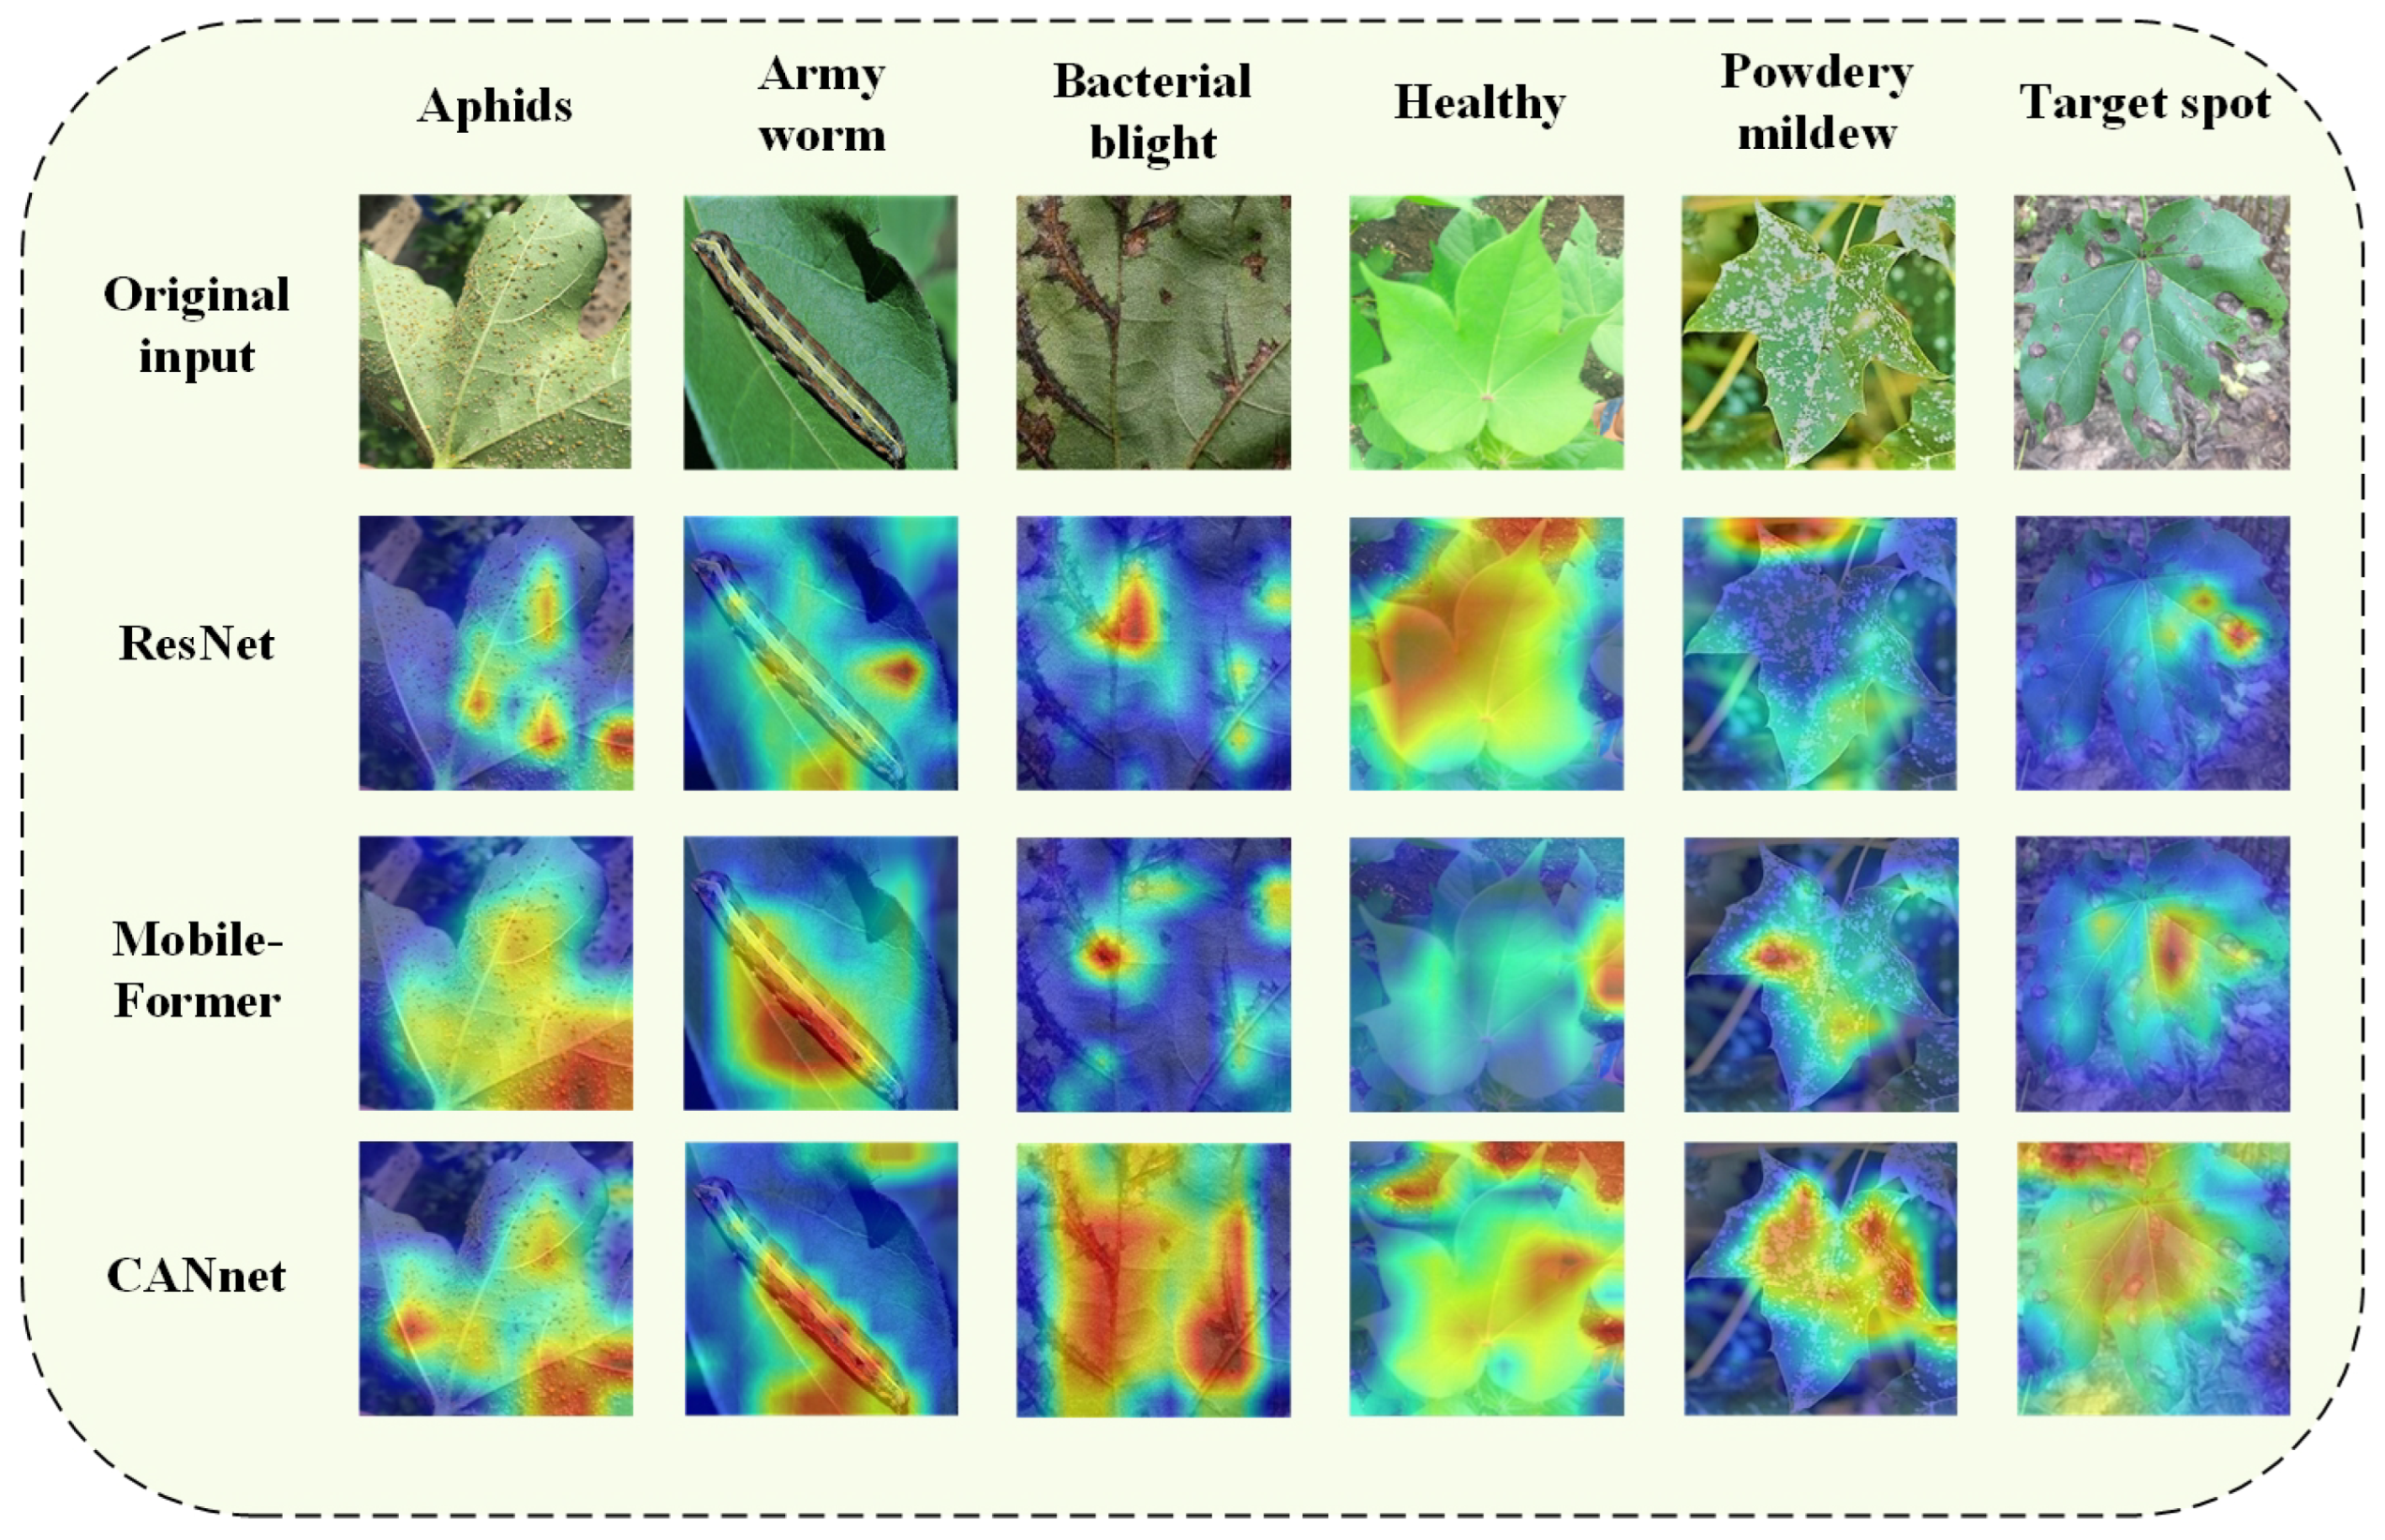
Figure 11 shows that CANnet has significant advantages over the other two models in terms of the size and depth of the attention region. ResNet’s attention was not focused on disease areas in the Army worm, Healthy, and Powdery mildew categories, and its performance in the other three types of diseases was insufficient. Although Mobile Farmer outperforms ResNet in some aspects, there is still a significant gap compared to CANnet, especially in terms of attention to disease areas.
Figure 11.
Attention visualization of ResNet, Mobile-Former, and CANnet on a public cotton disease dataset. The darker the yellow, the better the attention effect.
Based on the above analysis, CANnet exhibits better attention concentration ability in complex backgrounds than the other two models. CANnet effectively solves the interference of complex backgrounds and the feature extraction of diseased areas. We have ample reason to believe that the innovative spatial channel attention mechanism in CANnet is the key factor in solving these problems.
4. Conclusions
We propose a cotton disease recognition model called CANnet to address the two significant challenges currently faced in cotton disease recognition: low recognition rates in complex backgrounds and limited cotton disease datasets. We collected and constructed an on-site cotton disease dataset. The CANnet model introduces the RFSC module, which effectively solves the parameter-sharing problem in traditional convolutional kernels by integrating dynamic receptive field features with conventional features. In addition, we innovatively designed a PCA module that utilizes a spatial channel attention redundancy reduction mechanism further to optimize the feature extraction capability of the RFSC module. This study is the first to apply the KAN concept to crop disease identification. By making reasonable use of the learnable activation function technology in KAN, we have made lightweight improvements to KAN and formed KANs. The integration of KANs significantly improves the performance of CANnet in high-precision cotton disease recognition. The experimental results show that CANnet achieved a high recognition rate of 0.963 on a small-scale self-built dataset. The recognition accuracy is as high as 0.986 on the publicly available cotton disease dataset. Compared to other existing networks, CANnet exhibits the highest accuracy. Looking ahead, we plan to conduct in-depth research on the following aspects: Firstly, we will further explore the characteristics and features of disease data and design a more efficient and concise network architecture. Secondly, we plan to combine multiple data sources, such as hyperspectral images, infrared images, etc., to fuse more distinctive feature information, further improving the model’s training effectiveness and recognition accuracy. Finally, in response to the relatively small scale of agricultural disease datasets, we plan to collect and construct larger datasets for researchers in this field to use and promote research and development.
Author Contributions
Conceptualization, Y.S.; methodology, Y.S.; validation, Y.S.; writing—original draft preparation, Y.S.; writing—review and editing, Y.S., W.Y. and M.Z.; Resources, J.W.; supervision, J.W., D.C., Z.L. and M.Z.; funding acquisition, W.Y. All authors have read and agreed to the published version of the manuscript.
Funding
This work was a research achievement supported by the National Key R&D Program of China Major Project (Grant No.2022ZD0115802), the National Natural Science Foundation of China (Grant No.62262065), the “Tianshan Talent” Research Project of Xinjiang (Grant No. 2022TSYCLJ0037).
Institutional Review Board Statement
Not applicable.
Data Availability Statement
The experimental data of this article can be obtained from the corresponding author. The self-built dataset was created by the Wang Jiajia team in our laboratory. If needed, please contact wjjxj@xju.edu.cn.
Conflicts of Interest
The authors declare no conflict of interest.
References
- Ahmad, S.; Hasanuzzaman, M. Cotton Production and Uses; Agronomy, Crop Protection, and Postharvest Technologie; Springer Nature Singapore Pte Ltd.: Singapore, 2020. [Google Scholar]
- Madasamy, B.; Balasubramaniam, P.; Dutta, R. Microclimate-based pest and disease management through a forewarning system for sustainable cotton production. Agriculture 2020, 10, 641. [Google Scholar] [CrossRef]
- Ul-Allah, S.; Rehman, A.; Hussain, M.; Farooq, M. Fiber yield and quality in cotton under drought: Effects and management. Agric. Water Manag. 2021, 255, 106994. [Google Scholar] [CrossRef]
- Yu, M.; Ma, X.; Guan, H. Recognition method of soybean leaf diseases using residual neural network based on transfer learning. Ecol. Inform. 2023, 76, 102096. [Google Scholar] [CrossRef]
- Song, Y.; Zhang, H.; Li, J.; Ye, R.; Zhou, X.; Dong, B.; Fan, D.; Li, L. High-accuracy maize disease detection based on attention generative adversarial network and few-shot learning. Plants 2023, 12, 3105. [Google Scholar] [CrossRef]
- Hu, Y.; Liu, G.; Chen, Z.; Liu, J.; Guo, J. Lightweight one-stage maize leaf disease detection model with knowledge distillation. Agriculture 2023, 13, 1664. [Google Scholar] [CrossRef]
- Kumar, S.; Jain, A.; Shukla, A.P.; Singh, S.; Raja, R.; Rani, S.; Harshitha, G.; AlZain, M.A.; Masud, M. A comparative analysis of machine learning algorithms for detection of organic and nonorganic cotton diseases. Math. Probl. Eng. 2021, 2021, 1790171. [Google Scholar] [CrossRef]
- Shah, N.; Jain, S. Detection of disease in cotton leaf using artificial neural network. In Proceedings of the 2019 Amity International Conference on Artificial Intelligence (AICAI), Dubai, United Arab Emirates, 4–6 February 2019; IEEE: New York, NY, USA, 2019; pp. 473–476. [Google Scholar]
- Pechuho, N.; Khan, Q.; Kalwar, S. Cotton crop disease detection using machine learning via tensorflow. Pak. J. Eng. Technol. 2020, 3, 126–130. [Google Scholar] [CrossRef]
- Sujatha, R.; Chatterjee, J.M.; Jhanjhi, N.; Brohi, S.N. Performance of deep learning vs machine learning in plant leaf disease detection. Microprocess. Microsyst. 2021, 80, 103615. [Google Scholar] [CrossRef]
- Caldeira, R.F.; Santiago, W.E.; Teruel, B. Identification of cotton leaf lesions using deep learning techniques. Sensors 2021, 21, 3169. [Google Scholar] [CrossRef]
- Suriya, S.; Navina, N. Development and Analysis of CNN based Disease Detection in Cotton Plants. J. Innov. Image Process. 2023, 5, 140–160. [Google Scholar] [CrossRef]
- Zambare, R.; Deshmukh, R.; Awati, C.; Shirgave, S.; Thorat, S.; Zalte, S. Deep Learning Model for Disease Identification of Cotton Plants. Spec. Ugdym. 2022, 1, 6684–6695. [Google Scholar]
- Zekiwos, M.; Bruck, A. Deep Learning-Based Image Processing for Cotton Leaf Disease and Pest Diagnosis. J. Electr. Comput. Eng. 2021, 2021, 9981437. [Google Scholar]
- Jajja, A.I.; Abbas, A.; Khattak, H.A.; Niedbała, G.; Khalid, A.; Rauf, H.T.; Kujawa, S. Compact convolutional transformer (CCT)-Based approach for whitefly attack detection in cotton crops. Agriculture 2022, 12, 1529. [Google Scholar] [CrossRef]
- Rai, C.K.; Pahuja, R. Classification of diseased cotton leaves and plants using improved deep convolutional neural network. Multimed. Tools Appl. 2023, 82, 25307–25325. [Google Scholar] [CrossRef]
- Pankaj, M.; Gupta, T.; Poongodi, T. IoT Hardware Sensor-Based Cotton Disease Prediction Using CNN Algorithm. In Proceedings of the 2022 3rd International Conference on Intelligent Engineering and Management (ICIEM), London, UK, 27–29 April 2022; pp. 479–483. [Google Scholar]
- Shao, M.; He, P.; Zhang, Y.; Zhou, S.; Zhang, N.; Zhang, J. Identification method of cotton leaf diseases based on bilinear coordinate attention enhancement module. Agronomy 2022, 13, 88. [Google Scholar] [CrossRef]
- Gao, R.; Dong, Z.; Wang, Y.; Cui, Z.; Ye, M.; Dong, B.; Lu, Y.; Wang, X.; Song, Y.; Yan, S. Intelligent cotton Pest and disease detection: Edge computing solutions with transformer technology and knowledge graphs. Agriculture 2024, 14, 247. [Google Scholar] [CrossRef]
- Xu, Y.; Gao, Z.; Wang, J.; Zhou, Y.; Li, J.; Meng, X. A Two-Stage Approach to the Study of Potato Disease Severity Classification. Agriculture 2024, 14, 386. [Google Scholar] [CrossRef]
- Guo, Y.; Lan, Y.; Chen, X. CST: Convolutional Swin Transformer for detecting the degree and types of plant diseases. Comput. Electron. Agric. 2022, 202, 107407. [Google Scholar] [CrossRef]
- Zeng, W.; Li, M. Crop leaf disease recognition based on Self-Attention convolutional neural network. Comput. Electron. Agric. 2020, 172, 105341. [Google Scholar] [CrossRef]
- Lee, S.H.; Goëau, H.; Bonnet, P.; Joly, A. Attention-based recurrent neural network for plant disease classification. Front. Plant Sci. 2020, 11, 601250. [Google Scholar] [CrossRef]
- Wang, P.; Niu, T.; Mao, Y.; Zhang, Z.; Liu, B.; He, D. Identification of apple leaf diseases by improved deep convolutional neural networks with an attention mechanism. Front. Plant Sci. 2021, 12, 723294. [Google Scholar] [CrossRef] [PubMed]
- Picon, A.; Seitz, M.; Alvarez-Gila, A.; Mohnke, P.; Ortiz-Barredo, A.; Echazarra, J. Crop conditional Convolutional Neural Networks for massive multi-crop plant disease classification over cell phone acquired images taken on real field conditions. Comput. Electron. Agric. 2019, 167, 105093. [Google Scholar] [CrossRef]
- Park, J.; Sathuvalli, V.; Yilma, S.; Whitworth, J.; Novy, R.G. Identification of QTL associated with plant vine characteristics and infection response to late blight, early blight, and Verticillium wilt in a tetraploid potato population derived from late blight-resistant Palisade Russet. Front. Plant Sci. 2023, 14, 1222596. [Google Scholar] [CrossRef]
- He, K.; Zhang, X.; Ren, S.; Sun, J. Deep residual learning for image recognition. In Proceedings of the IEEE Conference on Computer Vision and Pattern Recognition, Las Vegas, NV, USA, 30–27 June 2016; pp. 770–778. [Google Scholar]
- Liu, Z.; Wang, Y.; Vaidya, S.; Ruehle, F.; Halverson, J.; Soljačić, M.; Hou, T.Y.; Tegmark, M. Kan: Kolmogorov-arnold networks. arXiv 2024, arXiv:2404.19756. [Google Scholar]
- Dhamodharan. Cotton Plant Disease. 2023. Available online: https://www.kaggle.com/datasets/dhamur/cotton-plant-disease (accessed on 6 May 2024).
- Bovik, A.C. Basic gray level image processing. In The Essential Guide to Image Processing; Elsevier: Amsterdam, The Netherlands, 2009; pp. 43–68. [Google Scholar]
- Zhang, X.; Liu, C.; Yang, D.; Song, T.; Ye, Y.; Li, K.; Song, Y. RFAConv: Innovating spatial attention and standard convolutional operation. arXiv 2023, arXiv:2304.03198. [Google Scholar]
- Krizhevsky, A.; Sutskever, I.; Hinton, G.E. Imagenet classification with deep convolutional neural networks. In Proceedings of the Advances in Neural Information Processing Systems 25 (NIPS 2012), Lake Tahoe, NV, USA, 3–6 December 2012; Volume 25. [Google Scholar]
- Iandola, F.N.; Han, S.; Moskewicz, M.W.; Ashraf, K.; Dally, W.J.; Keutzer, K. SqueezeNet: AlexNet-level accuracy with 50x fewer parameters and <0.5 MB model size. arXiv 2016, arXiv:1602.07360. [Google Scholar]
- Sandler, M.; Howard, A.; Zhu, M.; Zhmoginov, A.; Chen, L.C. Mobilenetv2: Inverted residuals and linear bottlenecks. In Proceedings of the IEEE Conference on Computer Vision and Pattern Recognition, Salt Lake City, UT, USA, 18–23 June 2018; pp. 4510–4520. [Google Scholar]
- Howard, A.; Sandler, M.; Chu, G.; Chen, L.C.; Chen, B.; Tan, M.; Wang, W.; Zhu, Y.; Pang, R.; Vasudevan, V.; et al. Searching for mobilenetv3. In Proceedings of the IEEE/CVF International Conference on Computer Vision, Seoul, Republic of Korea, 27 October– 2 November 2019; pp. 1314–1324. [Google Scholar]
- Heo, B.; Yun, S.; Han, D.; Chun, S.; Choe, J.; Oh, S.J. Rethinking spatial dimensions of vision transformers. In Proceedings of the IEEE/CVF International Conference on Computer Vision, Montreal, QC, Canada, 10–17 October 2021; pp. 11936–11945. [Google Scholar]
- Chen, M.; Lin, M.; Li, K.; Shen, Y.; Wu, Y.; Chao, F.; Ji, R. Cf-vit: A general coarse-to-fine method for vision transformer. In Proceedings of the Proceedings of the AAAI Conference on Artificial Intelligence, Washington, DC, USA, 7–14 February 2023; Volume 37, pp. 7042–7052. [Google Scholar]
- Han, K.; Xiao, A.; Wu, E.; Guo, J.; Xu, C.; Wang, Y. Transformer in transformer. Adv. Neural Inf. Process. Syst. 2021, 34, 15908–15919. [Google Scholar]
- Graham, B.; El-Nouby, A.; Touvron, H.; Stock, P.; Joulin, A.; Jégou, H.; Douze, M. Levit: A vision transformer in convnet’s clothing for faster inference. In Proceedings of the IEEE/CVF International Conference on Computer Vision, Montreal, QC, Canada, 10–17 October 2021; pp. 12259–12269. [Google Scholar]
- Dai, Z.; Liu, H.; Le, Q.V.; Tan, M. Coatnet: Marrying convolution and attention for all data sizes. Adv. Neural Inf. Process. Syst. 2021, 34, 3965–3977. [Google Scholar]
- Dosovitskiy, A.; Beyer, L.; Kolesnikov, A.; Weissenborn, D.; Zhai, X.; Unterthiner, T.; Dehghani, M.; Minderer, M.; Heigold, G.; Gelly, S.; et al. An image is worth 16 × 16 words: Transformers for image recognition at scale. arXiv 2020, arXiv:2010.11929. [Google Scholar]
- Liu, Z.; Lin, Y.; Cao, Y.; Hu, H.; Wei, Y.; Zhang, Z.; Lin, S.; Guo, B. Swin transformer: Hierarchical vision transformer using shifted windows. In Proceedings of the IEEE/CVF International Conference on Computer Vision, Montreal, QC, Canada, 10–17 October 2021; pp. 10012–10022. [Google Scholar]
- Wu, H.; Xiao, B.; Codella, N.; Liu, M.; Dai, X.; Yuan, L.; Zhang, L. Cvt: Introducing convolutions to vision transformers. In Proceedings of the IEEE/CVF International Conference on Computer Vision, Montreal, QC, Canada, 10–17 October 2021; pp. 22–31. [Google Scholar]
- Chen, Y.; Dai, X.; Chen, D.; Liu, M.; Dong, X.; Yuan, L.; Liu, Z. Mobile-former: Bridging mobilenet and transformer. In Proceedings of the IEEE/CVF Conference on Computer Vision and Pattern Recognition, New Orleans, LA, USA, 19–24 June 2022; pp. 5270–5279. [Google Scholar]
- Selvaraju, R.R.; Cogswell, M.; Das, A.; Vedantam, R.; Parikh, D.; Batra, D. Grad-cam: Visual explanations from deep networks via gradient-based localization. In Proceedings of the IEEE International Conference on Computer Vision, Venice, Italy, 22–29 October 2017; pp. 618–626. [Google Scholar]

Disclaimer/Publisher’s Note: The statements, opinions and data contained in all publications are solely those of the individual author(s) and contributor(s) and not of MDPI and/or the editor(s). MDPI and/or the editor(s) disclaim responsibility for any injury to people or property resulting from any ideas, methods, instructions or products referred to in the content. |
© 2024 by the authors. Licensee MDPI, Basel, Switzerland. This article is an open access article distributed under the terms and conditions of the Creative Commons Attribution (CC BY) license (https://creativecommons.org/licenses/by/4.0/).