Article

Segmentation Method of Zanthoxylum bungeanum Cluster Based on Improved Mask R-CNN

1
College of Agricultural Engineering, Shanxi Agricultural University, Jinzhong 030801, China
2
Dryland Farm Machinery Key Technology and Equipment Key Laboratory of Shanxi Province, Jinzhong 030801, China
*
Author to whom correspondence should be addressed.
Agriculture 2024, 14(9), 1585; https://doi.org/10.3390/agriculture14091585
Submission received: 9 July 2024 / Revised: 9 September 2024 / Accepted: 10 September 2024 / Published: 12 September 2024
(This article belongs to the Section Agricultural Technology)

Abstract

:
The precise segmentation of Zanthoxylum bungeanum clusters is crucial for developing picking robots. An improved Mask R-CNN model was proposed in this study for the segmentation of Zanthoxylum bungeanum clusters in natural environments. Firstly, the Swin-Transformer network was introduced into the model’s backbone as the feature extraction network to enhance the model’s feature extraction capabilities. Then, the SK attention mechanism was utilized to fuse the detailed information into the mask branch from the low-level feature map of the feature pyramid network (FPN), aiming to supplement the image detail features. Finally, the distance intersection over union (DIOU) loss function was adopted to replace the original bounding box loss function of Mask R-CNN. The model was trained and tested based on a self-constructed Zanthoxylum bungeanum cluster dataset. Experiments showed that the improved Mask R-CNN model achieved 84.0% and 77.2% in detection mAP 50 box and segmentation mAP 50 mask , respectively, representing a 5.8% and 4.6% improvement over the baseline Mask R-CNN model. In comparison to conventional instance segmentation models, such as YOLACT, Mask Scoring R-CNN, and SOLOv2, the improved Mask R-CNN model also exhibited higher segmentation precision. This study can provide valuable technology support for the development of Zanthoxylum bungeanum picking robots.

1. Introduction

Zanthoxylum bungeanum, a spice plant belonging to the Rutaceae family, holds considerable economic and ecological significance. Its cultivation is mainly concentrated in Asian regions such as China, Japan, Korea, and India, with China having the largest cultivation area and achieving the highest Zanthoxylum bungeanum fruit yield, making it an important player in the global spice market [1,2]. Zanthoxylum bungeanum’s fruits are small, grow in clusters, and are picked in clusters. Picking Zanthoxylum bungeanum is difficult due to the thorny branches and tangled foliage. However, the harvesting of Zanthoxylum bungeanum still relies on manual picking, which is both labor-intensive and costly [3]. Developing the automated picking robot for Zanthoxylum bungeanum is of great significance for saving labor costs, alleviating the shortage of manual laborers, and improving the efficiency of the harvesting process.
Accurate segmentation of Zanthoxylum bungeanum clusters is crucial for robotic harvesting. Currently, researchers have conducted extensive studies on the segmentation of fruits and vegetables, by traditional image segmentation methods and methods based on deep learning [4,5,6,7]. Traditional image segmentation methods mainly rely on shape and texture features to detect and segment fruit and vegetable objects in different color spaces such as RGB and HSV [8,9,10]. Song et al. [11] segmented the edges of Zanthoxylum bungeanum based on the RGB color model, integrating the median filter preprocessing, canny edge detection algorithm, and morphological processing. Qi et al. [12] used the median filter method to remove image noise based on the HSV model and then applied an improved Otsu algorithm to segment Zanthoxylum bungeanum targets. Wan et al. [13] applied the difference between red and green images (R-G) for the image segmentation of Zanthoxylum bungeanum fruits under natural environmental conditions, utilizing optimized erosion techniques to filter out noise and an isolation zone method to eliminate non-target Zanthoxylum bungeanum fruits. Traditional image segmentation methods rely on manual design and the extraction of image features, leading to limited data exploitation, poor anti-interference capabilities, and segmentation accuracy constrained by expert experience [14].
Compared to traditional image segmentation methods, segmentation algorithms based on deep learning can automatically extract multi-dimensional features from large amounts of data, improving image segmentation precision [15]. In recent years, deep learning algorithms have been widely applied to the segmentation of agricultural images. Zhou et al. [16] conducted the detection and segmentation of grape clusters based on an improved YOLACT++ deep-learning model; by introducing the SimAM attention mechanism into YOLACT++ and replacing the activation function, the improved model achieved a 0.83% and 0.88% increase in detection mAPbox and segmentation mAPmask, respectively, compared to the original YOLACT++ model. Zhong et al. [17] proposed a segmentation method for the fruiting shoots of lychees based on the YOLACT model. This method utilized the pixel differences between lychee fruits and their main fruiting shoots to segment the lychee fruiting shoots, resulting in relatively complete images of the fruiting shoots. Based on the SOLOv2 algorithm architecture, Zhuang et al. [18] effectively improved the accuracy of seedling tray image segmentation by integrating the split attention network with the feature pyramid network as the backbone extraction network and introduced deformable convolution networks. Liu et al. [19] segmented diseased tomato leaves by improving the SOLOv2 model, which utilized ResNet101 as the backbone feature extraction network and introduced the deformable convolutional network.
The aforementioned studies were mainly based on single-stage instance segmentation models, such as YOLACT and SOLO. Although these models possess a fast detection speed, their accuracy usually cannot match the two-stage segmentation models. Mask R-CNN [20] is a representative two-stage instance segmentation model that can not only output the rectangular bounding box of the target but also provide pixel-level masks, thus enabling efficient target detection and segmentation. Isaac Pérez-Borrero et al. [21] applied the Mask R-CNN model for strawberry detection and segmentation by developing a streamlined backbone architecture, eliminating the object and bounding-box regressors, and substituting the non-maximum suppression algorithm. Jia et al. [22] presented an improved Mask R-CNN model to detect and segment the overlapping apples, which integrated the residual network (ResNet) with densely connected convolutional networks (DenseNet) as the model’s backbone. Long et al. [23] proposed an improved Mask R-CNN model for segmenting tomato fruits in greenhouse environments. The improved model enhanced the model’s segmentation accuracy while decreasing the network’s computational load by fusing the cross stage partial network (CSPNet) into the backbone feature extraction network and adopting the cross stage splitting and cascading strategy. To segment the pruning points of tomato lateral branches, Liang et al. [24] improved the Mask R-CNN model by replacing the backbone network with the MobileNetv3 and adding efficient channel attention, which performed better than the original Mask R-CNN model.
However, the backbone of the Mask R-CNN model relies on the convolutional neural network (CNN) architecture for feature extraction, which has limited receptive fields that focus primarily on local image features while neglecting global ones [25]. This hinders the analysis of long-range dependencies and contextual interactions between image pixels from a global perspective, limiting model performance. Additionally, the multiple pooling and downsampling operations in the Mask R-CNN model decrease the spatial resolution of image feature maps, resulting in the loss of image detail information and affecting segmentation accuracy [26]. In natural growth environments, the clusters of Zanthoxylum bungeanum exhibit diverse shapes and uneven distributions, which are prone to be occluded by leaves. These factors increase the difficulty of detection and segmentation for Zanthoxylum bungeanum clusters.
Therefore, an improved Mask R-CNN model was proposed for the accurate segmentation of Zanthoxylum bungeanum clusters.
(1)
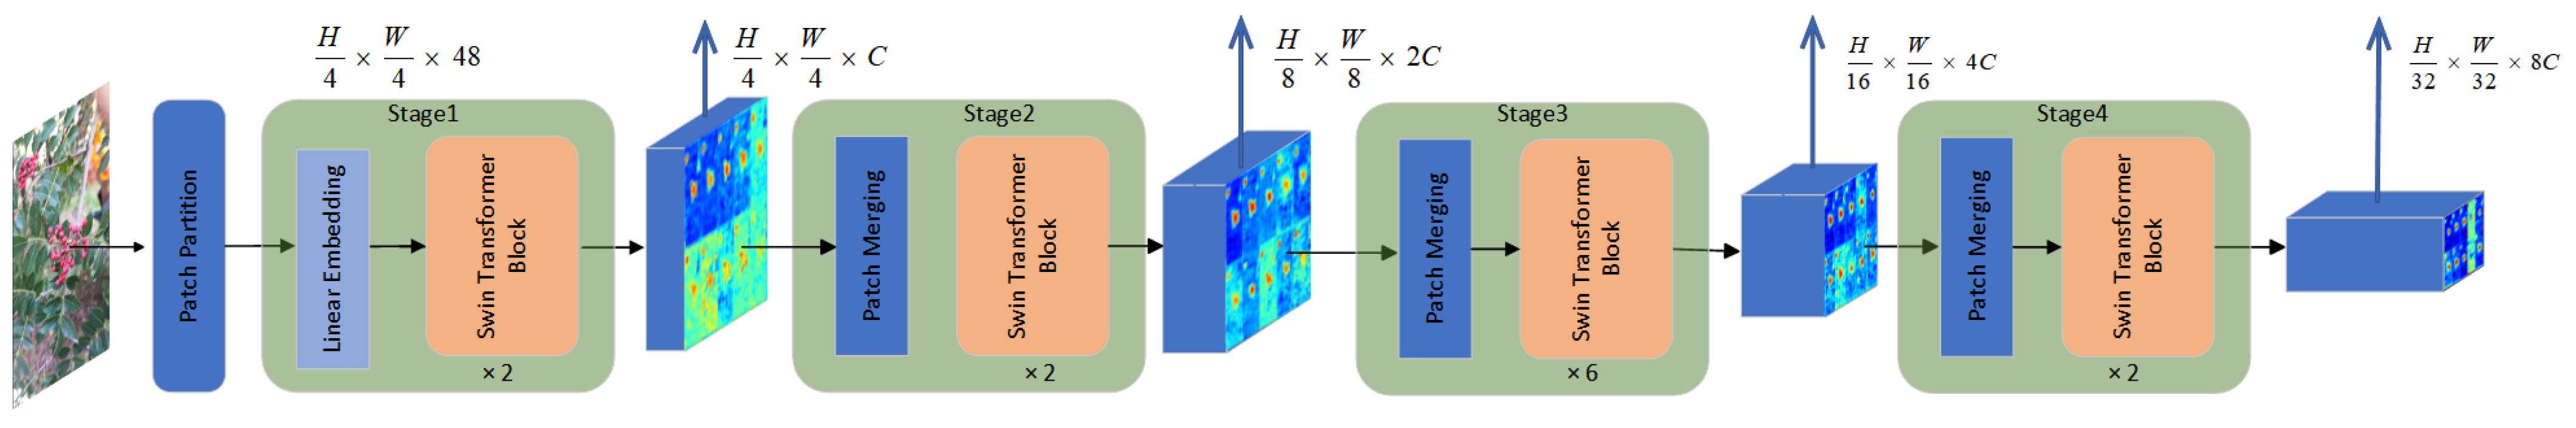
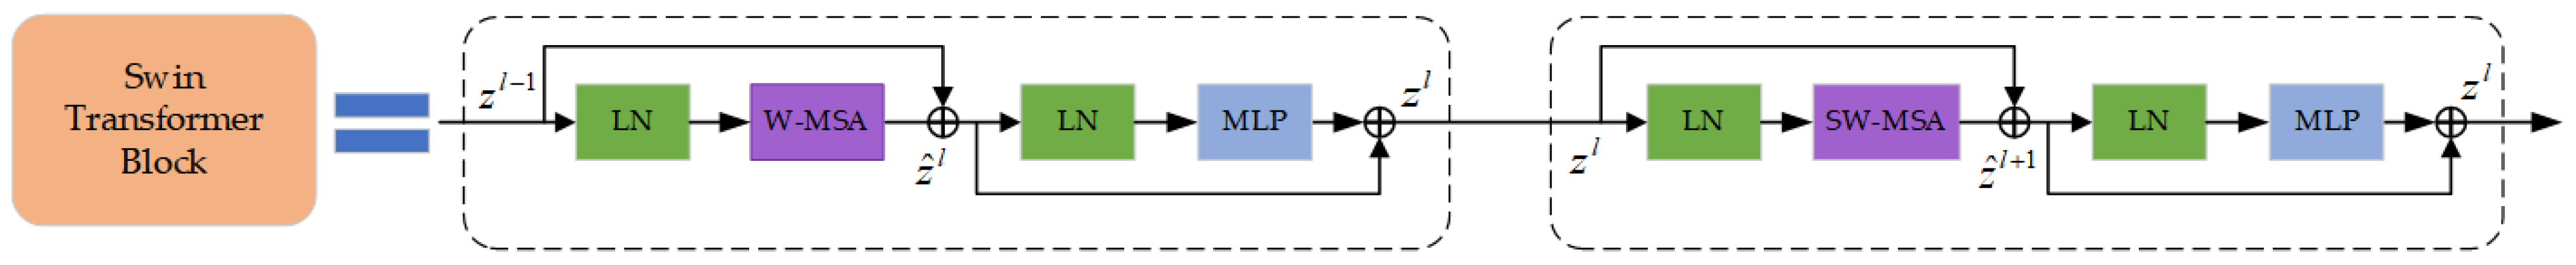
The Swin-Transformer network was utilized as the backbone feature extraction network, expanding the model’s receptive field and improving its feature extraction ability.
(2)
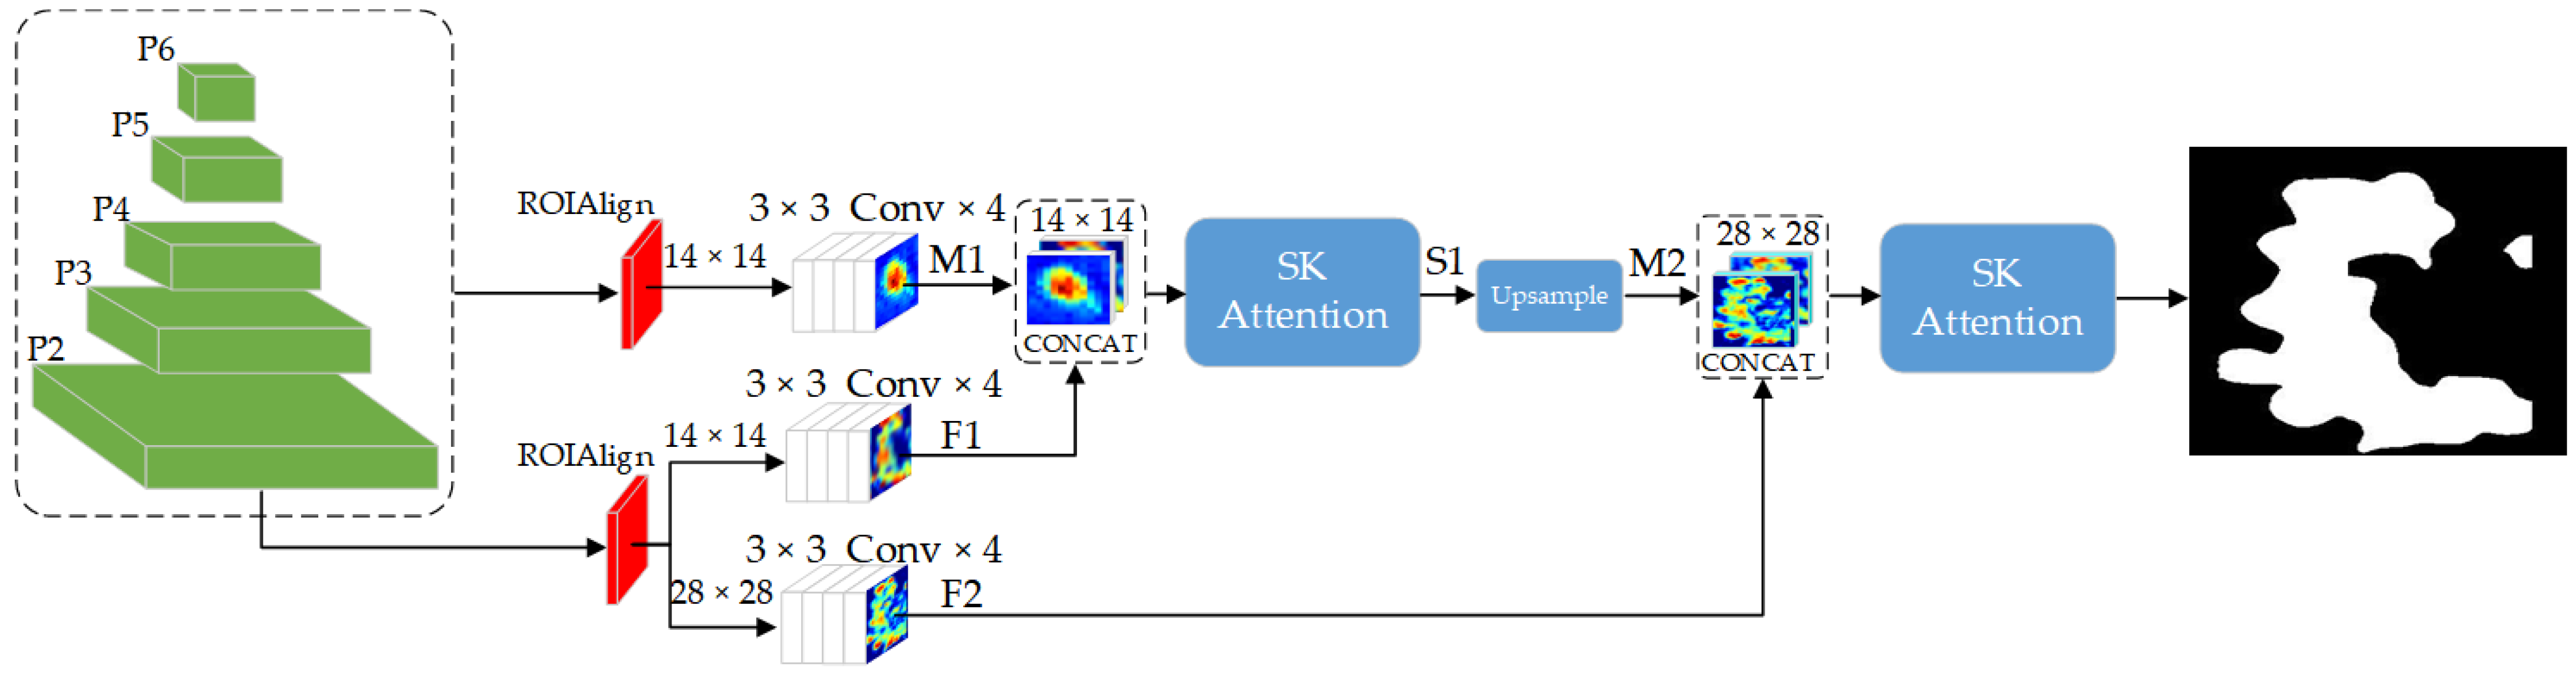
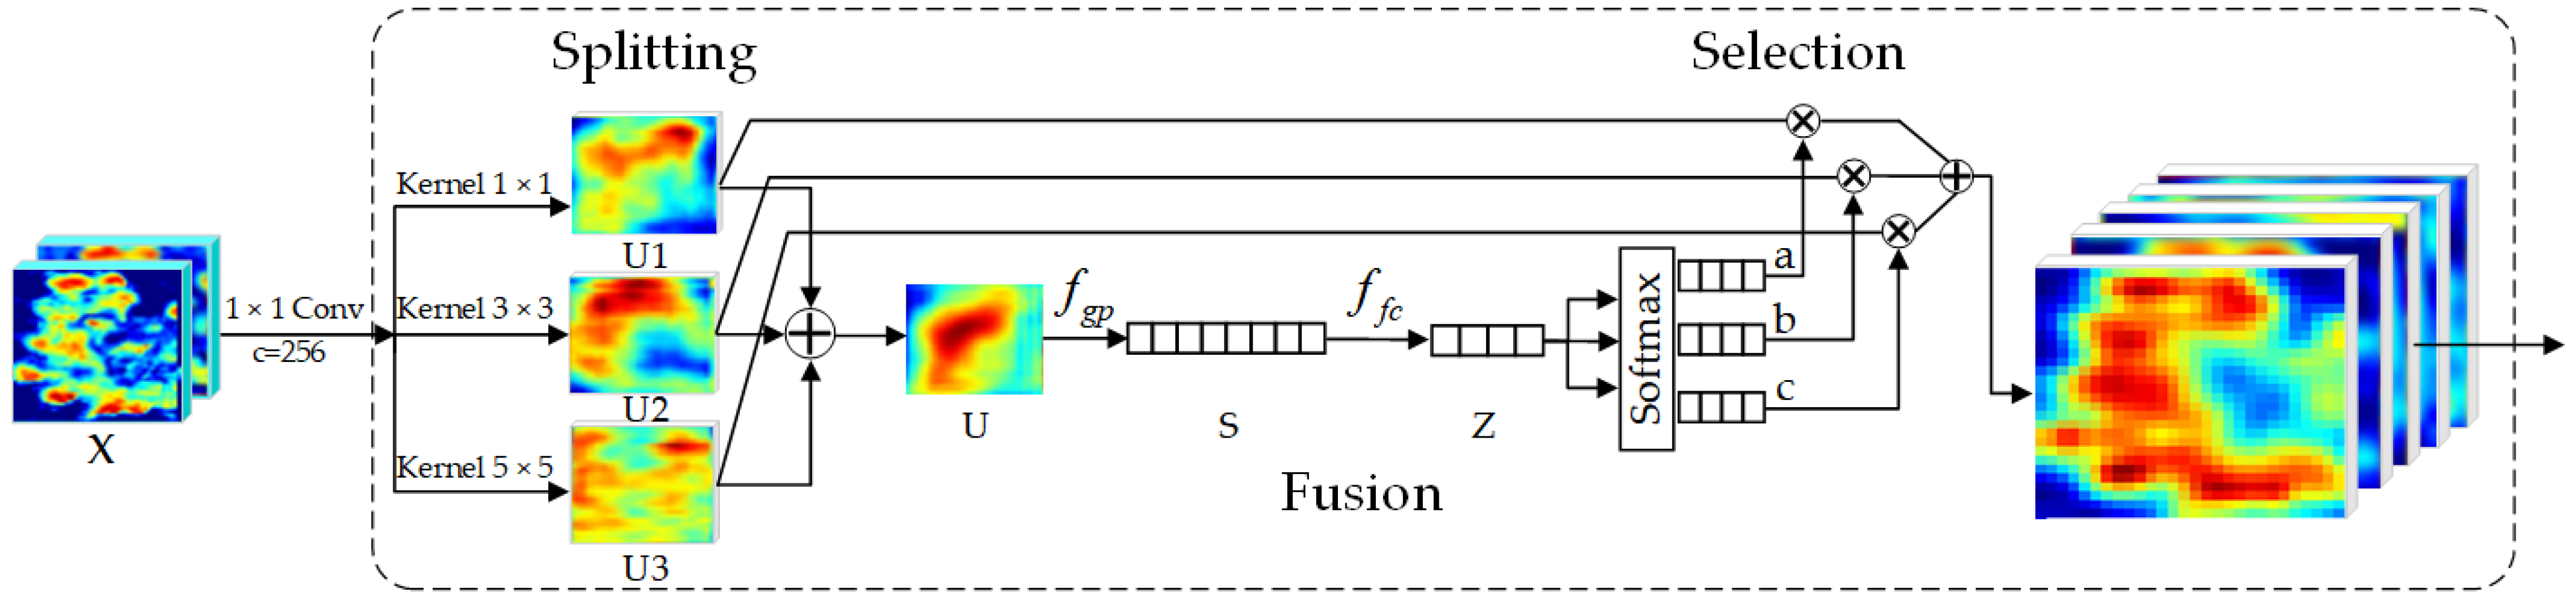
The SK attention mechanism was utilized to fuse detailed information from the low-level feature map of FPN into the mask branch to supplement image detail features and improve the segmentation accuracy.
(3)
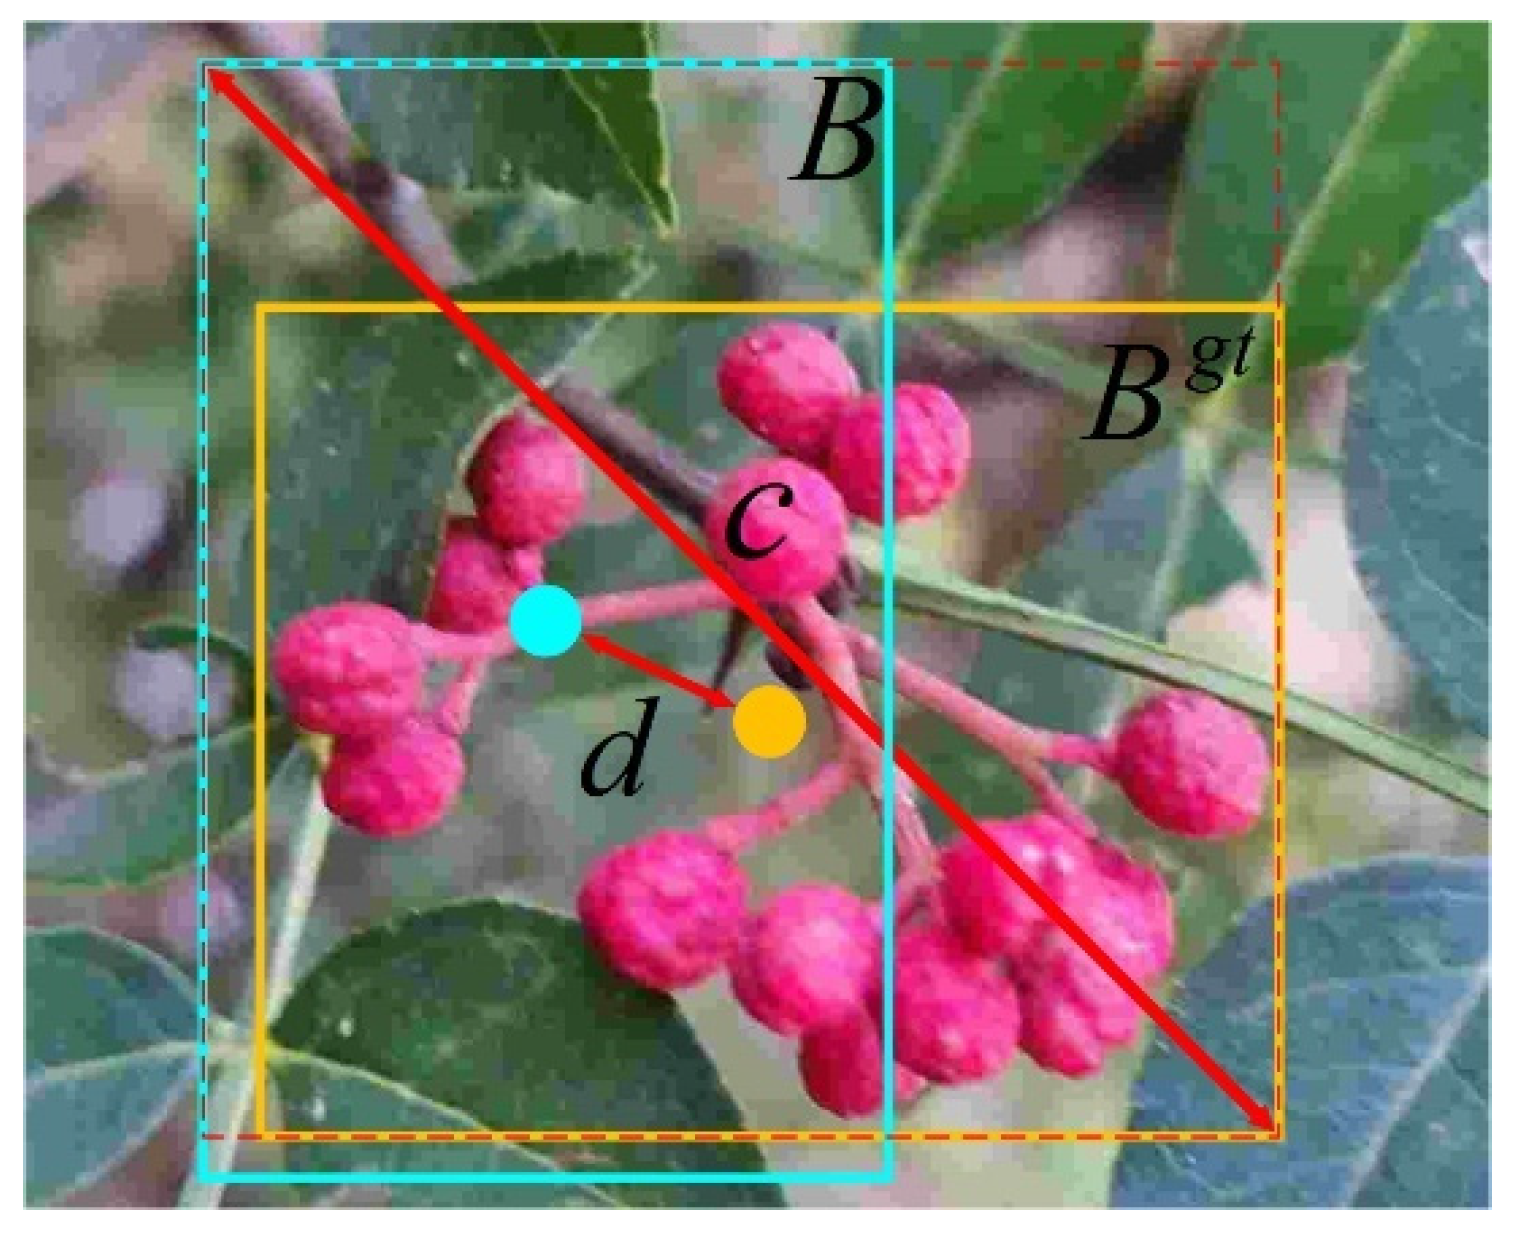
The DIOU loss function was applied to replace the original bounding box loss function SmoothL1, enhancing the model’s convergence speed and accuracy.
The paper is structured as follows: Section 2 presents materials and methods, including the description of the Zanthoxylum bungeanum dataset and the improved Mask R-CNN model; Section 3 evaluates the performance of the model, and discusses the results; Section 4 presents the conclusions.

2. Materials and Methods

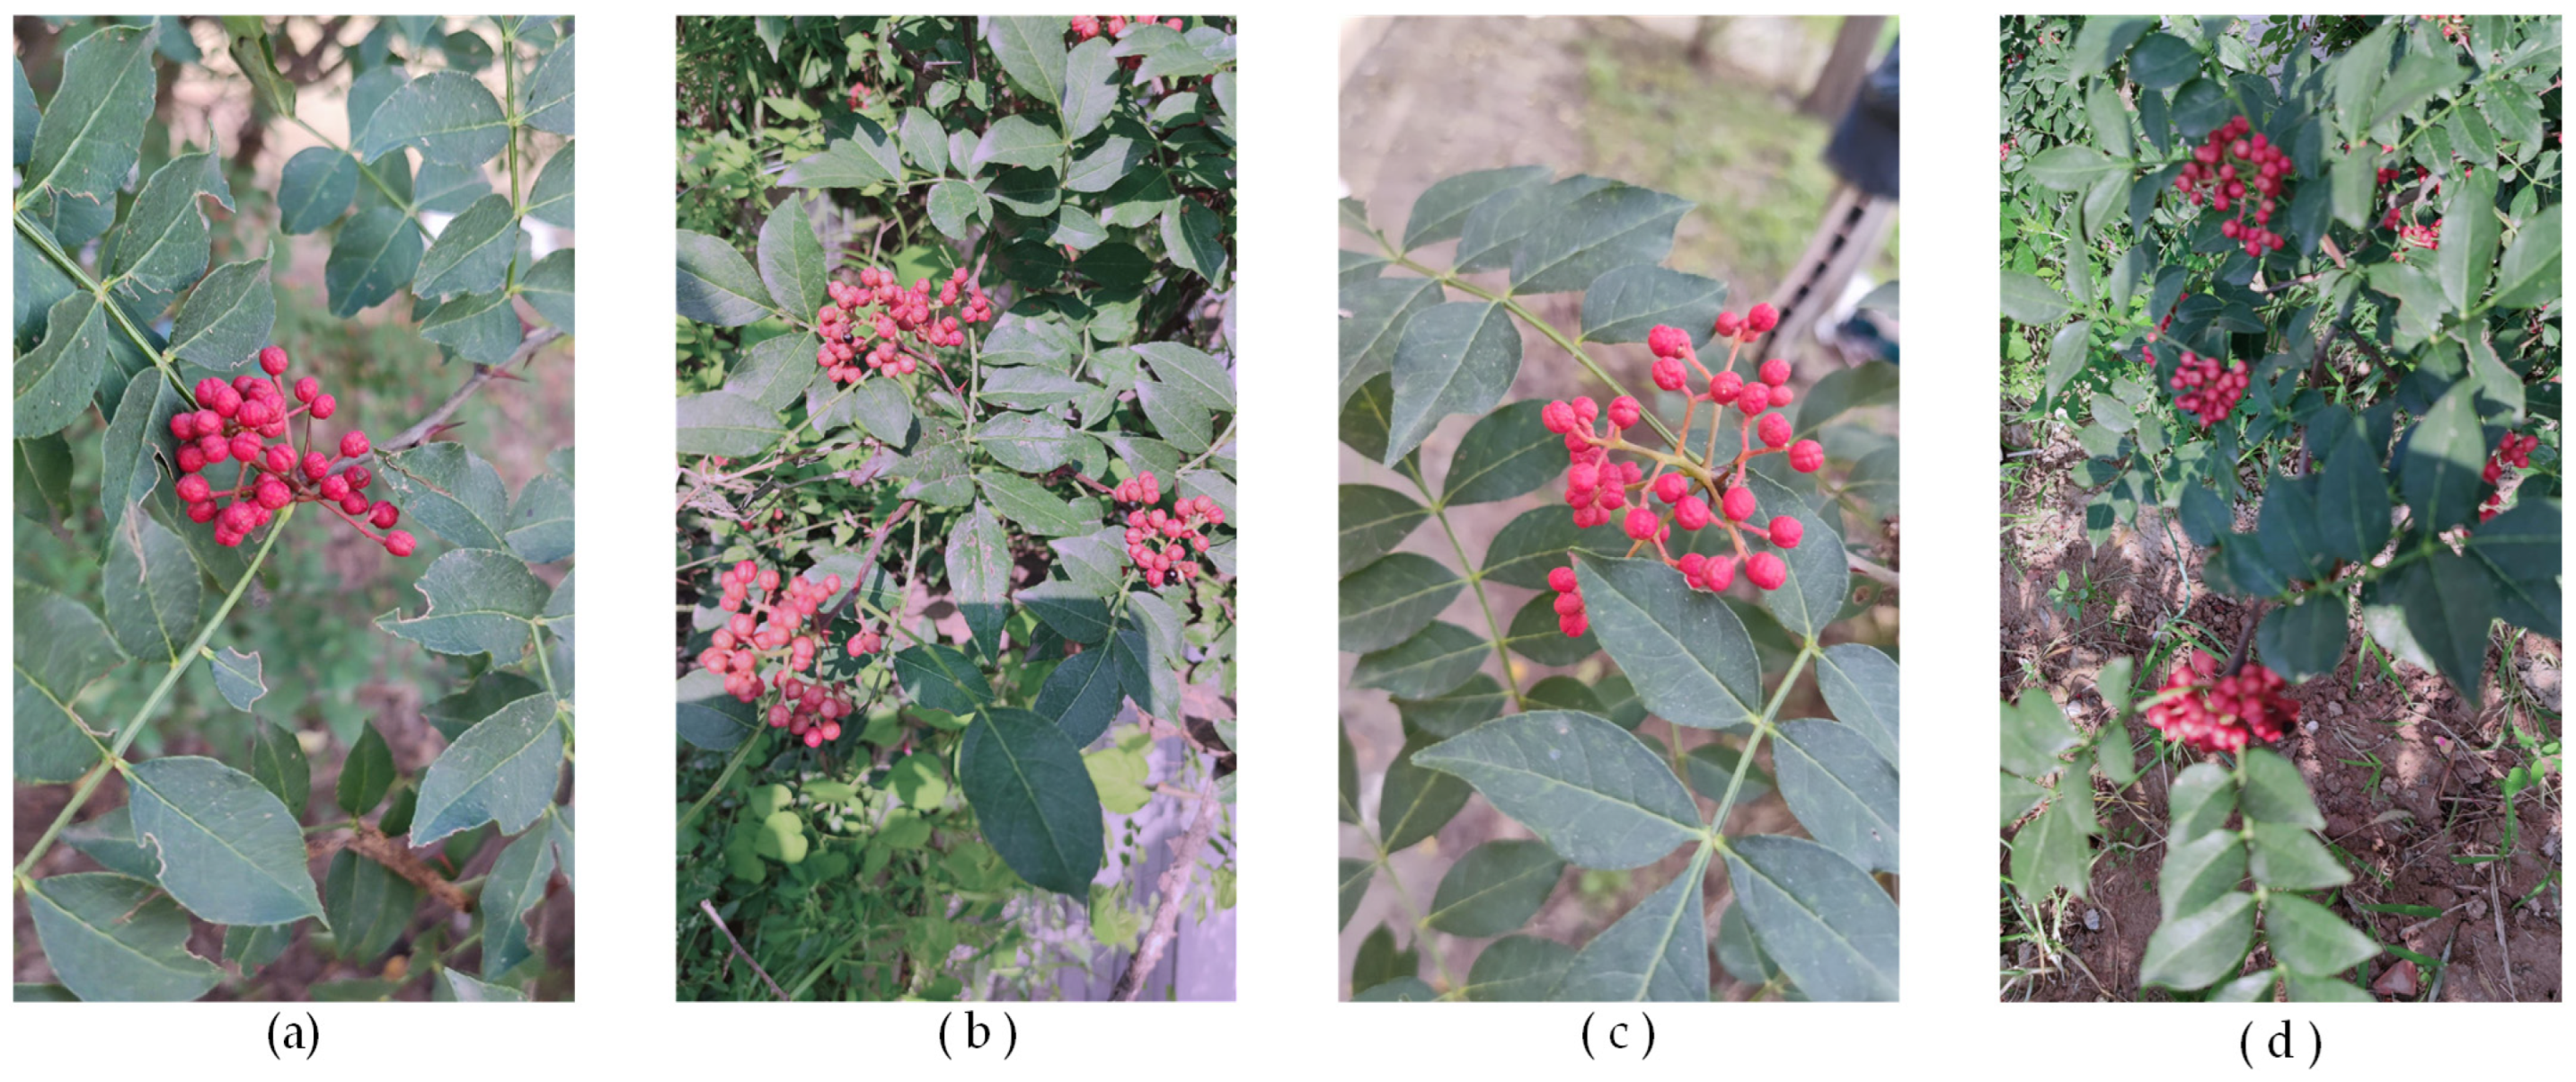
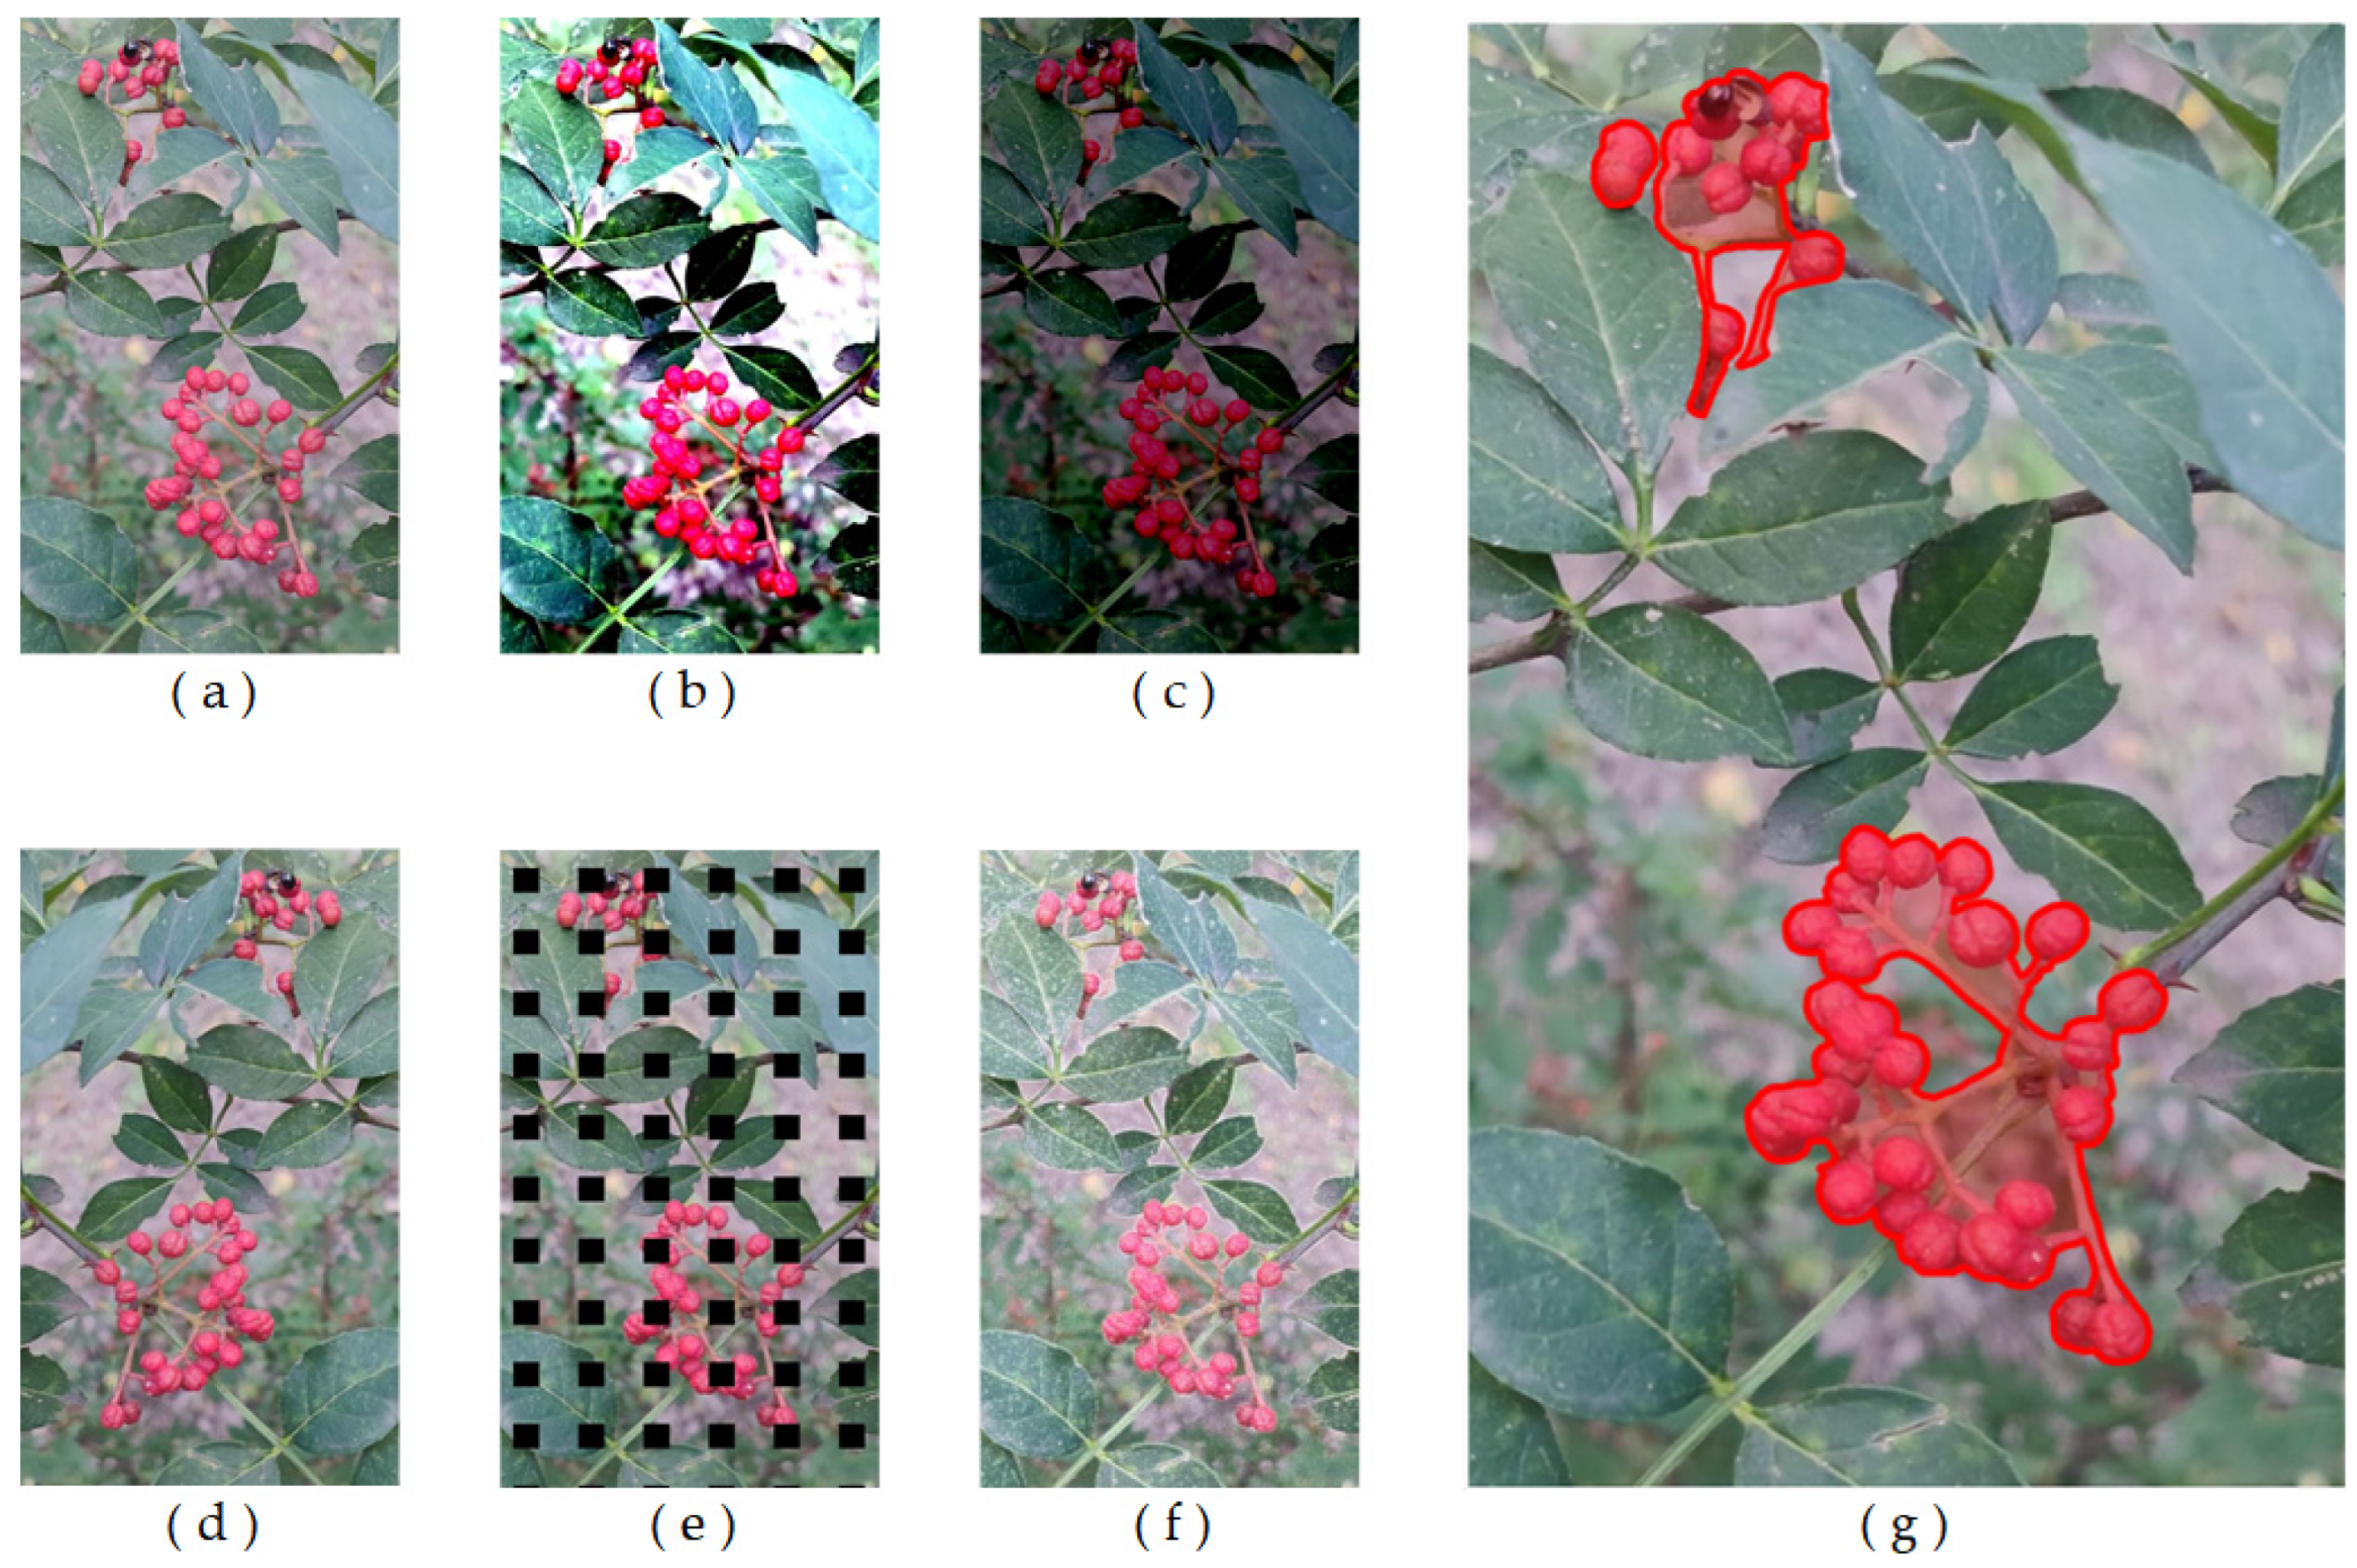
2.1. Image Acquisition and Augmentation

The Zanthoxylum bungeanum cluster images used in this study were collected in Taigu District, Jinzhong City, Shanxi Province, China. The Zanthoxylum bungeanum image acquisition was conducted using a Xiaomi K30 mobile phone with a resolution of 2304 × 4096 pixels, and the images were saved in JPEG format. From 3 to 6 September 2023, during two different periods each day (9:00–12:00 and 15:00–17:00), a total of 800 Zanthoxylum bungeanum images were collected under natural planting conditions, varying in distance and occlusion levels. The backgrounds in these images encompassed tree branches, leaves, ground grass, etc. The original images were resized to a reduced resolution of 1152 × 2048 pixels to alleviate the computational burden. Figure 1 shows examples of the collected Zanthoxylum bungeanum images.
To enhance the diversity of image features and improve the robustness of the model, the original images were augmented using methods such as random contrast adjustment, random brightness adjustment, flipping, gridmask, and sharpness processing. Of these methods, the random contrast adjustment and random brightness adjustment were used to simulate different lighting conditions in natural environments; flipping was used to simulate changes in the shooting angle of the device; and GridMask was employed to simulate possible occlusion situations. A total of 1200 augmented images were obtained, which included: 300 images with random brightness adjustment, 300 images with random contrast adjustment, 200 flipping images, 200 GridMask images, and 200 sharpness images. Combining these augmented images with the original 800 images, a total of 2000 image datasets were obtained. Subsequently, the images were divided into a training set and a validation set at a ratio of 4:1; the training set contained 1600 images (600 original images and 1000 augmented images), and the validation set contained 400 images (200 original images and 200 augmented images) [27,28]. Then, the images were annotated using LabelStudio software 1.7.3 and converted into the COCO dataset format for network training. The annotation polygon boxes were drawn to fit the contours of the Zanthoxylum bungeanum clusters as closely as possible. Figure 2 shows examples of image augmentation and annotation.

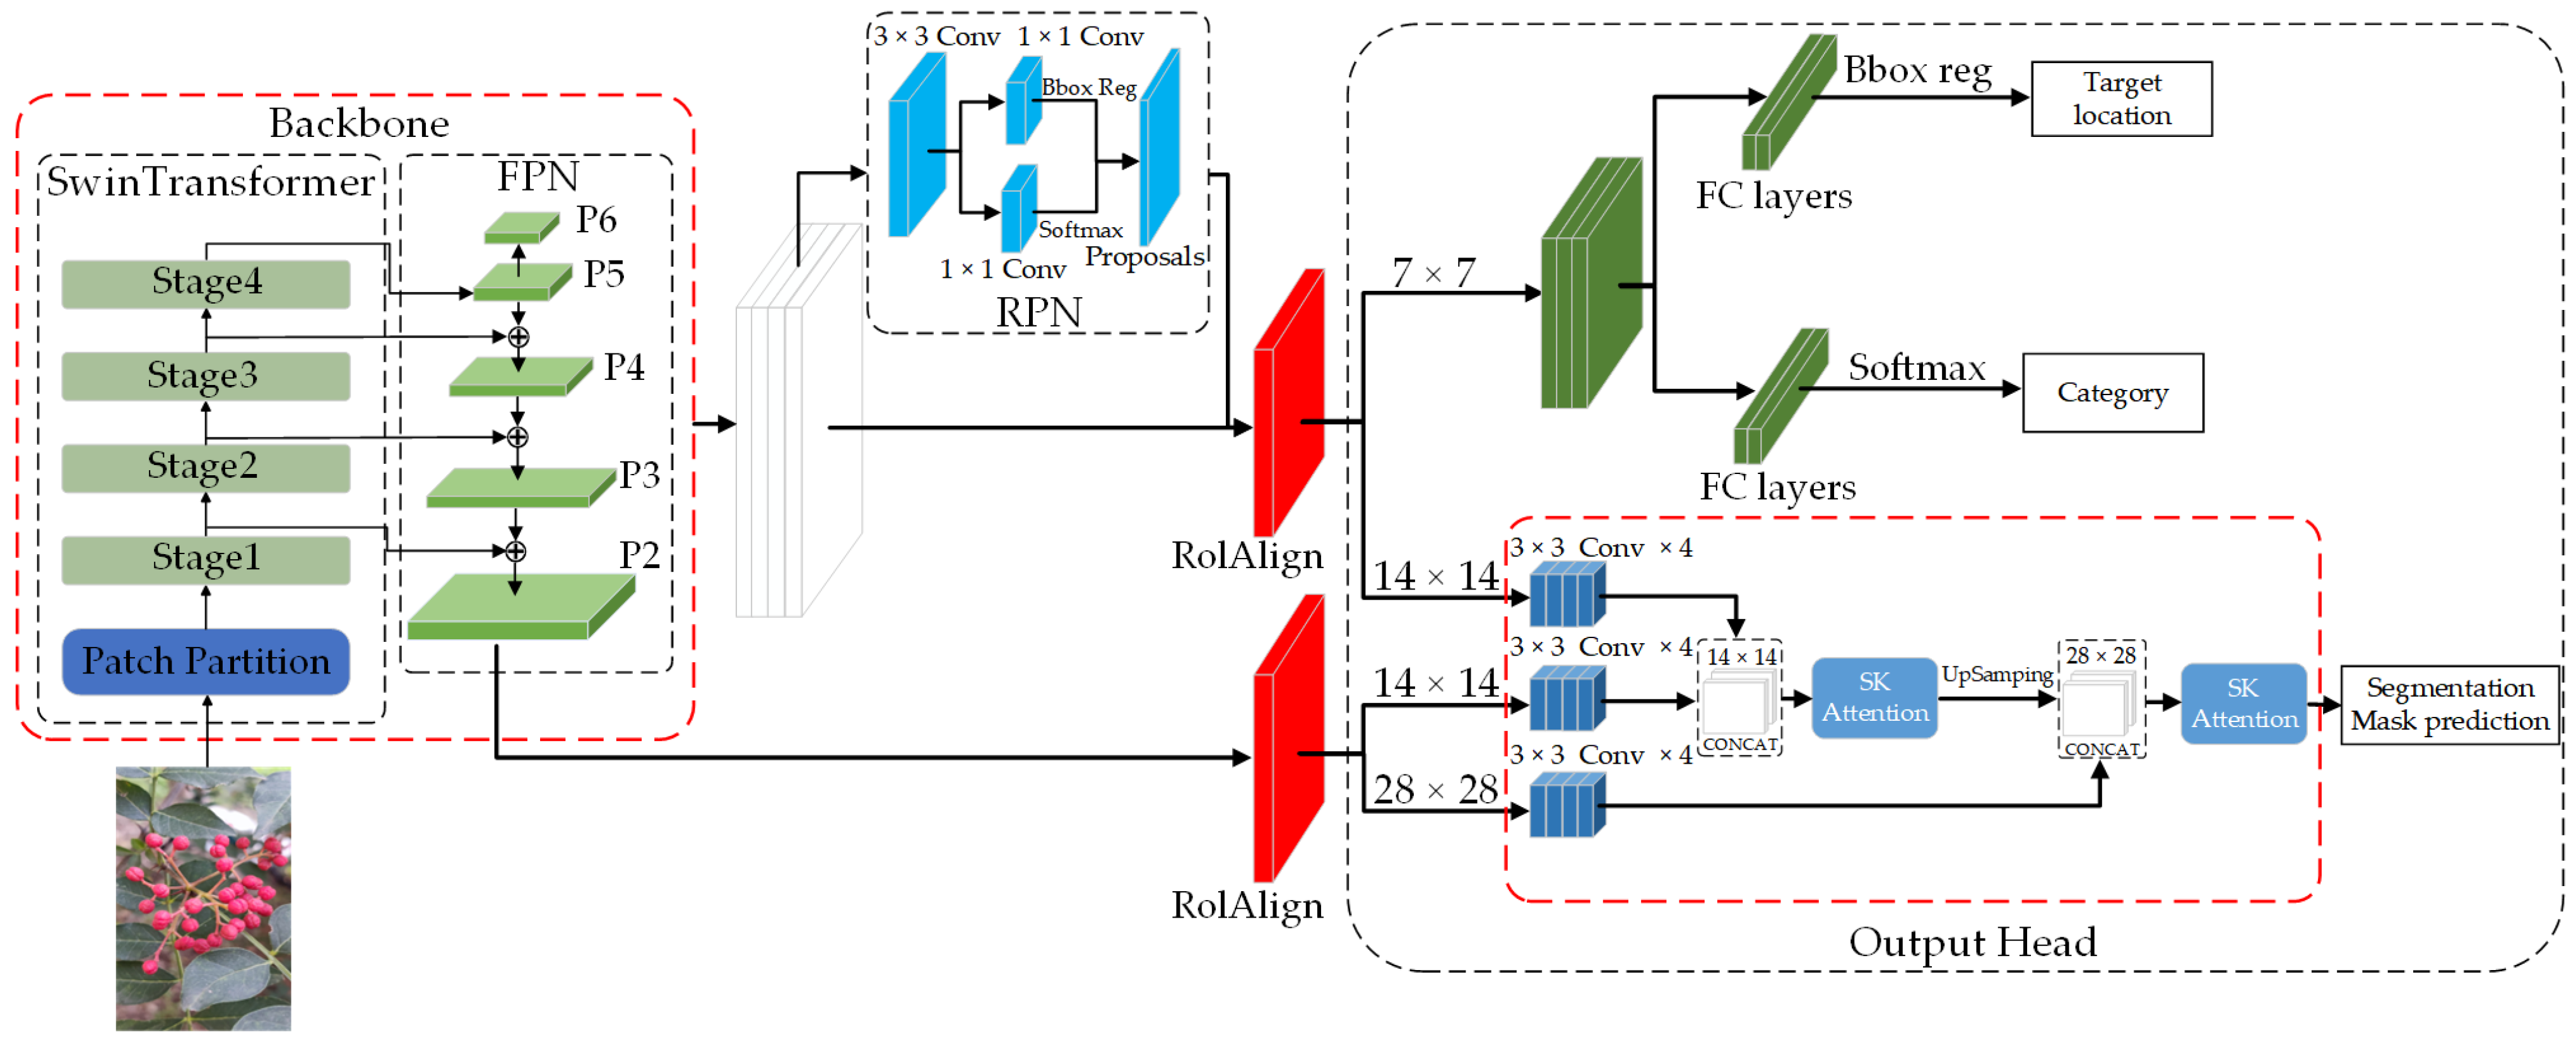
2.2. Overview of the Baseline Mask R-CNN Model

Mask R-CNN was employed as the baseline model for the segmentation of Zanthoxylum bungeanum clusters. The model comprises four key components: backbone, region proposal network (RPN), region of interest align network (RoIAlign), and output head. The fundamental network architecture is depicted in Figure 3. The workflow of Mask R-CNN primarily encompasses the following steps:
(1)
The backbone first employs the feature extraction network of ResNet50 to extract feature maps C1–C5 of different scales. Then, the feature pyramid network (FPN) performs feature fusion on these feature maps, generating fused feature maps P2–P6. P2, the low-level feature map of FPN, has the highest resolution and contains rich detailed information. However, the high-level feature maps with lower resolutions mainly contain semantic information.
(2)
The feature maps are input into the RPN, where anchor boxes are generated to extract regions that may contain target information, generating proposal boxes of varying sizes.
(3)
ROIAlign adjusts the proposal boxes of various sizes generated by the RPN to uniform sizes (7 × 7, 14 × 14).
(4)
The feature maps of uniform size are input into the output head, comprising two branches: an object detection branch and a mask segmentation branch. The object detection branch employs Fully Connected (FC) layers to detect and localize the objects, while the mask segmentation branch applies the Fully Convolutional Network (FCN) to segment the targeted objects.

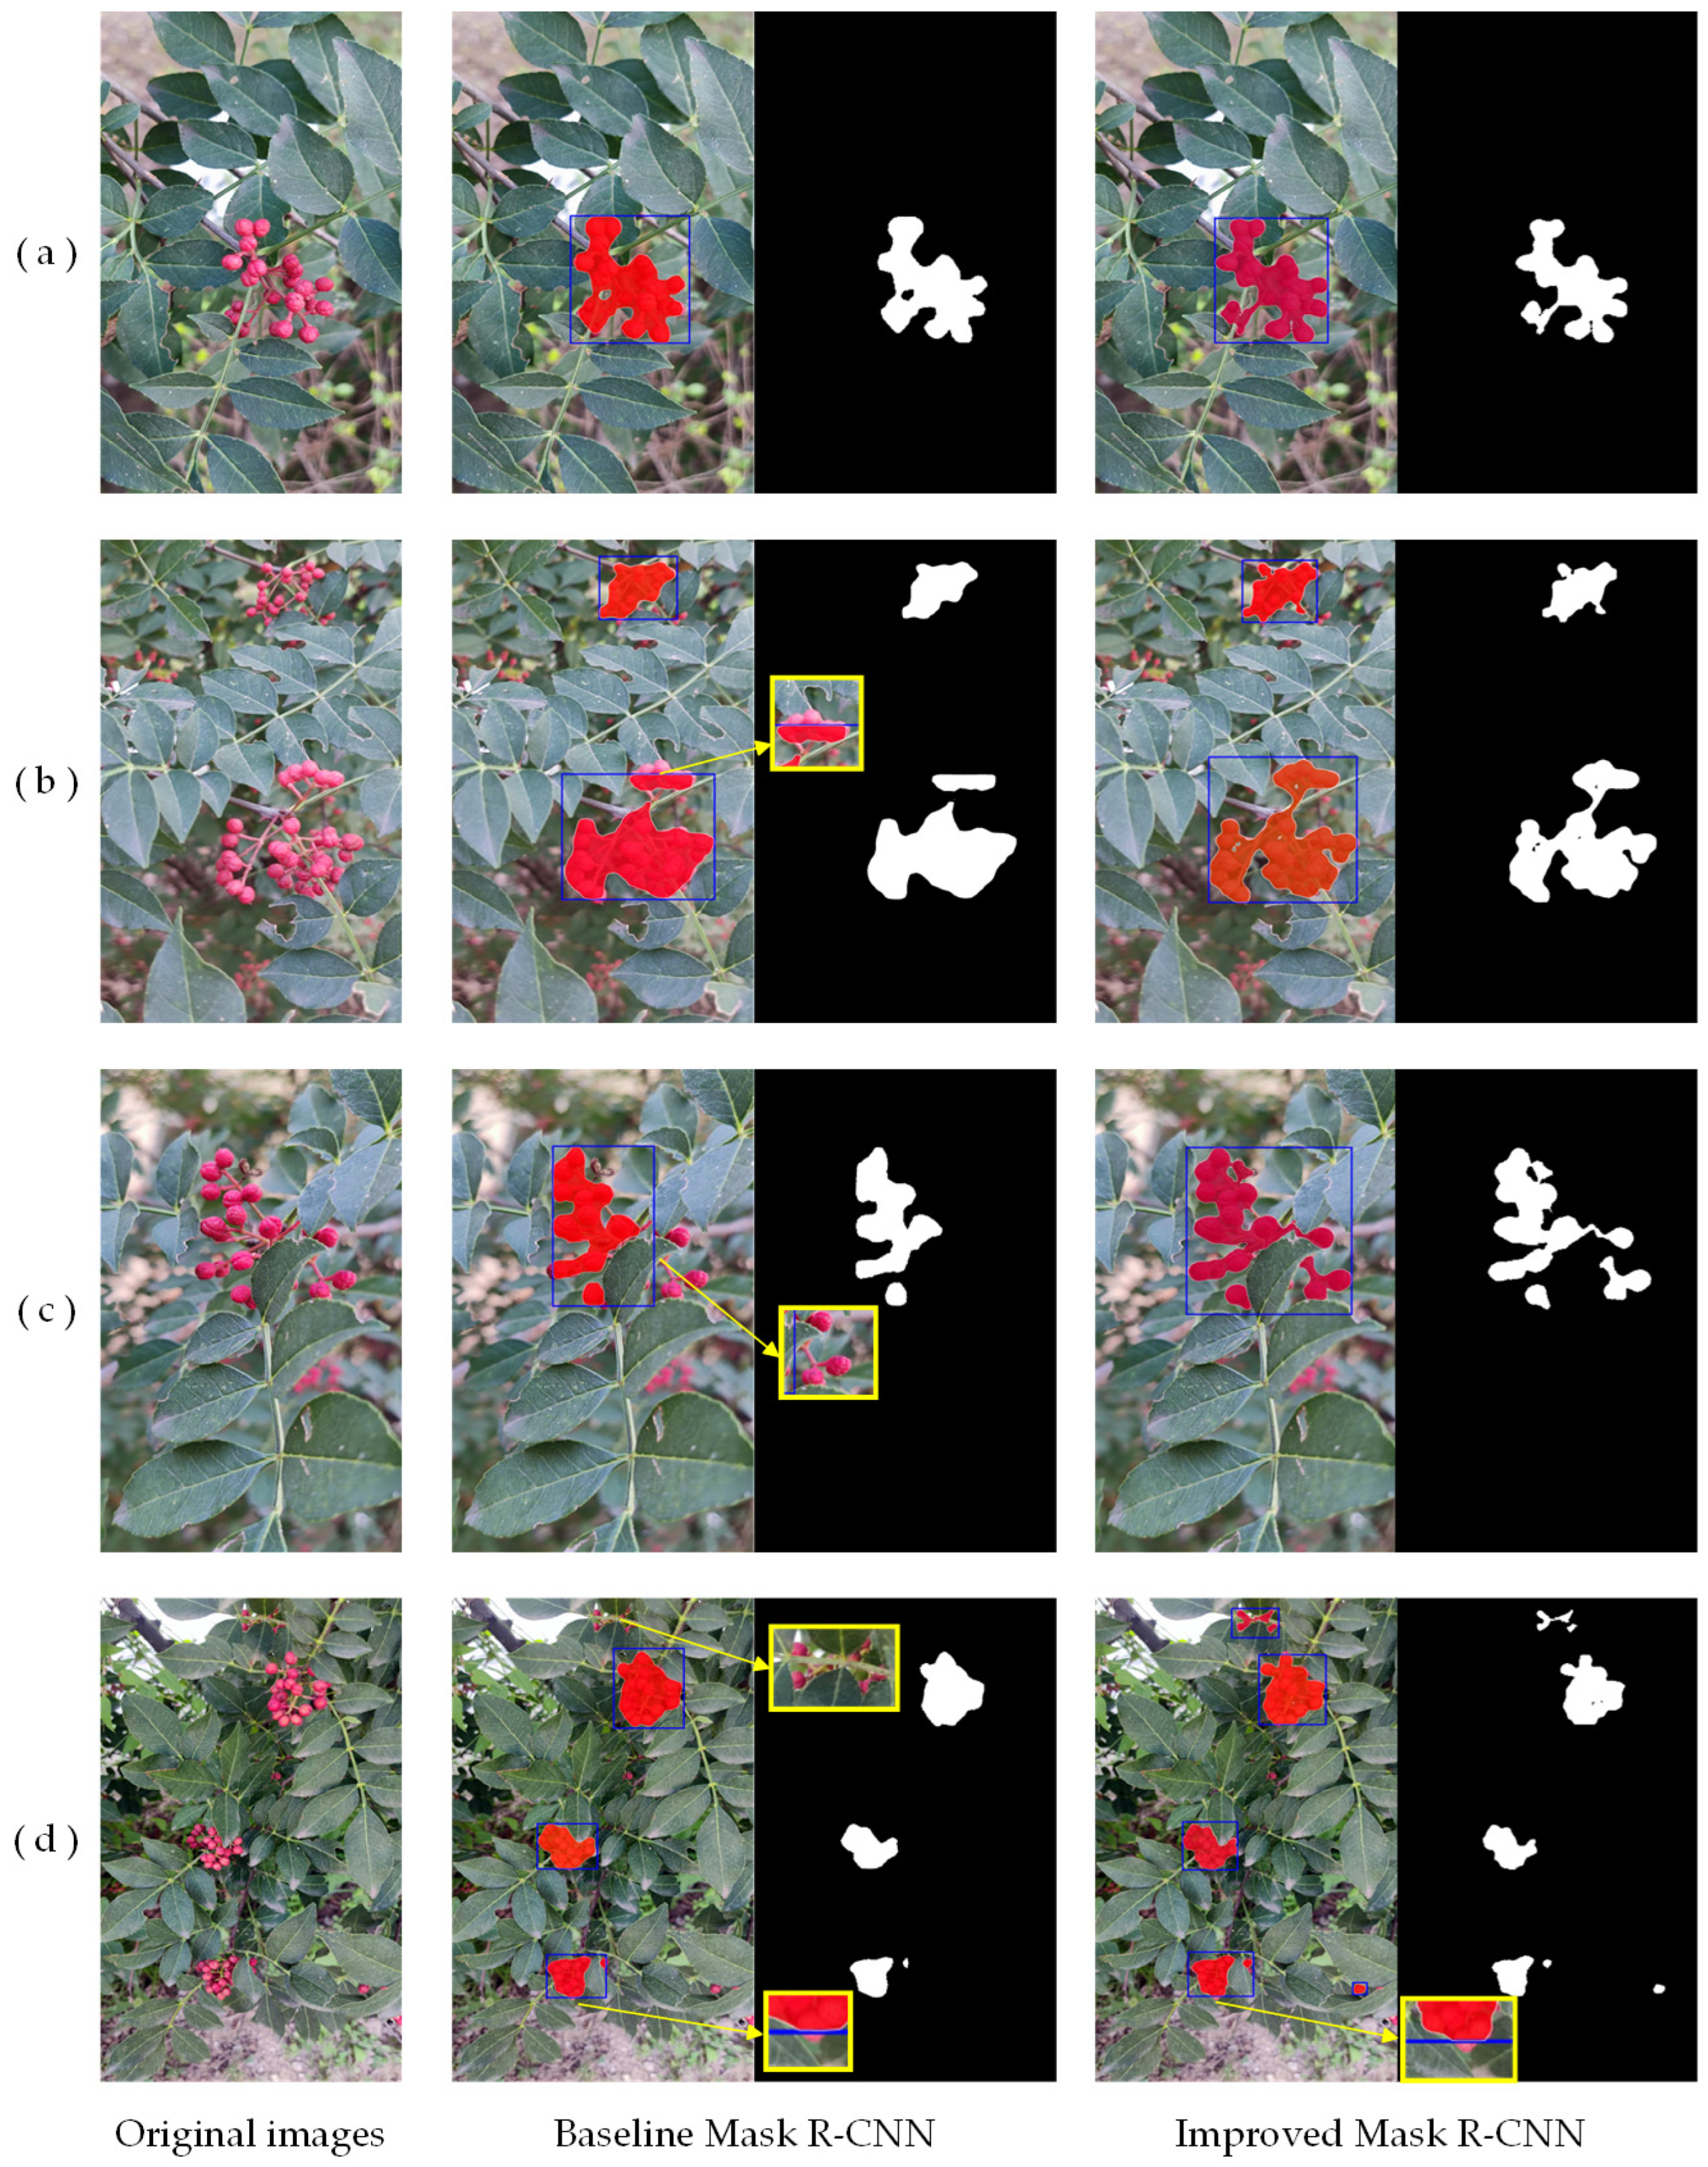
2.3. Improved Mask R-CNN Model

The improved Mask R-CNN model framework is shown in Figure 4. Based on the baseline Mask R-CNN, the model introduced the Swin-Transformer as the backbone feature extraction network, utilized the SK attention mechanism to fuse the detailed information into the mask branch from the low-level feature map P2 of FPN, and applied the DIOU loss function to replace the original bounding box loss function SmoothL1.

2.3.1. Swin-Transformer Feature Extraction Network

Traditional convolutional neural networks (CNN) focus on local features of images with limited receptive fields. The Swin-Transformer network, based on the multi-head self-attention mechanism, can capture global features of images and effectively extract global contextual information, demonstrating better feature extraction capabilities [29]. Consequently, the Swin-Transformer network was introduced into the Mask R-CNN backbone network, replacing the original feature extraction network ResNet50, to enhance the network’s feature extraction capacity, thus improving the model’s detection and segmentation performance for Zanthoxylum bungeanum clusters.
Figure 5 depicts the fundamental architecture of the Swin-Transformer network. Firstly, the patch partition layer divides each 4 × 4 adjacent pixel group into one patch and flattens it into a token along the channel direction. Then, feature maps of different sizes are constructed through four stages. In stage 1, the tokens are linearly transformed through the linear embedding layer and then input into the Swin-Transformer block to capture global contextual information. From stage 2 to stage 4, feature maps from stage 1 were downsampled using patch merging and then input into the Swin-Transformer block modules. The Swin-Transformer block primarily comprises a window-based multi-head self-attention (W-MSA) module and a sliding window multi-head self-attention (SW-MSA) module, as illustrated in Figure 6. The multi-scale feature maps extracted by the Swin-Transformer are then input into the FPN network for fusion.

2.3.2. Mask Branch Improvement

In the Mask R-CNN baseline model, multiple pooling and downsampling operations can significantly reduce the spatial resolution of the feature maps, leading to the loss of image detail information and, thus, adversely affecting the model’s segmentation performance. In this paper, we proposed an improvement to the Mask R-CNN’s mask branch. By utilizing the SK attention mechanism, detailed information was fused from the low-level feature map, P2 of FPN, into the mask branch. Feature map P2 contains rich detailed information within the FPN [30]. The improvement process is shown in Figure 7. After undergoing the ROIAlign operation, feature maps of sizes 14 × 14 and 28 × 28 are extracted from P2. They are then processed, respectively, through four layers of 3 × 3 convolutional kernels to extract features of the Zanthoxylum bungeanum clusters, generating feature maps F1 and F2. Subsequently, F1 is combined with the original mask branch’s feature map M1 via a CONCAT operation and then input into the SK attention module for fusion, yielding feature map S1. After being upsampled, S1 generates feature map M2. M2 is then concatenated with F2 and fed into the SK attention module.
The SK attention mechanism can adaptively select convolution kernels according to the characteristics of input information at different scales, thereby enhancing the network’s feature extraction capabilities [31]. The SK attention mechanism is divided into three basic parts: splitting, fusion, and selection, as shown in Figure 8.
Splitting: The input feature map X is processed by three convolutional kernels of varying sizes of 1 × 1, 3 × 3, and 5 × 5, generating feature maps U1, U2, and U3 that possess distinct receptive fields of varying scales.
Fusion: The corresponding elements of feature maps U1, U2, and U3 are summed together, resulting in a fused feature map U. This feature map U then undergoes global average pooling to obtain a feature vector S. Vector S is then processed through a fully connected layer and dimensionality reduction to yield the feature vector Z.
Selection: Feature vector Z generates weight matrices a, b, and c via the softmax operation. Matrices a, b, and c are then employed to perform weighted fusion on the respective branches’ feature maps U1, U2, and U3, resulting in the final feature map.

2.3.3. Loss Function

The baseline Mask R-CNN model utilizes SmoothL1 as its bounding box regression loss function, but this loss function does not consider the influence of the overlap ratio and center point offset between the predicted and ground truth bounding boxes, thereby hindering the accuracy of the bounding box regression. The DIOU loss function comprehensively considers the relationship between the overlapping area and center distance of the predicted and ground truth bounding boxes [32], enabling a more precise selection of target boxes while also accelerating the network’s convergence speed. Therefore, the DIOU loss function was adopted to replace the original bounding box loss function, SmoothL1. The DIOU loss function can be formulated in the following equations:
L DIOU = 1 I O U + d 2 c 2
I O U = B B g t B B g t
where Bgt denotes the ground truth bounding box, B represents the predicted bounding box, IOU stands for the intersection over the union between the predicted bounding box B and the ground truth bounding box Bgt, d refers to the distance between the central coordinates of B and Bgt, and c is the diagonal distance of the smallest enclosing rectangle that encompasses both B and Bgt, as illustrated in Figure 9.

2.4. Experimental Setup

The experiments were conducted on a workstation equipped with the Windows 10 operating system, NVIDIA RTX A6000 GPU (with 48 GB of graphics memory), and an Intel(R) Xeon(R) CPU W-2295 processor (with 256 GB of RAM). The software environment utilized the open-source deep learning framework MMCV 2.0.0, based on Pytorch 2.0.0 and Python 3.8. To enhance the network convergence speed and reduce model training costs, the transfer learning strategy was implemented: First, pre-trained weights from the ImageNet-1K dataset were utilized for transfer learning to initialize the network parameters. Then, the parameters of the Swin-Transformer and other network structures were fine-tuned on our self-built dataset for model training. AdamW was adopted as the optimizer. The momentum factor was set to 0.9, the weight decay factor was 0.05, the batch size was 8, the total number of training epochs (Epoch) was 150, the initial learning rate was 0.0001, and the learning rate warm-up strategy was employed to dynamically adjust the learning rate and ensure the stability of model training.

2.5. Model Evaluation

The mean Average Precision (mAP) was applied to evaluate the performance of model detection and segmentation. Generally, a higher mAP value indicates better model performance. The mAP 50 box represents the detection mAP when the IoU threshold is set to 0.5, evaluating the detection precision of the model. The mAP 50 mask represents the segmentation mAP when the IOU threshold is set to 0.5, evaluating the segmentation precision of the model [33].

3. Results and Discussion

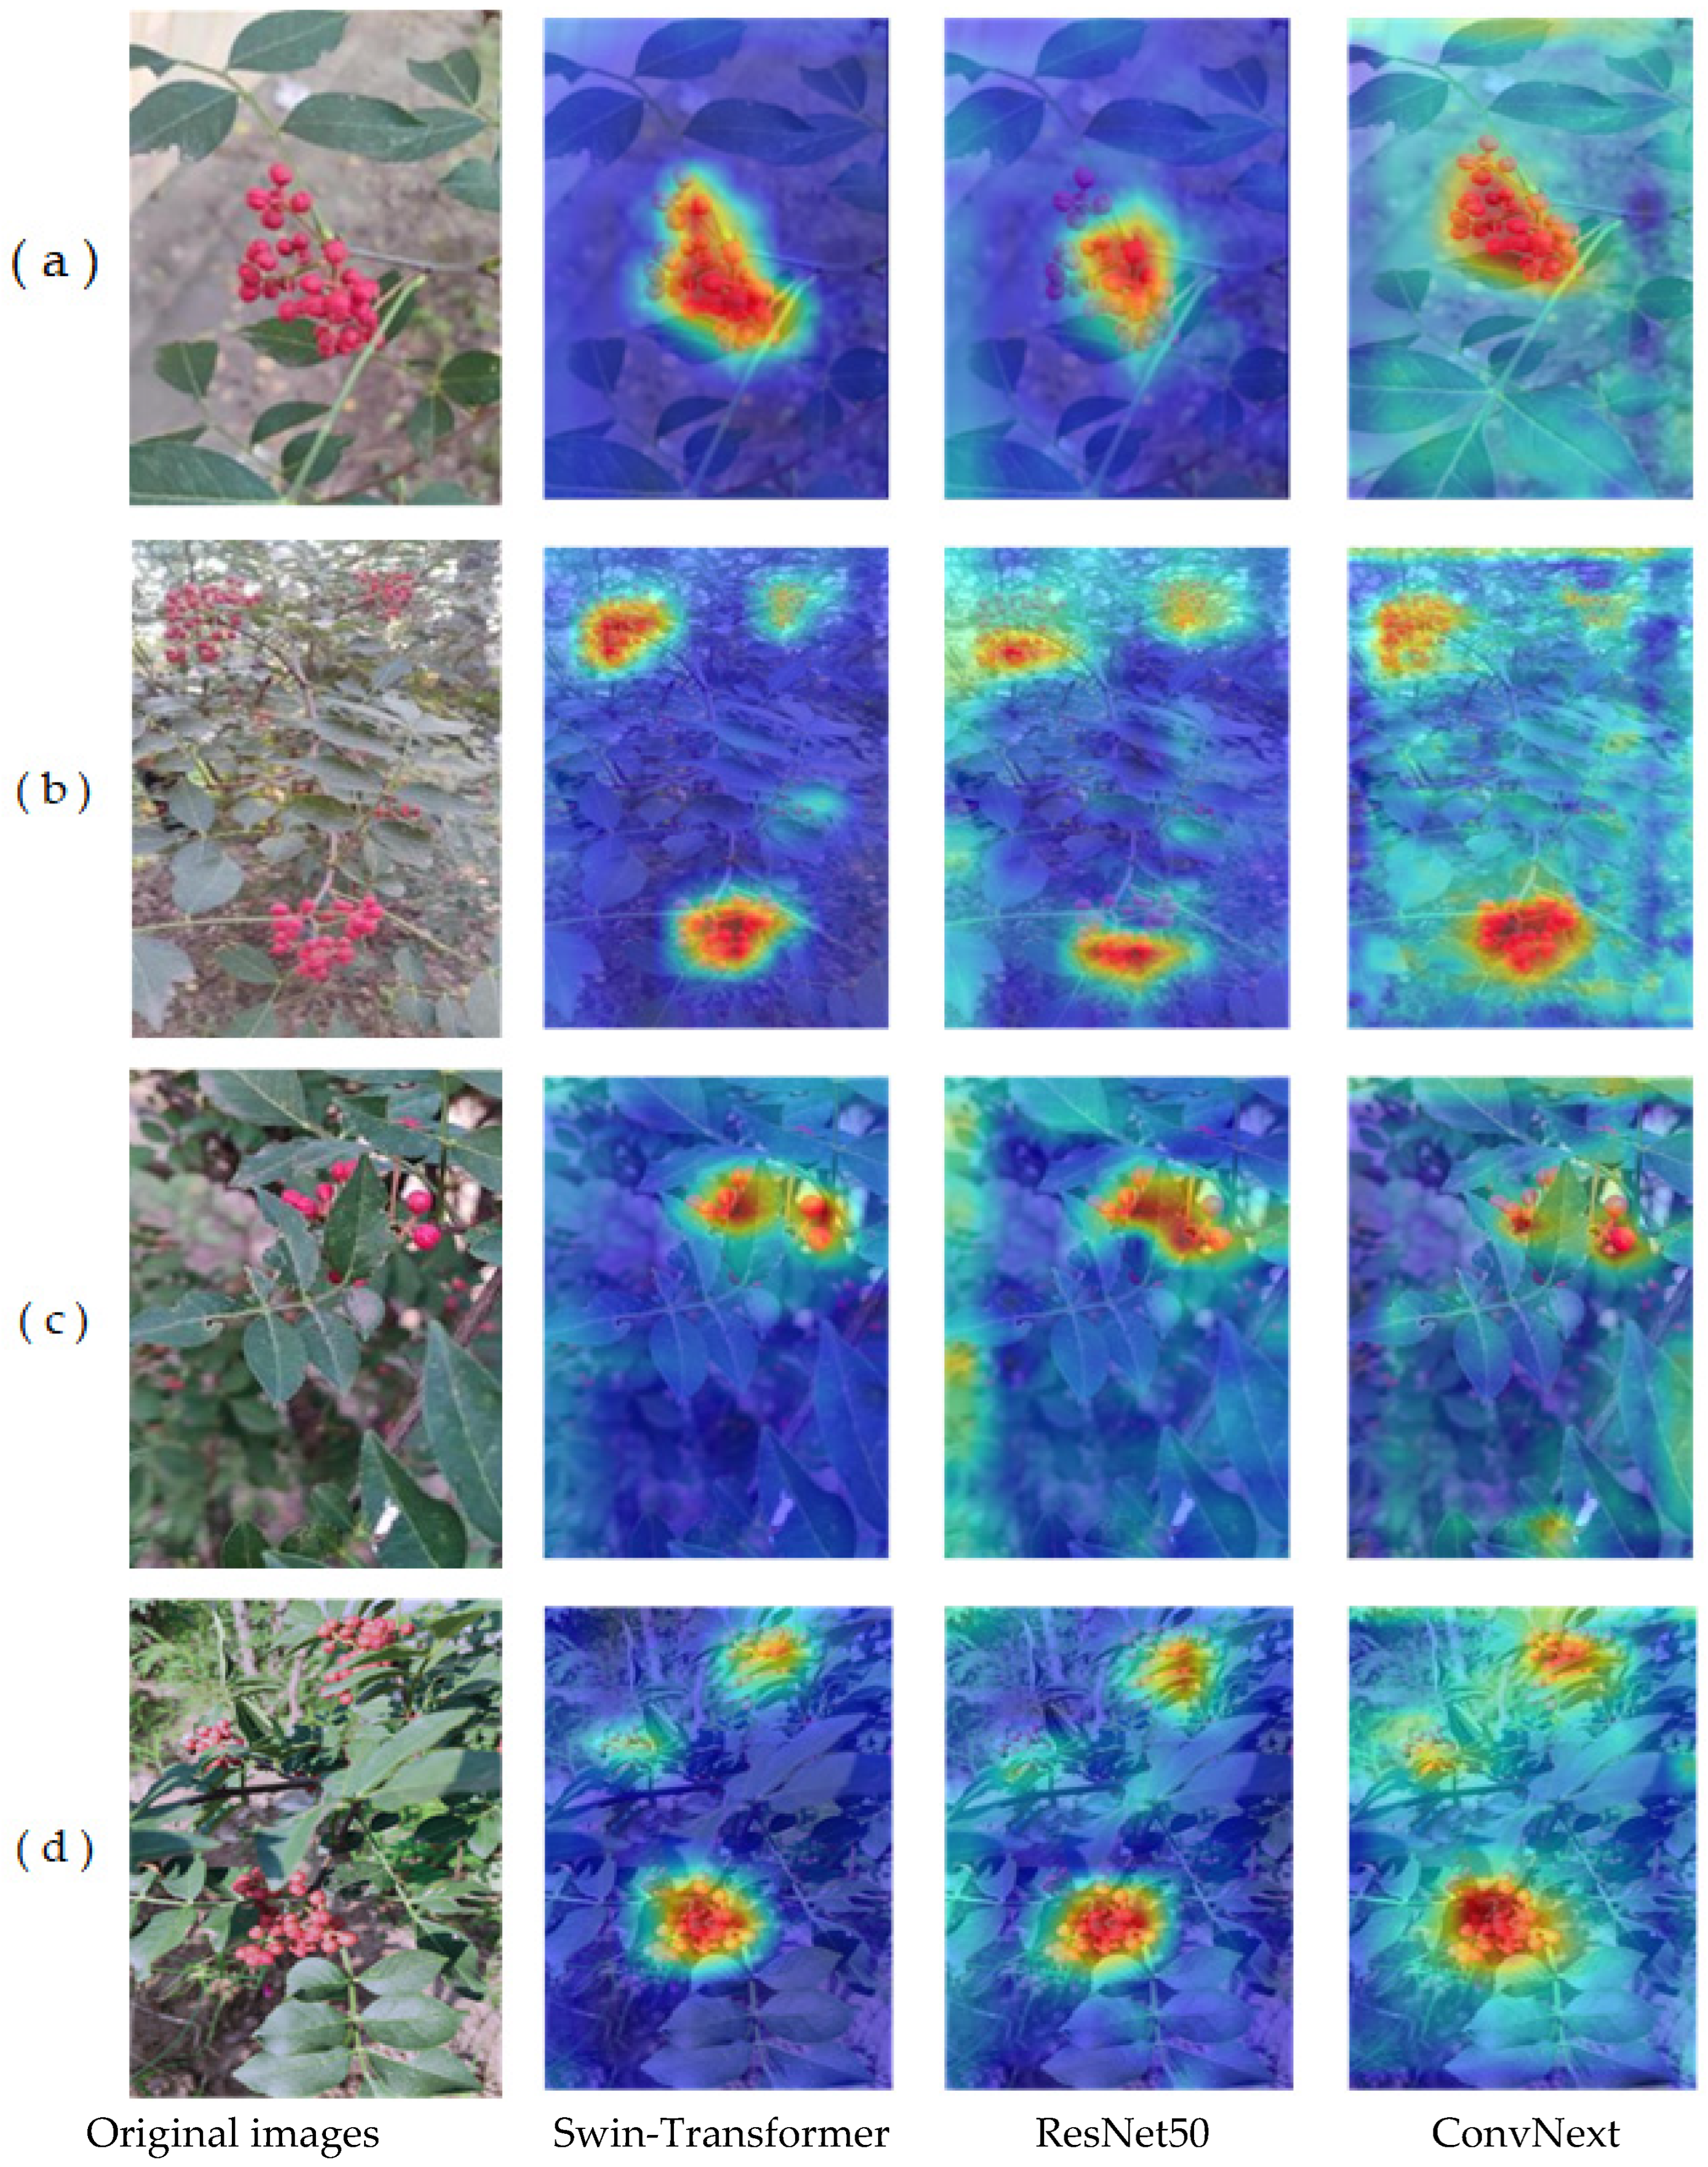
3.1. The Effect of Different Backbone Feature Extraction Networks

The baseline Mask R-CNN utilized ResNet50 as its backbone feature extraction network. To compare the impact of different feature extraction networks on model performance, experiments were conducted using various feature extraction networks, including ResNet50, ConvNext, and Swin-Transformer. Model training and validation were conducted while maintaining all other parameters constant. As shown in Table 1, the detection mAP 50 box and segmentation mAP 50 mask of the model using Swin-Transformer as the feature extraction network were 82.6% and 75.2%, respectively, representing an increase of 4.4% and 2.6% compared to ResNet50 and 1.3% and 1.4% higher than ConvNext.
To visually demonstrate the impact of different feature extraction networks on detecting Zanthoxylum bungeanum clusters, the feature maps extracted by the Swin-Transformer, ResNet50, and ConvNext feature extraction networks were visualized using Grad-CAM heat maps [34], as shown in Figure 9. In this figure, red signifies a high degree of focus by the feature extraction network on the corresponding region, while yellow indicates a secondary focus, and blue portions are considered redundant information. Figure 10 revealed that the red areas of the ResNet50 feature extraction network were overly concentrated, failing to completely cover the Zanthoxylum bungeanum cluster regions and exhibiting significant boundary errors. The red activation areas of the ConvNext feature extraction network were more dispersed, encompassing more background information. In contrast, the red areas of the Swin-Transformer feature extraction network almost completely cover the Zanthoxylum bungeanum cluster regions, demonstrating a high level of feature activation and focus. The results showed that the Swin-Transformer can effectively focus on each target, highlighting its superior feature extraction ability.

3.2. The Effect of Different Attention Mechanisms for Mask Branch Improvement

The multiple pooling and downsampling operations of Mask R-CNN can reduce the spatial resolution of the feature maps, which leads to the loss of image detail information and, consequently, affects the detection and segmentation accuracy of the model. This paper employed the SK attention mechanism to fuse the detail information from the low-level feature map P2 of FPN into the mask branch to compensate for the lost image detail information. To evaluate the impact of different attention mechanisms on model performance, experiments were conducted based on various attention mechanisms such as SK, CA, and CBAM attention mechanisms. As shown in Table 2, by improving the mask branch through the SK, CA, and CBAM attention modules, the model’s accuracy can be improved, with the SK attention module exhibiting the highest mAP 50 box and mAP 50 mask of 82.2% and 74.9%.

3.3. The Effect of Different Loss Functions

To evaluate the impact of various loss functions on model performance, the original SmoothL1 loss function, utilized for bounding box regression in the baseline Mask R-CNN, was replaced with several different loss functions, including SIOU, GIOU, CIOU, and DIOU. As shown in Figure 11, it revealed that the DIOU loss function converged more rapidly and achieved the lowest loss value. According to the comparative experiment results presented in Table 3, when utilizing the DIOU loss function, the model’s mAP 50 box and mAP 50 mask attained 81.4% and 73.0%, respectively, representing an enhancement of 3.2% and 0.4% compared to the baseline Mask R-CNN model.

3.4. Ablation Experiment

To verify the effectiveness of the improvement strategies proposed in this paper, ablation experiments were conducted, and the results are shown in Table 4. From group 2, employing the Swin-Transformer as the feature extraction network led to a 4.4% and 2.6% increase in mAP 50 box and mAP 50 mask over the baseline Mask R-CNN model, indicating better feature extraction capabilities for the Swin-Transformer. In group 3, improving the mask branch by the detail information fusion resulted in a 4% and 2.3% improvement in mAP 50 box and mAP 50 mask over the baseline model, indicating that detail information fusion can enhance the model’s accuracy. In group 4, by employing the DIOU loss function instead of the original bounding box regression loss, there was a 3.2% and 0.4% increase in mAP 50 box and mAP 50 mask . Finally, group 5 demonstrated that the improved Mask R-CNN model outperformed the baseline model, achieving a 5.8% and 4.6% increase in the mAP 50 box and mAP 50 mask . Although the introduction of the Swin-Transformer network and the fusion of detail information have led to an increase in the number of parameters and image processing time, the model’s precision achieved significant improvement over the baseline Mask R-CNN. These results validate the effectiveness of our proposed model improvements.
Figure 12 shows the detection and segmentation examples of the baseline Mask R-CNN model and the improved Mask R-CNN model on the Zanthoxylum bungeanum clusters. The baseline model was unable to fully segment the Zanthoxylum bungeanum clusters’ shapes, missing some Zanthoxylum bungeanum particles, as highlighted by the yellow boxes. The edges between the particles and the surrounding background were not distinctly segmented, leading to adhesion. However, the improved Mask R-CNN model outperformed the baseline model, providing more complete segmentation regions that aligned with the Zanthoxylum bungeanum clusters’ actual features. This model reduced miss-segmentation, alleviated adhesion, and achieved sharper segmentation edges.

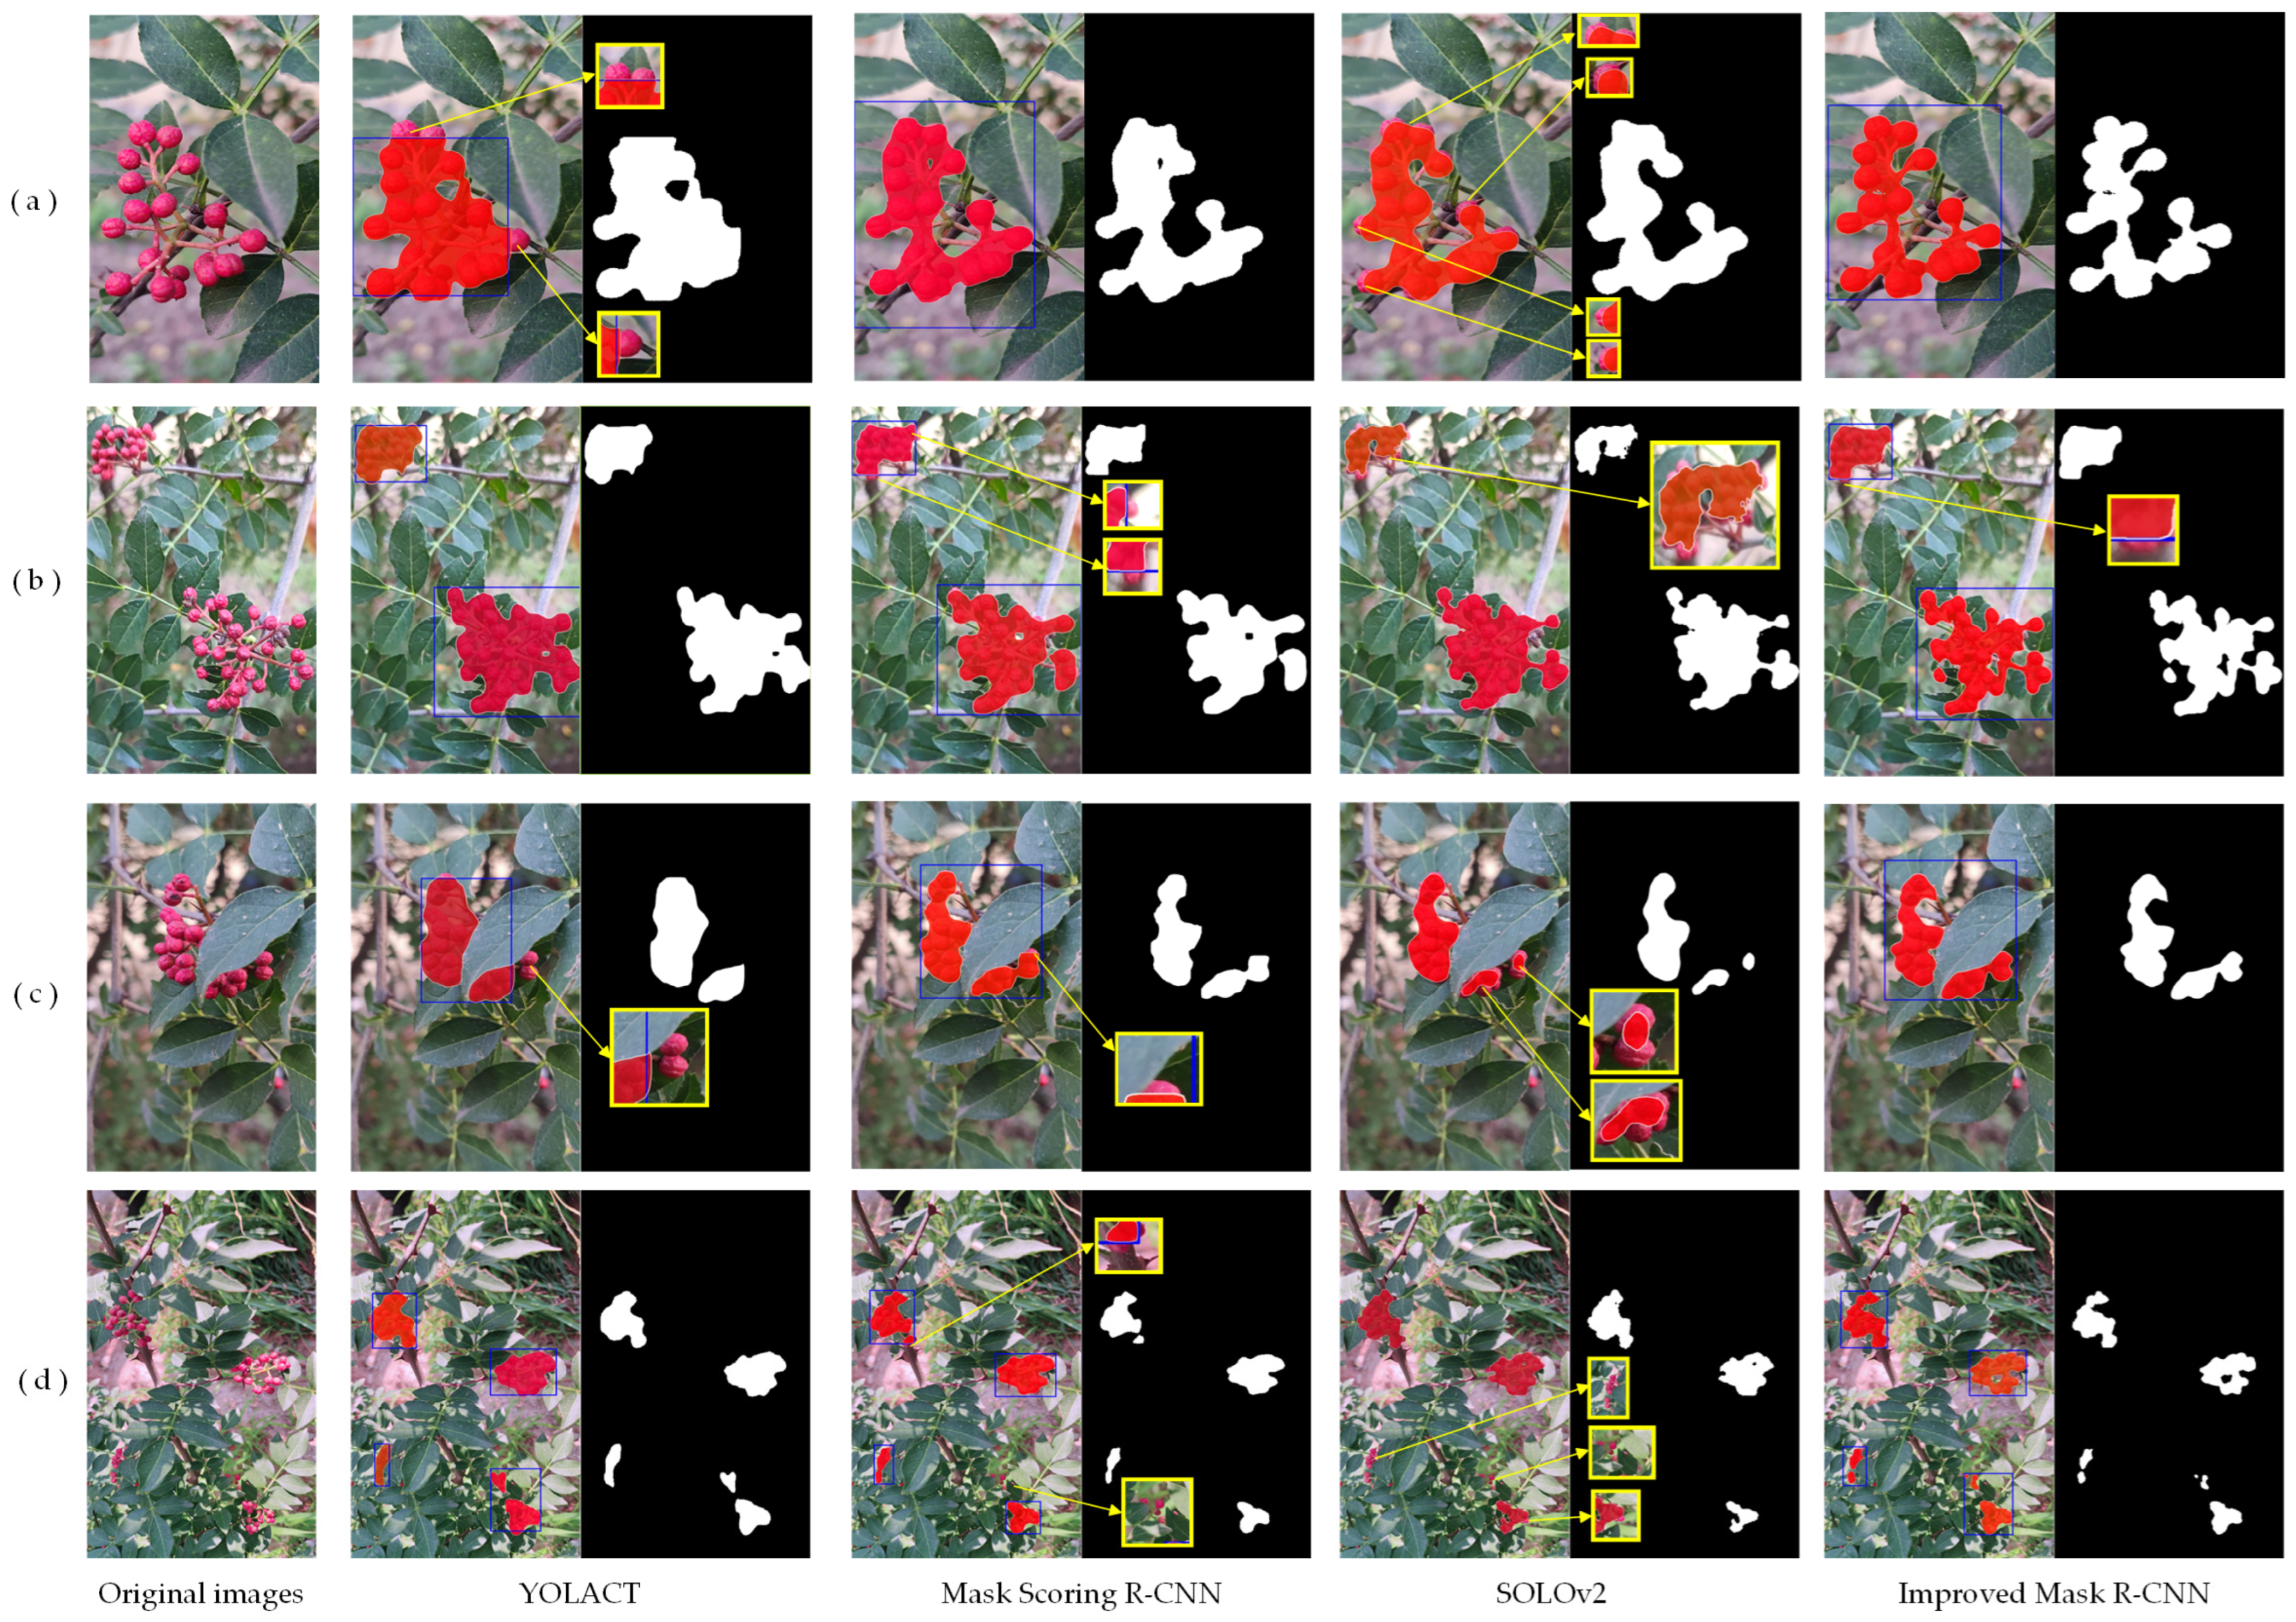
3.5. Comparison Experiments of Different Models

Comparison experiments were conducted between the improved Mask R-CNN model and several typical instance segmentation models including YOLACT, MaskScoringRcnn, and SOLOv2. The results are presented in Table 5. The improved Mask R-CNN achieved a higher mAP 50 box and mAP 50 mask . Compared to YOLACT and MaskScoringRcnn, the mAP 50 box increased by 3% and 1.3%, respectively. The mAP 50 mask increased by 5.9%, 3.7%, and 8.8% compared to YOLACT, MaskScoringRcnn, and SOLOv2, respectively. Despite their small number of parameters and short image processing time, the single-stage segmentation models YOLACT and SOLOv2 suffer from low precision, making them unsuitable for accurately detecting and segmenting Zanthoxylum bungeanum clusters. On the other hand, the two-stage segmentation model Mask Scoring R-CNN also performs less accurately than the improved Mask R-CNN and has a larger number of parameters. Therefore, the improved Mask R-CNN exhibits better overall performance.
The detection and segmentation examples of Zanthoxylum bungeanum clusters by various models are presented in Figure 13. All the models demonstrate the ability to segment the Zanthoxylum bungeanum clusters. However, the YOLACT, Mask Scoring R-CNN, and SOLOv2 models exhibited varying degrees of miss-segmentation, as highlighted in the yellow boxes. The segmented contours of the Zanthoxylum bungeanum clusters were not fine enough, resulting in noticeable adhesions between the Zanthoxylum bungeanum particles and the surrounding background. In contrast, the improved Mask R-CNN model achieves almost complete segmentation of the Zanthoxylum bungeanum clusters, with more finely segmented contours, significantly reducing the miss-segmentation and adhesion. Therefore, the model proposed in this paper is more suitable for the detection and segmentation of Zanthoxylum bungeanum clusters.

4. Conclusions

An improved Mask R-CNN model was proposed for the accurate detection and segmentation of Zanthoxylum bungeanum clusters in natural planting environments. The model introduced Swin-Transformer as the feature extraction network in the backbone. Swin-Transformer can effectively extract global features of images, enhancing the feature extraction capability of the backbone network. Additionally, by utilizing the SK attention mechanism, the detailed information of the FPN low-level feature map was fused into the mask branch to supplement the image detail information, improving the detection and segmentation accuracy. Furthermore, the DIOU loss function was adopted to replace the original bounding box loss function SmoothL1, enhancing the convergence speed and model accuracy. Experimental results demonstrated that the improved Mask R-CNN model performed well in the detection and segmentation of Zanthoxylum bungeanum clusters in natural environments. Compared to the baseline Mask R-CNN, YOLACT, Mask Scoring R-CNN, and SOLOv2 model, the improved Mask R-CNN model exhibited superior detection and segmentation precision, with the detection mAP 50 box and segmentation mAP 50 mask reaching 84.0% and 77.2%, respectively. The improved Mask R-CNN model has achieved a significant increase in precision. However, this enhancement has also led to an increase in the model’s parameters and image processing time. Consequently, further work will involve lightweight modifications to the model, aimed at reducing its complexity while maintaining precision. Additionally, we will further enrich the dataset with more complex backgrounds under different conditions, to improve the model’s generalization abilities and potentially expand its application to other fruits, like grape clusters, cherry clusters, apples, and so on.

Author Contributions

Conceptualization, methodology, writing—original draft, writing—review, and editing, Z.Z.; data curation, S.W.; data curation, C.W.; data curation, L.W.; investigation, Y.Z.; investigation, H.S.; funding acquisition, Z.Z. All authors have read and agreed to the published version of the manuscript.

Funding

This research was funded by the Key Research and Development Program of Shanxi Province, China, grant number 201803D221027-4, and the Key Research and Development Program of Shanxi Province, China, grant number 202102020101012.

Institutional Review Board Statement

Not applicable.

Data Availability Statement

Available upon request from the corresponding author. The data are not publicly available due to copyright implications.

Acknowledgments

The authors would like to appreciate the technical editor and anonymous reviewers for their constructive comments and suggestions on this study.

Conflicts of Interest

The authors declare no conflicts of interest.

References

  1. Ke, J.; Wang, Y.; Luo, T.; Yu, L.; Wang, X.; Ma, Y.; Lei, Z.; Zhang, Z. Study on the effect of different bitter masking inhibitors on the bitter masking of Zanthoxylum bungeanum Maxim. Int. J. Gastron. Food Sci. 2024, 35, 100894. [Google Scholar] [CrossRef]
  2. Liang, W.; Yang, H.; Lei, H.; Xiang, Z.; Duan, Y.; Xin, H.; Han, T.; Su, J. Phytochemistry and health functions of Zanthoxylum bungeanum Maxim and Zanthoxylum schinifolium Sieb. et zucc as pharma-foods: A systematic review. Trends Food Sci. Tech. 2024, 143, 104225. [Google Scholar] [CrossRef]
  3. Liu, A.; Wei, Q.; Cui, X.; Wang, Q.; Han, G.; Gao, S. Current situation and research progress on fruit picking of Zanthoxylum bungeanum Maxim. J. Chin. Agric. Mech. 2019, 40, 85–87. [Google Scholar]
  4. Matsui, T.; Sugimori, H.; Koseki, S.; Kento, K. Automated detection of internal fruit rot in hass avocado via deep learning-based semantic segmentation of X-ray images. Postharvest Biol. Tec. 2023, 203, 112390. [Google Scholar] [CrossRef]
  5. Wang, C.; Tang, Y.; Zou, X.; Weiming, S.; Feng, W. A robust fruit image segmentation algorithm against varying illumination for vision system of fruit harvesting robot. Optik 2017, 131, 626–631. [Google Scholar] [CrossRef]
  6. Xiang, R.; Ying, Y.; Jiang, H. Development of real-time recognition and localization methods for fruits and vegetables in field. Trans. Chin. Soc. Agric. Mech. 2013, 44, 208–223. [Google Scholar]
  7. Hu, T.; Wang, W.; Gu, J.; Xia, Z.; Zhang, J.; Wang, B. Research on Apple Object Detection and Localization Method Based on Improved YOLOX and RGB-D Images. Agronomy 2023, 13, 1816. [Google Scholar] [CrossRef]
  8. Payne, A.B.; Walsh, K.B.; Subedi, P.P.; Jarvis, D. Estimation of mango crop yield using image analysis—Segmentation method. Comput. Electron. Agric. 2013, 91, 57–64. [Google Scholar] [CrossRef]
  9. Lv, J.; Wang, F.; Xu, L.; Ma, Z.; Yang, B. A segmentation method of bagged green apple image. Sci. Hortic. 2019, 246, 411–417. [Google Scholar] [CrossRef]
  10. Malik, M.H.; Zhang, T.; Li, H.; Zhang, M.; Shabbir, S.; Ahmed, S. Mature tomato fruit detection algorithm based on improved HSV and watershed algorithm. IFAC-Pap. 2018, 51, 431–436. [Google Scholar] [CrossRef]
  11. Song, L.; Shu, T.; Zhou, D.; Ahmed, S. Application of Canny edge detection based on ultra-fuzzy set in Zanthoxylum bungeanum Maxim images. J. Chongqing Technol. Bus. Univ. 2016, 33, 38–42. [Google Scholar]
  12. Qi, R.; Chen, M.; Yang, Z.; Ding, M. Image segmentation of Sichuan pepper based on HSV model and improved OTSU algorithm. J. Chin. Agric. Mech. 2019, 40, 155–160. [Google Scholar]
  13. Wan, F.; Bai, M.; He, Z.; Huang, X. Identification of Chinese prickly ash under the natural scenes. J. Chin. Agric. Mech. 2016, 37, 115–119. [Google Scholar]
  14. Huang, P.; Zheng, Q.; Liang, C. Overview of Image Segmentation Methods. J. Wuhan Univ. 2020, 66, 519–531. [Google Scholar]
  15. Luo, Z.; Yang, W.; Yuan, Y.; Gou, R.; Li, X. Semantic segmentation of agricultural images: A survey. Inf. Process. Agric. 2024, 11, 172–186. [Google Scholar] [CrossRef]
  16. Zhou, X.; Wu, F.; Zou, X.; Meng, H.; Zhang, Y.; Luo, X. Method for locating picking points of grape clusters using multi-object recognition. Trans. Chin. Soc. Agric. Eng. 2023, 39, 166–177. [Google Scholar]
  17. Zhong, Z.; Xiong, J.; Zheng, Z.; Liu, B.; Liao, S.; Huo, Z.; Yang, Z. A method for litchi picking points calculation in natural environment based on main fruit bearing branch detection. Comput. Electron. Agric. 2021, 189, 106398. [Google Scholar] [CrossRef]
  18. Zhuang, O.; Wang, Z.; Wu, L.; Li, K.; Wang, C. Image segmentation method of plug seedlings based on improved SOL0v2. J. Nanjing Agric. Univ. 2023, 46, 200–209. [Google Scholar]
  19. Liu, W.; Ye, T.; Li, X. Tomato Leaf Disease Detection Method Based on Improved SOLO v2. Trans. Chin. Soc. Agric. Mech. 2021, 52, 213–220. [Google Scholar]
  20. He, K.; Gkioxari, G.; Dollár, P.; Girshick, R. Mask R-CNN. In Proceedings of the 2017 IEEE International Conference on Computer Vision, Venice, Italy, 22–29 October 2017; pp. 2980–2988. [Google Scholar]
  21. Pérez-Borrero, I.; Marín-Santos, D.; Gegúndez-Arias, M.E.; Cortés-Ancos, E. A fast and accurate deep learning method for strawberry instance segmentation. Comput. Electron. Agric. 2020, 178, 105736. [Google Scholar] [CrossRef]
  22. Jia, W.; Tian, Y.; Luo, R.; Zhang, Z.; Lian, J.; Zheng, Y. Detection and segmentation of overlapped fruits based on optimized mask R-CNN application in apple harvesting robot. Comput. Electron. Agric. 2020, 172, 105380. [Google Scholar] [CrossRef]
  23. Long, J.; Zhao, C.; Lin, S.; Guo, W.; Wen, C.; Zhang, Y. Segmentation method of the tomato fruits with different maturities under greenhouse environment based on improved Mask R-CNN. Trans. Chin. Soc. Agric. Eng. 2021, 37, 100–108. [Google Scholar]
  24. Liang, X.; Zhang, X.; Wang, Y. Recognition method for the pruning points of tomato lateral branches using improved Mask R-CNN. Trans. Chin. Soc. Agric. Eng. 2022, 38, 112–120. [Google Scholar]
  25. Bai, Z.; Lv, Y.; Zhu, Y.; Ma, Y.; Duan, E. Dead duck recognition algorithm based on improved Mask R-CNN. Trans. Chin. Soc. Agric. Mech. 2024, 1–10. Available online: https://link.cnki.net/urlid/11.1964.S.20240511.0922.002 (accessed on 1 September 2024).
  26. Zhang, G.; Lu, X.; Tan, J.; Li, J.; Zhang, Z.; Li, Q.; Hu, X. RefineMask: Towards high-quality instance segmentation with fine-grained features. In Proceedings of the 2021 IEEE/CVF International Conference on Computer Vision Workshops, Nashville, TN, USA, 11–17 October 2021; pp. 6856–6857. [Google Scholar]
  27. Wang, X.; Wu, Z.; Fang, C. TeaPoseNet: A deep neural network for tea leaf pose recognition. Comput. Electron. Agric. 2024, 225, 109278. [Google Scholar] [CrossRef]
  28. Shi, J.; Bai, Y.; Zhou, J.; Zhang, B. Multi-Crop Navigation Line Extraction Based on Improved YOLO-v8 and Threshold-DBSCAN under Complex Agricultural Environments. Agriculture 2024, 14, 45. [Google Scholar] [CrossRef]
  29. Liu, Z.; Lin, Y.; Cao, Y.; Hu, H.; Wei, Y.; Zhang, Z.; Lin, S.; Guo, B. Swin Transformer: Hierarchical Vision Transformer using Shifted Windows. In Proceedings of the 2021 IEEE/CVF International Conference on Computer Vision, Montreal, BC, Canada, 11–17 October 2021; pp. 9992–10002. [Google Scholar]
  30. Wang, W.; Zhao, R. Fine-grained instance segmentation of clothing images based on improved Mask R-CNN. Wool Text. J. 2023, 51, 88–94. [Google Scholar]
  31. Li, X.; Wang, W.; Hu, X.; Yang, J. Selective Kernel Networks. In Proceedings of the 2019 IEEE/CVF Conference on Computer Vision and Pattern Recognition, Long Beach, CA, USA, 15–20 June 2019; pp. 510–519. [Google Scholar]
  32. Zi, Z.; Wang, P.; Liu, W.; Li, J.; Ye, R.; Ren, D. Distance-IoU Loss: Faster and better learning for bounding box regression. In Proceedings of the 34th AAAI Conference on Artificial Intelligence, New York, NY, USA, 7–12 February 2020; pp. 12993–13000. [Google Scholar]
  33. Wang, H.; Li, Y.; Dang, L.M.; Moon, H. An efficient attention module for instance segmentation network in pest monitoring. Comput. Electron. Agric. 2022, 195, 106853. [Google Scholar] [CrossRef]
  34. Selvaraju, R.R.; Cogswell, M.; Das, A.; Vedantam, R.; Parikh, D.; Batra, D. Grad-CAM: Visual explanations from deep networks via gradient-based localization. In Proceedings of the 2017 IEEE International Conference on Computer Vision, Venice, Italy, 22–29 October 2017; pp. 618–626. [Google Scholar]
Figure 1. Examples of Zanthoxylum bungeanum images. (a) An unobscured cluster. (b) Unobscured clusters. (c) An obscured cluster. (d) Obscured clusters.
Agriculture 14 01585 g001
Figure 2. Example of image augmentation and annotation. (a) Original image. (b) Contrast adjustment. (c) Brightness adjustment. (d) Flipping. (e) GridMask. (f) Sharpness. (g) Example of annotation.
Agriculture 14 01585 g002
Figure 3. Network structure of the baseline Mask R-CNN.
Agriculture 14 01585 g003
Figure 4. Network structure of the improved Mask R-CNN.
Agriculture 14 01585 g004
Figure 5. Swin-Transformer network structure.
Agriculture 14 01585 g005
Figure 6. Swin-Transformer block.
Agriculture 14 01585 g006
Figure 7. Improved mask branch.
Agriculture 14 01585 g007
Figure 8. SK attention mechanism.
Agriculture 14 01585 g008
Figure 9. DIOU loss for bounding box regression. Note: The red dashed rectangle represents the smallest enclosing rectangle; the cyan box denotes the predicted bounding box B; and the orange box indicates the ground truth bounding box Bgt.
Agriculture 14 01585 g009
Figure 10. Feature visualization results of different feature extraction networks. (a) An unobscured cluster. (b) Unobscured clusters. (c) An obscured cluster. (d) Obscured clusters.
Agriculture 14 01585 g010
Figure 11. Training loss curves with different loss functions.
Agriculture 14 01585 g011
Figure 12. Detection and segmentation examples of the baseline and improved Mask R-CNN. (a) An unobscured cluster. (b) Unobscured clusters. (c) An obscured cluster. (d) Obscured clusters.
Agriculture 14 01585 g012
Figure 13. Detection and segmentation examples of different models. (a) An unobscured cluster. (b) Unobscured clusters. (c) An obscured cluster. (d) Obscured clusters.
Agriculture 14 01585 g013
Table 1. Comparison results of different feature extraction networks.
Feature Extraction
Networks
mAP 50 box (%) mAP 50 mask (%)Parameters (M)Time (s/Image)
The baseline Mask R-CNN (ResNet50)78.272.643.970.137
ConvNext81.373.847.670.139
Swin-Transformer82.675.247.370.138
Table 2. Comparison results of different attention mechanisms.
Attention Mechanisms mAP 50 box (%) mAP 50 mask (%)Parameters (M)Time (s/Image)
The baseline Mask R-CNN78.272.643.970.137
SK82.274.948.580.187
CA79.873.647.220.184
CBAM79.473.547.650.185
Table 3. Comparison results of different loss functions.
Loss Functions mAP 50 box (%) mAP 50 mask (%)Parameters (M)Time (s/Image)
The baseline Mask R-CNN (SmoothL1)78.272.643.970.137
SIOU80.672.443.970.137
GIOU80.671.643.970.137
CIOU80.371.543.970.137
DIOU81.473.043.970.137
Table 4. Results of the ablation experiment.
GroupSwin-
Transformer
Mask Branch ImprovementDIOU mAP 50 box (%) mAP 50 mask (%)Parameters (M)Time (s/Image)
1×××78.272.643.970.137
2××82.675.247.370.138
3××82.274.948.580.187
4××81.473.043.970.137
584.077.250.320.189
Note: “√” indicates that this operation is performed, while “×” means that this operation is not performed.
Table 5. Comparison results of different models.
Models mAP 50 box (%) mAP 50 mask (%)Parameters (M)Time (s/Image)
YOLACT81.071.334.730.127
Mask Scoring R-CNN82.773.560.310.137
SOLOv2-68.446.540.186
Improved Mask R-CNN84.077.250.320.189
Disclaimer/Publisher’s Note: The statements, opinions and data contained in all publications are solely those of the individual author(s) and contributor(s) and not of MDPI and/or the editor(s). MDPI and/or the editor(s) disclaim responsibility for any injury to people or property resulting from any ideas, methods, instructions or products referred to in the content.

