Article

Photosynthetic Performance and Heterogeneous Anatomical Structure in Prunus humilis under Saline–Alkaline Stress

1
State Key Laboratory of Efficient Production of Forest Resources, Beijing 100083, China
2
Key Laboratory of Forest Silviculture and Conservation of the Ministry of Education, College of Forestry, Beijing Forestry University, Beijing 100083, China
3
National Engineering Research Center of Tree Breeding and Ecological Restoration, Beijing Key Laboratory of Ornamental Plants Germplasm Innovation and Molecular Breeding, College of Biological Sciences and Technology, Beijing Forestry University, Beijing 100083, China
4
School of Soil and Water Conservation, Beijing Forestry University, Beijing 100083, China
*
Author to whom correspondence should be addressed.
Agriculture 2024, 14(9), 1606; https://doi.org/10.3390/agriculture14091606 (registering DOI)
Submission received: 19 June 2024 / Revised: 25 August 2024 / Accepted: 9 September 2024 / Published: 14 September 2024
(This article belongs to the Section Crop Production)

Abstract

:
Prunus (P.) humilis is a small woody shrub that has been widely planted in northern China due to its high nutritional value and resistance to environmental abiotic stress. However, little information about the responses of photosynthetic performance and the anatomical structure of P. humilis to saline–alkaline stress (SAS) under field conditions is available. Here, we investigated the behavior of the photosynthetic apparatus of P. humilis by measuring the chlorophyll fluorescence parameters under moderate (MS) and severe (SS) saline–alkaline stress and analyzing their relationship to leaf anatomical traits. The results showed that SAS significantly decreased the net photosynthetic rate (An) but increased the substomatal CO2 concentration (Ci). The maximum photochemical quantum yield of PSII (Fv/Fm) and the efficient quantum yield of PSII [Y(II)] decreased under MS and SS conditions, and this decrease was greater in the distal (tip) than in the proximal (base) leaf. Compared to the leaf tip, the base of P. humilis leaves seemed to have a stronger ability to cope with MS, as was made evident by the increased quantum yield of regulated energy dissipation in PSII [Y(NPQ)] and decreased excitation pressure (1-qP). Under MS and SS conditions, the shapes of the chlorophyll a fluorescence transient (OJIP) changed markedly, accompanied by decreased PSII acceptor-side and donor-side activities. The palisade–spongy tissue ratio (PT/ST) increased significantly with increasing stress and showed a significant correlation with the chlorophyll fluorescence parameters in the leaf base. These results suggested that the activity of PSII electron transfer in the upper leaf position tended to be more sensitive to saline–alkaline stress, and a chlorophyll fluorescence analysis proved to be a good technique to monitor impacts of saline–alkaline stress on photosynthetic function, which may reflect the non-uniformity of leaf anatomy. In addition, among the anatomical structure parameters, the palisade–spongy tissue ratio (PT/ST) can be used as a sensitive indicator to reflect the non-uniform of photosynthetic function and leaf anatomy under stress.

1. Introduction

Prunus humilis is a small woody shrub endemic to China. It is widely distributed in Inner Mongolia, Shanxi, and other northern Chinese regions and has been widely planted due to its high economic and ecologic value [1,2]. P. humilis fruit is regarded as a highly nutritious fruit, especially because it contains a high calcium content [3,4,5]. Recently, the area of P. humilis plantations has expanded to satisfy the increasing demand. However, with the reduction in the area of arable land, P. humilis is increasingly planted in saline soils, causing potential effects on its growth.
Soil salinity is a major environmental stress that impairs plant growth and productivity worldwide. More than 20% of irrigated soils are salt-affected, and this problem has become more evident in recent years, mainly in semi-arid and arid areas [6,7]. In natural conditions, soil salinization and alkalization frequently co-occur, forming saline–alkali soils [8], which may act together to have negative impacts on plants [9,10,11]. The presence of excessive salt disturbs the soil’s ion balance, causing ion toxicity and osmotic stress, thereby affecting plant growth [12]. In addition to ionic and osmosis stress, alkaline soil will also impose high pH stress on plants [13,14], leading to much more serious inhibition of plant growth [15].
In higher plants, photosynthesis is one of the most essential physiological processes that are sensitive to salinity stress [14,16]. It is believed that the decrease in photosynthesis caused by salinity stress is attributed to the suppression of the photosynthetic electron transport activity, especially damage to the activities of photosystems (PS) [14,17,18]. Salinity stress not only impairs the donor side of the photosystem’s electronic transport chain [19] but also damages electron transfer within the reaction centers and downstream of PS [20,21]. The inhibition of photosynthetic electron transport by salinity stress can usually result in the accumulation of electrons available for charge recombination that tend to generate excessive reactive oxygen species (ROS) [22], damaging the photosynthetic apparatus [16,21] and inhibiting PSII-repairing machinery [23]. Some authors have suggested that the inhibition of photosynthesis caused by salinity stress is associated with leaf anatomical changes [24], photosynthetic pigment degradation in thylakoid membranes [25], and photosynthetic enzyme inactivation [26,27].
To cope with environmental stresses, plants have evolved various defense mechanisms [28,29]. Leaf functional traits are generally believed to be sensitive to changes in environmental factors and can help plants survive under diverse environmental conditions through adjusting resource utilization strategies [30]. Leaf functional traits, such as the thickness of the leaf, are important determinants of the leaf’s photosynthetic rate because of their close relation to CO2 diffusion and light energy absorption [31]. The tissue composition of a leaf is determined not only by genotype but also by environmental conditions [32,33]. Salinity stress could reduce the thickness of the upper epidermis, mesophyll tissues, and ultimately, leaf thickness [34]. Thus, leaf functional traits can provide an insight into leaf function in relation to the environment [35]. Although the possible physiological and photosynthetic responses to abiotic stress in P. humilis have been studied [2,36,37,38], few studies have examined the internal correlation between photosynthetic performance and leaf functional traits in P. humilis. Thus, we conducted this research to investigate the behavior of the photosynthetic apparatus of P. humilis by measuring the chlorophyll fluorescence parameters and analyzing their relationship to leaf anatomical traits, aiming to provide insights into the mechanisms underlying saline–alkaline stress.

2. Materials and Methods

2.1. Plant Material and Growth Conditions

Four-year-old P. humilis seedlings (cv. Jingou 1) were used to perform this experiment. This study was conducted in Dengkou County, located in the Hetao irrigation area in Inner Mongolia, northern China (Figure 1), and was performed from July to August 2022, when the vigorous growing stage of P. humilis seedlings was occurring at the study site. The orchard soil is classified as brown calcic soil and gray desert soil [39]. The area has a temperate continental climate with an annual mean temperature of 7.6 °C and an annual mean precipitation of 145 mm; about 60–70% of the precipitation is concentrated during the period from June to September [40]. Seedlings were planted and spaced 2 × 1 m apart and were irrigated using a drip irrigation system with normal fertilizer management, depending on the season.
Plant height (PH) and branch numbers (BN) were measured in situ, and the measurements were repeated twenty times at least. Soil samples at a depth of 10~30 cm were collected at the beginning of the experiment to determine the soil volumetric water content (VWC), soil electrical conductivity (EC), and pH with three replicates and were then classified into the following three groups on the basis of soil (EC, pH, and VWC) and plant growth (PH and BN) characteristics: control, moderate (MS), and severe (SS) saline–alkaline stress (Table 1).

2.2. Gas Exchange Measurements

Measurements of gas exchange parameters were made on the mid-portion of fully expanded attached leaves of P. humilis by using an open system photosynthetic gas analyzer (CI-340, CID, Washington, DC, USA). Measurements of the photosynthetic rate (An), internal CO2 concentration (Ci), and stomatal conductance (gs) were made at a CO2 concentration of 400 μL L−1 and a temperature of 28 °C, with a relative humidity of 80% and saturating light (1000 μmol m−2 s−1). The stomatal limitation (Ls) was estimated as Ls = 1 − Ci/Ca, where Ca is the atmospheric CO2 concentration [41]. Mid-portions of the leaf blade were used to measure leaf gas exchange parameters.

2.3. Relative Chlorophyll Content and Anatomical Analyses

The relative chlorophyll content (SPAD) in the leaf tip and base was measured by using a SPAD-502 chlorophyll meter (Minolta, Osaka, Japan). In order to investigate the distribution of chlorophyll along the blade of the leaf, SPAD values and samples in the base (lower half of the leaf) and the tip (upper half of the leaf) were taken.
For anatomical characterization, the collected leaf samples in different leaf positions were immersed in a formalin–acetic acid–alcohol (FAA) fixative and fixed overnight. After dehydrating with graded alcohol concentrations, the samples were embedded in paraffin. Sections were cut using an optical microtome at 10 µm and stained with toluidine blue for visualization under an Olympus BX63 microscope.

2.4. Measurement of Chlorophyll Fluorescence Transients (OJIP) and Modulated Chlorophyll Fluorescence Parameters

The polyphasic chlorophyll fluorescence transients (OJIP) were measured in different leaf parts using a Handy Plant Efficiency Analyzer (Hansatech, UK) according to Strasser and Srivastava [42]. After 30 min of dark adaptation, measurements were taken of chlorophyll a fluorescence intensity. The intensity of the fluorescence increased rapidly from a minimal level, Fo, to a maximal level, Fm. Three intermediate steps appeared at 0.3 (K step), 2 (J step), and 30 ms (I step), respectively. The fluorescence parameters were calculated as follows, according to the JIP test [43]:
(1)
Absorption flux per cross-section of leaf, ABS/CSo ≈ Fo;
(2)
Approximated initial slope of the fluorescence transient, Mo = 4·(Fk − Fo)/(Fm − Fo);
(3)
Relative variable fluorescence at the J-step, Vj = (Fj − Fo)/(Fm − Fo);
(4)
The maximum quantum yield of PSII, Fv/Fm = φPo = (Fm − Fo)/Fm;
(5)
The normalized relative variable fluorescence at the K step, Wk = (Fk − Fo)/(Fj − Fo);
(6)
Probability that a trapped exciton moves an electron into the electron transport chain beyond QA, ψo = ETo/TRo = (1 − Vj);
(7)
Density of active reaction centers, RC/CSo = (Fv/Fm)·(Vj/Mo)·(ABS/CSo);
(8)
Performance index on absorption basis, PIabs = (RC/ABS)·[φPo/(1 − φPo)]·[ψo/(1 − ψo)].
The modulated chlorophyll fluorescence images and parameters of plants were measured with a Handy FluorCam FC 100-H (Photon System Instruments, Drasow, Czech Republic) using the FluorCam quenching protocol as described in [44]. False color images were used to capture the measured chlorophyll fluorescence intensity, with black representing the lowest (zero) intensity and red indicating the highest intensity. The leaves were dark-adapted for 20 min to measure maximal fluorescence (Fm), and then they were subjected to irradiance for at least 20 min, and the light-adapted minimum (Fo’), steady-state (Fs), and maximum (Fm’) fluorescence of the leaves were measured when steady-state assimilation was amply reached. The following parameters were then calculated [45,46]: (1) the actual PSII efficiency, Y(II) = (Fm’ − Fs)/Fm’; the quantum yield of regulated energy dissipation of PSII, Y(NPQ) = Fs/Fm’ − Fs/Fm; the quantum yield of non-regulated energy dissipation of PSII, Y(NO) = Fs/Fm; and the PSII excitation pressure, 1 − qP = 1 − (Fm’ − Fs)/(Fm’ − Fo’).

2.5. Statistical Methods

Measurements were repeated at least five times. One-way analysis of variance (ANOVA) and Duncan’s multiple range tests were performed on the independent samples using SPSS version 13.0. The confidence coefficient was set at 95%. Graphs were generated using SigmaPlot 10.0 and Origin 9 software.

3. Results

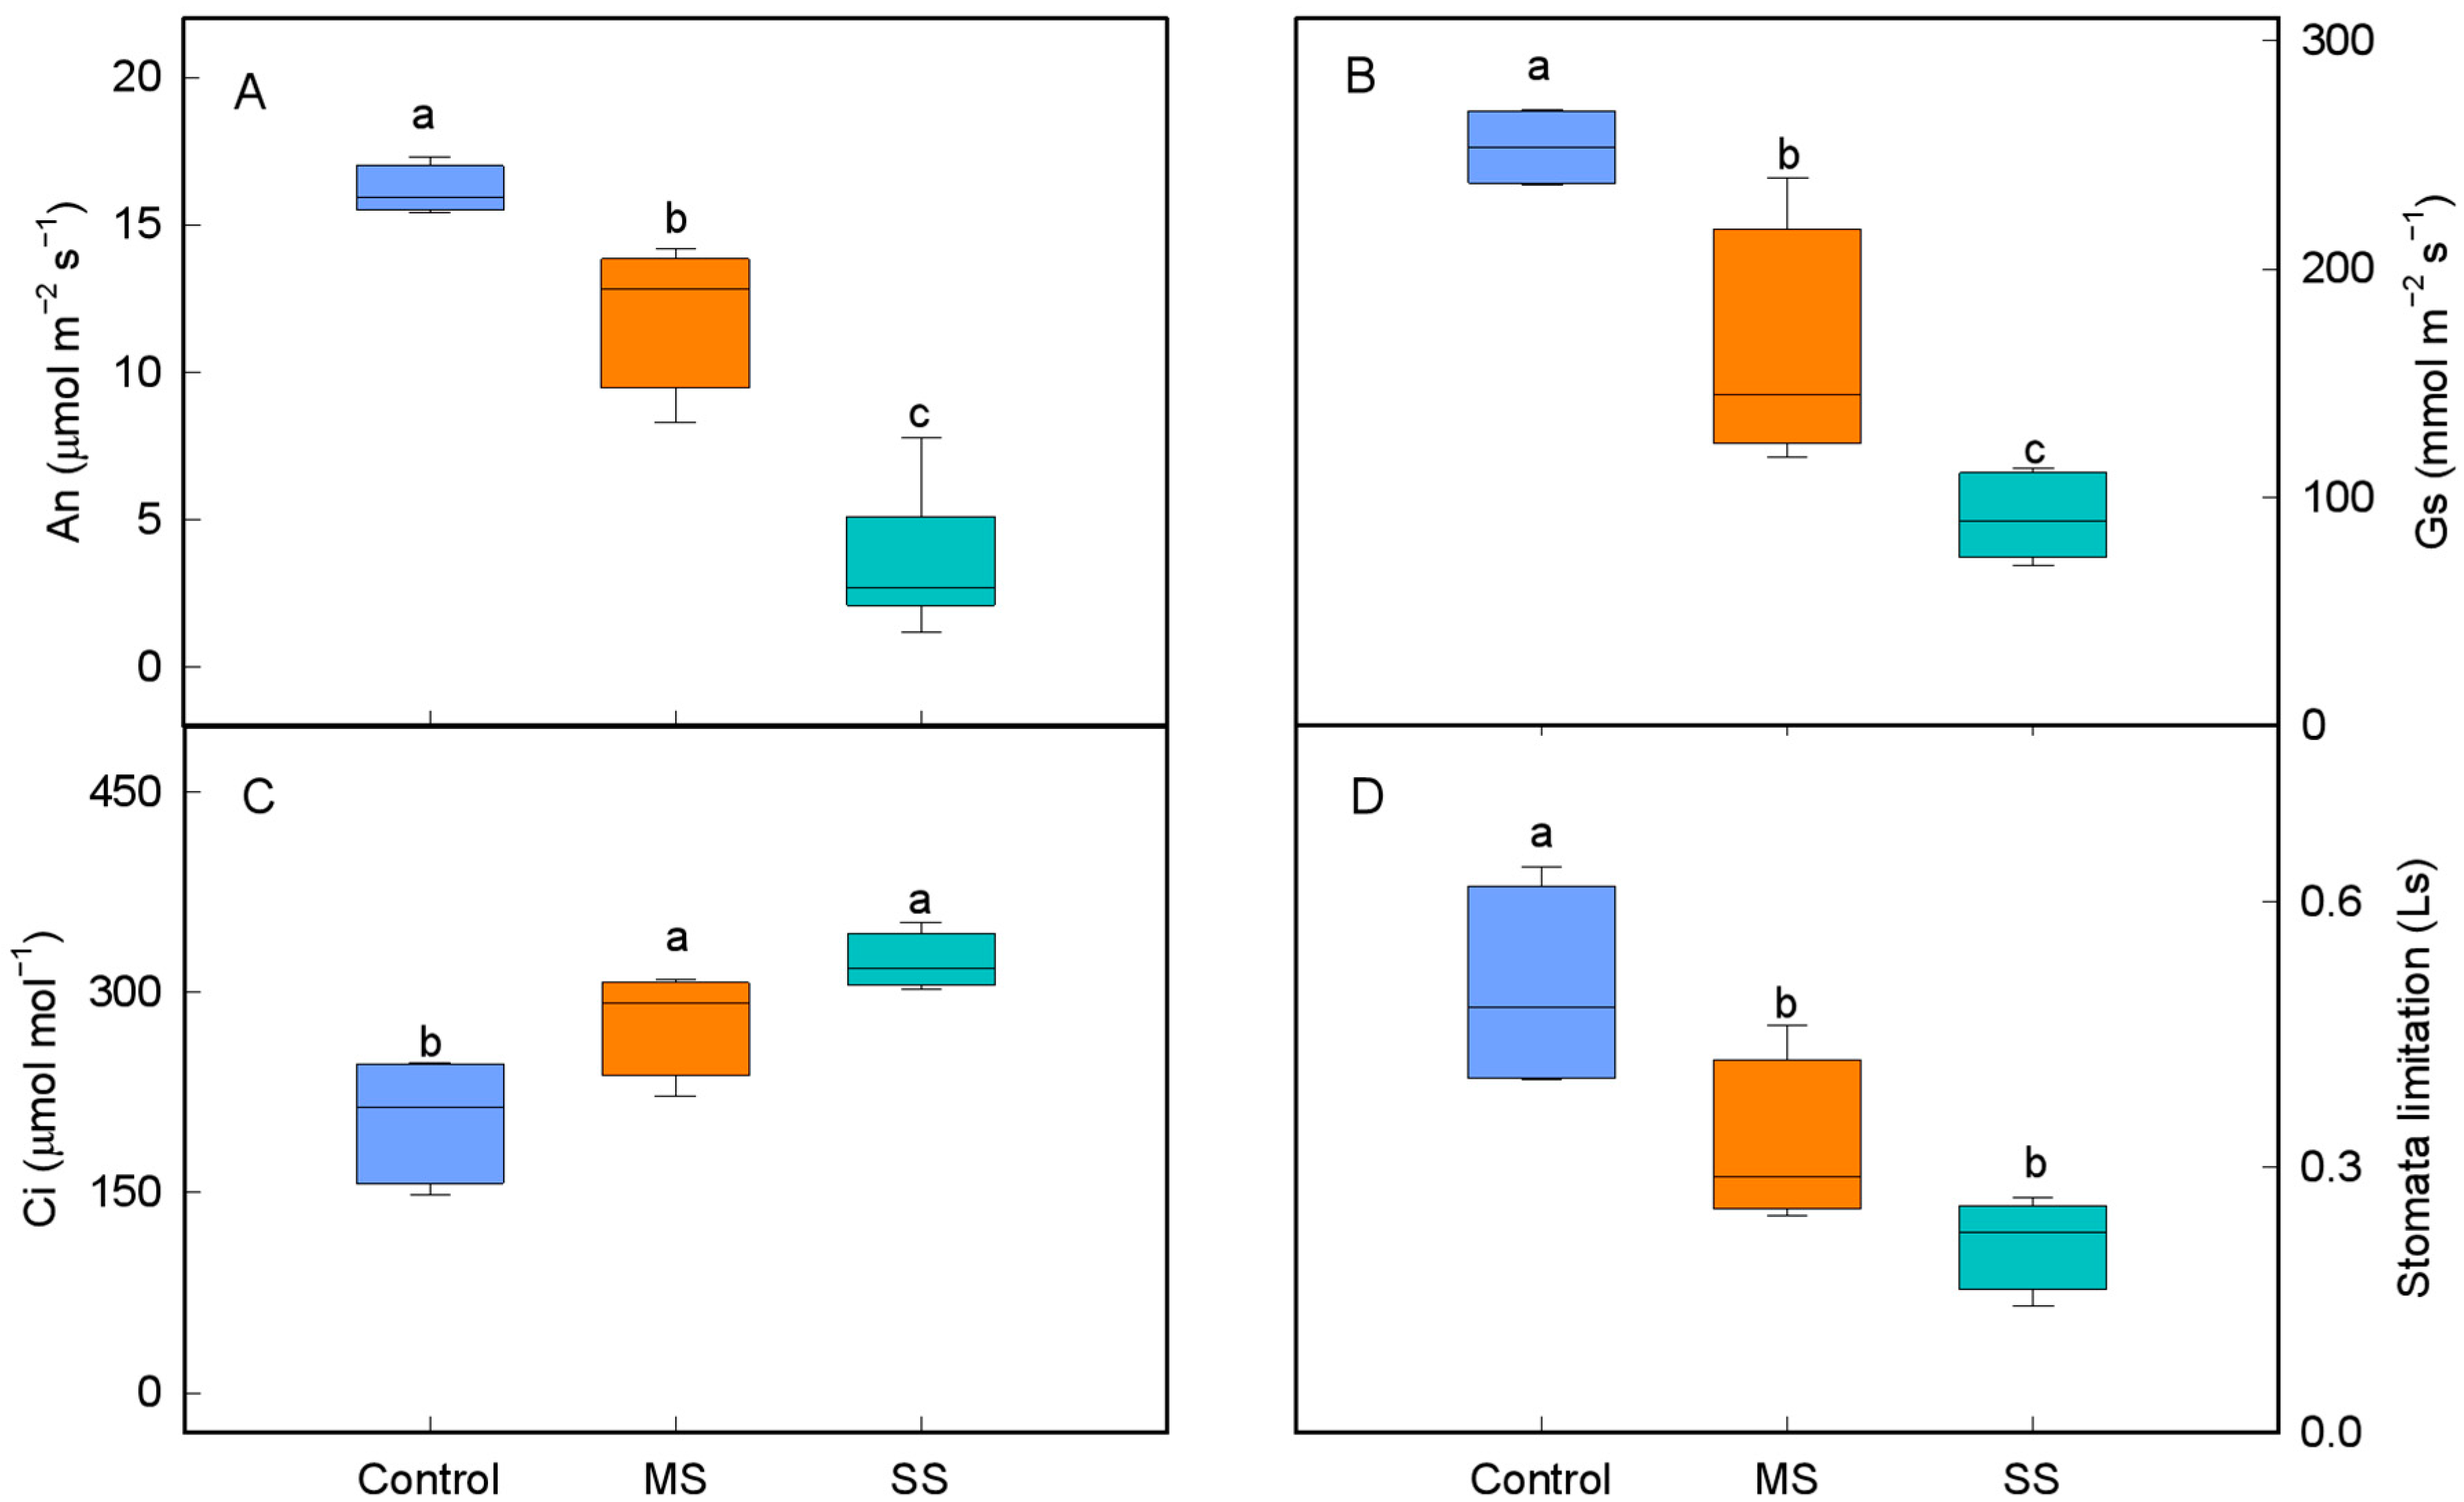
3.1. Changes in Leaf Gas Exchange Characteristics

The response of leaf gas exchange in P. humilis leaves subjected to MS and SS in the field is presented in Figure 2. With an increase in stress levels, the levels of An in the leaves decreased significantly, which were reduced by approximately 26% and 77% under MS and SS conditions, respectively, compared with the control (Figure 2A). Gs displayed a similar trend in response to the salinity stress, which was reduced by approximately 36% and 64% under MS and SS conditions, respectively (Figure 2B). However, Ci increased with the decrease in An and Gs, which were increased by about 1.3-fold and 1.7-fold, respectively. Meanwhile, the stomatal limitation (Ls) decreased with increased stress, reaching the lowest value under SS conditions (Figure 2D). These results indicate that the lower net photosynthetic rate of P. humilis leaves subjected to SAS could be attributed to a non-stomatal limitation factor.

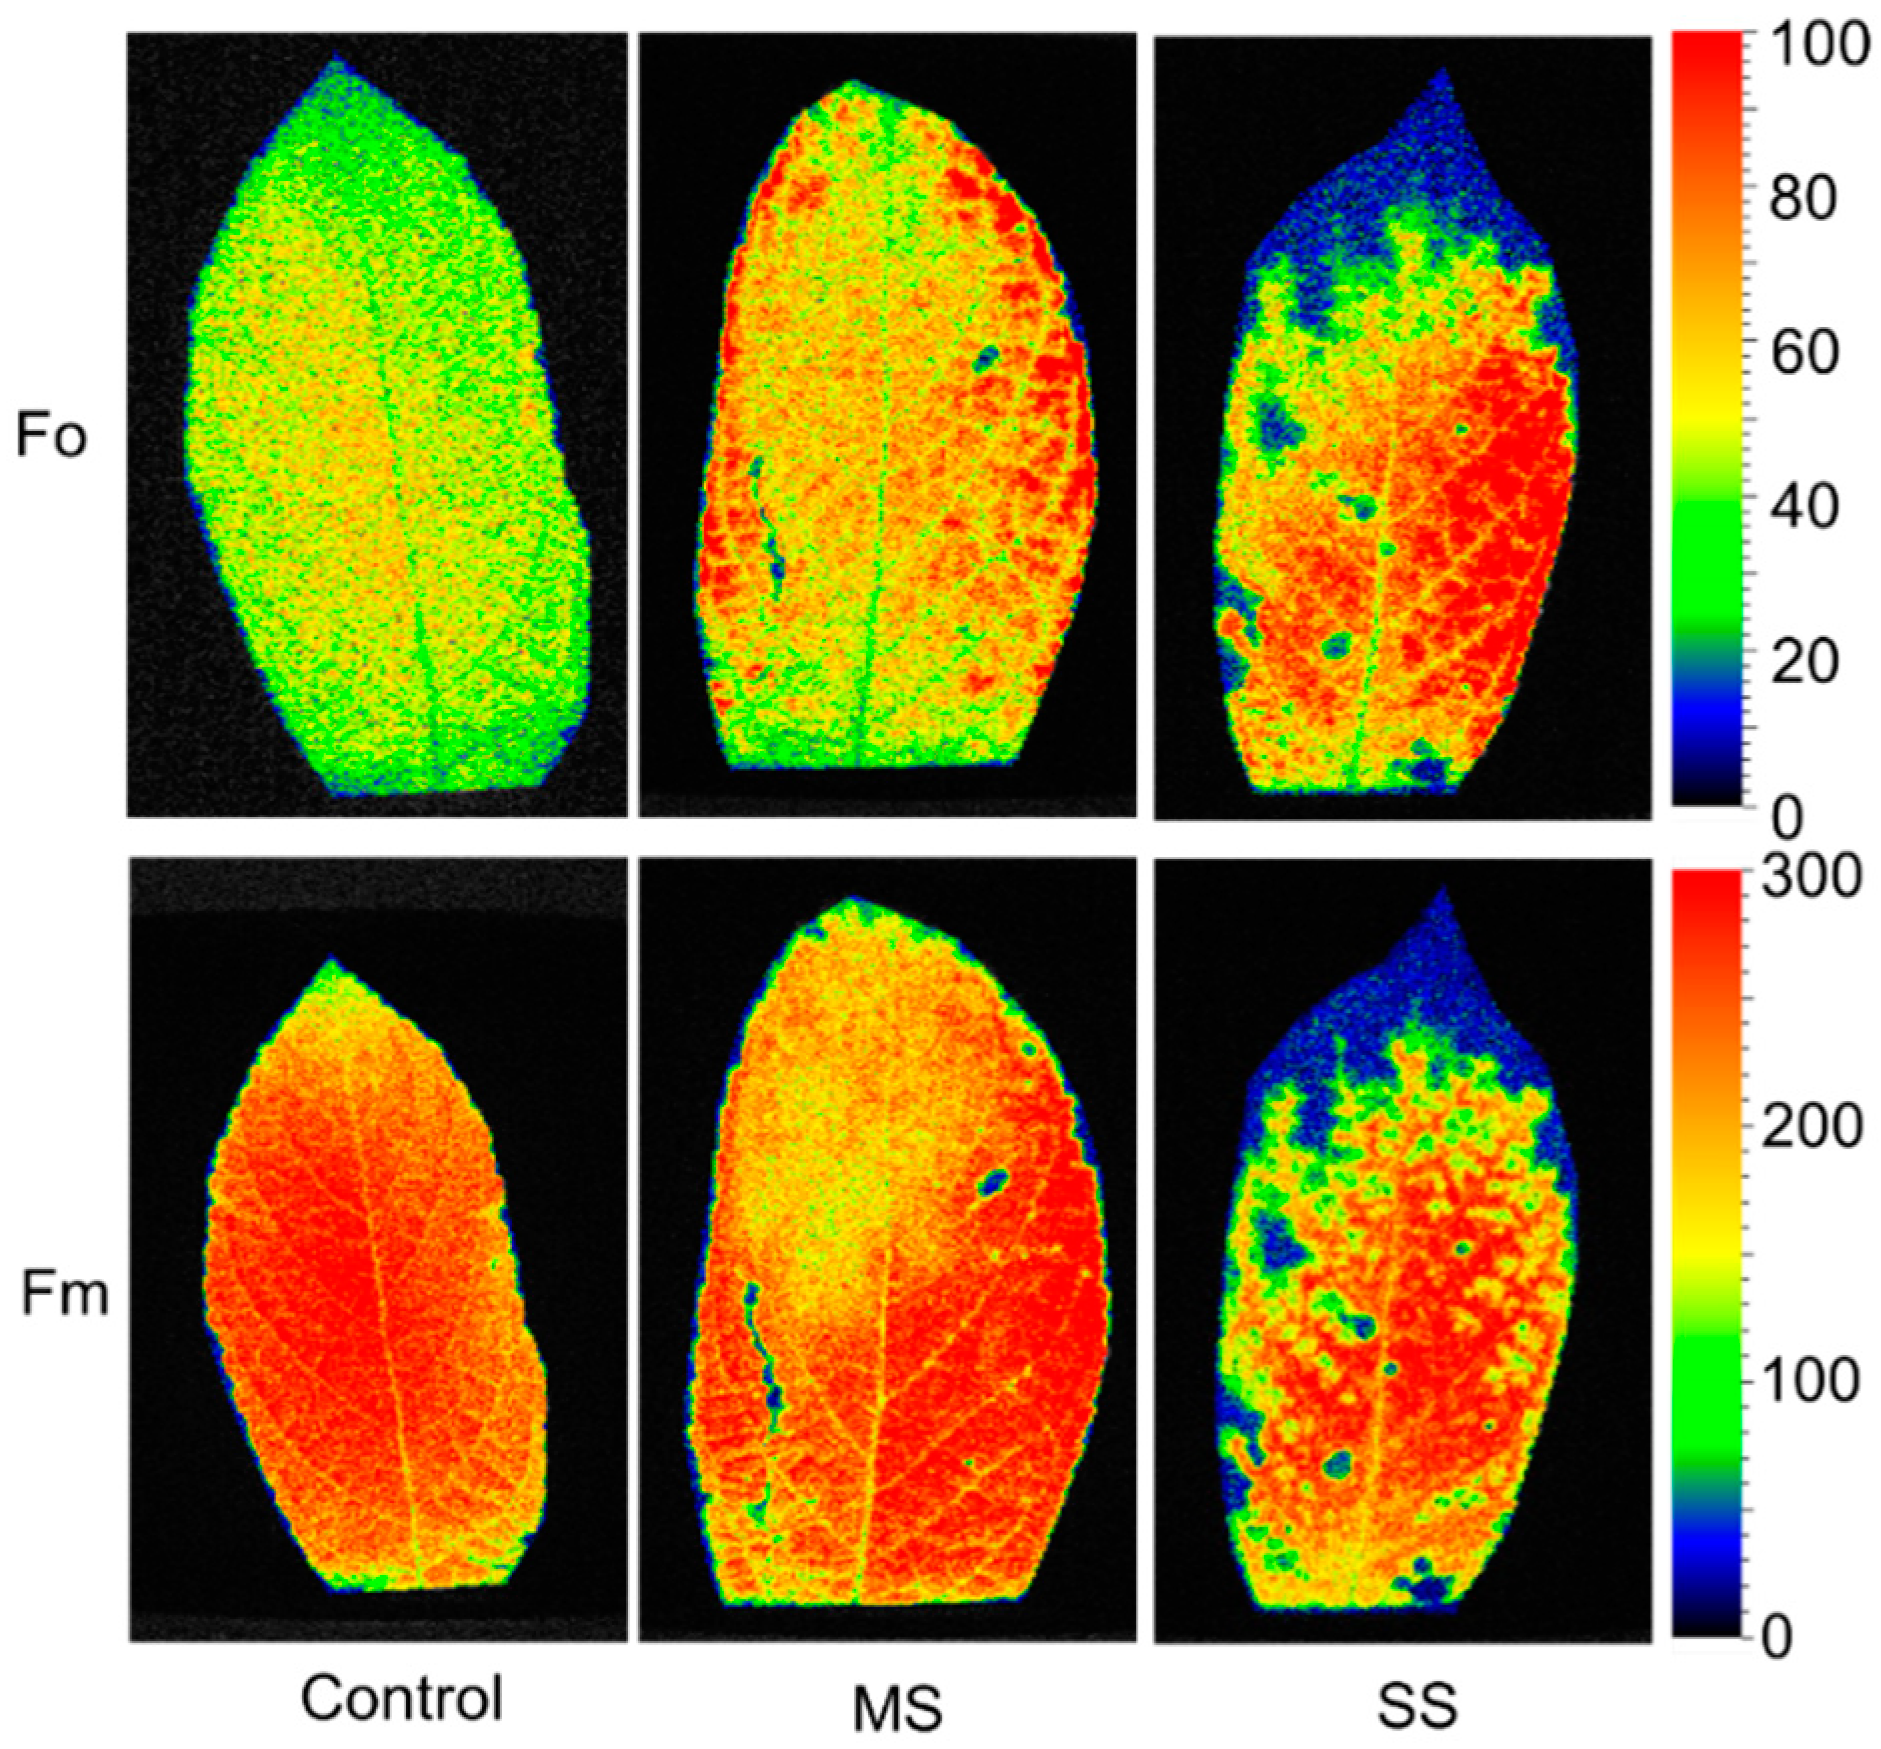
3.2. Heterogeneity in P. humilis Leaves under Saline–Alkaline Stress

Color-coded chlorophyll fluorescence images of individual leaves of the dark-adapted fluorescence intensity were used to assess spatially heterogeneity responses to SAS. The minimum (Fo) and maximum (Fm) values changed differentially along the leaf blade, and this change was greater under SAS conditions compared with control (Figure 3). Under MS conditions, the Fo values were higher in the distal (leaf tip) part compared to the proximal (leaf base), while values of Fm were lower close to the leaf tip compared to the leaf base. Under SS conditions, the values of Fo and Fm were higher close to the leaf midvein and changed less in the leaf base than in the leaf tip.

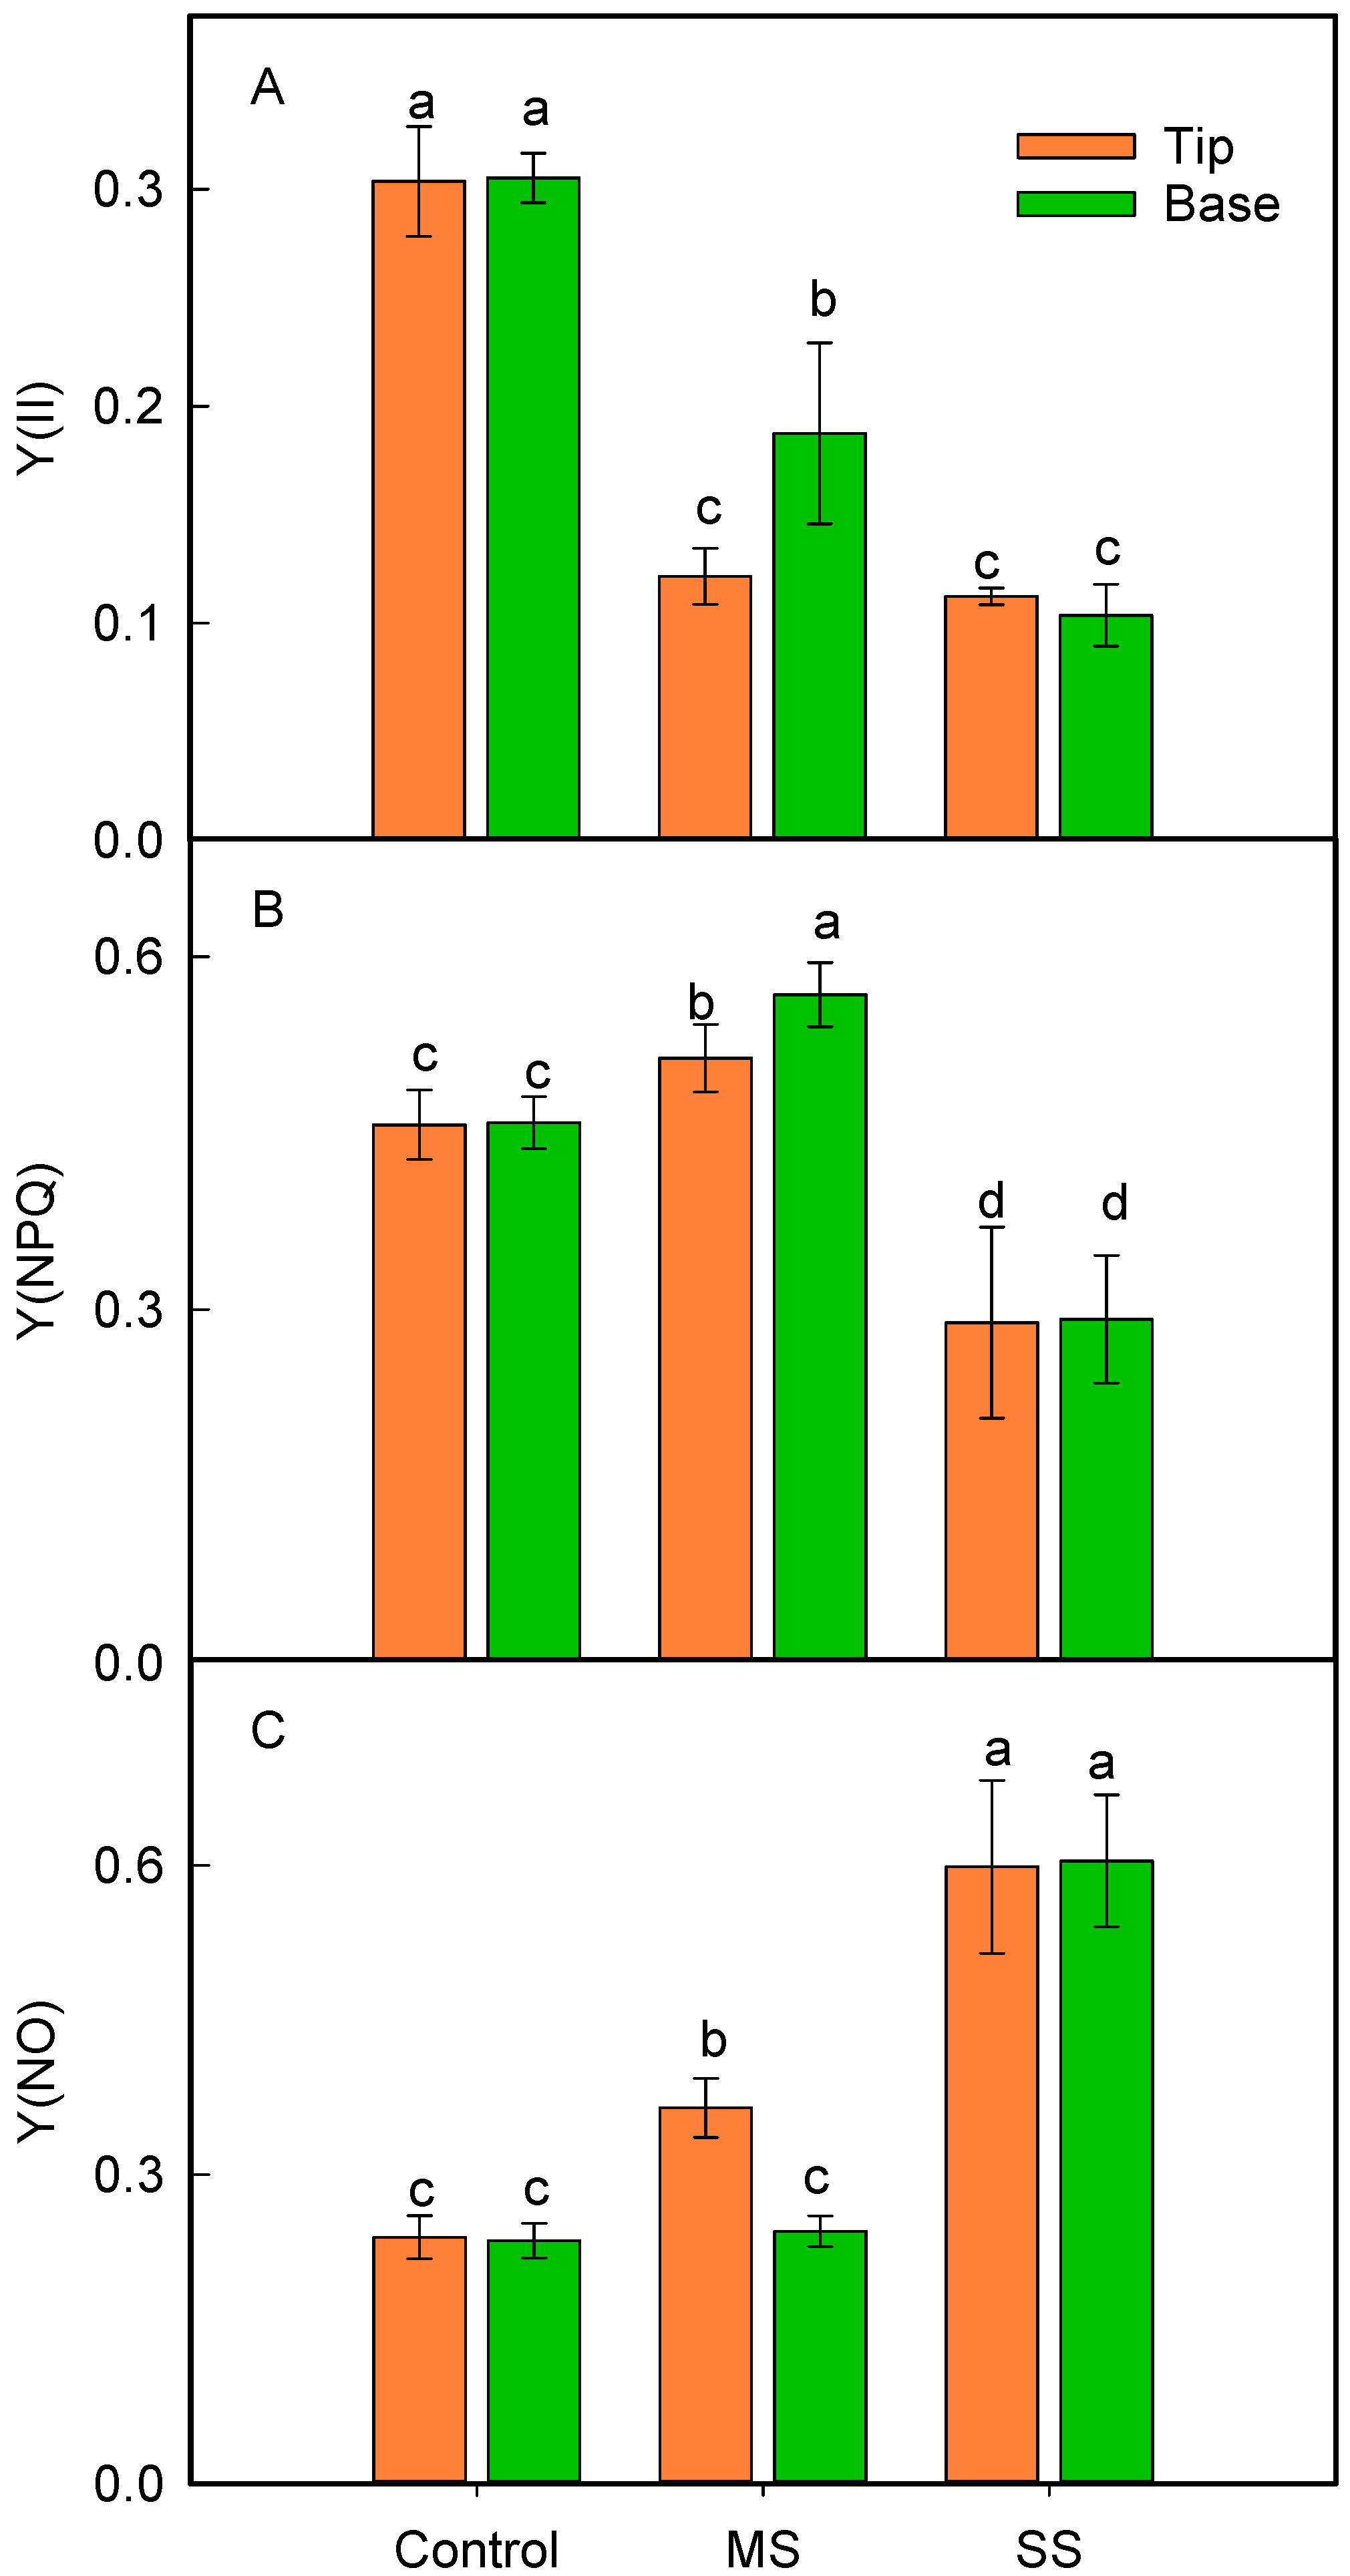
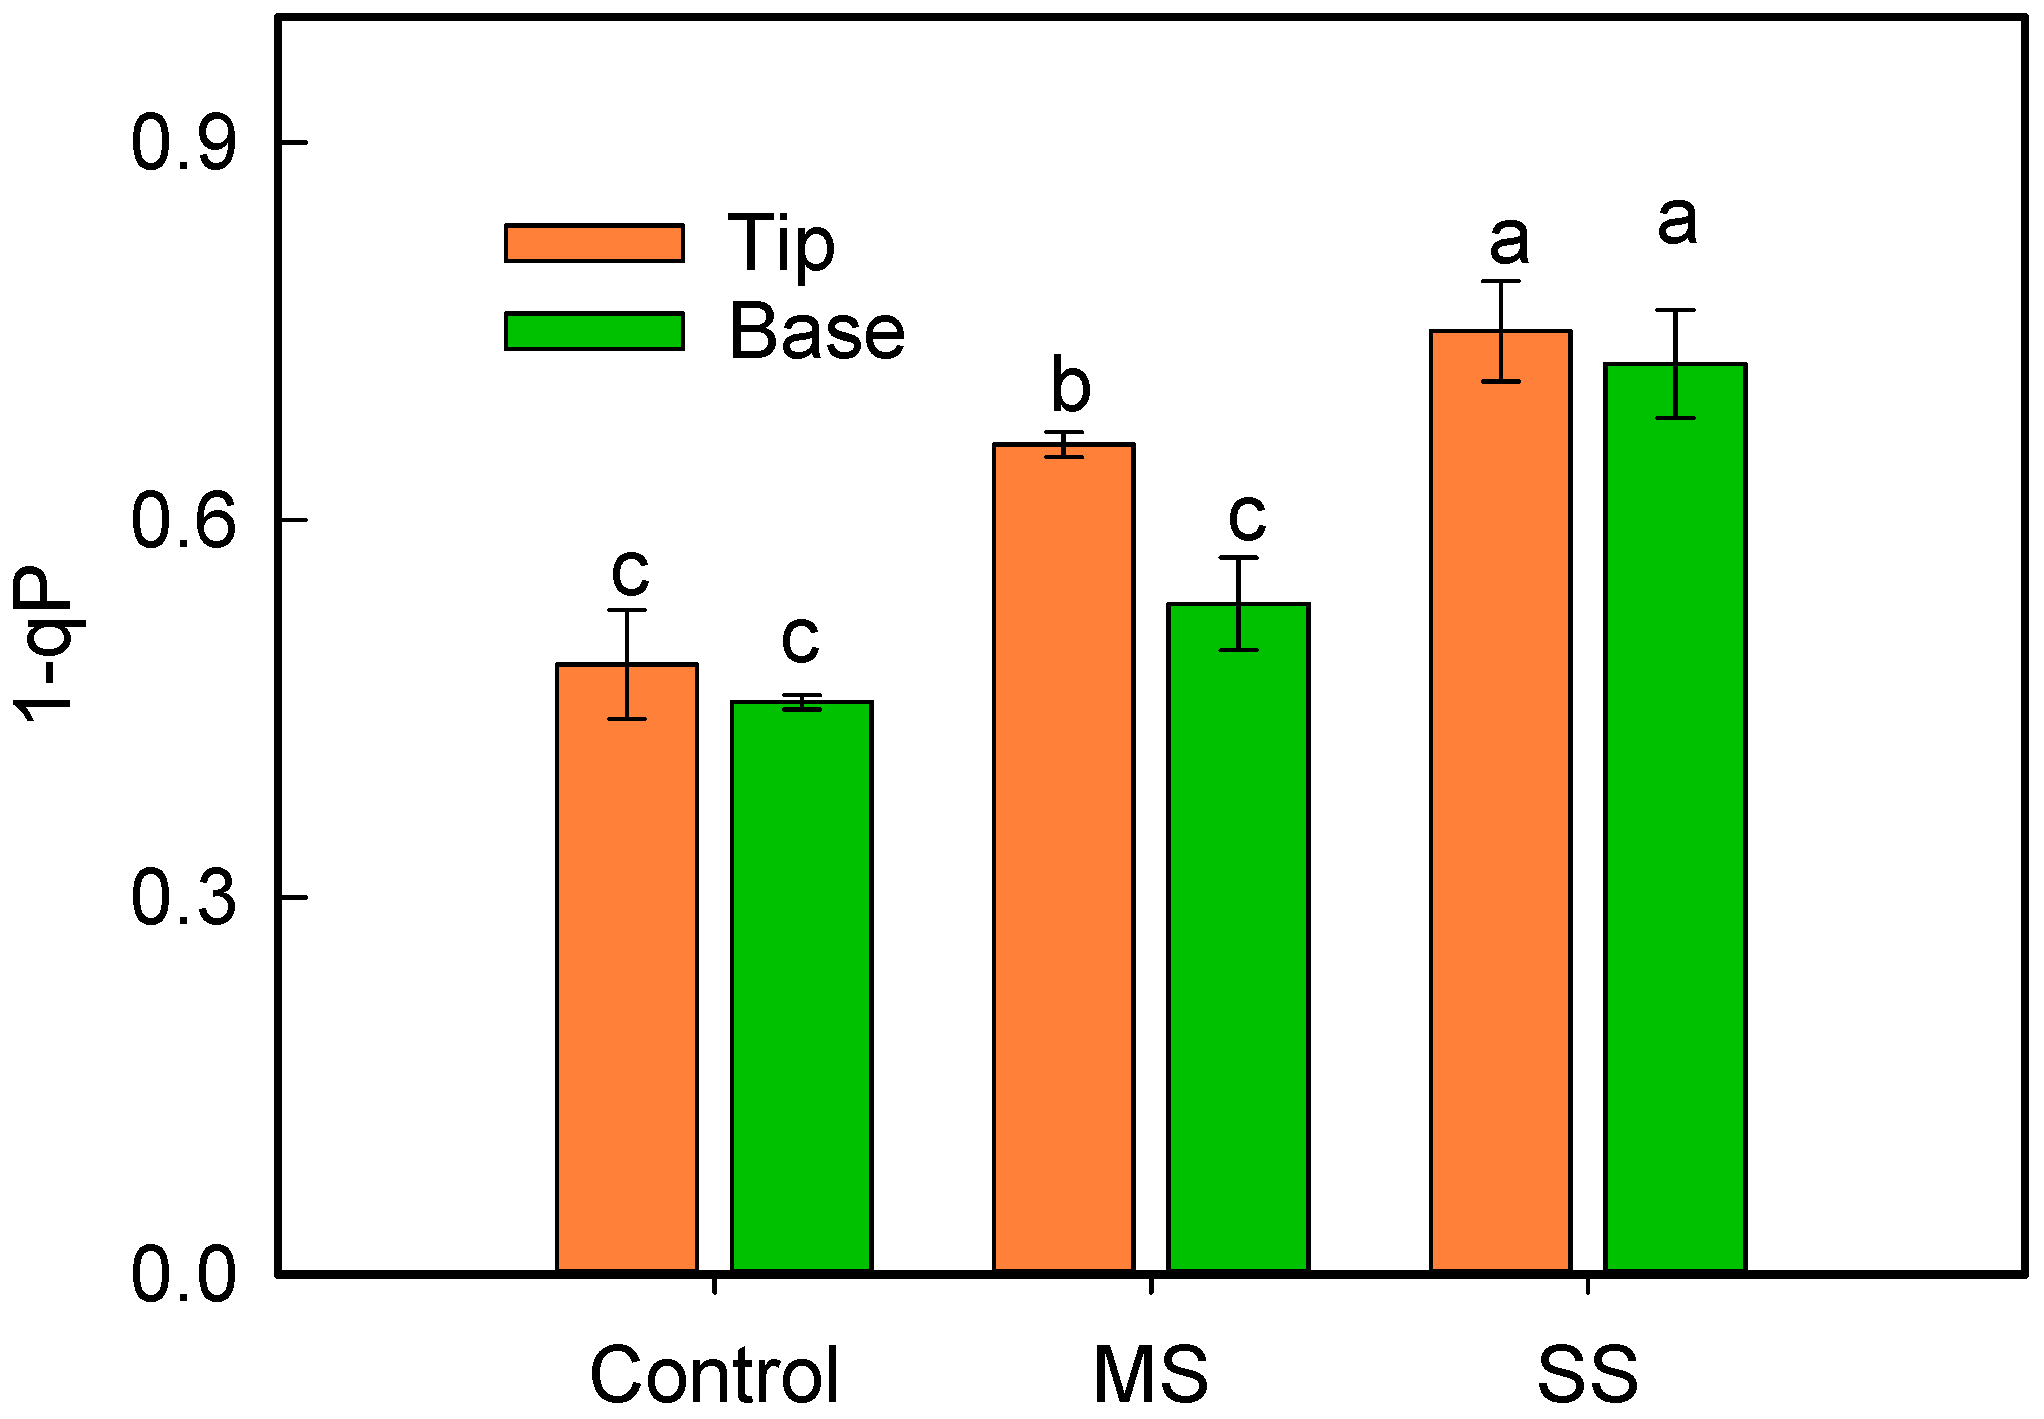
3.3. Changes in Leaf Relative Chlorophyll Content and Energy Distribution of Light Absorbed by PSII

The leaf’s relative chlorophyll content can be measured rapidly and non-destructively through SPAD analysis in the field [47]. Since it has been reported that chlorophyll is not evenly distributed along the leaf blade [48], relative chlorophyll content measurements were also carried out in the leaf base and leaf tip. A decline in chlorophyll content under SAS conditions was observed, and the decrease in the leaf tip was greater than that in the leaf base (Figure 4A), indicating that chlorophyll in different leaf portions of P. humilis exhibited different sensitivities to SAS in the field.
There was also a deferential decrease in the PSII maximum quantum yield (Fv/Fm) values in different parts of the leaf (Figure 4B). Compared to the control, Fv/Fm in the leaf base and the leaf tip decreased by 14.7% and 1% under MS conditions, respectively. Further saline–alkaline stress (SS) resulted in a decline in Fv/Fm of 28.1% and 18.1% (compared to the control) in the leaf base and the leaf tip, respectively.
To investigate whether the decrease in CO2 assimilation induced by SAS was associated with the energy distribution of light absorbed by PSII, we examined the effects of different SAS levels on the efficient quantum yield of PSII [Y(II)], the quantum yield of regulated energy dissipation of PSII [Y(NPQ)], and the quantum yield of non-regulated energy dissipation in PSII [Y(NO)]. Figure 5 shows that there was no marked longitudinal gradient in terms of Y(II), Y(NPQ), and Y(NO) in P. humilis leaves under control conditions. However, Y(II) in the leaf base decreased significantly under MS and SS conditions, compared to the control. SAS caused a significant decrease in Y(II), and the decrease was much greater in the leaf tip than in the leaf base (Figure 5A). Y(NPQ) increased significantly under MS conditions, and the increase was greater in the leaf base than in the leaf tip, but a significant decline in Y(NPQ) under SS conditions was observed (Figure 5B). On the other hand, Y(NO) increased significantly with the increase in SAS levels (Figure 5C).
1-qP can be used as an estimate of the relative PSII excitation pressure to which an organism is exposed [49]. In our study, the level of 1-qP was not affected in the leaf base under MS conditions, but a significant increase in 1-qP was observed in the leaf tip, while further saline–alkaline stress (SS) resulted in a greater increase in 1-qP in both the leaf base and tip (compared to the control) (Figure 6).

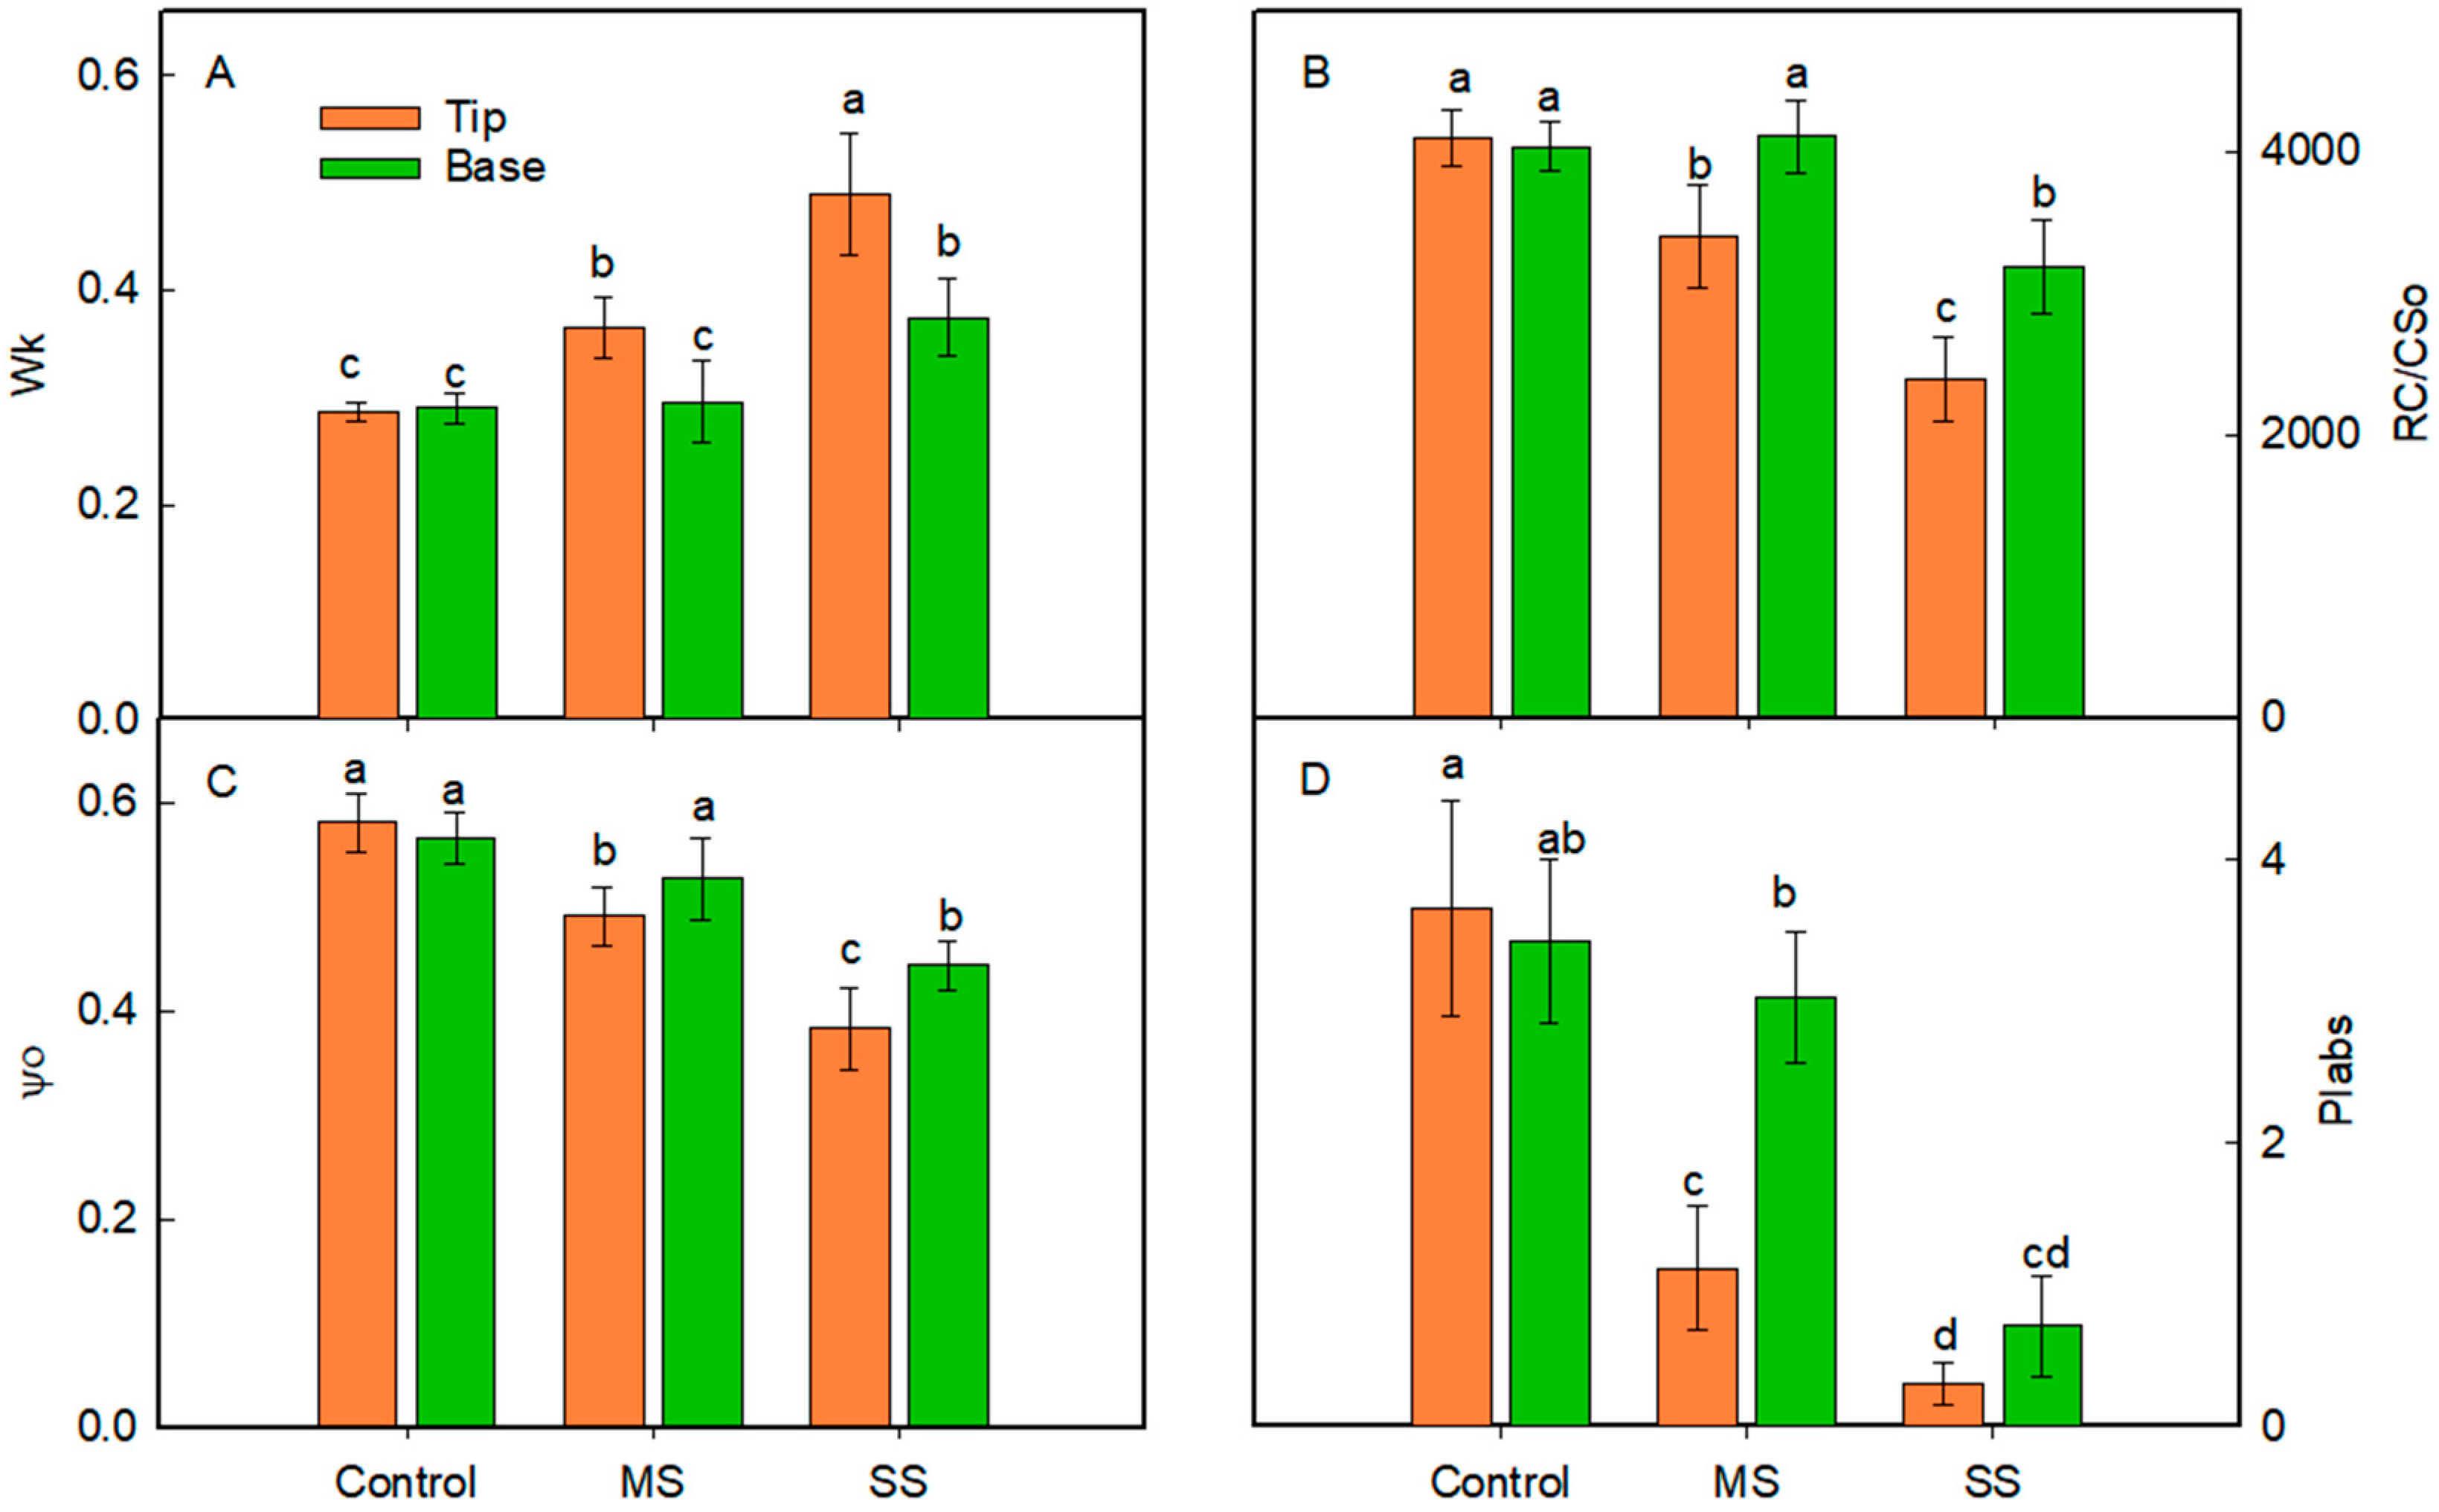
3.4. Changes in the Chlorophyll a Fluorescence Transients

Polyphasic chlorophyll a fluorescence transient was measured to evaluate the changes in the PSII photochemical efficiency at the tip and base of P. humilis under control and SAS conditions. Figure 7 shows that the shapes of OJIP fluorescence transients in the tip and base of the leaf were alike in control plants. The K (0.3 ms) and J (2 ms) steps in the chlorophyll a fluorescence transients increased markedly under MS and SS conditions compared with the control. However, the amplitudes of the K and J steps were greatly increased at the tip of the leaf. It was noticed that, under SS conditions, the most distinct peaks in the ΔVt curves of the leaf tip appeared at the K step (Figure 7C,D); a similar change was also observed in the Wk (Figure 8A), indicating that SAS damaged the oxygen-evolving complex (OEC), (i.e., PSII donor photoinhibition) [43,50].
RC/CSo shows the density of QA-reducing PSII reaction centers, and ψo expresses the probability that a trapped exciton moves an electron into the electron transport chain beyond QA (the photoactivity of PSII acceptor side). Figure 8B,C show that the RC/CSo and ψo values of the leaf tip decreased significantly under MS and SS conditions. However, the RC/CSo and ψo in the leaf base showed no change under MS conditions but decreased under SS conditions compared with the control. The performance index on an absorption basis (PIabs) changed similarly to RC/CSo and ψo (Figure 8D).

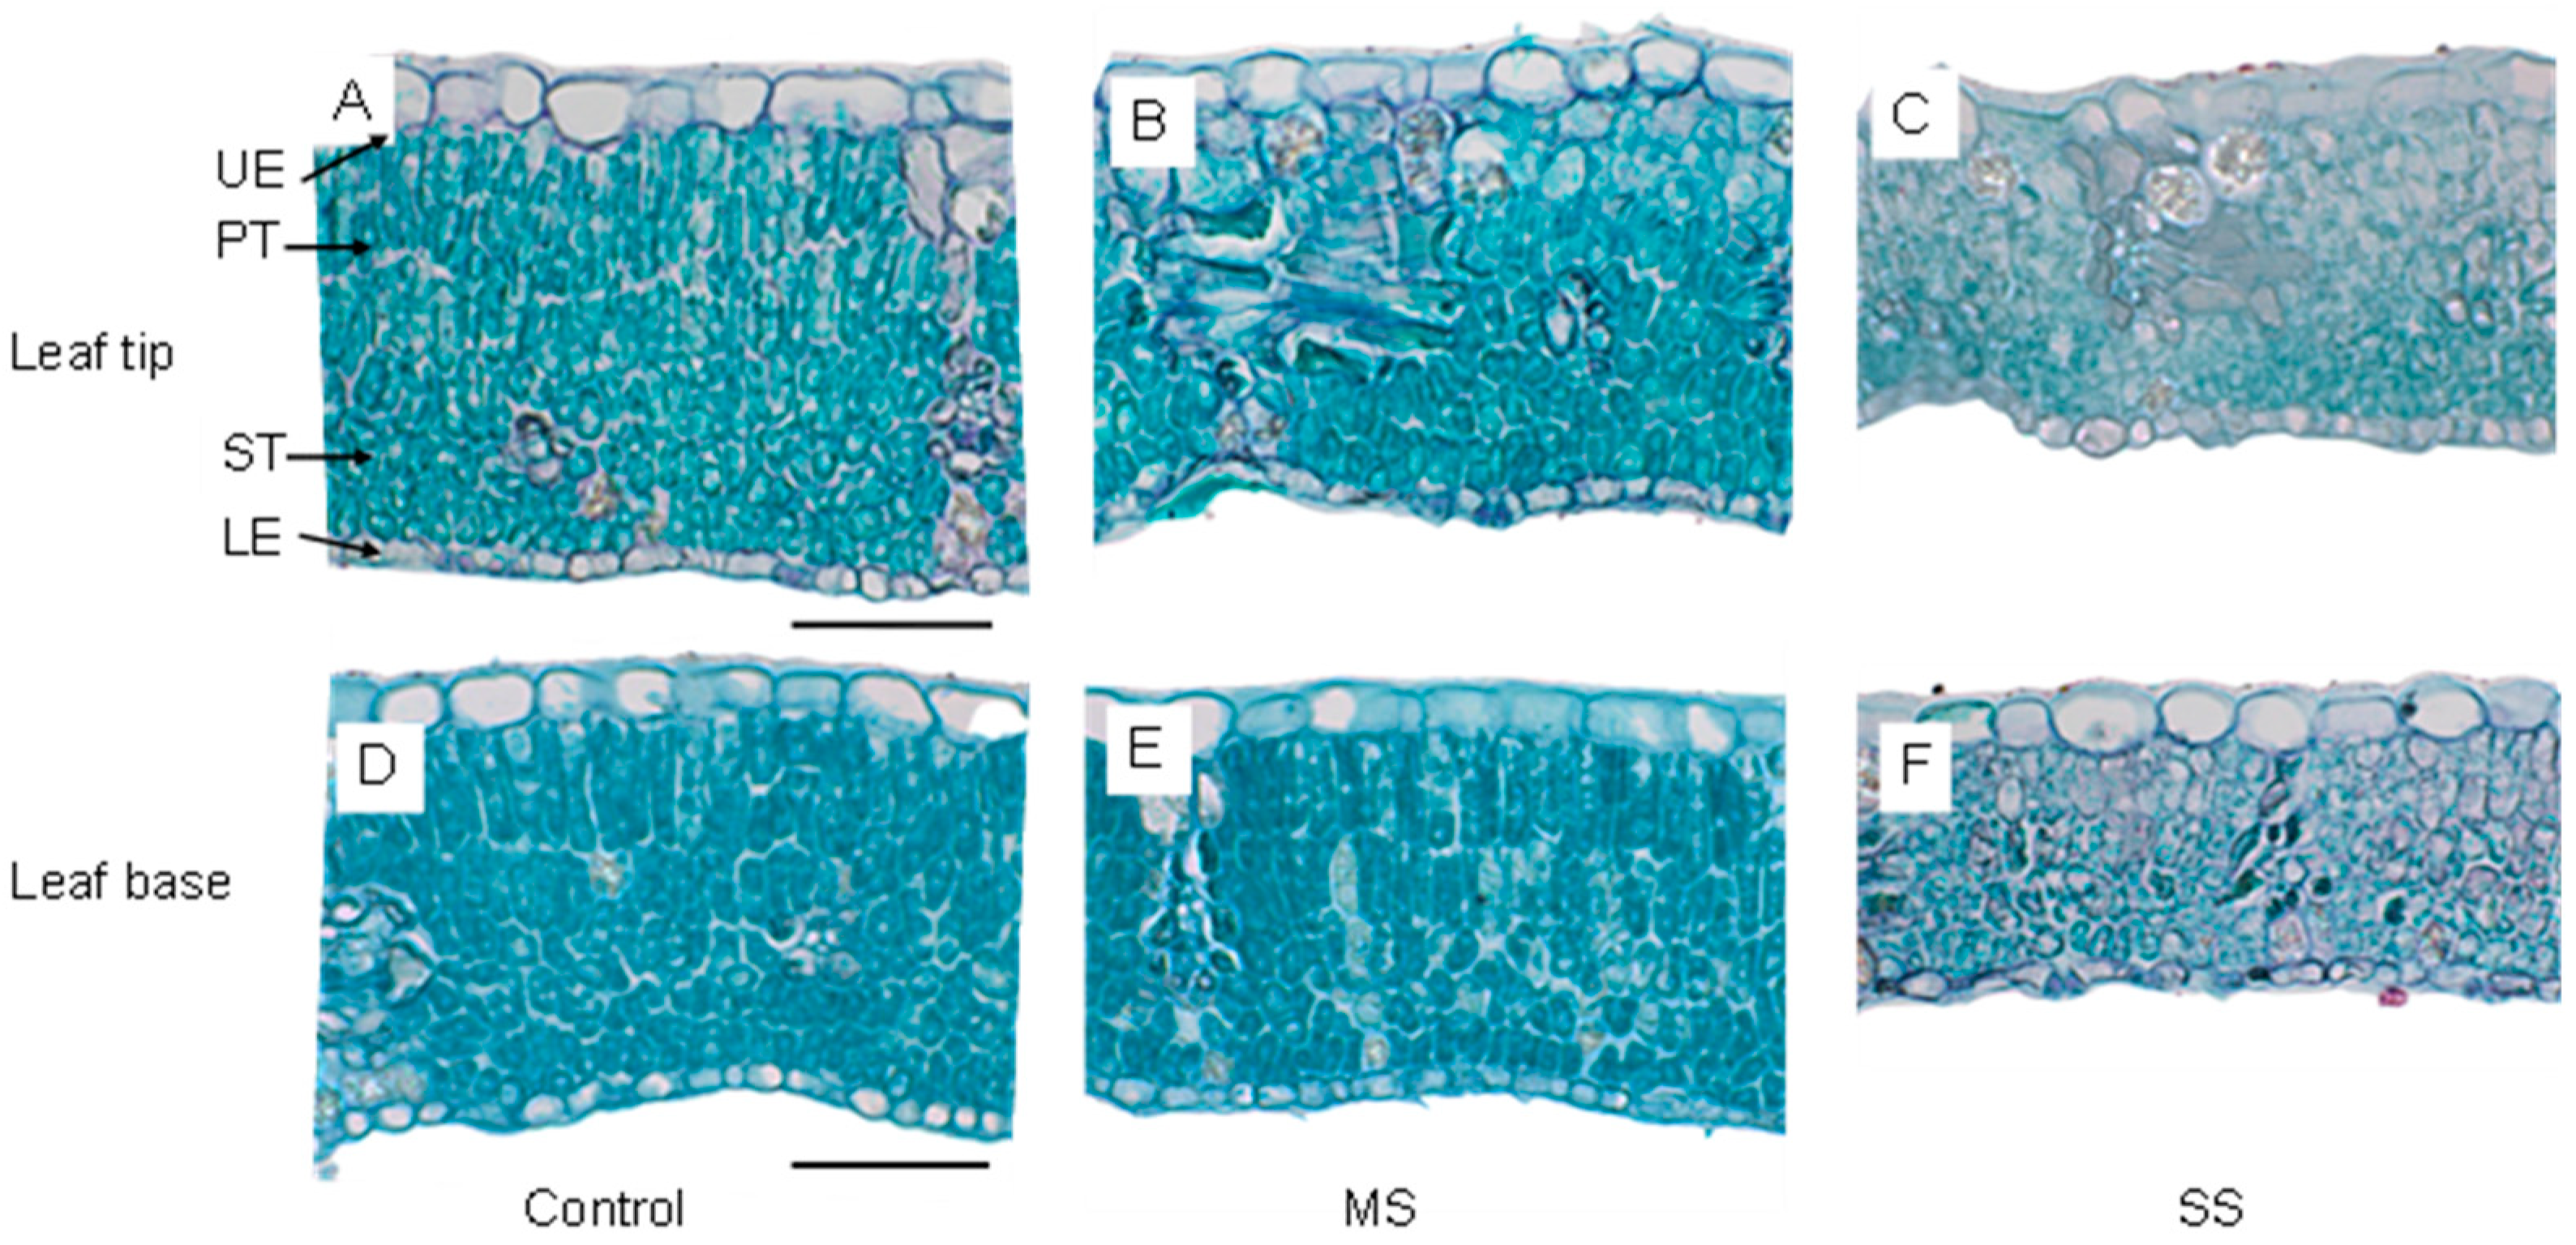
3.5. Changes in Leaf Anatomy

As shown in Figure 8, the cross-sections of P. humilis clearly showed that the structure was made up of the upper epidermis (UE), palisade tissue (PT), spongy tissue (ST), and lower epidermis (LE). Specifically, the palisade tissue had a higher density of cells, and the spongy tissue had a smaller density of cells. Anatomical comparisons showed that the leaf thickness along the leaf blade was markedly reduced under SAS conditions, and the decrease was greater in the leaf tip than in the leaf base. A more striking difference was observed in the palisade tissue in the leaf tip, which became disrupted, loose, and irregularly arranged under MS and SS conditions (Figure 9). Anatomical analyses showed that LT, UE, palisade tissue thickness (PTT), and spongy tissue thickness (STT) in the leaf tip decreased significantly under MS and SS conditions compared to the control. However, LT, PTT, and STT in the leaf base showed no significant change under MS conditions but decreased significantly under SS conditions. In addition, there was a significant increase in the palisade–spongy tissue ratio (PT/ST) under MS conditions, and this increase was greater in the upper leaf position (Table 2), indicating that the anatomical structure in the upper portion of P. humilis leaves was more vulnerable to SAS.

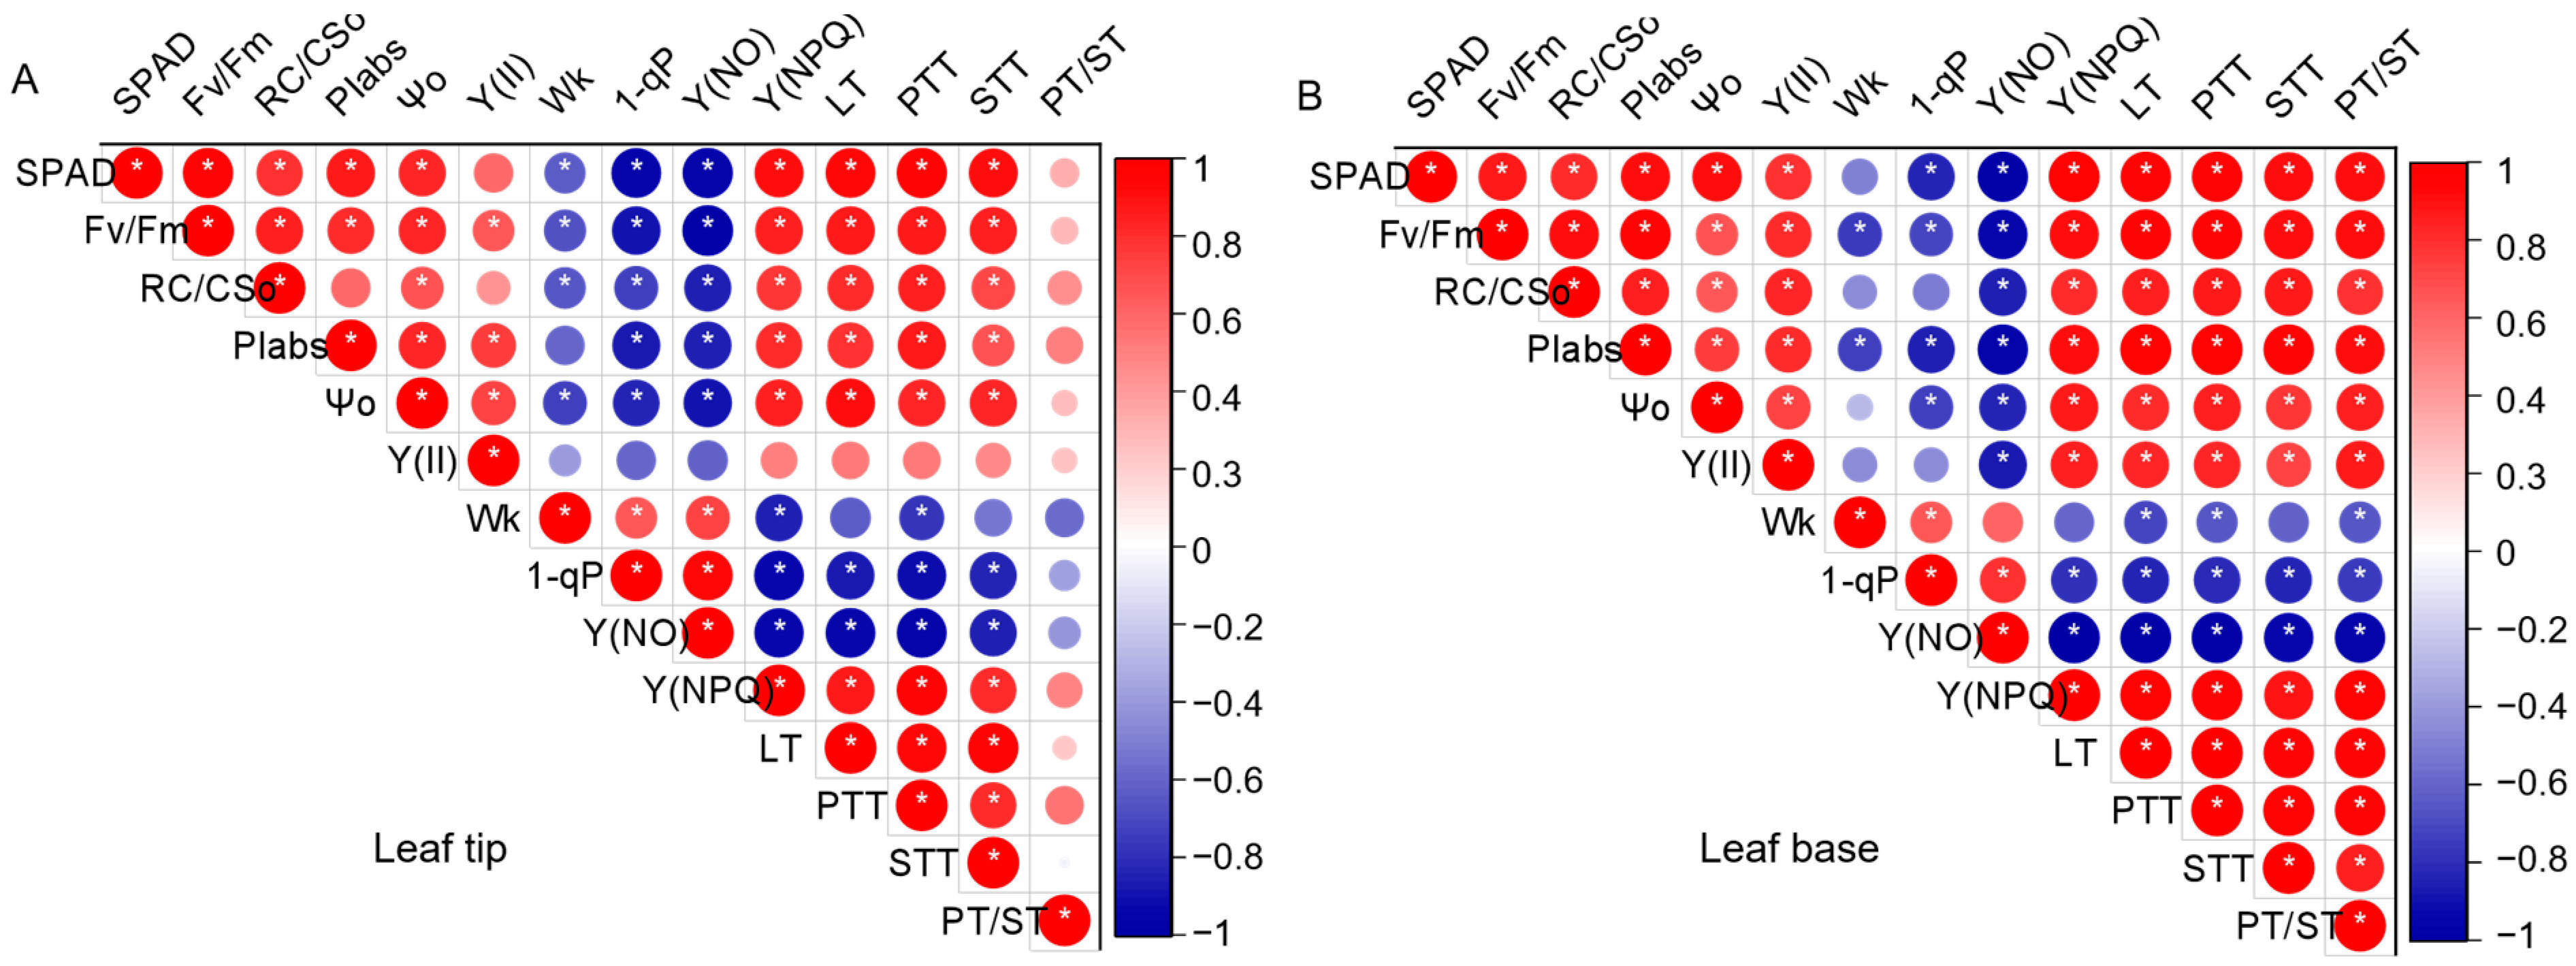
3.6. Correlation Analysis of Chlorophyll Fluorescence Parameters and Anatomical Structure Characteristics of P. humilis

The Pearson correlation analysis results between the chlorophyll fluorescence parameters and the anatomical structure characteristics that were most strongly correlated with the severity of the SAS by covariance analysis are shown in Figure 10. At both the tip and base of the leaf, LT, PTT, and STT were significantly positively correlated with SPAD, Fv/Fm, RC/CSo, Ψo, PIabs, and Y(NPQ) and were significantly negatively correlated with Wk, 1-qP, and Y(NO). In the tip of the leaf, no correlation was found among Y(II), LT, and PT/ST, nor was there an association between other chlorophyll fluorescence parameters and PT/ST, while in the base of the leaf, these relationships became much more significant. Generally, the palisade–spongy tissue ratio (PT/ST) showed the greatest variation between the leaf tip and base.

4. Discussion

Nowadays, SAS is considered one of the most significant abiotic stresses for plants as it can cause irreversible damage to photosynthetic apparatus [16]. Plant photosynthesis is a complex physiological process involved in plant growth and biomass production. Thus, the mechanisms underlying the effects of SAS on photosynthesis may also be complex. Our results show that the levels of intercellular CO2 concentration (Ci) increased with decreases in the levels of net photosynthesis rate (An) and stomatal conductance (Gs), while stomata limitation (Ls) decreased significantly under SAS conditions (Figure 2), demonstrating that SAS disturbs leaf photosynthetic processes through non-stomatal factors [51,52]. Plant photosynthesis function along leaf blades was associated with leaf structural variation [53]. Recently, Villadangos et al. [54] found that leaves exhibit different physiological responses to drought stress from the apex to the petiole. In our study, the values of Fo and Fm changed differentially along the leaf blade under MS conditions, and this change was greater under SS conditions compared with the control (Figure 3); the relative chlorophyll content also decreased less in the base than in the tip of leaf (Figure 4A), indicating that the heterogeneity in the photosynthetic function increased under SAS conditions, which aggravated the complexity of the stress effects in the field.
Generally, the changes in photochemical efficiency induced by salinity are often associated with the suppression of photosystem activities [55], and chlorophyll fluorescence parameters are commonly used to assess the spatial heterogeneity responses of photosystems to abiotic stress [56,57]. Under SAS conditions, a deferential decrease in the maximum quantum yield of PSII (Fv/Fm) values in different parts of the leaf was found (Figure 4B), indicating that SAS caused different degrees of PSII inactivation or damage to different parts of the leaf. MS and SS induced a significant decline in the efficient quantum yield of PSII [Y(II)] (Figure 5A), indicating that the processes that dissipate excess light energy were affected by saline–alkaline stress [56]. In fact, the excess light energy can be divided into the following two parts: the energy that dissipated through the energy quenching (qE)-associated mechanism [Y(NPQ)] and the energy that dissipated through the non-qE pathway [Y(NO)] [58]. Thus, high Y(NPQ) values can be used as an important indicator of photoprotection [59]. In our study, Y(NPQ) increased significantly under MS conditions, and this increase was greater in the leaf base but declined under SS conditions (Figure 4B). On the other hand, Y(NO) and excitation pressure in PSII (1-qP) increased significantly with the increase in SAS levels (Figure 5C and Figure 6). 1-qP can indicate a degree of PQ pool reduction and an estimate of the relative PSII excitation pressure [49]. It is also possible for charge recombination to occur within the PSII reaction center when the PQ pool is over-reduced, decreasing the plant’s capacity to protect itself from photodamage, as evidenced by a higher level of Y(NO) [45]. In fact, a leaf blade is usually not a homogeneous photosynthetic surface [48]. Spatial variation of photosynthesis can be longitudinal along the length of the leaf in drought-exposed plants [60]. According to the abovementioned results, it is suggested that compared to the leaf tip, the base of P. humilis leaves seemed to have a stronger ability to cope with MS. However, the excess light energy induced by SS could lead to high excess light excitation pressure in PSII by increasing the chance of charge recombination within the PSII reaction centers.
Chlorophyll a fluorescence is one of the most powerful and commonly utilized techniques to evaluate plant photosystem performance under salinity stress conditions [16]. In our study, SAS pronouncedly altered the OJIP transients under intense light, which resulted in a much larger increase in the fluorescence intensities at 0.3 ms (K-peak) and 2 ms (J-peak) in the different positions of P. humilis leaves, and this increase was greater in the upper leaf position, suggesting that the performance of the photosynthetic machinery of P. humilis leaves was seriously influenced by SAS (Figure 6). Furthermore, according to the JIP test, the normalized relative variable fluorescence at the K step (Wk) increased significantly in the upper leaf position with the increase in SAS (Figure 7). It has been noted that the K step is an indication of the oxygen-releasing complex (OEC) damage [61], which would lead to a suppression of efficient electron donation to the PSII reaction center [43]. The J-peak can reflect the accumulation of the fraction of reduced QA pool, and an increase in ψo indicates inhibition of the electron transfer from QA to QB on the electron receptor side of PSII [62]. It has been found that the leaf base of rice can be regarded as a stress-protected area, while the middle part and the tip of the leaf are the most sensitive segments [63]. Therefore, our results suggest that SAS influenced photosynthesis partially by disrupting OEC activity and hindering electron transport from QA to QB in PSII, and the photosynthetic performance decreased slower in the leaf base than in the leaf tip.
Leaf anatomy is believed to have an important relationship with photosynthetic capacity [64,65]. Previous studies have found that LT is an important determinant of the leaf photosynthetic rate for its close relation to CO2 diffusion and light energy absorption [31], and the level of the palisade tissue and spongy tissue ratio (PT/ST) can be used to reflect the stress-resistant ability of plants [24]. Here, we found that leaf thickness (LT) and the palisade tissue and spongy tissue ratio (PT/ST) along the leaf blade were markedly reduced under SAS conditions, and the decrease was greater in the leaf tip than in the leaf base (Figure 8; Table 2). Moreover, no correlation was found among Y(II), LT, and PT/ST, nor was there an association between other chlorophyll fluorescence parameters and PT/ST, while in the base of the leaf, these relationships became much more significant (Figure 9). It has been suggested that the part near the leaf base is younger than the part at the leaf tip since meristematic cells are restricted to the leaf basal region [66], and salt stress is correlated with the age of the tissue, which causes more damage to older leaves than to younger leaves [67]. These results indicate that the variable with the greatest variation between the leaf tip and base under SAS conditions was the palisade–spongy tissue ratio (PT/ST), and lower PT/ST may explain the significant differences in photosynthetic characteristics between the leaf tip and leaf base, as the higher palisade tissue implies high mesophyll surface area that benefits the photosynthesis [68].
In conclusion, the photosynthetic performance and anatomical structure in P. humilis leaves showed different sensitivity to saline–alkaline stress along the leaf blade in field conditions. Compared to the leaf base, the electron transport on the donor and acceptor sides of PSII in the upper leaf position tended to be more sensitive to stress, which may lead to potential excess light excitation pressure in PSII by increasing the chance of charge recombination within the PSII reaction centers. Furthermore, the chlorophyll fluorescence parameters showed a significant correlation with the palisade–spongy tissue ratio, suggesting that the heterogeneity pattern of light energy distribution and electron transfer activities in PSII, as a result of a strategy to adapt to environmental changes, may reflect the non-uniformity of leaf anatomy under saline–alkaline stress. A chlorophyll fluorescence analysis also proved to be a good technique for monitoring the non-uniformity of photosynthetic function and leaf anatomy under saline–alkaline stress. Our study is helpful for understanding the long-term saline–alkaline stress tolerance mechanism of P. humilis growing in the field.

Author Contributions

Conceptualization and methodology J.C. and Y.S.; investigation R.Y. and Z.X.; validation and analysis S.D., S.W., and Q.W.; writing—original draft preparation Q.S. and X.W.; reviewing and editing J.C. and H.X. All authors have read and agreed to the published version of the manuscript.

Funding

This research was funded by the National Key R&D Program of China (2023YFF1304204), the National Natural Science Foundation of China (32001348), the Project of Intergovernmental International Cooperation in Science and Technology Innovation (2019YFE0116500) and College Student Research and Career-creation Program of Beijing (202310022061).

Data Availability Statement

Data are contained within the article.

Conflicts of Interest

The authors declare no conflicts of interest.

References

  1. Du, J.; Yang, H.; Chi, J. A preliminary study of selected strains of the Chinese dwarf cherry tree. China Fruits 1993, 3, 23–24. [Google Scholar]
  2. Song, X.S.; Shang, Z.W.; Yin, Z.P.; Ren, J.; Sun, M.C.; Ma, X.L. Mechanism of xanthophyll–cycle–mediated photoprotection in Cerasus humilis seedlings under water stress and subsequent recovery. Photosynthetica 2011, 49, 523–530. [Google Scholar] [CrossRef]
  3. Mu, X.; Wang, P.; Du, J.; Gao, Y.G.; Zhang, J. Comparison of fruit organic acids and metabolism-related gene expression between Cerasus humilis (Bge.) Sok and Cerasus glandulosa (Thunb.) Lois. PLoS ONE 2018, 13, e0196537. [Google Scholar] [CrossRef]
  4. Mu, X.P.; Aryal, N.; Du, J.M.; Du, J.J. Oil content and fatty acid composition of the kernels of 31 genotypes of Chinese dwarf cherry [Cerasus humilis (Bge.) Sok.]. J. Hortic. Sci. Biotechnol. 2015, 90, 525–529. [Google Scholar] [CrossRef]
  5. Chau, C.F.; Wu, S.H. The development of regulations of Chinese herbal medicines for both medicinal and food uses. Trends Food Sci. Technol. 2006, 17, 313–323. [Google Scholar] [CrossRef]
  6. Pitman, M.G.; Läuchli, A. Global impact of salinity and agricultural ecosystems. In Salinity: Environment—Plants—Molecules; Läuchli, A., Lüttge, U., Eds.; Springer: Dordrecht, The Netherlands, 2002; pp. 3–20. [Google Scholar]
  7. Haj-Amor, Z.; Araya, T.; Kim, D.G.; Bouri, S.; Lee, J.; Ghiloufi, W.; Yang, Y.; Kang, H.; Jhariya, M.K.; Banerjee, A.; et al. Soil salinity and its associated effects on soil microorganisms, greenhouse gas emissions, crop yield, biodiversity and desertification: A review. Sci. Total Environ. 2022, 843, 156946. [Google Scholar] [CrossRef]
  8. Yang, C.; Chong, J.; Li, C.; Kim, C.; Shi, D.; Wang, D. Osmotic adjustment and ion balance traits of an alkali resistant halophyte Kochia sieversiana during adaptation to salt and alkali conditions. Plant Soil 2007, 294, 263–276. [Google Scholar] [CrossRef]
  9. Rao, Y.; Peng, T.; Xue, S. Mechanisms of plant saline-alkaline tolerance. J. Plant Physiol. 2023, 281, 153916. [Google Scholar] [CrossRef]
  10. Wang, W.; Zhang, F.; Sun, L.; Yang, L.; Yang, Y.; Wang, Y.; Siddique, K.H.M.; Pang, J. Alkaline salt Inhibits seed germination and seedling growth of Canola more than neutral salt. Front. Plant Sci. 2022, 13, 814755. [Google Scholar] [CrossRef]
  11. Shi, D.; Wang, D. Effects of various salt-alkaline mixed stresses on Aneurolepidium chinense (Trin.) Kitag. Plant Soil 2005, 271, 15–26. [Google Scholar] [CrossRef]
  12. Parida, A.K.; Das, A.B. Salt tolerance and salinity effects on plants: A review. Ecotoxicol. Environ. Saf. 2005, 60, 324–349. [Google Scholar] [CrossRef] [PubMed]
  13. Gupta, B.; Huang, B. Mechanism of salinity tolerance in plants: Physiological, biochemical, and molecular characterization. Int. J. Genom. 2014, 2014, 701596. [Google Scholar] [CrossRef] [PubMed]
  14. Aung, T.T.; Shi, F.; Zhai, Y.; Xue, J.; Wang, S.; Ren, X.; Zhang, X. Acidic and akaline conditions affect the growth of tree peony plants via altering photosynthetic characteristics, limiting nutrient assimilation, and impairing ROS balance. Int. J. Mol. Sci. 2022, 23, 5094. [Google Scholar] [CrossRef] [PubMed]
  15. Yang, C.W.; Wang, P.; Li, C.Y.; Shi, D.C.; Wang, D.L. Comparison of effects of salt and alkali stresses on the growth and photosynthesis of wheat. Photosynthetica 2008, 46, 107–114. [Google Scholar] [CrossRef]
  16. Zahra, N.; Al Hinai, M.S.; Hafeez, M.B.; Rehman, A.; Wahid, A.; Siddique, K.H.M.; Farooq, M. Regulation of photosynthesis under salt stress and associated tolerance mechanisms. Plant Physiol. Biochem. 2022, 178, 55–69. [Google Scholar] [CrossRef]
  17. Hu, L.; Xiang, L.; Zhang, L.; Zhou, X.; Zou, Z.; Hu, X. The photoprotective role of spermidine in tomato seedlings under salinity–alkalinity stress. PLoS ONE 2014, 9, e110855. [Google Scholar] [CrossRef]
  18. Xiang, L.; Hu, L.; Xu, W.; Zhen, A.; Zhang, L.; Hu, X. Exogenous gamma-aminobutyric acid improves the structure and function of photosystem II in muskmelon seedlings exposed to salinity-alkalinity stress. PLoS ONE 2016, 11, e0164847. [Google Scholar] [CrossRef]
  19. Goussi, R.; Manaa, A.; Derbali, W.; Cantamessa, S.; Abdelly, C.; Barbato, R. Comparative analysis of salt stress, duration and intensity, on the chloroplast ultrastructure and photosynthetic apparatus in Thellungiella salsuginea. J. Photochem. Photobiol. B. 2018, 183, 275–287. [Google Scholar] [CrossRef]
  20. Manaa, A.; Goussi, R.; Derbali, W.; Cantamessa, S.; Abdelly, C.; Barbato, R. Salinity tolerance of quinoa (Chenopodium quinoa Willd) as assessed by chloroplast ultrastructure and photosynthetic performance. Environ. Exp. Bot. 2019, 162, 103–114. [Google Scholar] [CrossRef]
  21. Sun, C.; Li, X.; Guo, J. Relationship between photosystem activity and ultraweak luminescence excitation in Cerasus humilis leaves under salt stress. Plant Physiol. Biochem. 2023, 196, 1032–1045. [Google Scholar] [CrossRef]
  22. Yan, F.; Zhang, J.; Li, W.; Ding, Y.; Zhong, Q.; Xu, X.; Wei, H.; Li, G. Exogenous melatonin alleviates salt stress by improving leaf photosynthesis in rice seedlings. Plant Physiol. Biochem. 2021, 163, 367–375. [Google Scholar] [CrossRef] [PubMed]
  23. Takahashi, S.; Badger, M.R. Photoprotection in plants: A new light on photosystem II damage. Trends Plant Sci. 2011, 16, 53–60. [Google Scholar] [CrossRef] [PubMed]
  24. Chang, Y.; Fan, Y.; Li, Z.; Lv, G. Relationship between photosynthetic characteristics, anatomical structure, and physiological indexes of two halophytes in different habitats. Forests 2022, 13, 2189. [Google Scholar] [CrossRef]
  25. Zulfiqar, F.; Moosa, A.; Ferrante, A.; Darras, A.; Ahmed, T.; Jalil, S.; Al-Ashkar, I.; Sabagh, A.E. Melatonin seed priming improves growth and physio-biochemical aspects of Zinnia elegans under salt stress. Sci. Hortic. 2024, 323, 112495. [Google Scholar] [CrossRef]
  26. Killi, D.; Haworth, M. Diffusive and metabolic constraints to photosynthesis in quinoa during drought and salt stress. Plants 2017, 6, 49. [Google Scholar] [CrossRef]
  27. Pompelli, M.F.; Ferreira, P.P.B.; Chaves, A.R.M.; Figueiredo, R.C.B.Q.; Martins, A.O.; Jarma-Orozco, A.; Bhatt, A.; Batista-Silva, W.; Endres, L.; Araújo, W.L. Physiological, metabolic, and stomatal adjustments in response to salt stress in Jatropha curcas. Plant Physiol. Biochem. 2021, 168, 116–127. [Google Scholar] [CrossRef]
  28. Li, Q.; Wen, J.; Zhao, C.-Z.; Zhao, L.-C.; Ke, D. The relationship between the main leaf traits and photosynthetic physiological characteristics of Phragmites australis under different habitats of a salt marsh in Qinwangchuan, China. AoB Plants 2022, 14, plac054. [Google Scholar] [CrossRef] [PubMed]
  29. Li, Q.; Zhao, C.-Z.; Wen, J.; Kang, M.; Li, X. Fractal analysis of root architecture responses of Saussurea salsa to a gradient of flooding intensity and salinity. Plant Soil 2022, 471, 669–683. [Google Scholar] [CrossRef]
  30. Wright, I.J.; Reich, P.B.; Westoby, M.; Ackerly, D.D.; Baruch, Z.; Bongers, F.; Cavender-Bares, J.; Chapin, T.; Cornelissen, J.H.; Diemer, M.; et al. The worldwide leaf economics spectrum. Nature 2004, 428, 821–827. [Google Scholar] [CrossRef]
  31. Terashima, I.; Araya, T.; Miyazawa, S.-I.; Sone, K.; Yano, S. Construction and Maintenance of the Optimal Photosynthetic Systems of the Leaf, Herbaceous Plant and Tree: An Eco-developmental Treatise. Ann. Bot. 2005, 95, 507–519. [Google Scholar] [CrossRef]
  32. Klich, M.G. Leaf variations in Elaeagnus angustifolia related to environmental heterogeneity. Environ. Exp. Bot. 2000, 44, 171–183. [Google Scholar] [CrossRef] [PubMed]
  33. Czesnick, H.; Lenhard, M. Size control in plants-lessons from leaves and flowers. CSH Perspect. Biol. 2015, 7, a019190. [Google Scholar] [CrossRef] [PubMed]
  34. de Oliveira, V.P.; Lima, M.D.R.; da Silva, B.R.S.; Batista, B.L.; da Silva Lobato, A.K. Brassinosteroids confer tolerance to salt stress in Eucalyptus urophylla plants enhancing homeostasis, antioxidant metabolism and leaf Anatomy. J. Plant Growth Regul. 2019, 38, 557–573. [Google Scholar] [CrossRef]
  35. Wang, C.; Zhou, J.; Xiao, H.; Liu, J.; Wang, L. Variations in leaf functional traits among plant species grouped by growth and leaf types in Zhenjiang, China. J. For. Res. 2017, 28, 241–248. [Google Scholar] [CrossRef]
  36. Yin, Z.; Ren, J.; Zhou, L.; Sun, L.; Wang, J.; Liu, Y.; Song, X. Water deficit mechanisms in perennial shrubs Cerasus humilis leaves revealed by physiological and proteomic analyses. Proteome Sci. 2016, 15, 9. [Google Scholar] [CrossRef] [PubMed]
  37. Sun, L.N.; Wang, F.; Wang, J.W.; Sun, L.J.; Gao, W.R.; Song, X.S. Overexpression of the ChVDE gene, encoding a violaxanthin de-epoxidase, improves tolerance to drought and salt stress in transgenic Arabidopsis. 3 Biotech 2019, 9, 197. [Google Scholar] [CrossRef]
  38. Wang, F.; Wang, J.W.; Sun, L.J.; Song, X.S. The molecular cloning and functional characterization of ChNAC1, a NAC transcription factor in Cerasus humilis. Plant Growth Regul. 2019, 89, 331–343. [Google Scholar] [CrossRef]
  39. Tianjiao, F.; Dong, W.; Ruoshui, W.; Yixin, W.; Zhiming, X.; Fengmin, L.; Yuan, M.; Xing, L.; Huijie, X.; Caballero-Calvo, A.; et al. Spatial-temporal heterogeneity of environmental factors and ecosystem functions in farmland shelterbelt systems in desert oasis ecotones. Agric. Water Manag. 2022, 271, 107790. [Google Scholar] [CrossRef]
  40. Cao, Q.; Li, J.; Wang, G.; Wang, D.; Xin, Z.; Xiao, H.; Zhang, K. On the spatial variability and influencing factors of soil organic carbon and total nitrogen stocks in a desert oasis ecotone of northwestern China. Catena 2021, 206, 105533. [Google Scholar] [CrossRef]
  41. Yang, F.; Liang, Z.-W.; Wang, Z.-C.; Chen, Y. Relationship between diurnal changes of net photosynthetic rate and influencing factors in rice under saline sodic stress. Rice Sci. 2008, 15, 119–124. [Google Scholar] [CrossRef]
  42. Strasser, B.J.; Strasser, R.J. Measuring Fast Fluorescence Transients to Address Environmental Questions: The JIP Test; Kluwer Academic Publishers: Dordrecht, The Netherlands, 1995; pp. 977–980. [Google Scholar]
  43. Strasser, B.J. Donor side capacity of photosystem II probed by chlorophyll a fluorescence transients. Photosynth. Res. 1997, 52, 147–155. [Google Scholar] [CrossRef]
  44. Kyeong, S.Y.; Ram, B.S.; Gu, L.J. Monitoring of salinity, temperature, and drought stress in grafted watermelon seedlings using chlorophyll fluorescence. Front. Plant Sci. 2021, 12, 786309. [Google Scholar]
  45. Klughammer, C.; Schreiber, U. Complementary PS II quantum yields calculated from simple fluorescence parameters measured by PAM fluorometry and the Saturation Pulse method. PAM Appl. Notes 2008, 1, 27–35. [Google Scholar]
  46. Huner, N.P.A.; Öquist, G.; Sarhan, F. Energy balance and acclimation to light and cold. Trends Plant Sci. 1998, 3, 224–230. [Google Scholar] [CrossRef]
  47. Hawkins, T.S.; Gardiner, E.S.; Comer, G.S. Modeling the relationship between extractable chlorophyll and SPAD–502 readings for endangered plant species research. J. Nat. Conserv. 2009, 17, 123–127. [Google Scholar] [CrossRef]
  48. Yuan, Z.; Cao, Q.; Zhang, K.; Ata-Ul-Karim, S.T.; Tian, Y.; Zhu, Y.; Cao, W.; Liu, X. Optimal leaf positions for SPAD meter measurement in rice. Front. Plant Sci. 2016, 7, 719. [Google Scholar] [CrossRef]
  49. Huner, N.P.A.; Ivanov, A.G.; Wilson, K.E.; Miskiewicz, E.; Krol, M.; Öquist, G. Energy sensing and photostasis in photoautotrophs. In Sensing, Signaling and Cell Adaptation; Storey, K.B., Storey, J.M., Eds.; Elsevier Science: Amsterdam, The Netherlands, 2002; pp. 243–255. [Google Scholar]
  50. Toth, S.Z.; Schansker, G.; Kissimon, J.; Kovacs, L.; Garab, G.; Strasser, R.J. Biophysical studies of photosystem II-related recovery processes after a heat pulse in barley seedlings (Hordeum vulgare L.). J. Plant Physiol. 2005, 162, 181–194. [Google Scholar] [CrossRef]
  51. Ma, X.; Ren, X.; Gao, H.; Wu, X.; Chen, K.; Khan, R. Proteomic, transcriptomic, biochemical, and physio-anatomical analyses provide insights into energy metabolism, light usage, and photosynthesis in cigar tobacco under different light intensities. Ind. Crops Prod. 2023, 198, 116651. [Google Scholar] [CrossRef]
  52. Wu, Y.-W.; Li, Q.; Jin, R.; Chen, W.; Liu, X.-L.; Kong, F.-L.; Ke, Y.-P.; Shi, H.-C.; Yuan, J.-C. Effect of low-nitrogen stress on photosynthesis and chlorophyll fluorescence characteristics of maize cultivars with different low-nitrogen tolerances. J. Integr. Agric. 2019, 18, 1246–1256. [Google Scholar] [CrossRef]
  53. Xiong, D.; Yu, T.; Liu, X.; Li, Y.; Peng, S.; Huang, J. Heterogeneity of photosynthesis within leaves is associated with alteration of leaf structural features and leaf N content per leaf area in rice. Func. Plant Biol. 2015, 42, 687–696. [Google Scholar] [CrossRef]
  54. Villadangos, S.; González, C.; Munné-Bosch, S. Photo-oxidative stress leading to oxylipin accumulation may trigger drought-induced leaf abscission in olive trees. Physiol. Plant. 2023, 175, e13941. [Google Scholar] [CrossRef] [PubMed]
  55. Oukarroum, A.; Bussotti, F.; Goltsev, V.; Kalaji, H.M. Correlation between reactive oxygen species production and photochemistry of photosystems I and II in Lemna gibba L. plants under salt stress. Environ. Exp. Bot. 2015, 109, 80–88. [Google Scholar] [CrossRef]
  56. Sperdouli, I.; Moustakas, M. Spatio-temporal heterogeneity in Arabidopsis thaliana leaves under drought stress. Plant Biol. 2012, 14, 118–128. [Google Scholar] [CrossRef]
  57. Walter, A.; Rascher, U.; Osmond, B. Transitions in photosynthetic parameters of midvein and interveinal regions of leaves and their importance during leaf growth and development. Plant Biol. 2004, 6, 184–191. [Google Scholar] [CrossRef] [PubMed]
  58. Kramer, D.M.; Johnson, G.; Kiirats, O.; Edwards, G.E. New fluorescence parameters for the determination of QA redox state and excitation energy fluxes. Photosynth. Res. 2004, 79, 209. [Google Scholar] [CrossRef]
  59. Baker, N.R. Chlorophyll fluorescence: A probe of photosynthesis in vivo. Annu. Rev. Plant Biol. 2008, 59, 89–113. [Google Scholar] [CrossRef] [PubMed]
  60. Freschi, L.; Takahashi, C.A.; Cambui, C.A.; Semprebom, T.R.; Cruz, A.B.; Mioto, P.T.; de Melo Versieux, L.; Calvente, A.; Latansio-Aidar, S.R.; Aidar, M.P.M.; et al. Specific leaf areas of the tank bromeliad Guzmania monostachia perform distinct functions in response to water shortage. J. Plant Physiol. 2010, 167, 526–533. [Google Scholar] [CrossRef]
  61. Mathur, S.; Jajoo, A.; Mehta, P.; Bharti, S. Analysis of elevated temperature-induced inhibition of photosystem II using chlorophyll a fluorescence induction kinetics in wheat leaves (Triticum aestivum). Plant Biol. 2011, 13, 1–6. [Google Scholar] [CrossRef]
  62. Haldimann, P.; Strasser, R.J. Effects of anaerobiosis as probed by the polyphasic chlorophyll a fluorescence rise kinetic in pea (Pisum sativum L.). Photosynth. Res. 1999, 62, 67–83. [Google Scholar] [CrossRef]
  63. Schaarschmidt, S.; Glaubitz, U.; Erban, A.; Kopka, J.; Zuther, E. Differentiation of the high night temperature response in leaf segments of rice cultivars with contrasting tolerance. Int. J. Mol. Sci. 2021, 22, 10451. [Google Scholar] [CrossRef]
  64. Jiang, C.D.; Wang, X.; Gao, H.Y.; Shi, L.; Chow, W.S. Systemic regulation of leaf anatomical structure, photosynthetic performance, and high-Light tolerance in sorghum. Plant Physiol. 2011, 155, 1416–1424. [Google Scholar] [CrossRef] [PubMed]
  65. Tamang, B.G.; Zhang, Y.; Zambrano, M.A.; Ainsworth, E.A. Anatomical determinants of gas exchange and hydraulics vary with leaf shape in soybean. Ann. Bot. 2023, 131, 909–920. [Google Scholar] [CrossRef] [PubMed]
  66. Conklin, P.A.; Strable, J.; Li, S.; Scanlon, M.J. On the mechanisms of development in monocot and eudicot leaves. New Phytol. 2019, 221, 706–724. [Google Scholar] [CrossRef] [PubMed]
  67. Mitsuya, S.; Yano, K.; Kawasaki, M.; Taniguchi, M.; Miyake, H. Relationship between the distribution of Na and the damages caused by salinity in the leaves of rice seedlings grown under a saline condition. Plant Prod. Sci. 2002, 5, 269–274. [Google Scholar] [CrossRef]
  68. Chartzoulakis, K.; Bosabalidis, A.; Patakas, A.; Vemmos, S. Effects of water stress on water relations, gas exchange and leaf structure of olive tree. Acta Hortic. 2000, 537, 241–247. [Google Scholar] [CrossRef]
Figure 1. Study area located in Dengkou County, Inner Mongolia Autonomous Region, China, and sampling points.
Agriculture 14 01606 g001
Figure 2. Changes in An (A), Gs (B), Ci (C), and LS (D) in P. humilis leaves under control and SAS (moderate, MS; and severe, SS) conditions. Significant differences between leaves subjected to different stress conditions were examined (p < 0.05). Different letters indicate significant differences compared to the control.
Agriculture 14 01606 g002
Figure 3. Representative chlorophyll fluorescence images of Fo and Fm in P. humilis leaves under dark-adapted control and SAS (moderate, MS; and severe, SS) conditions. On the right side of the image are color codes ranging from black to red.
Agriculture 14 01606 g003
Figure 4. Changes in SPAD (A) and Fv/Fm (B) in the tip and base of P. humilis leaves under control and SAS (moderate, MS; and severe, SS) conditions. Significant differences are indicated by different lowercase letters (p < 0.05) between positions in leaves subjected to different stress conditions. The means and SEs were calculated from a total of 6–8 plants.
Agriculture 14 01606 g004
Figure 5. Changes in Y(II) (A), Y(NPQ) (B), and Y(NO) (C) in the tip and base of P. humilis under control and SAS (moderate, MS; and severe, SS) conditions. Different lowercase letters indicate significant differences (p < 0.05) between positions in leaves subjected to different stress conditions. The means and SEs were calculated from a total of 6–8 plants.
Agriculture 14 01606 g005
Figure 6. Changes in PSII excitation pressure (1-qP) in the tip and base of P. humilis under control and SAS (moderate, MS; and severe, SS) conditions. Significant differences are indicated by different lowercase letters (p < 0.05) between positions in leaves subjected to different stress conditions. The means and SEs were calculated from a total of 6–8 plants.
Agriculture 14 01606 g006
Figure 7. Changes in the OJIP transients in the tip (A,C) and base (B,D) of P. humilis under control and SAS (moderate, MS; and severe, SS) conditions. ΔVt (C,D) was obtained by subtracting the kinetics of control leaves from the kinetics of stressed leaves. O indicates the O step at about 20 μs; K indicates the Kstep at about 300 μs; J indicates the J step at about 2 ms; I indicates the I step at about 30 ms; P indicates the P step at about 1 s. The average of six independent measurements is used for each curve.
Agriculture 14 01606 g007
Figure 8. Changes in Wk (A), RC/CSo (B), Ψo (C), and PIabs (D) in the tip and base of P. humilis under control and SAS (moderate, MS; and severe, SS) conditions. Different lowercase letters indicate significant differences (p < 0.05) between positions in leaves subjected to different stress conditions. The means and SEs were calculated from a total of 6–8 plants.
Agriculture 14 01606 g008
Figure 9. Changes in leaf structure images in the tip (AC) and base (DF) under control and SAS (moderate, MS; and severe, SS) conditions.
Agriculture 14 01606 g009
Figure 10. Relationships between chlorophyll fluorescence parameters and anatomical structure characteristics of P. humilis. (A) Leaf tip; (B) leaf base. Asterisk indicates significant correlations (p <  0.05).
Agriculture 14 01606 g010
Table 1. The soil (EC, pH, and VWC) and plant growth (PH and BN) characteristics.
Soil CharacteristicPlant Growth Characteristic
EC (μs·cm−1)pHVWC (%)PH (cm)BN
Control230 ± 98 a7.9 ± 0.13 a24.5 ± 4.95 a13.4 ± 3.85 a72.72 ± 3.83 a
MS517 ± 110 b8.3 ± 0.08 b25.2 ± 1.04 a11 ± 4.45 a58.64 ± 8.58 b
SS1055 ± 105 c9.1 ± 0.3 c25.4 ± 2.17 a4.83 ± 1.33 b41.87 ± 7.3 c
MS, moderate stress; SS, severe stress. Significance is indicated by different lowercase letters (p < 0.05).
Table 2. The changes in anatomical structure parameters in the tip and base of P. humilis under control and SAS (moderate, MS; and severe, SS) conditions.
LT (μm)UE (μm)PTT (μm)STT (μm)LE (μm)PT/ST
ControlTip154.12 ± 2.79 a18.07 ± 1.52 a58.21 ± 3.232 a64.11 ± 2.22 a7.60 ± 0.67 a0.91 ± 0.04 a
Base136.91 ± 6.27 b18.14 ± 1.75 a52.33 ± 4.26 a55.8 ± 3.76 b7.41 ± 0.76 a0.94 ± 0.04 a
MSTip140.68 ± 6.03 b15.13 ± 1.16 b48.61 ± 1.87 b67.6 ± 6.46 a8.09 ± 1.09 a0.73 ± 0.09 b
Base140.71 ± 5.97 b14.96 ± 1.51 b55.92 ± 2.02 a59.83 ± 3.54 bc7.76 ± 0.71 a0.94 ± 0.05 a
SSTip110.10 ± 6.27 c15.48 ±1.17 b33.58 ± 1.33 c50.67 ± 4.54 c8.05 ± 1.33 a0.67 ± 0.06 b
Base91.91 ± 3.47 d14.46 ± 1.24b28.65 ± 0.9040.48 ± 2.12 d7.43 ± 1.11 a0.71 ± 0.04 b
The data are presented as the mean ± SE (standard error). Significance is indicated by different lowercase letters (p < 0.05).
Disclaimer/Publisher’s Note: The statements, opinions and data contained in all publications are solely those of the individual author(s) and contributor(s) and not of MDPI and/or the editor(s). MDPI and/or the editor(s) disclaim responsibility for any injury to people or property resulting from any ideas, methods, instructions or products referred to in the content.

