
Investigation of the Traveling Performance of the Tracked Chassis of a Potato Combine Harvester in Hilly and Mountainous Areas


Abstract
1. Introduction
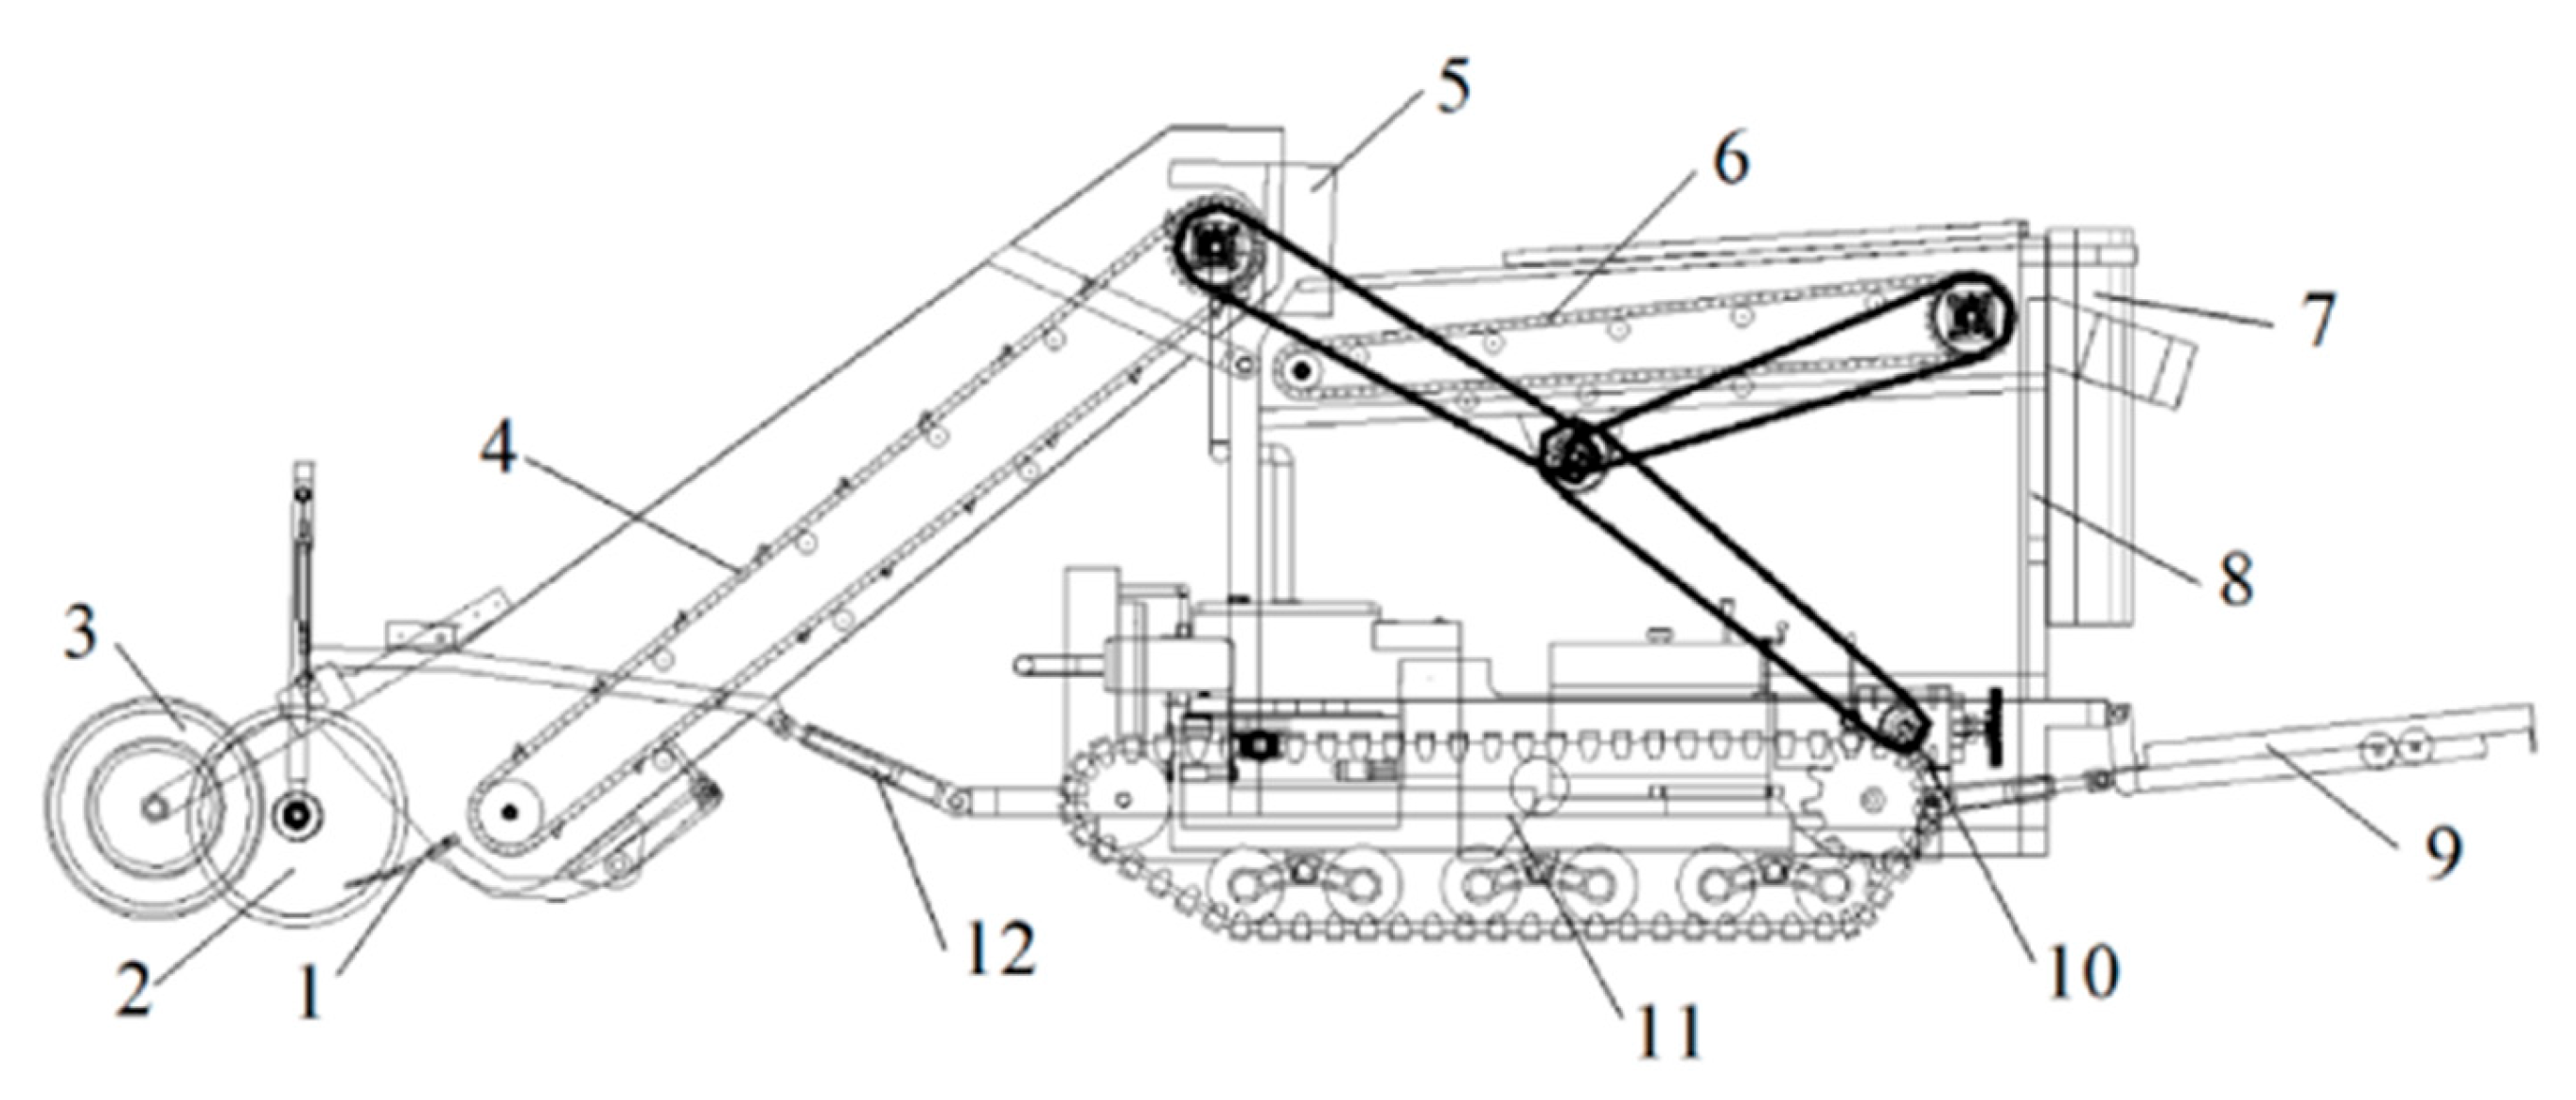
2. Structure and Working Principle of the Machine
2.1. Structure and Main Technical Parameters of the Machine
2.2. Working Principle
3. Structural and Mechanical Analysis of Tracked Chassis
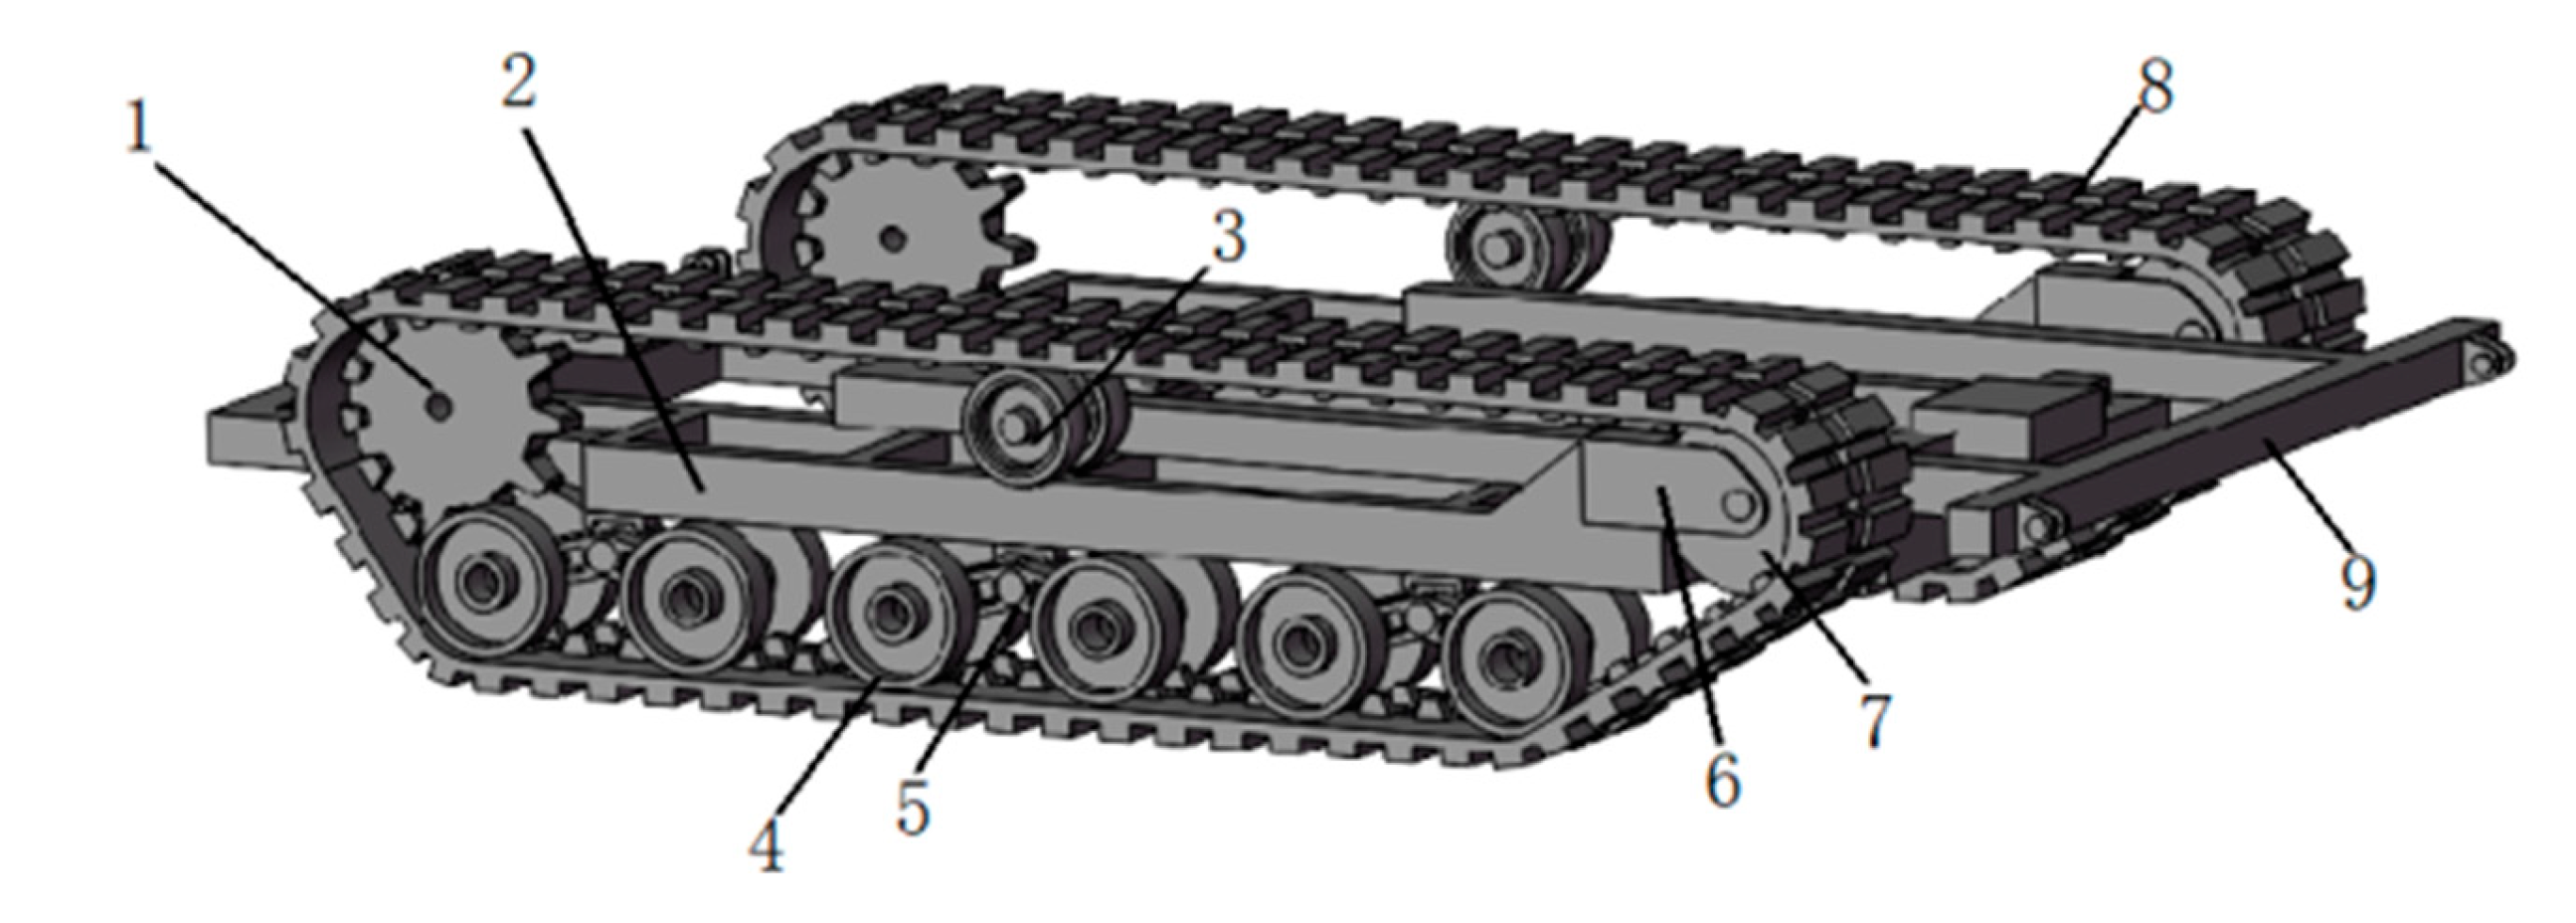
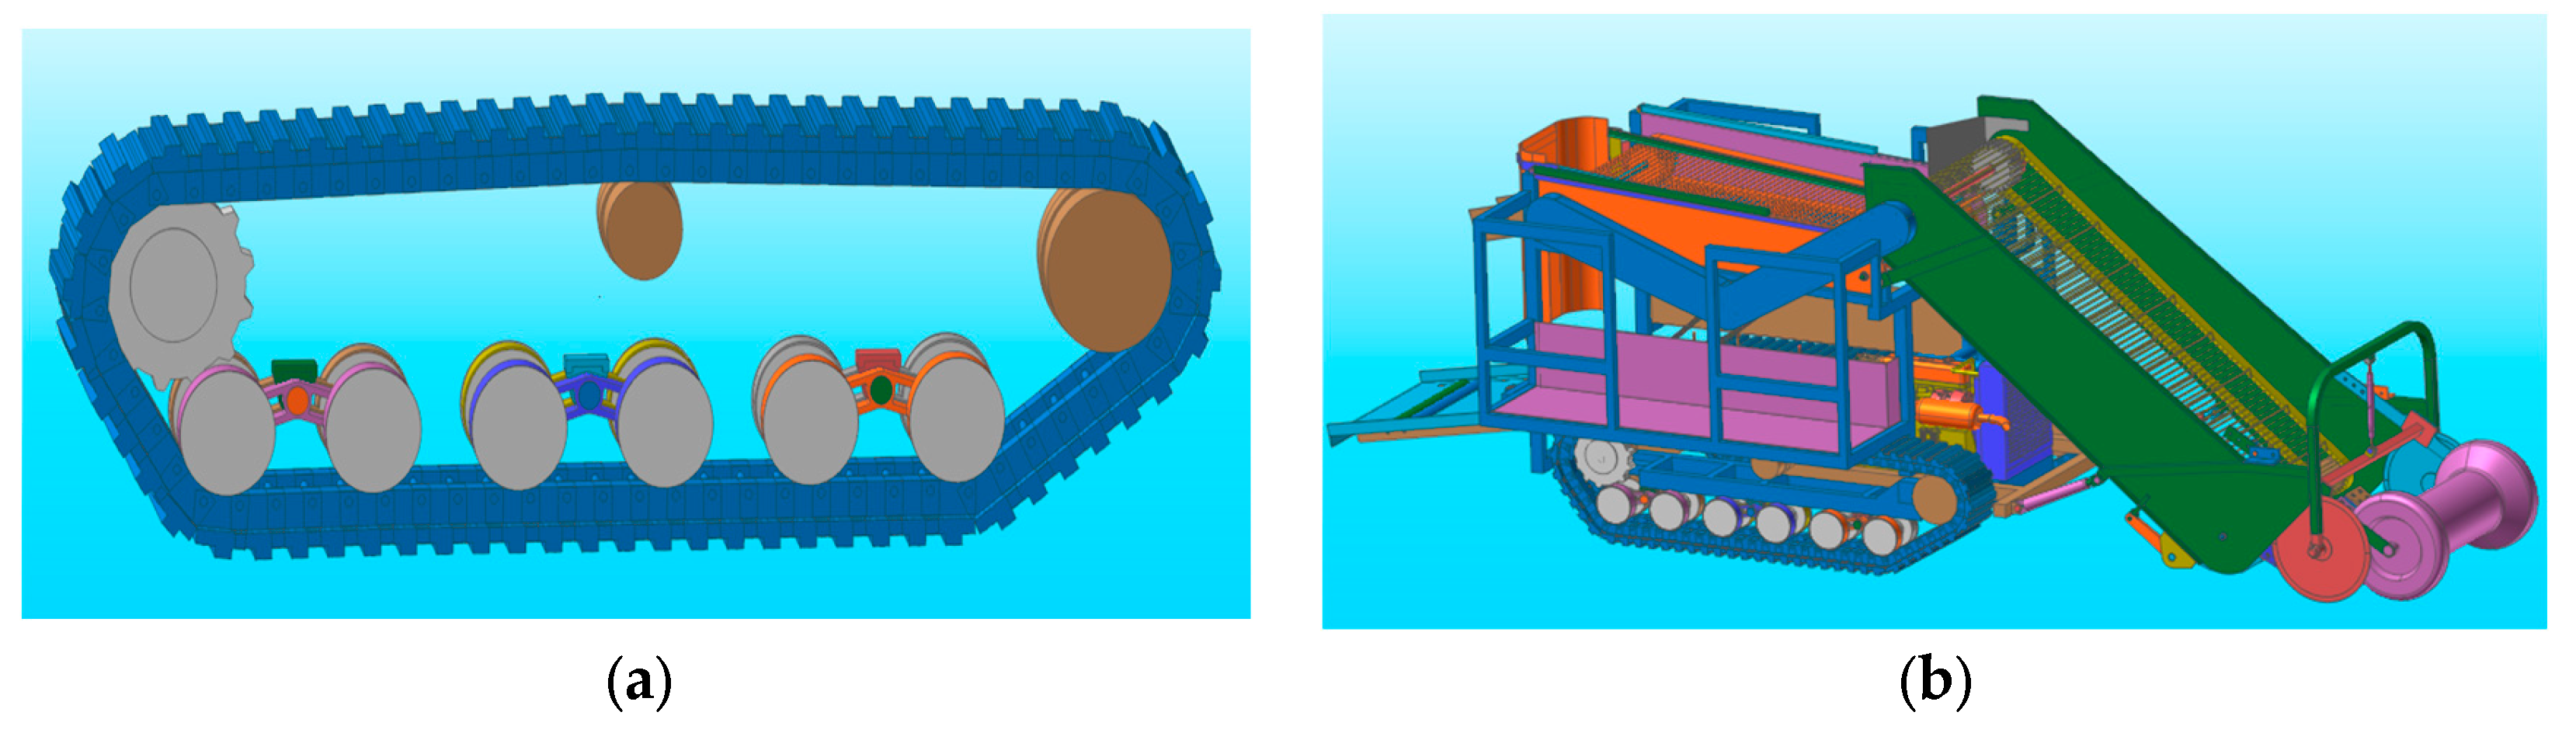
3.1. Chassis Structure and Main Parameters
3.2. Mechanical Analysis of Chassis Wheel System
3.2.1. Driving Wheel
- Td2 is the drive wheel tight side tension, (KN);
- Td1 is the drive wheel loose edge tension, (KN);
- M is the drive wheel torque, (N·m);
- Rd is drive wheel radius, Rd = 0.15 m;
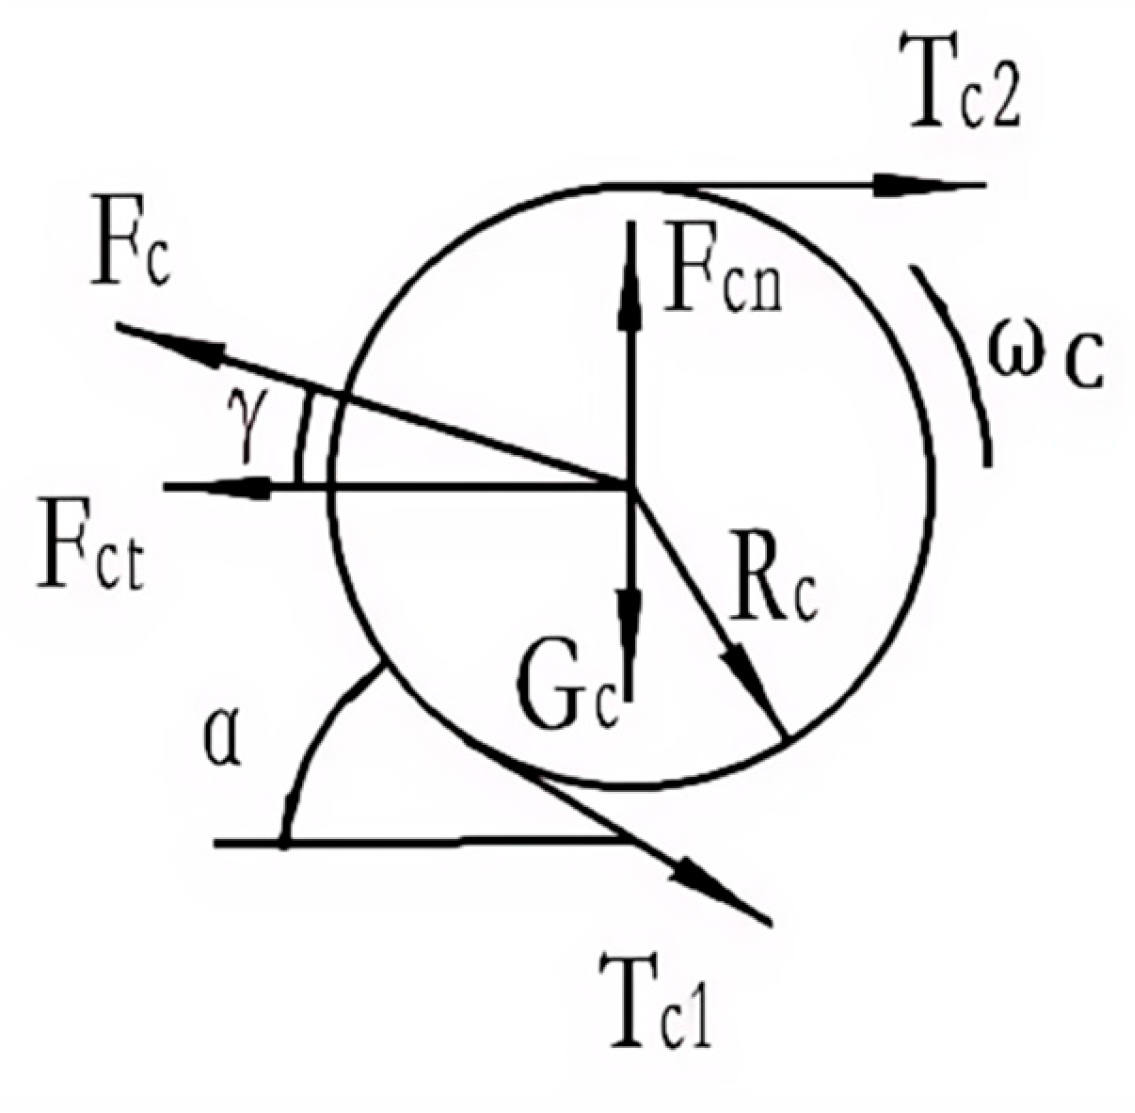
3.2.2. Guide Wheel
- mc is the guide wheel quality;
- Fct is the pre-tensioning force on the track by the tensioning device;
- Fc is the guide pulley centrifugal force;
- γ is the angle between centrifugal force and horizontal line;
- Tc1, Tc2 is the tensioning force on the loose and tight edges of the guide wheel;
- θ is the front angle of tracked chassis;
- Jc is the guide wheel moment of inertia;
- Rc is the guide wheel radius, Rc = 115 mm;
- ωc is the guide wheel angular velocity;
- ρ is the crawler unit mass.
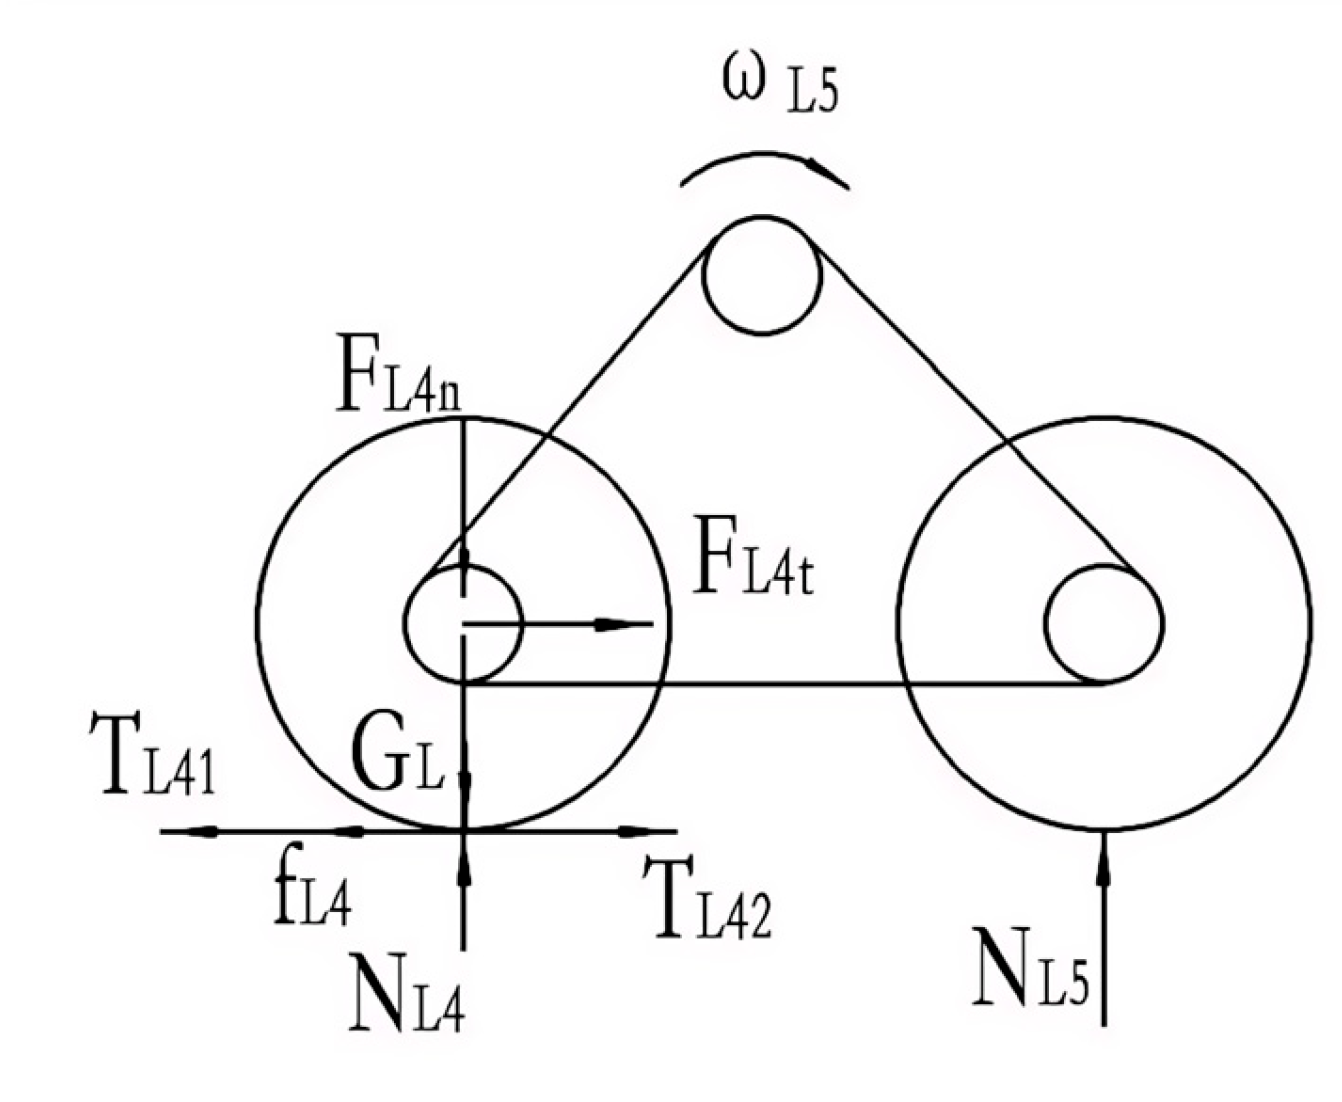
3.2.3. Supporting Wheel
- m1 is the support wheel mass;
- TLi1, TLi2 is the tension at the support wheel;
- RL is the radius of the supporting wheel, RL = 85 mm;
- J1 is the moment of inertia of the supporting wheel;
- fLi is the friction between the supporting wheel and the track;
- FLit, FLin is the support force in the x and y directions of the supporting wheel;
- ωLi is the angular velocity of the supporting wheel.
3.3. Crawler Chassis Travelling Resistance Analysis
3.3.1. Slope Resistance
- Fr1 is the gradient resistance, (KN);
- m is the overall quality, (m = 3100 kg);
- g is the gravitational acceleration, (m/s2);
- θ is the road gradient, (°).
3.3.2. Steering Resistance
- Fr2 is the steering resistance, (KN);
- β is the additional drag coefficient when steering, (β = 1.15);
- μ is the friction factor between the track and ground;
- G is the potato harvester deadweight, (m = 3100 kg);
- B is the track center distance, (B = 1.19 m);
- L is the track grounding length, (L = 1.6 m).
3.3.3. Soil Deformation Resistance
- ω1 is the operational specific resistance, (ω1 = 0.09);
- m is the overall quality, (m = 3100 kg);
- g is the gravitational acceleration, (m/s2);
- θ is the road gradient, (°).
3.3.4. Resistance within the Travelling Unit
- FA, FB is the counterforce on drive wheel bearings on both sides, (KN);
- μ0 is the drive wheel pitch circle diameter, (m);
- d0 is the drive wheel pin diameter, (m);
- μ0 is the friction factor between the drive wheel pin and bushing, (μ0 = 0.1).
- FT is the track loose edge tension, (KN);
- D1 is the guide wheel outer diameter, ();
- d1 is the guide wheel pin diameter, (m);
- μ1 is the friction factor between the guide wheel pin and bushing, (μ1 = 0.1).
- G0 is the total gravity acting on the track, (KN);
- DP is the outer diameter of the supporting wheel, (m);
- d2 is the diameter of the support wheel pin, (m);
- f is the rolling resistance coefficient, (f = 0.03~0.05);
- μ2 is the friction factor between the support wheel pin and sleeve, (μ2 = 0.1).
- FC is the track tension, (KN);
- μ3 is the friction factor between the pin and hole;
- d3 is the track pin diameter, (m);
- z is the number of drive wheel teeth;
- t is the track pitch, (m).
4. Crawler Chassis Drivability Analysis
4.1. Cross-Slope Travelling Stability Analysis and Passability Calculation
- ψh is the coefficient of lateral attachment of tracks to the ground, (ψh = 0.55~0.68);
- G is the gravitational force, (N);
- γ is the horizontal slope, (°).
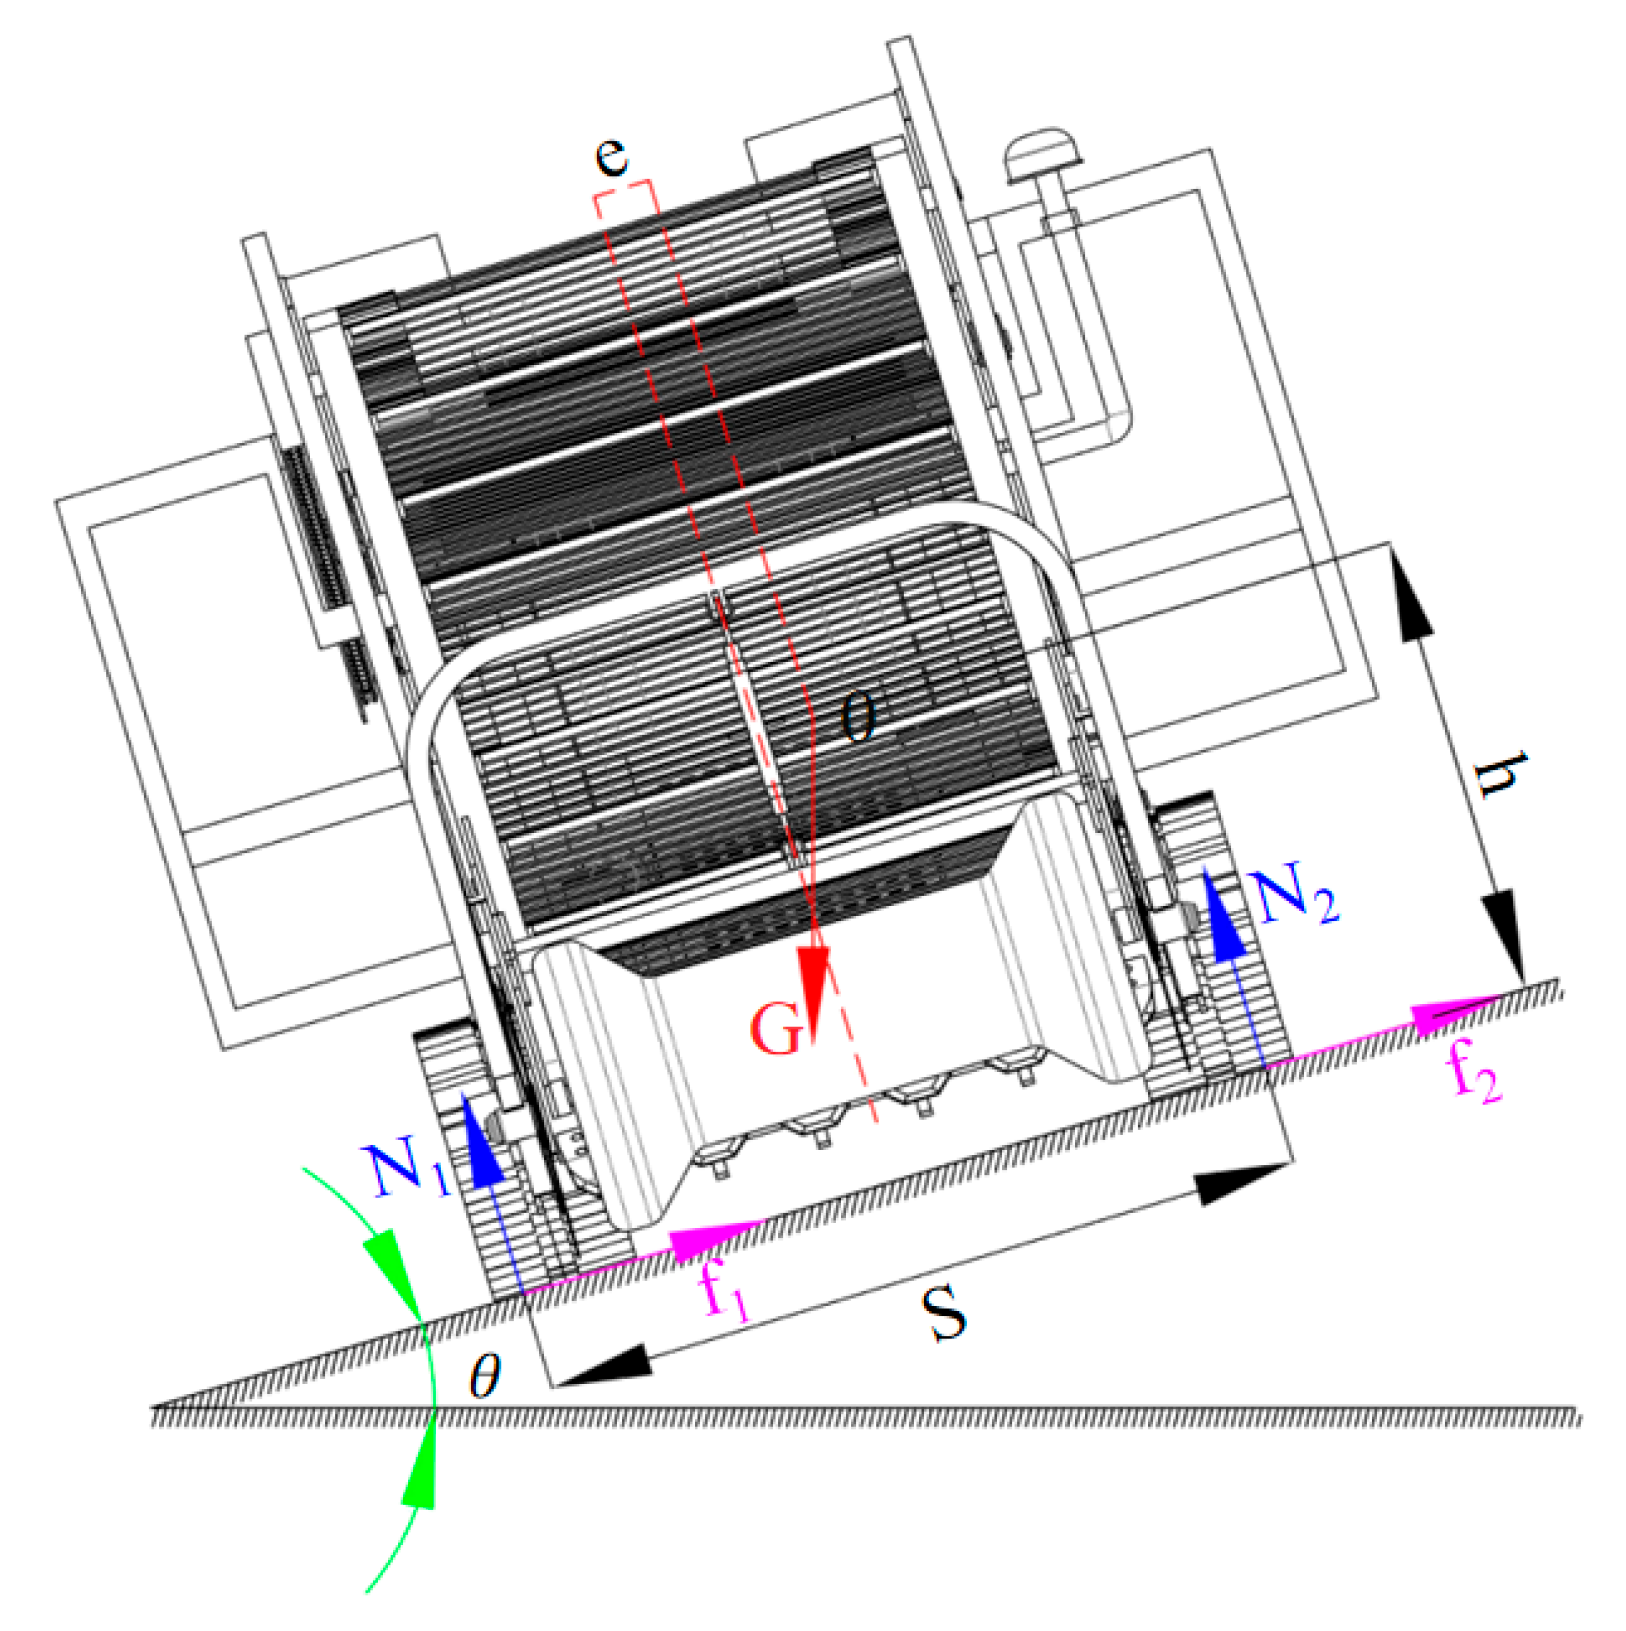
- N2 is the ground support force on the right supporting wheel in the transverse direction;
- S is the distance from the track, (mm);
- e is the center of the mass offset, (mm).
- γmax is the maximum cross slope gradient, (°);
- S is the distance from the track, (mm);
- h is the center of gravity, (mm).
4.2. Longitudinal Slope Travelling Stability Analysis and Passability Calculation
4.3. Analysis of Stability and Passability Calculation for Crossing Vertical Walls
4.4. Analysis of Stability and Passability Calculation for Crossing Trenches
- L is the distance between the drive wheel and guide wheel, (mm);
- r1 is the guide wheel radius, (r1 = 115 mm);
- r2 is the drive wheel radius, (r2 = 150 mm).
5. Simulation Analysis of the Passability of Tracked Chassis
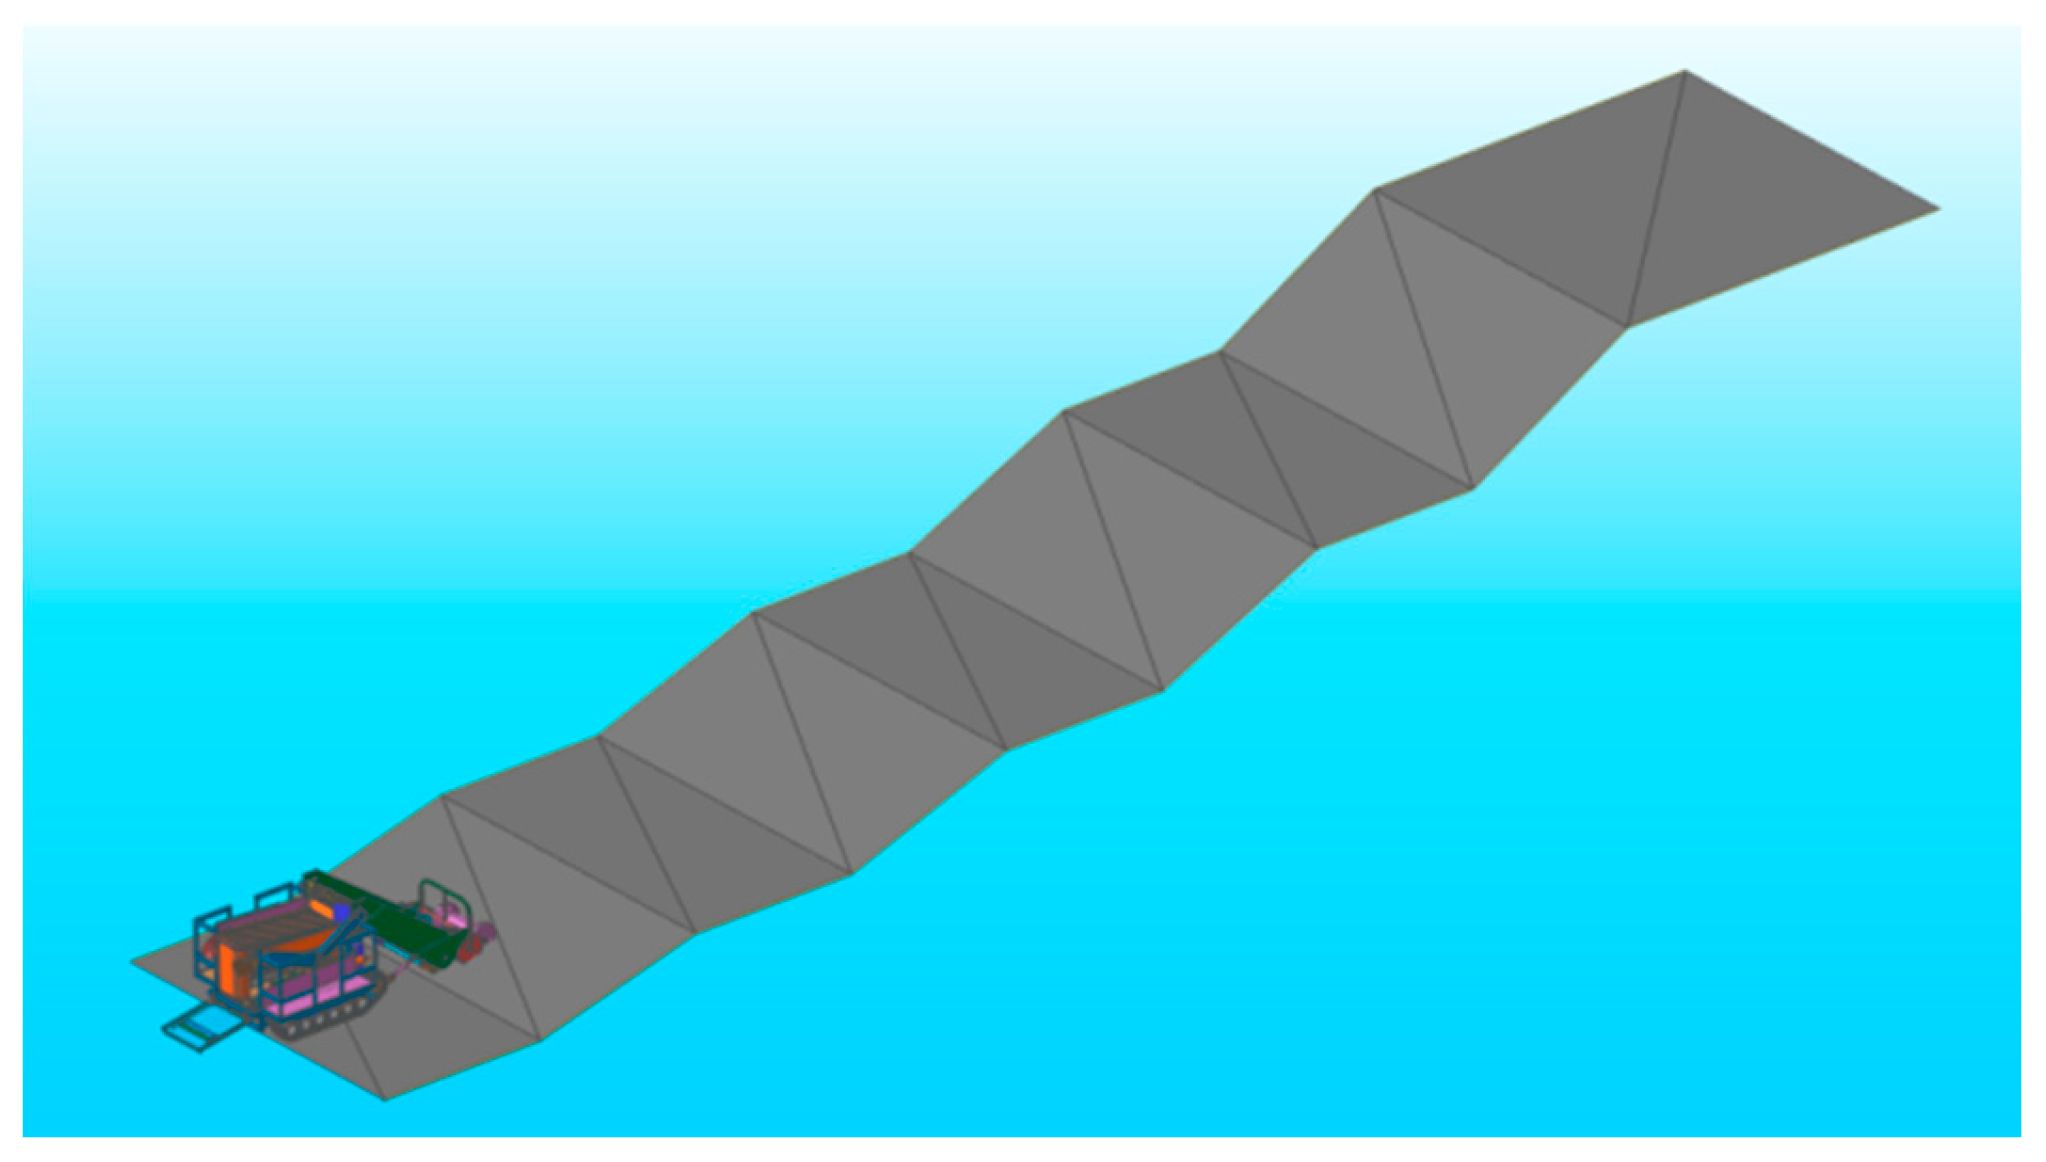
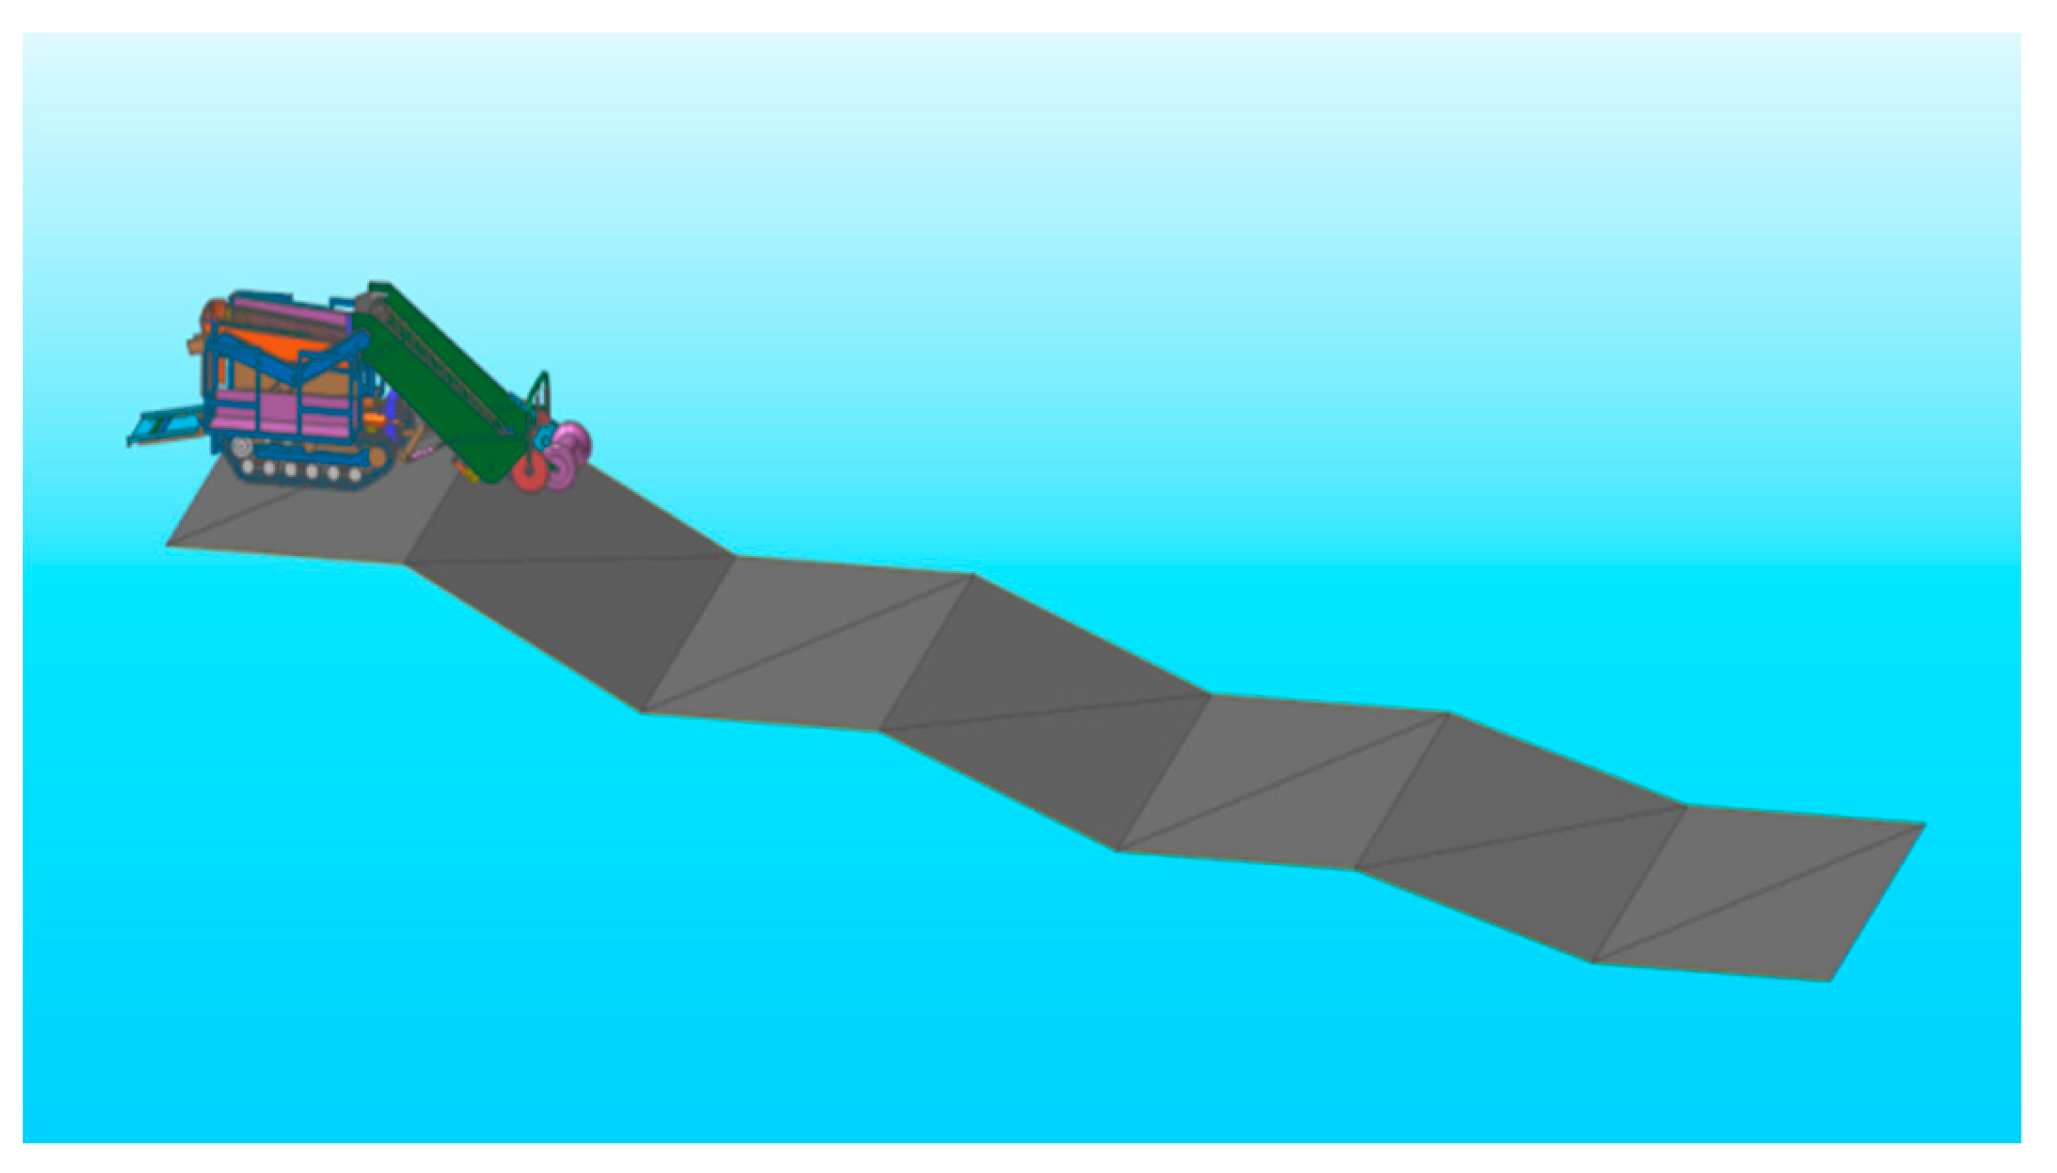
5.1. Creating Virtual Prototypes
5.2. Analysis of Simulation Results
5.2.1. Simulation Analysis of Transverse Slope Driving Throughput
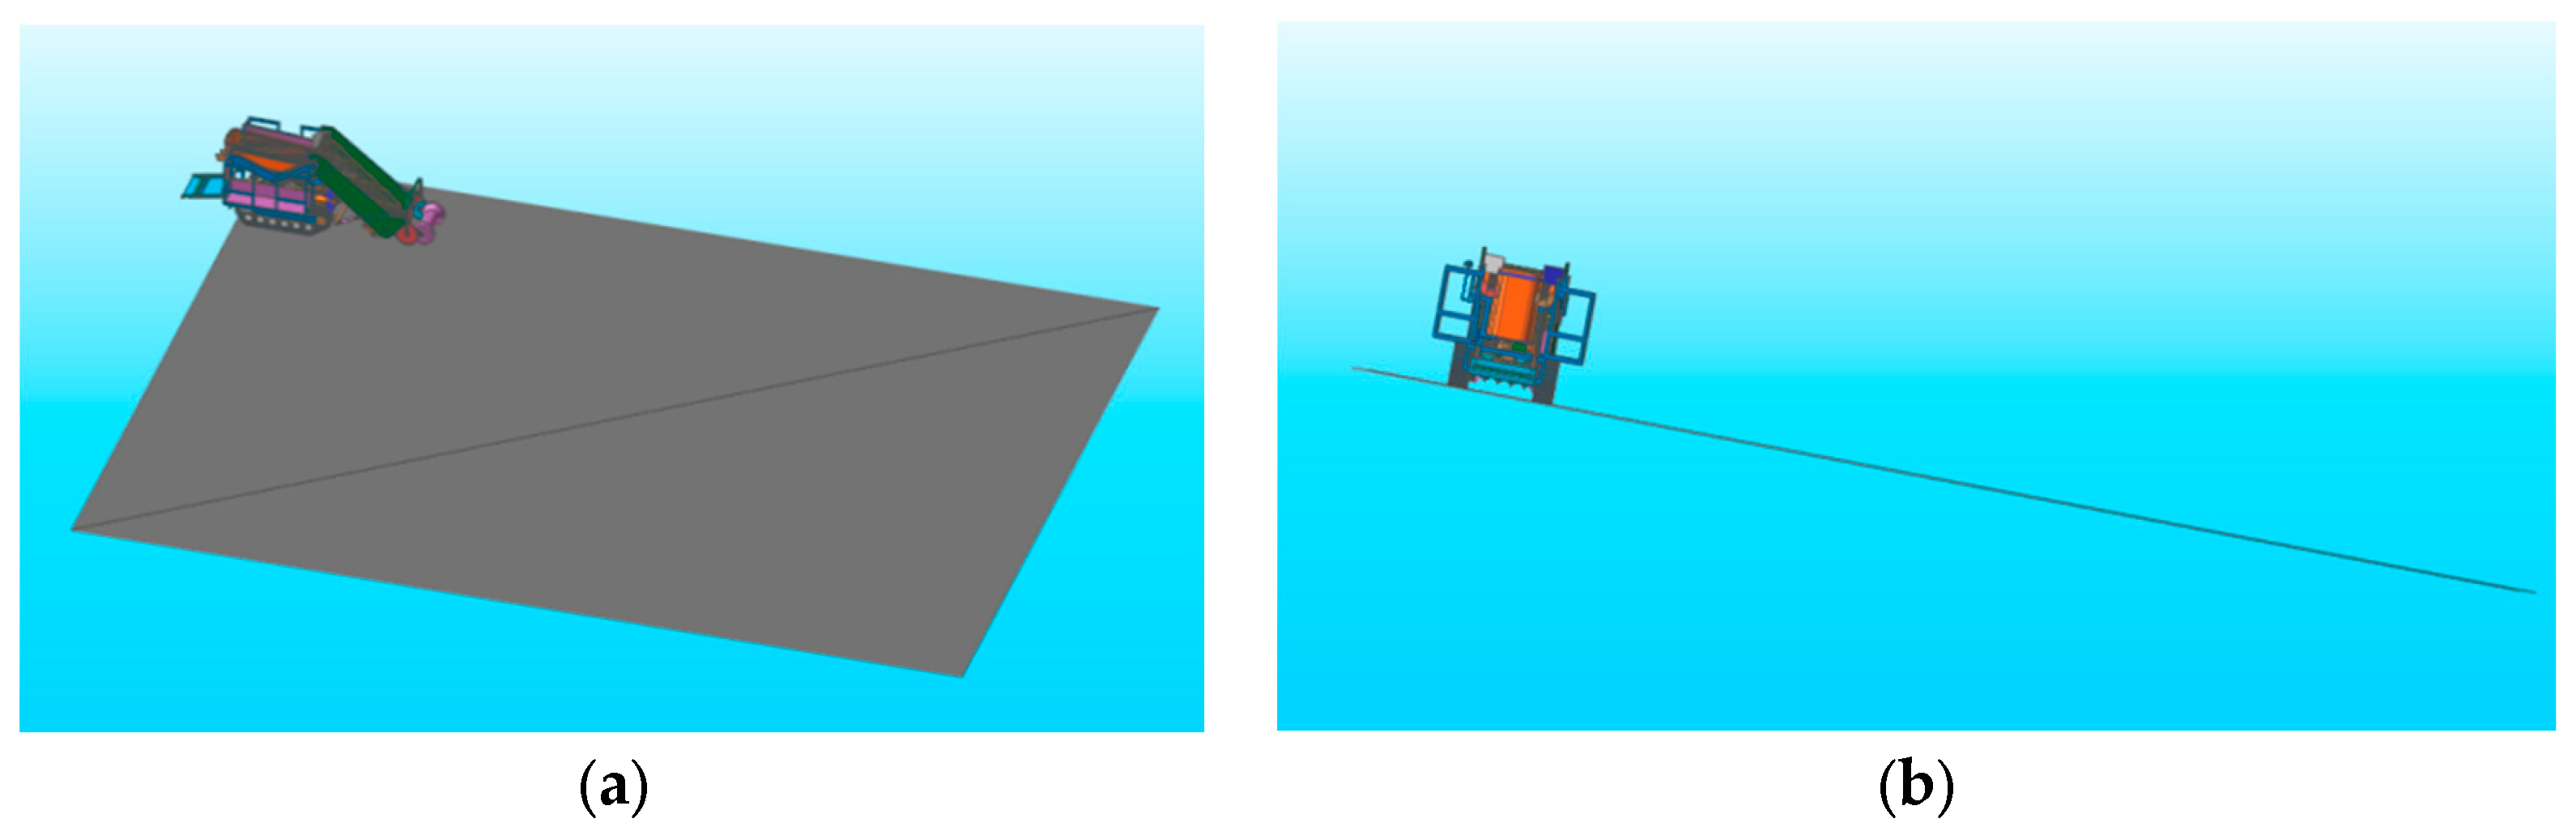
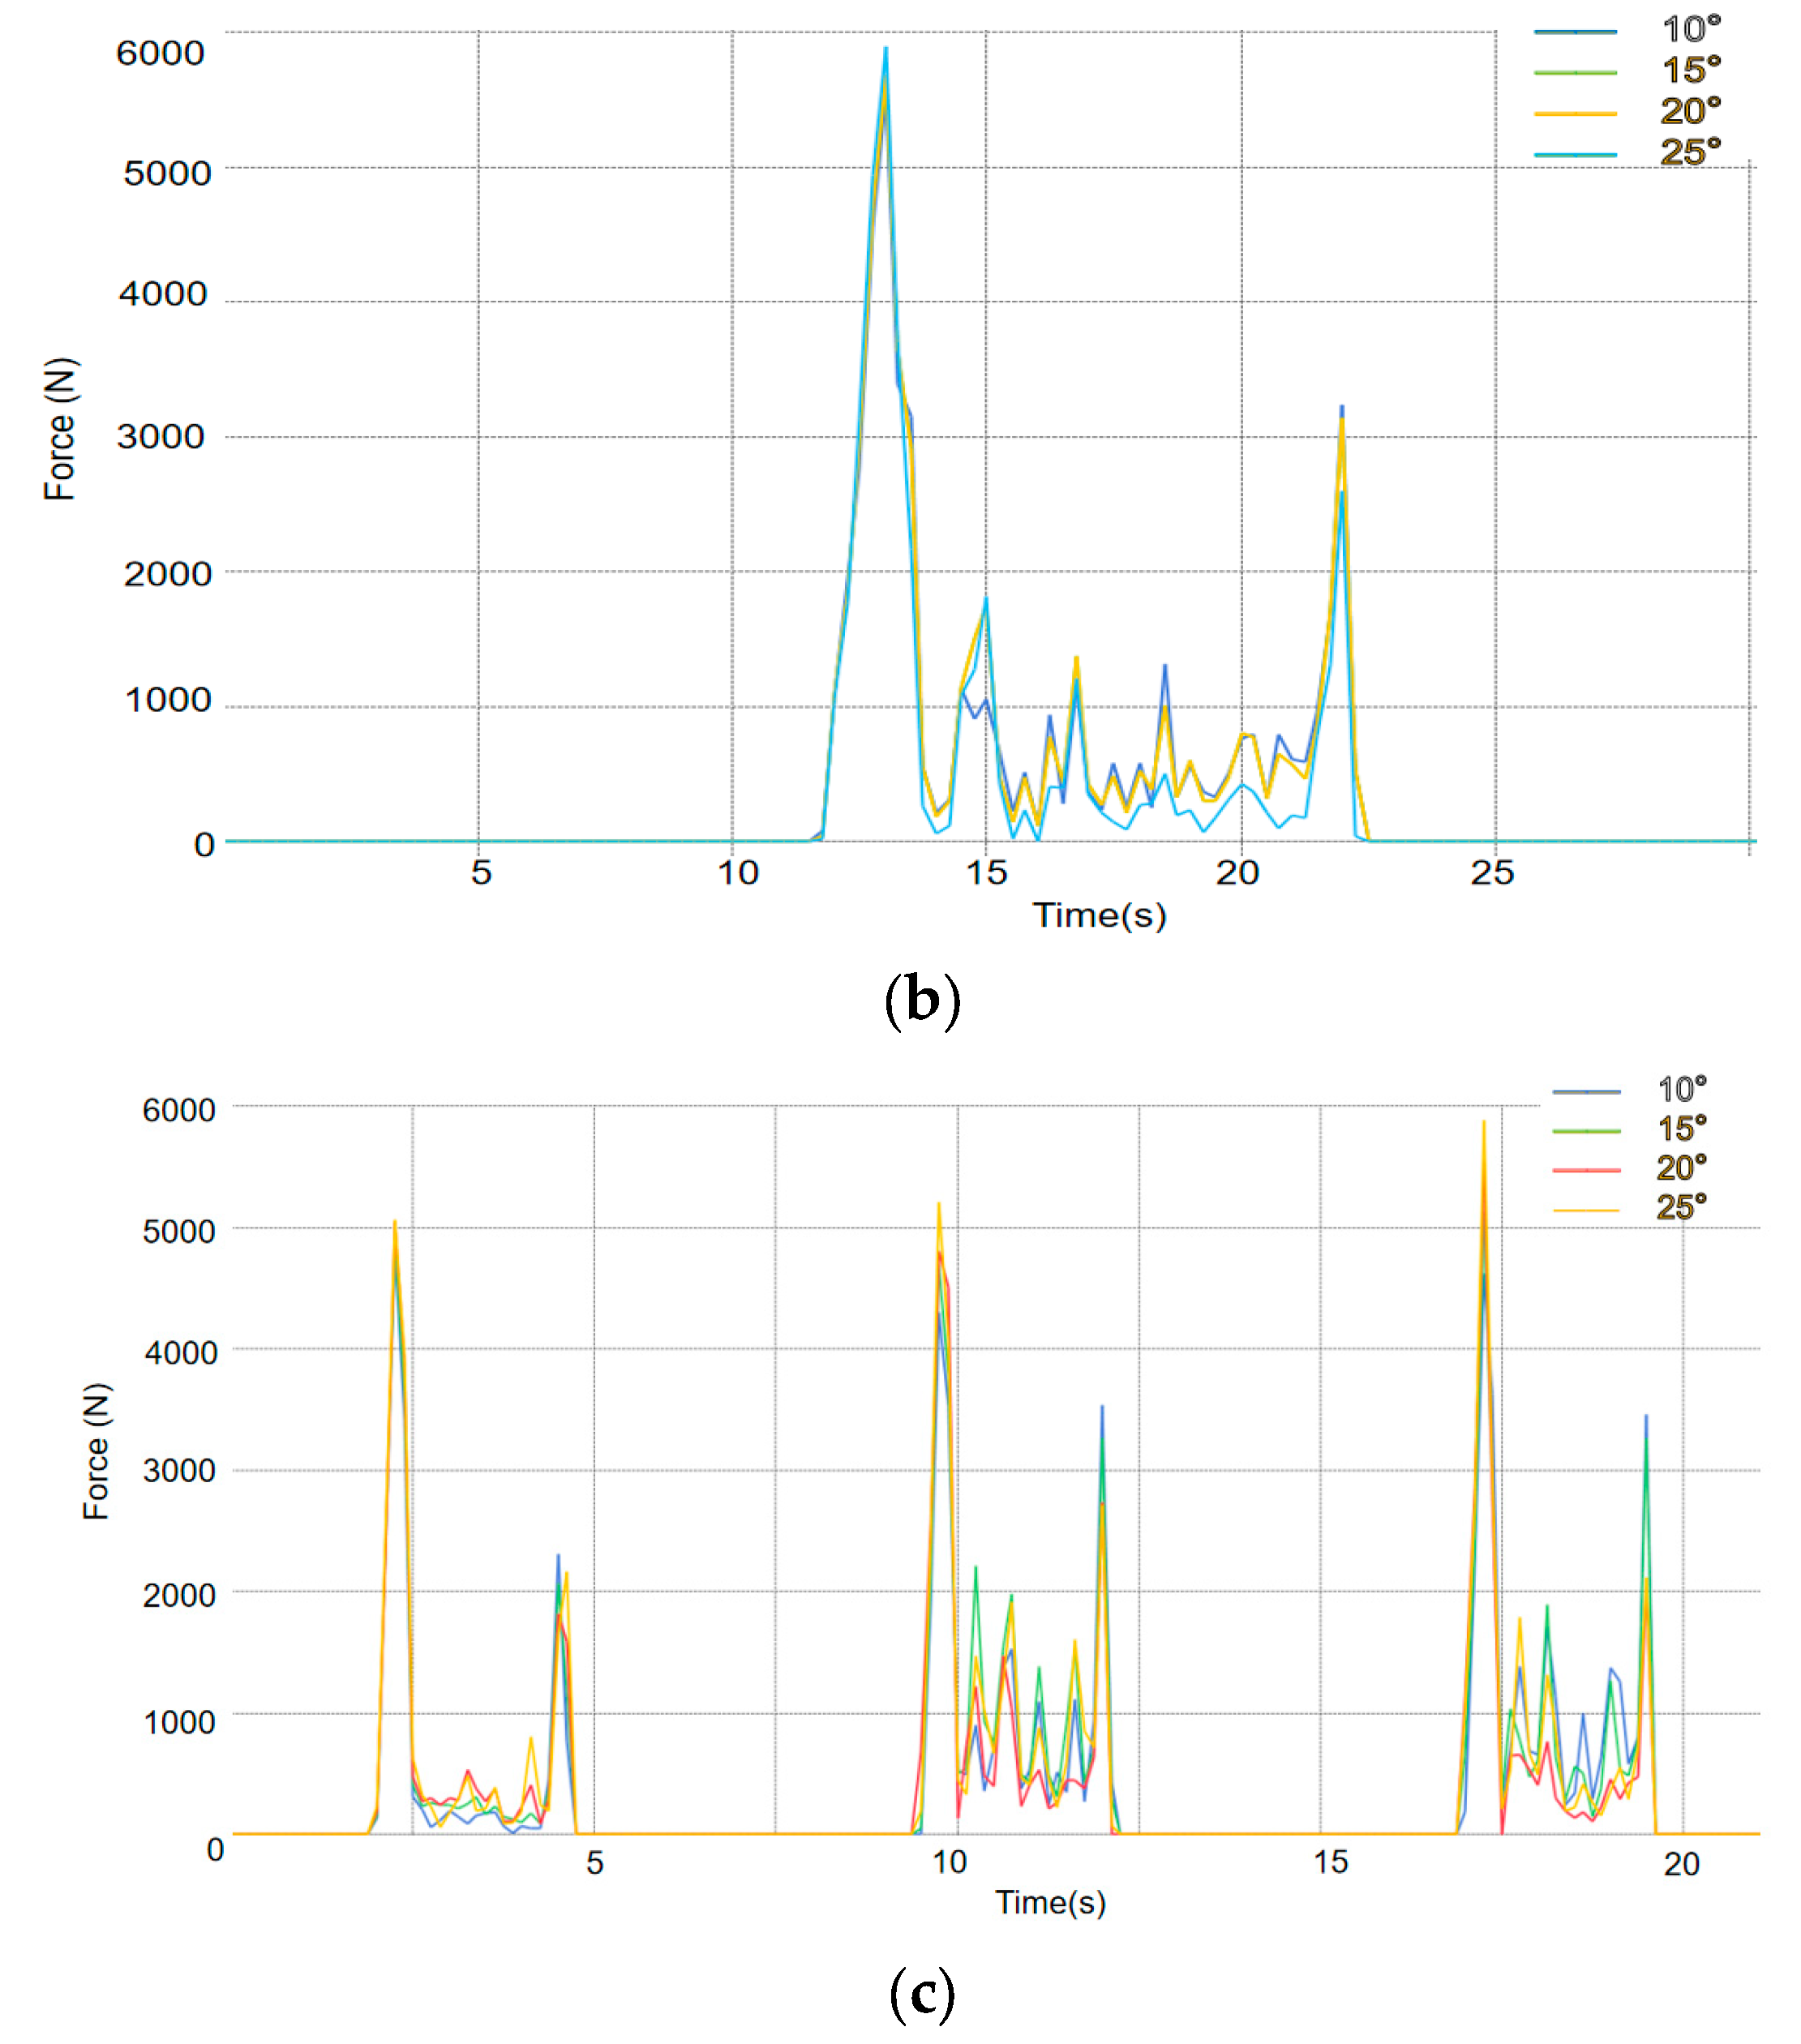
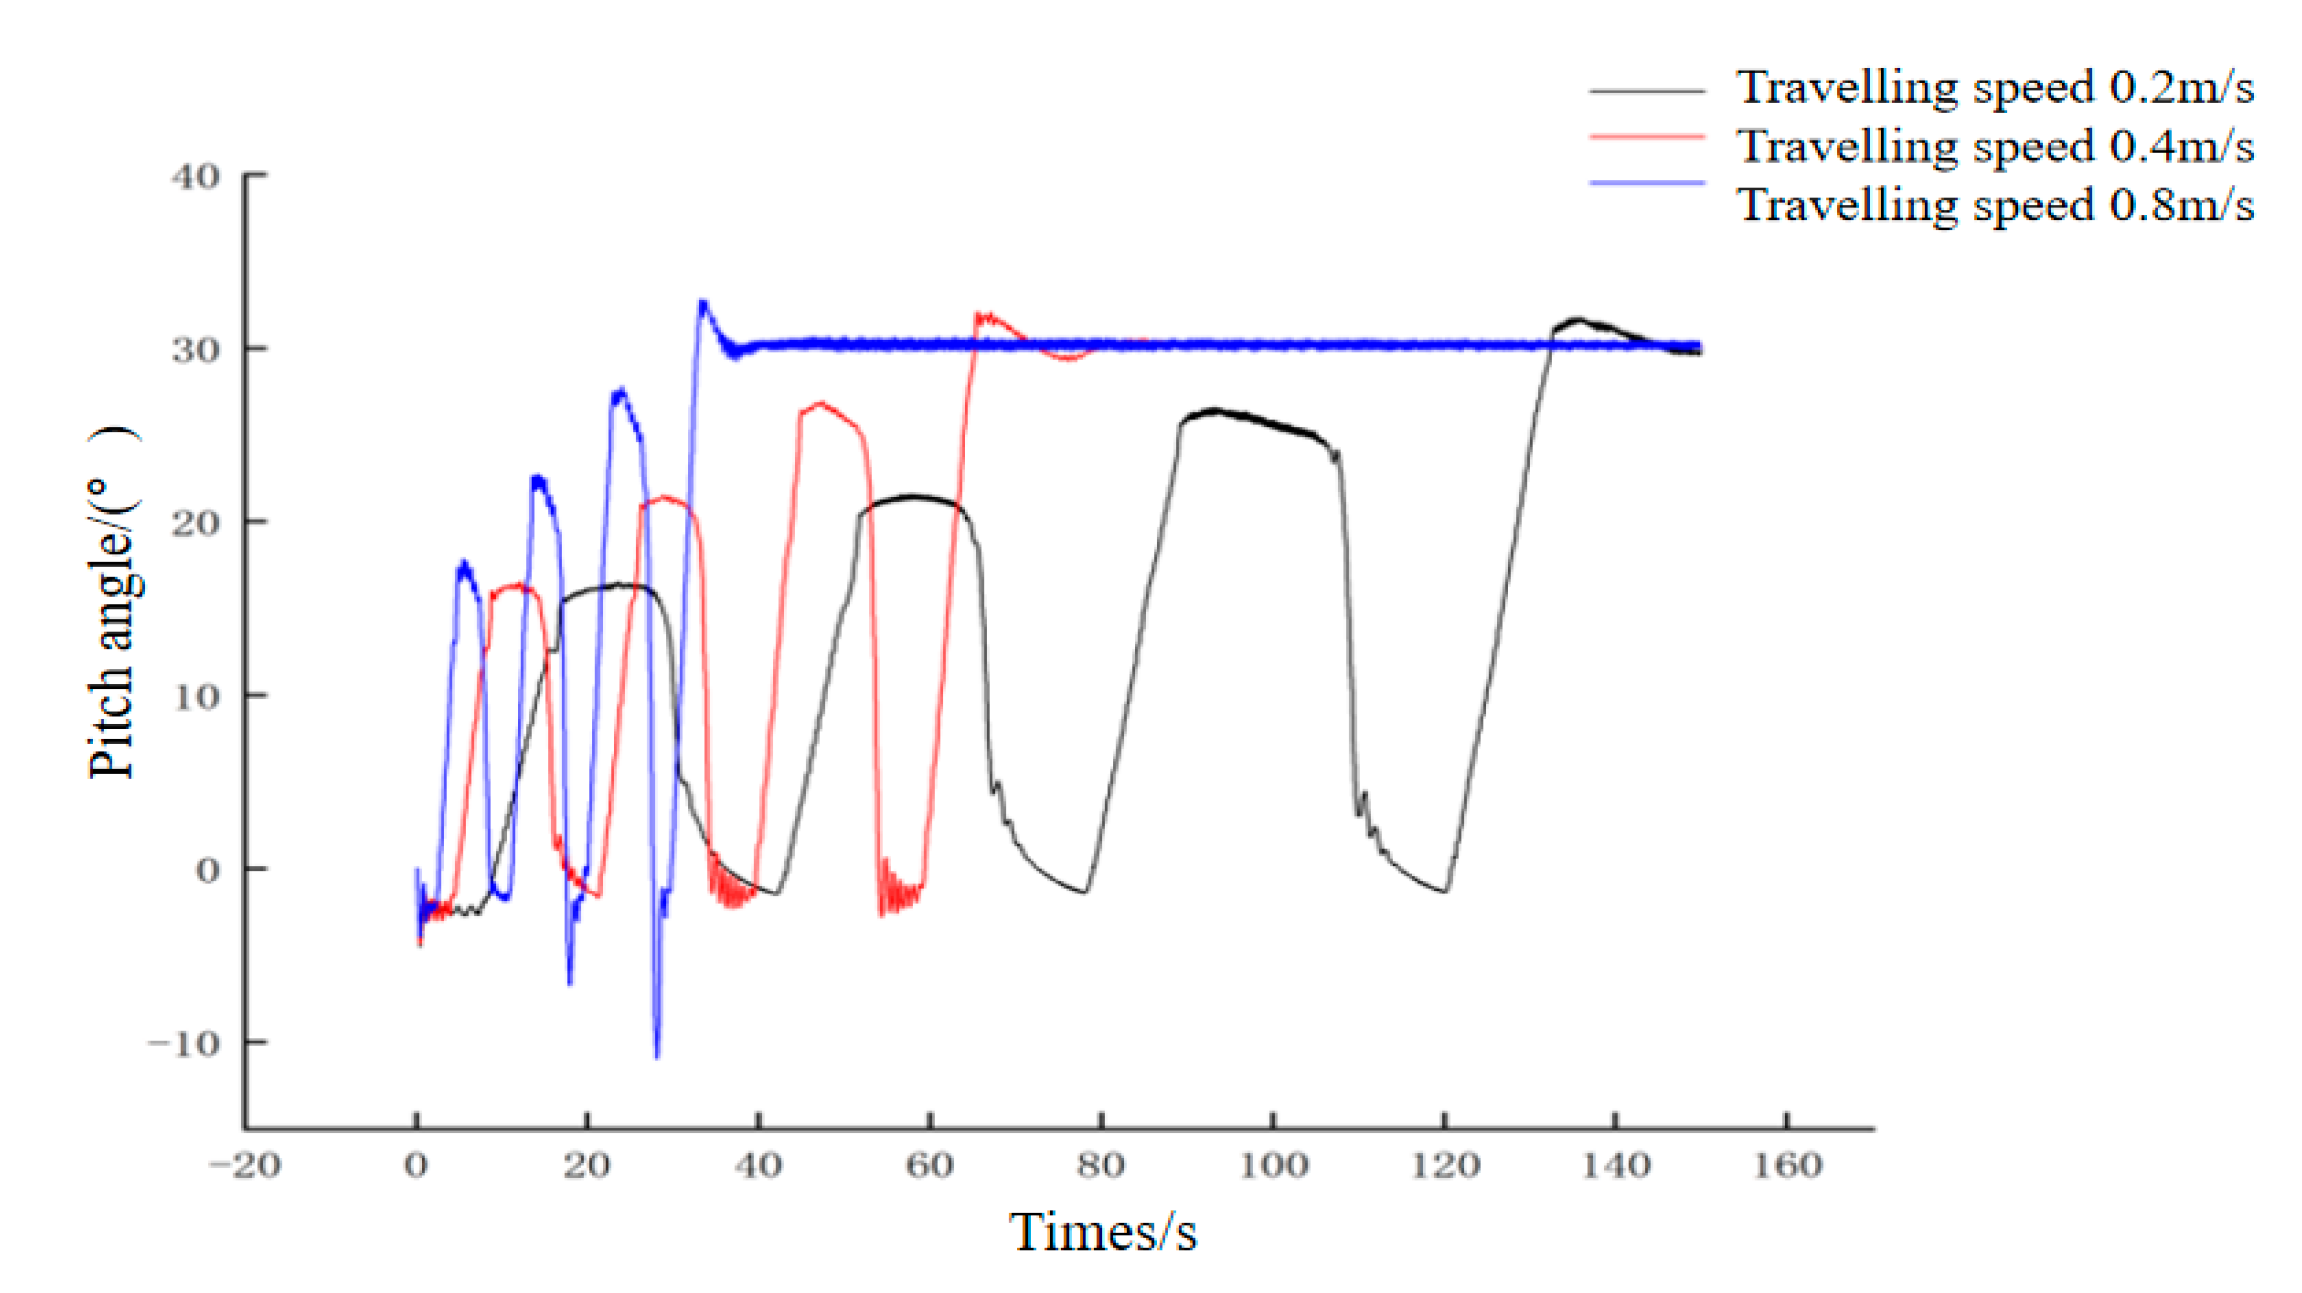
5.2.2. Simulation Analysis and Testing of Chassis Passability in Longitudinal Uphill Slopes
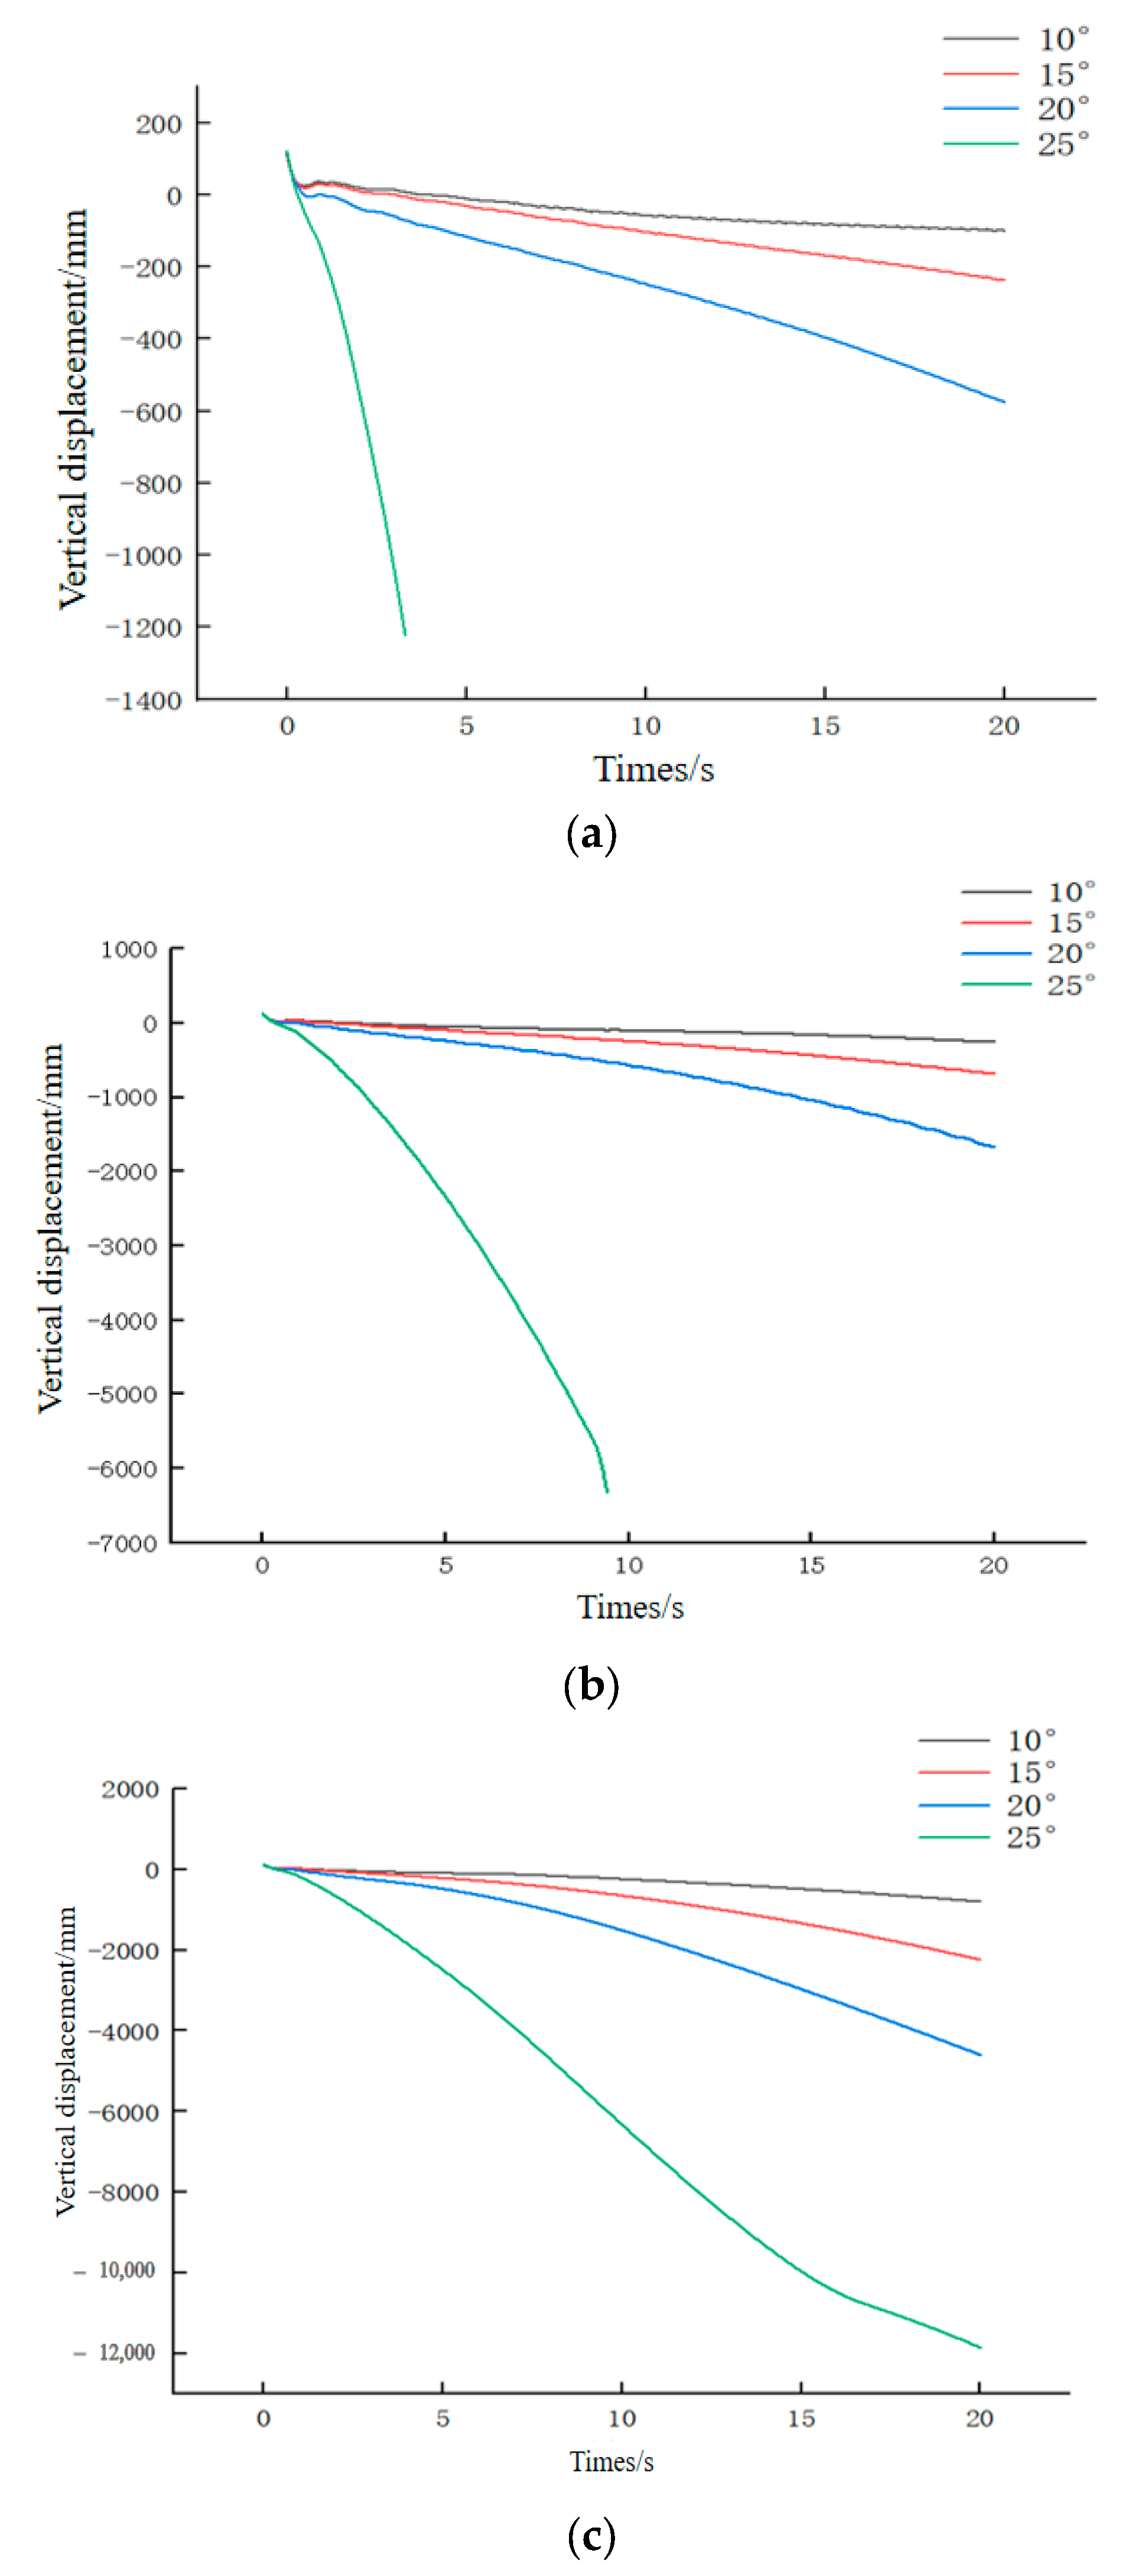
5.2.3. Simulation Analysis of Chassis Passability in Longitudinal Downhill Slopes
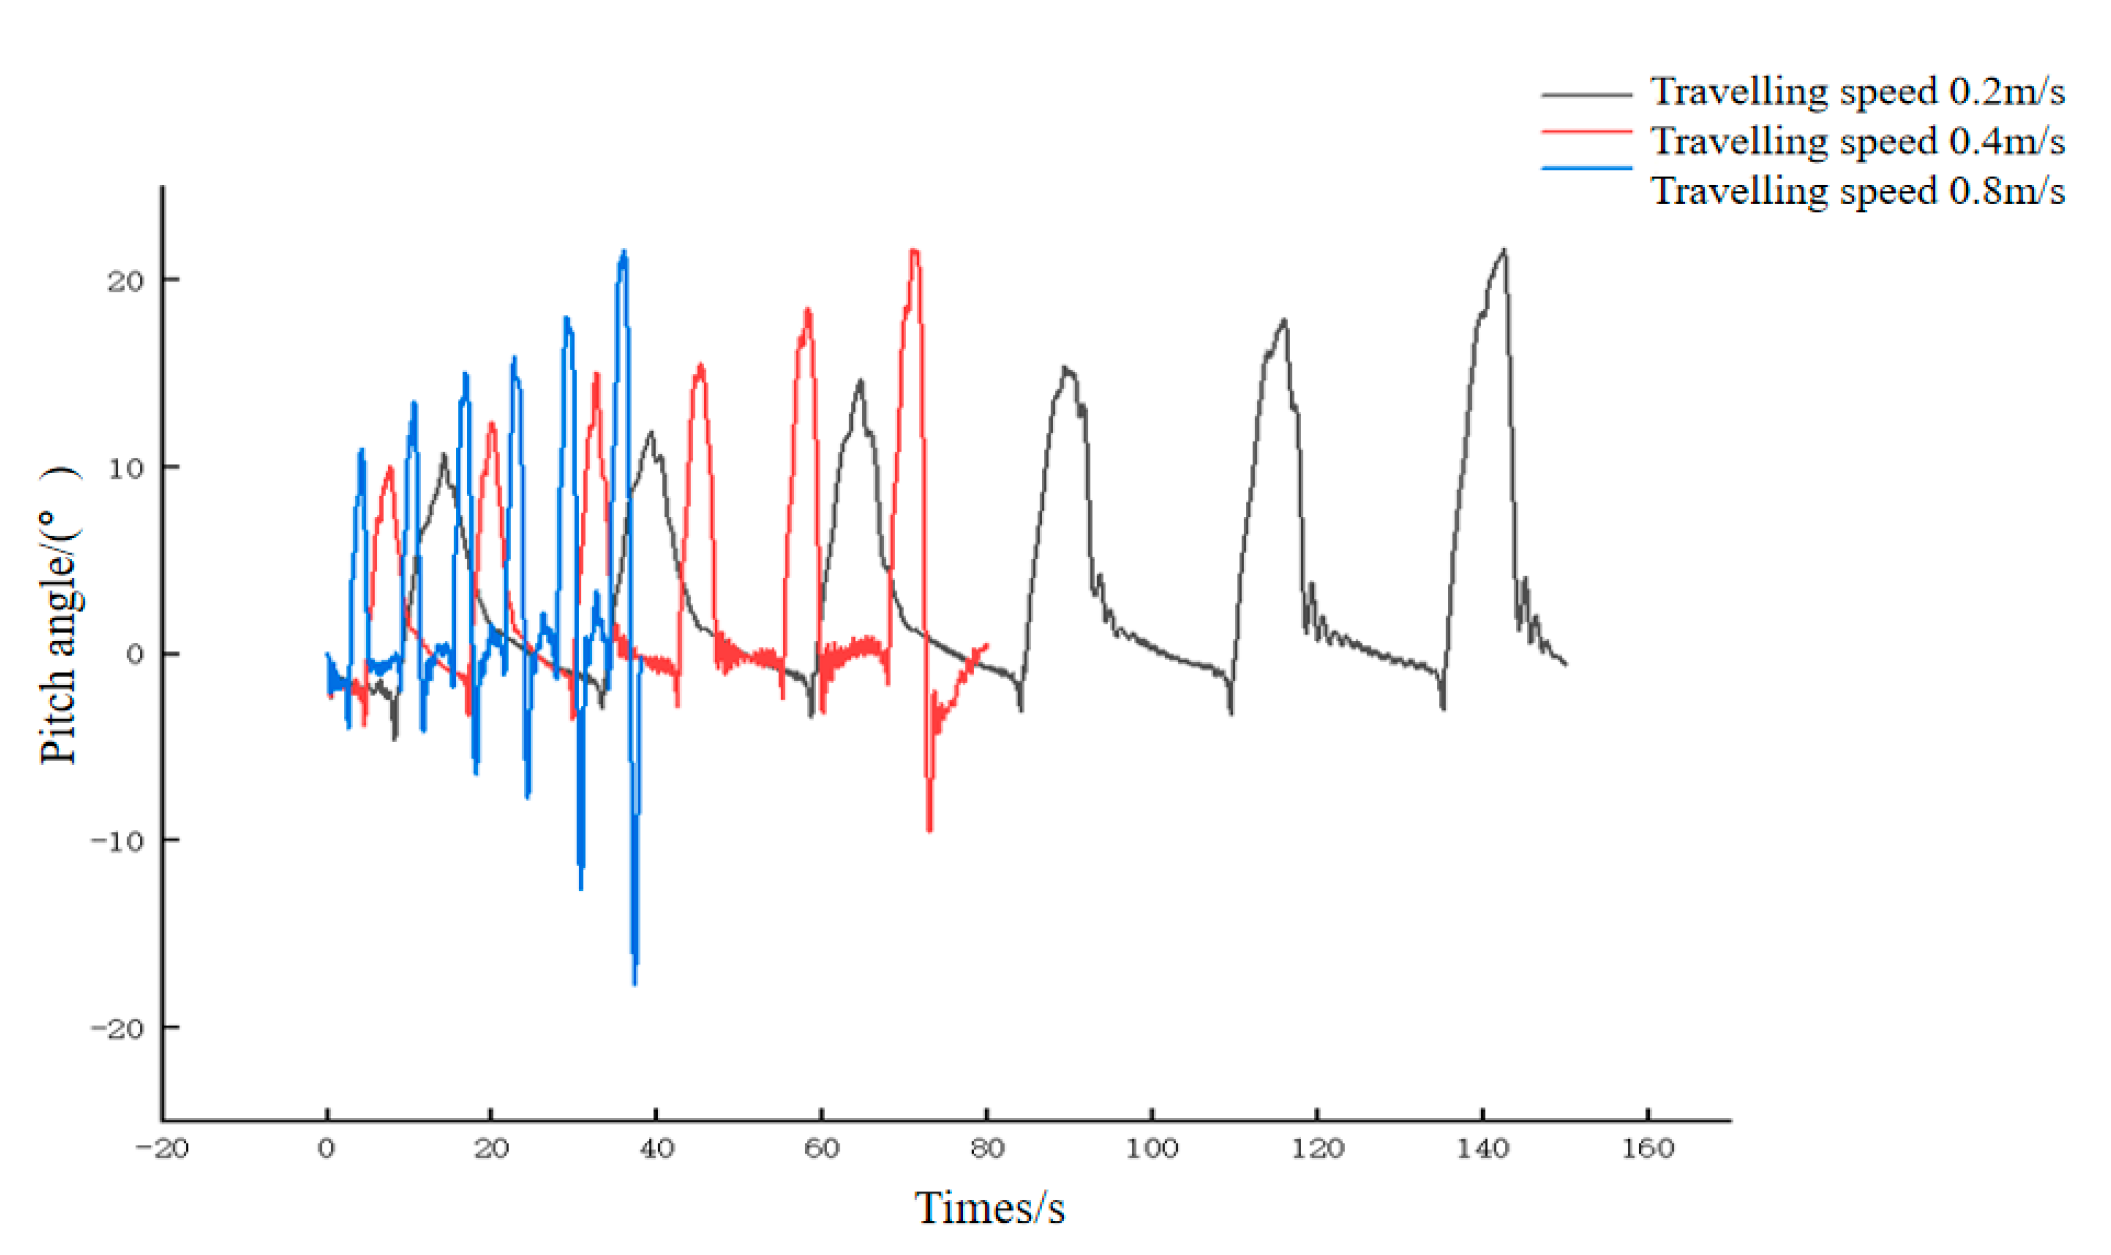
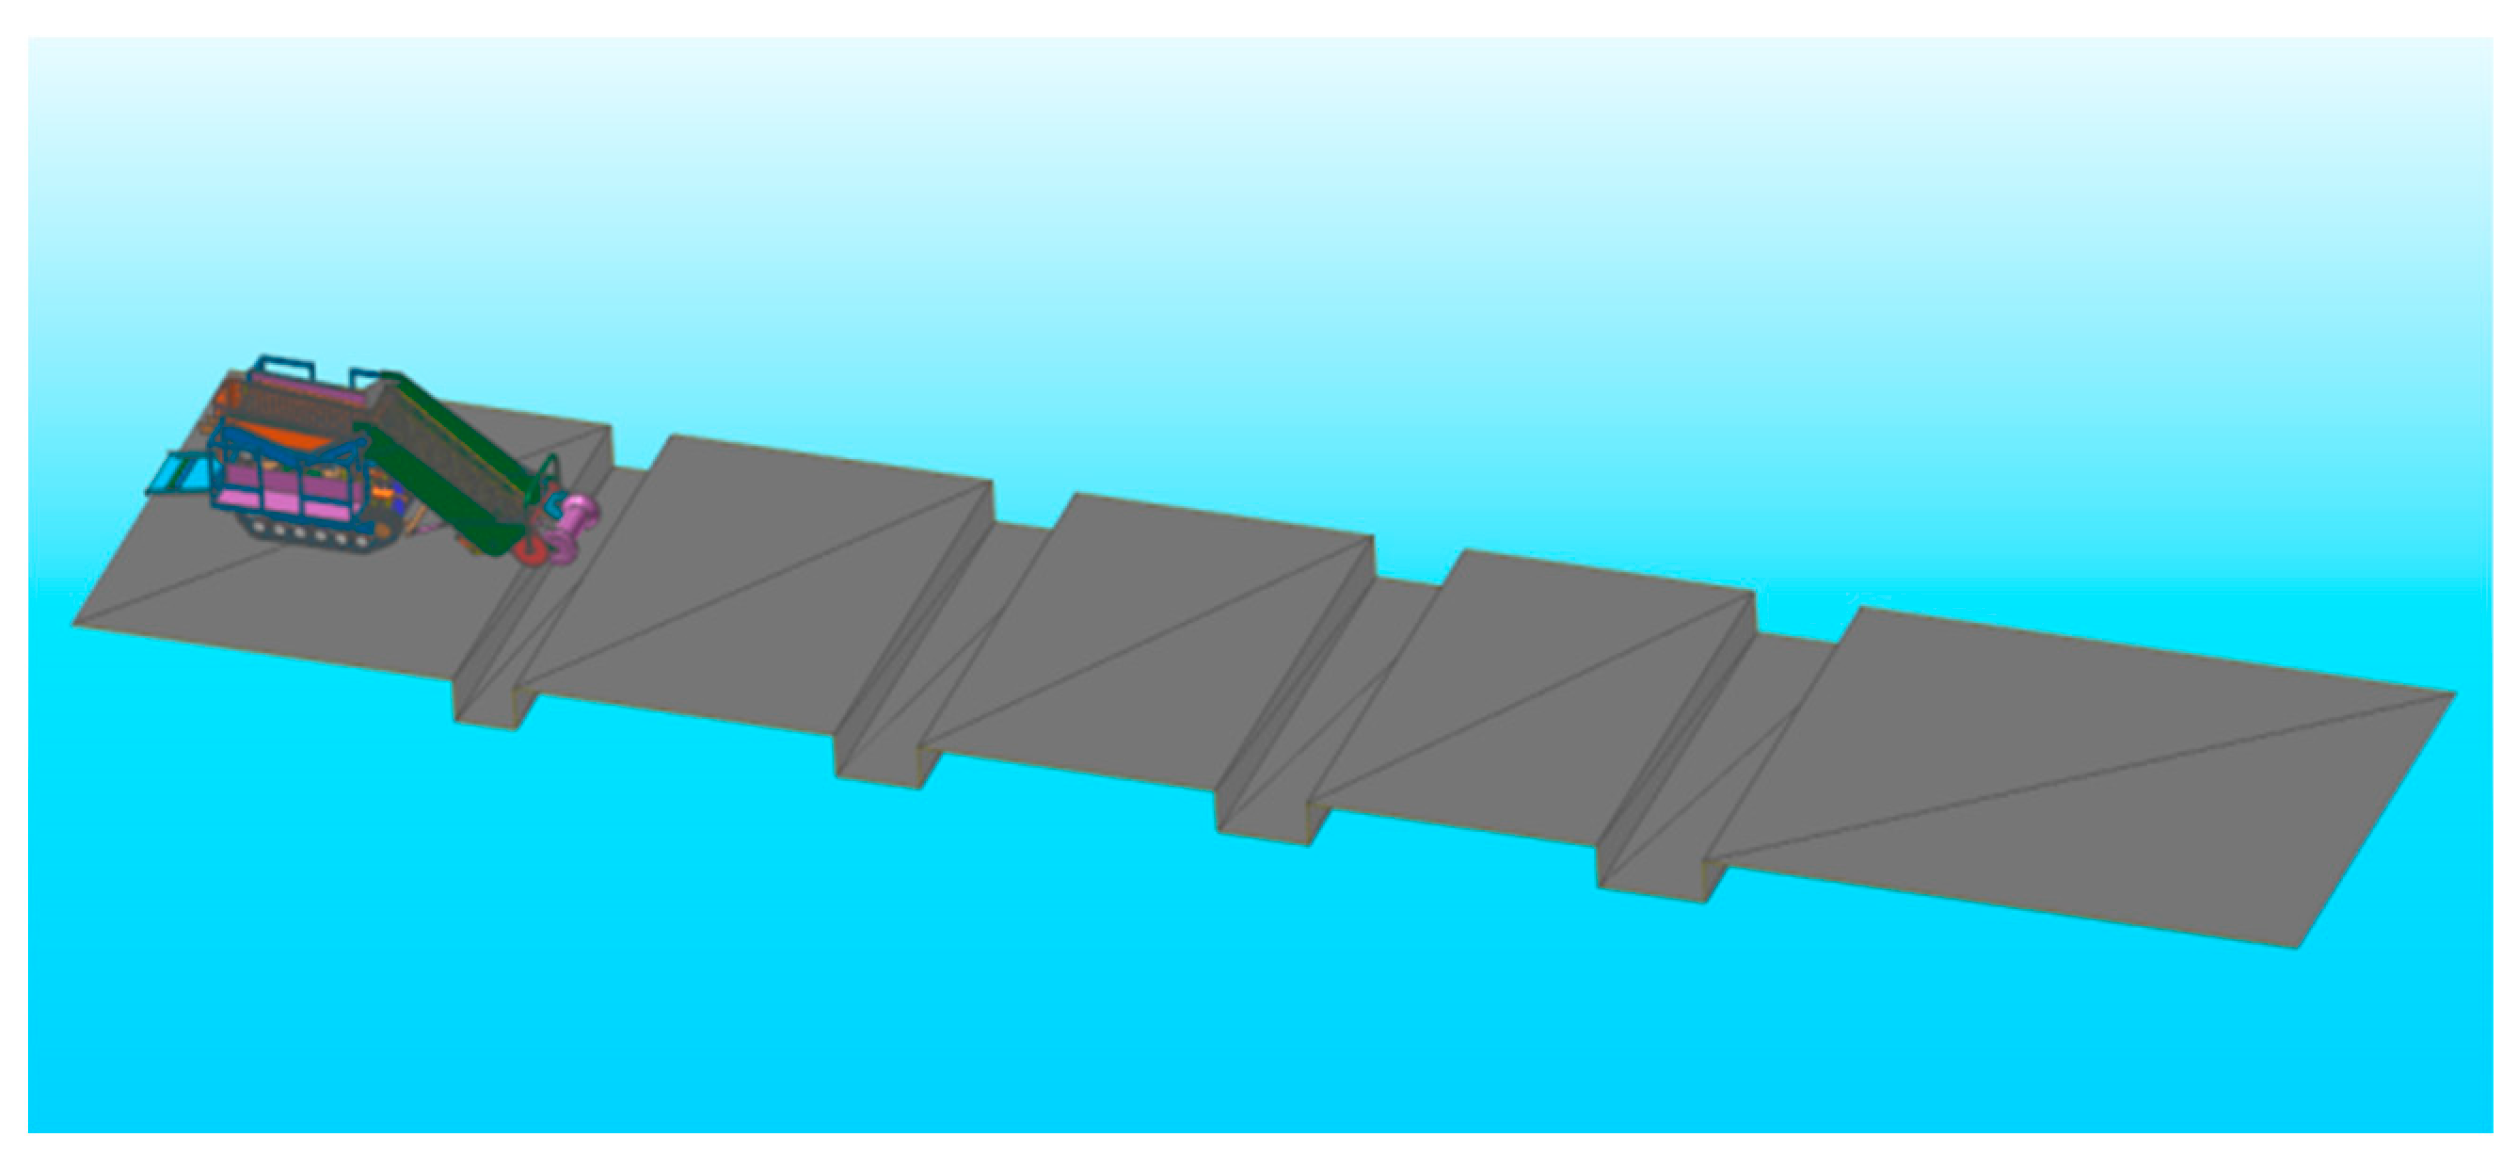
5.2.4. Simulation Analysis and Test of Chassis Passability in Obstacle Crossing
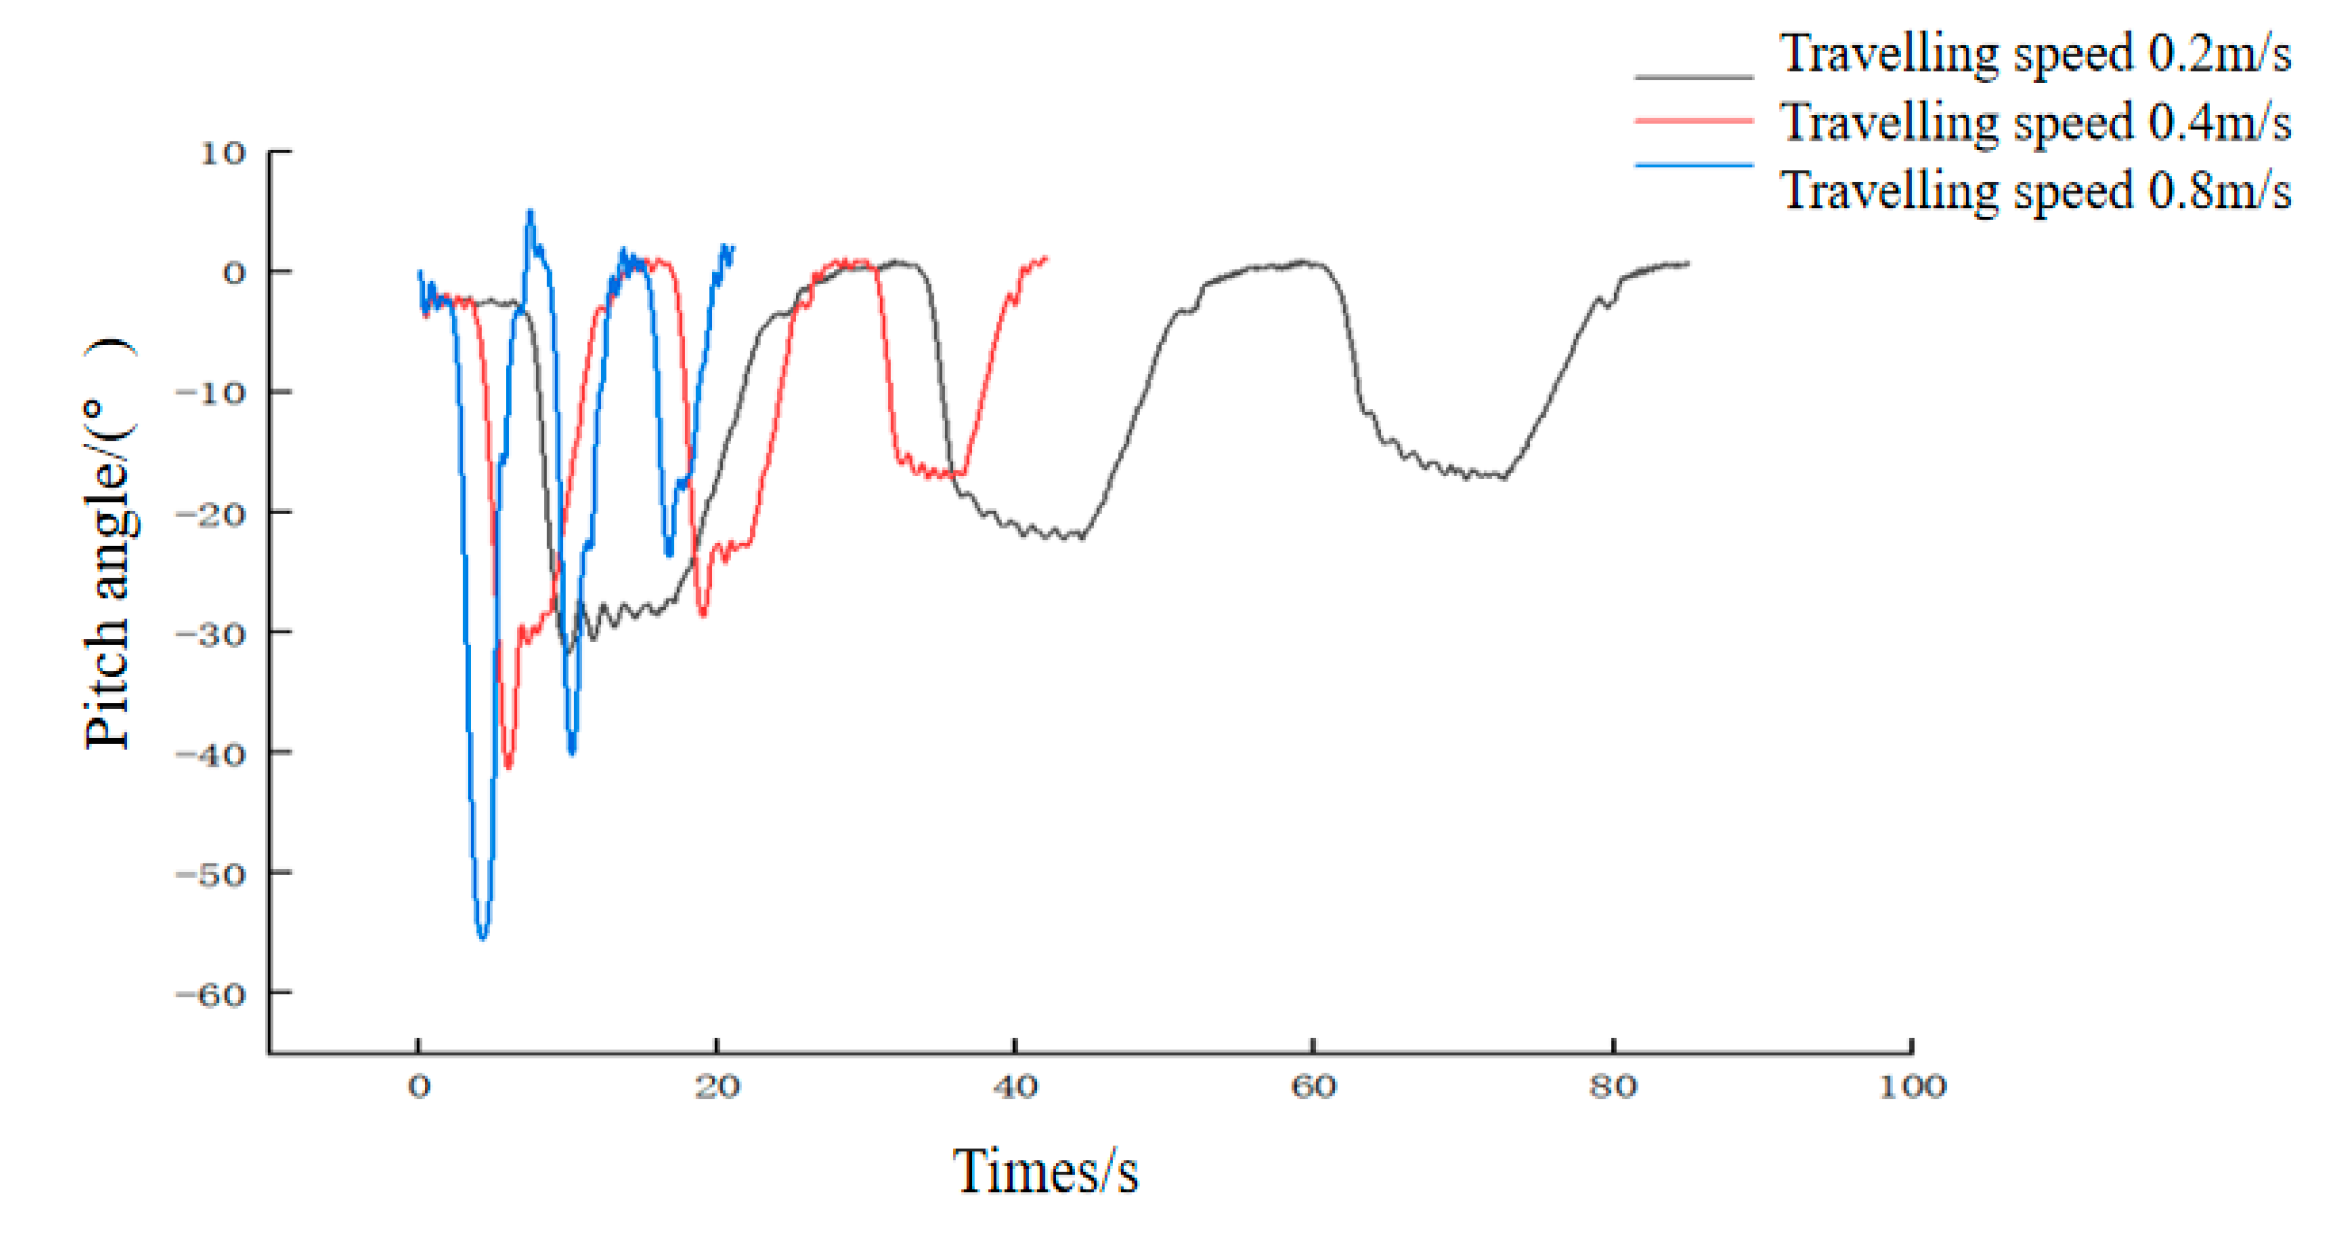
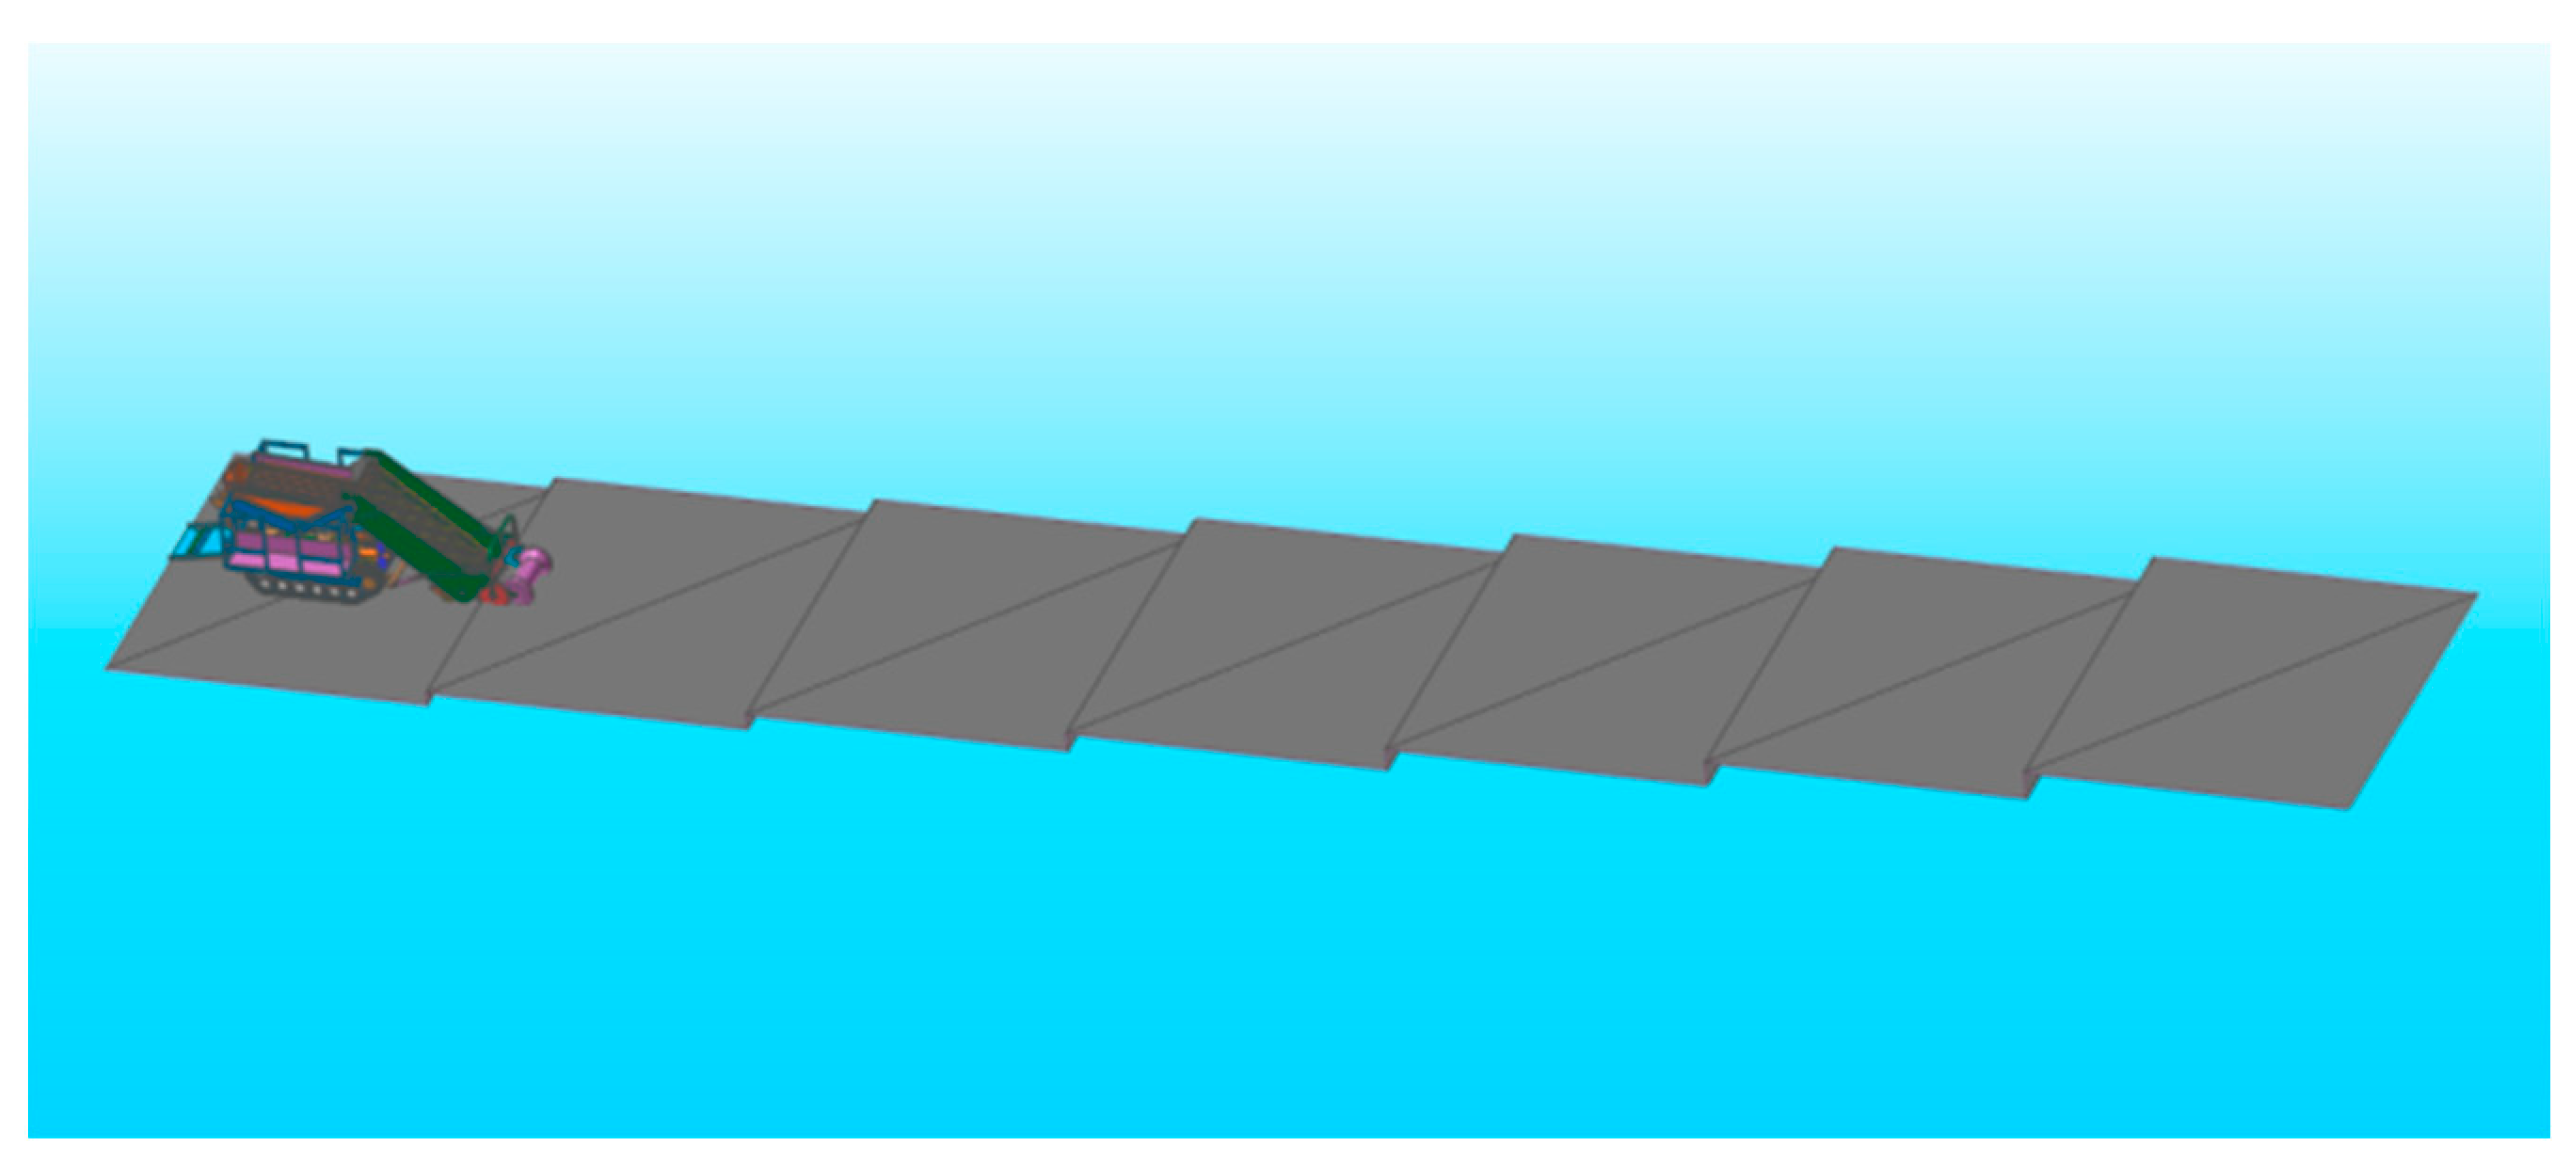
5.2.5. Simulation Analysis and Testing of Chassis Passability in Crossing Trenches
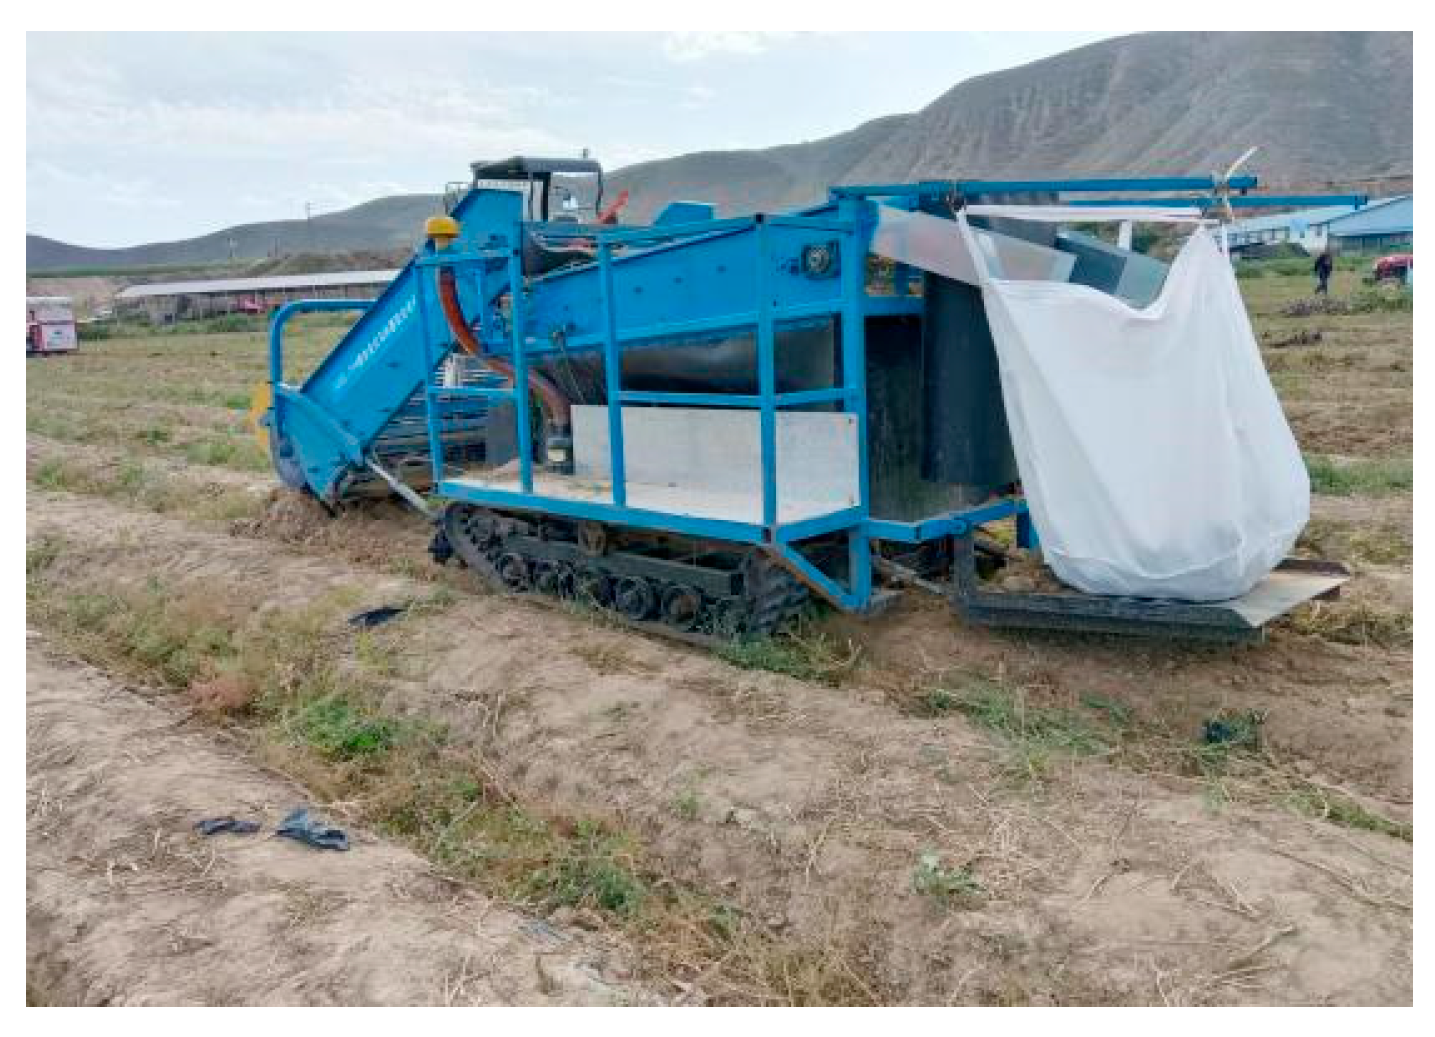
6. Field Experiment
6.1. Test Condition
6.2. Passed Performance Tests
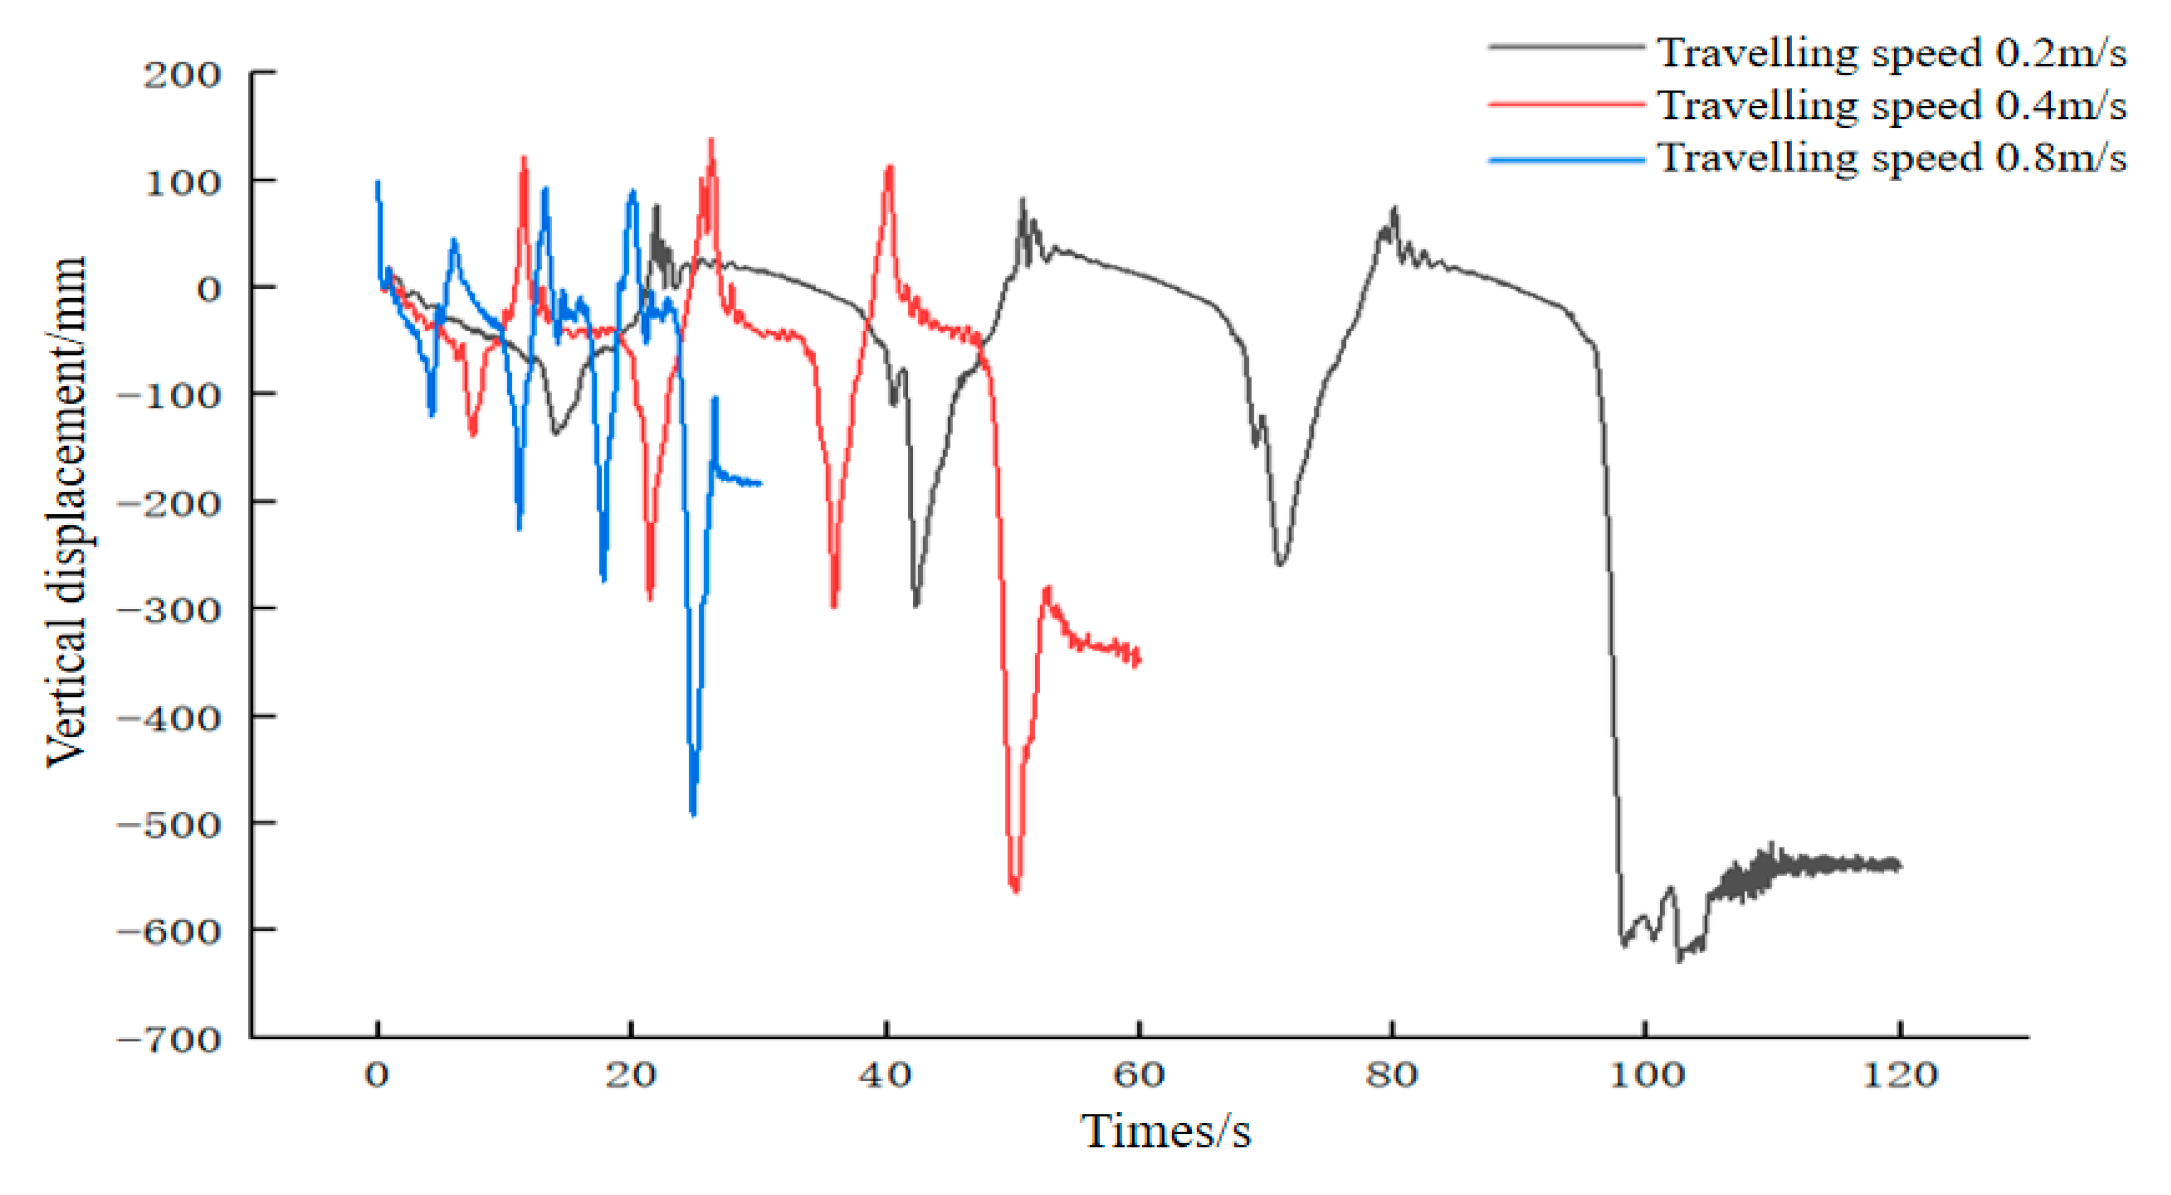
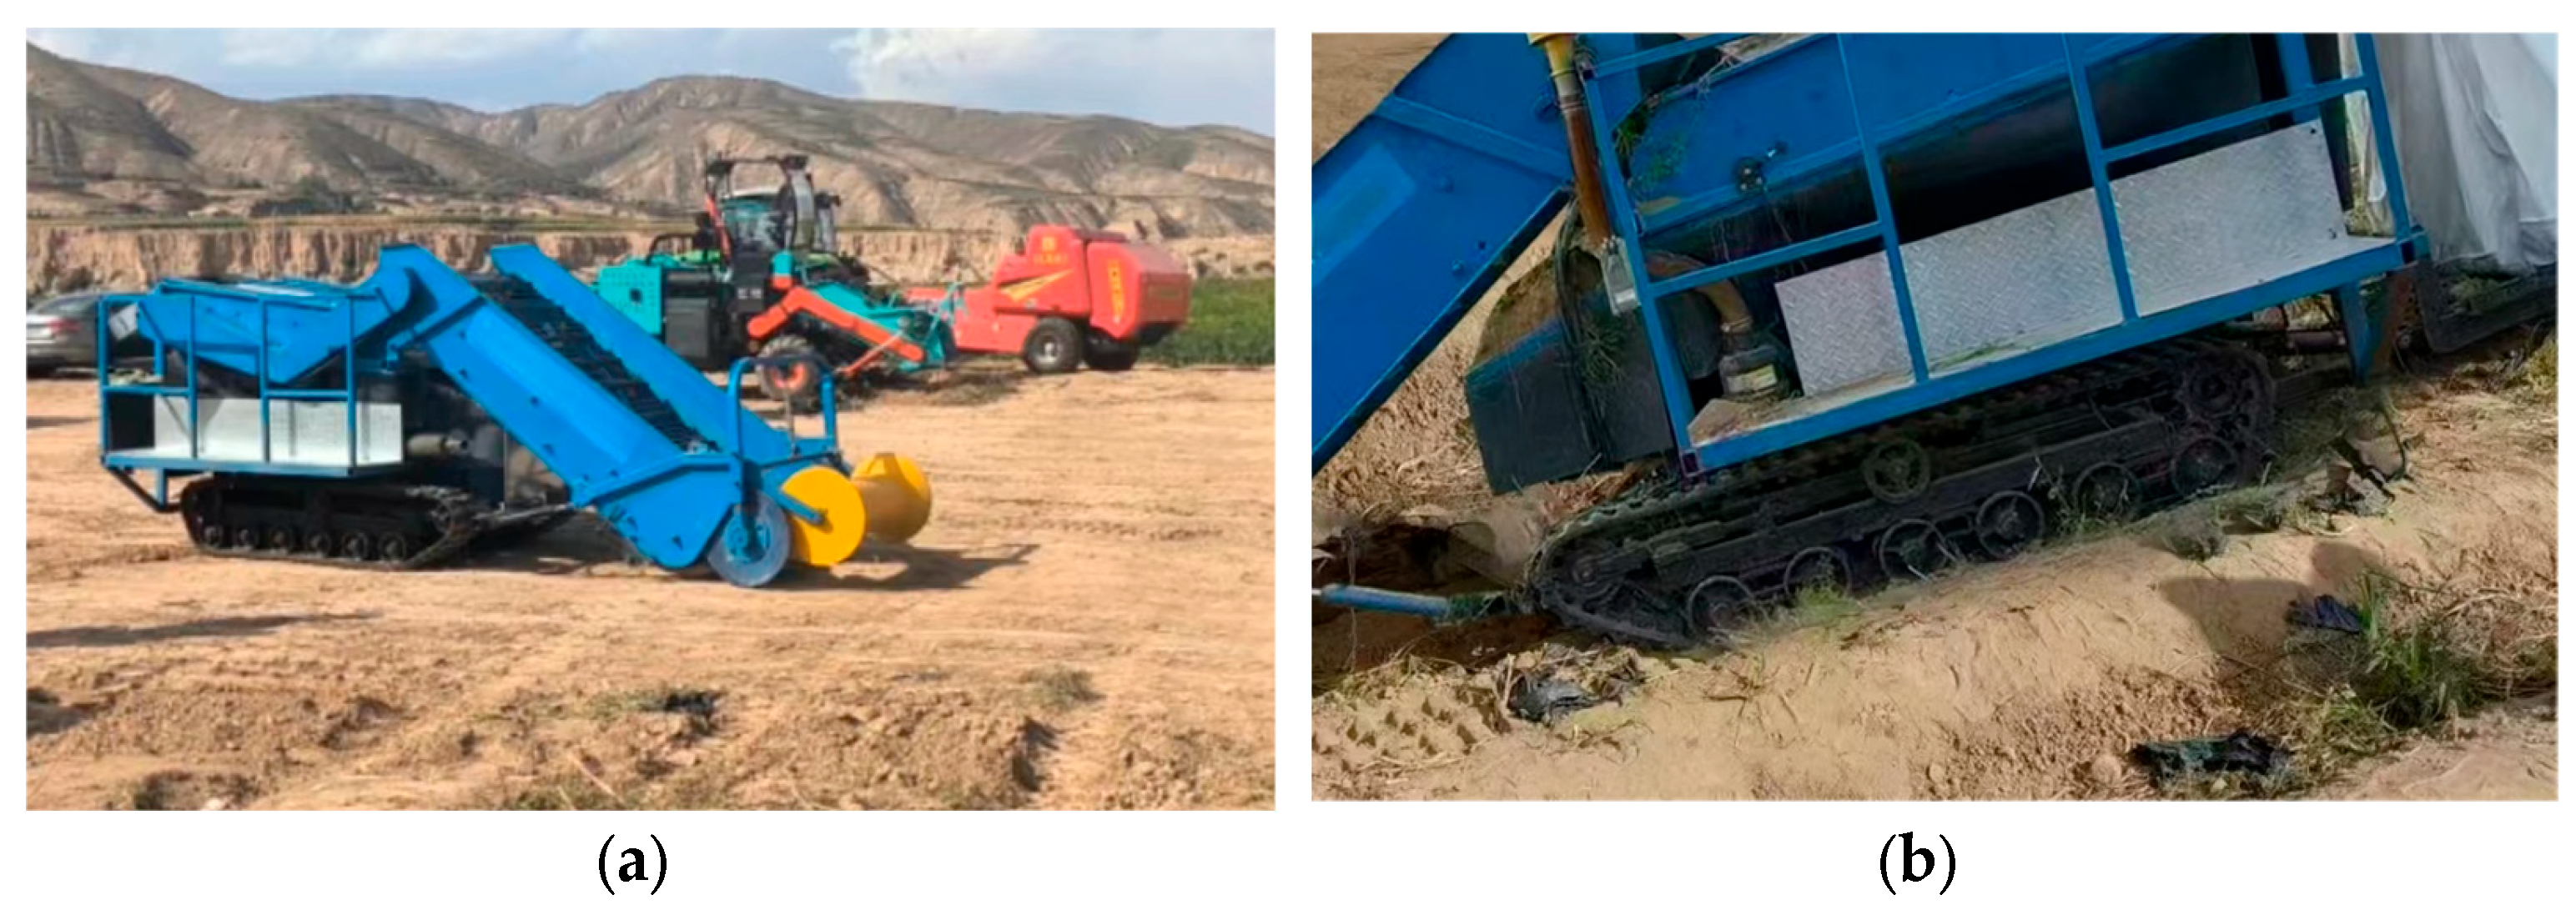
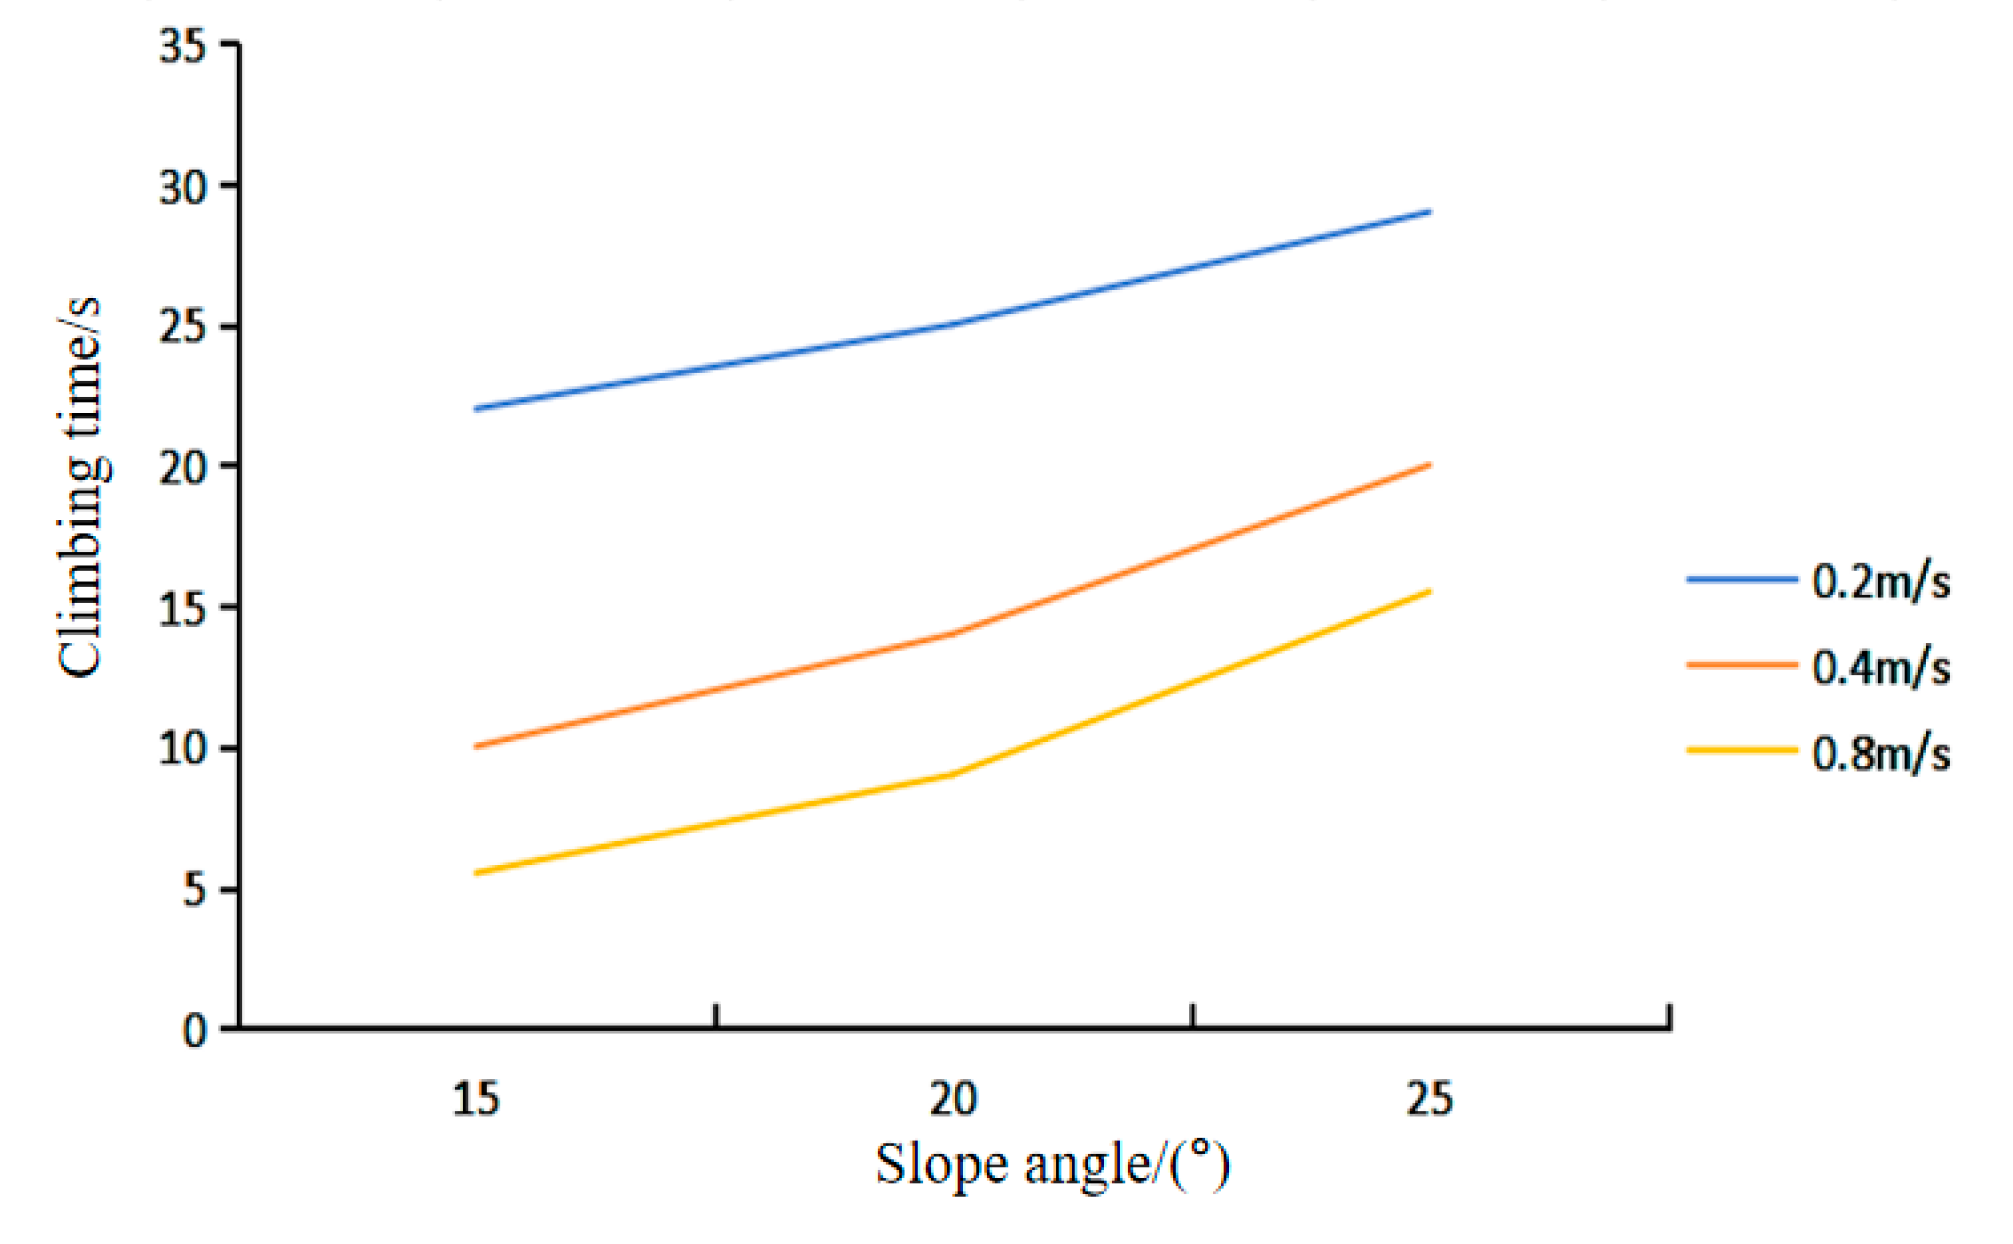
6.2.1. Longitudinal Climb Test
6.2.2. Over-the-Barrier Test
6.2.3. Trench-Crossing Test
7. Conclusions
- (1)
- Design of a potato combine harvester, mechanical analysis and theoretical calculations of the tracked chassis, including the four types of resistance, the force relationship of each wheel system, and for the characteristics of hilly and mountainous terrain, analyze the mechanical characteristics of the potato harvester in the process of travelling up and down the transverse and longitudinal slopes, crossing the barriers and crossing the ditches. And according to the theoretical formula to calculate the driving limit values under different working conditions, we find that the limit slope angle is 20° when travelling across the slope, the limit slope angle is 26° when travelling uphill in the longitudinal direction, the limit slope angle is 23° when travelling downhill in the longitudinal direction, the limit height that can be surmount is 450 mm, and the limit width that can be spanned is 1150 mm.
- (2)
- Simulations of the performance of the potato combine harvester chassis under five typical terrain conditions in hilly and mountainous areas were conducted using RecurDyn and EDEM software. The results from the simulation post-processing reveal the following limits for the chassis: under transverse slope conditions, the maximum slope angle for safe operation is 20°; under longitudinal uphill conditions, the maximum slope angle is 25°; under longitudinal downhill conditions, the maximum slope angle is also 25°; for obstacle crossing, the maximum height the chassis can surmount is 450 mm; and for ditch crossing, the maximum width the chassis can span is 1200 mm.
- (3)
- The potato combine harvester was tested in the field, and the maximum slope angle of the harvester was measured to be 24° in longitudinal slope travelling, and it was able to climb over the 450 mm high vertical wall and cross the trench with a width of up to 1200 mm. The results of the test were similar to the results of the theoretical calculations and simulation analyses, which showed that the harvester tracked chassis has the ability to pass through the complex terrain.
Author Contributions
Funding
Institutional Review Board Statement
Data Availability Statement
Conflicts of Interest
References
- Chen, X.; Hu, Z.; Cao, C.; Liu, J. Research and prospect of potato stem separation mechanism in potato combine harvesters. Chin. J. Agric. Mach. Chem. 2018, 39, 10–17. [Google Scholar]
- Zhao, Q. Research status and development prospect of potato harvesting machinery at home and abroad. Agric. Eng. 2020, 10, 7–10. [Google Scholar]
- China’s Potato Cultivation Area Reached 70 Million Mu Western Main Production Areas Accounted for More than 80%. Available online: www.chinanews.com.cn/cj/2021/10-11/9583694.shtml (accessed on 10 March 2023).
- Liu, C.; Hu, J.; Zhao, S.; Sha, L.; Yu, Z. Research progress on potato harvesting equipments. J. Chin. Agric. Mech. 2019, 40, 31–35+124. [Google Scholar]
- Wang, H.T.; Sun, W.; Zhang, H.; Liu, X.L.; Li, H.; Liu, K.Y. Overview of the development of mechanized film mulching technology. Agric. Equip. Veh. Eng. 2022, 60, 7–11. (In Chinese) [Google Scholar]
- Li, Z.H.; Wen, X.Y.; Lv, J.Q.; Li, X.C.; Yi, S.J.; Qiao, D. Analysis and Prospect of Research Progress on Key Technologies and Equipments of Mechanization of Potato Planting. J. Agric. Mach. 2019, 50, 1–16. (In Chinese) [Google Scholar]
- Dou, Q.; Sun, Y.; Sun, Y.; Shen, J.; Li, Q. Current Status and Development of Potato Harvesting Machinery in China and Abroad. J. Chin. Agric. Mach. Chem. 2019, 40, 206–210. [Google Scholar]
- Yang, Y.; Luo, Q.; Wang, D.; Liu, Y.; Lun, R. Analysis of the Factors Affecting Regional Distribution of Potatoes in China. J. Chin. Agric. Resour. Reg. 2018, 39, 76–81. [Google Scholar]
- Luo, S.; He, Y.; Luo, Q.; Cai, W.; Wang, Z.; Duan, D. Comparative Advantages and Influencing Factors of Potato Production Regions in China. J. Chin. Agric. Resour. Reg. 2018, 39, 137–144. [Google Scholar]
- Sun, W.; Wang, H.; Zhao, W.; Zhang, H.; Liu, X.; Wu, J. Design and experiment of potato digger with waste flm recollection for complete flm mulching, soil covering and ridge sowing pattern. Trans. Chin. Soc. Agric. Mach. 2018, 49, 105–114. [Google Scholar]
- Li, H. Design and Research of Self-Propelled Small-Scale Potato Harvester. Master’s Thesis, Chongqing Three Gorges University, Chongqing, China, 2023. [Google Scholar]
- Hu, G.Y. A Brief Analysis of the Practicality of Track-Type Simplified Agricultural Machinery in the Hilly Areas of Liangshan. Sichuan Agric. Mach. 2024, 2, 57–58. [Google Scholar]
- Lv, F.; Li, X.; He, C.; Ding, L.; Sun, A. Design and Testing of an Omnidirectional Posture Adjustment Track Chassis for Agricultural Machinery. J. Chin. Agric. Mech. Chem. 2024, 45, 132–137. [Google Scholar]
- Zhang, Z.; Wang, Y.; Wen, B.; Guo, S.; Jie, K.; Wang, C. Design and Performance Analysis of a Self-Propelled Three-Seven Combined Harvester. J. Agric. Mech. 2024, 9, 1–16. [Google Scholar]
- Wang, N.; Song, Y.; Gao, Q.; Wang, W.; Li, W.; Qiu, X. Design and Simulation of the Hydraulic System for the Chassis of a Crawler-Type Self-Propelled Ginger Harvester. Agric. Equip. Veh. Eng. 2024, 62, 9–14. [Google Scholar]
- Xiang, W.; Sun, Y.; Wang, P.; Wang, P.; Long, H.; Xie, S. Design and Testing of a Single-Row De-Ear Mechanism for Small Corn Harvesters in Hilly Areas. J. Chin. Agric. Mech. Chem. 2024, 45, 28–34. [Google Scholar]
- Zhao, M. Design of a Crawler-Type Self-Propelled Potato Harvester. Master’s Thesis, Ningxia University, Yinchuan, China, 2023. [Google Scholar]
- Wei, Z.; Wang, X.; Li, X.; Wang, F.; Li, Z.; Jin, C. Design and Testing of a Crawler-Type Sorting Potato Harvester. J. Agric. Mech. 2023, 54, 95–106. [Google Scholar]
- Liu, F. Optimization of the Chassis for a Crawler-Type Self-Propelled Potato Harvester. Master’s Thesis, Huazhong Agricultural University, Wuhan, China, 2022. [Google Scholar]
- Yu, Z.; Wang, C.; Li, H.; Liang, Q. Design of a Lift-and-Transport Crawler-Type Potato Planter. J. Agric. Mech. Res. 2019, 41, 83–86+92. [Google Scholar]
- Wang, H.; Zhang, Z.; Issa, I.I.M.; Xie, K.; EL-Kolaly, W.; Cao, Q. Design and experiment of small-sized potato harvester suitable for hilly and mountainous areas. Acta Agric. Zhejiangensis 2021, 33, 724–738. [Google Scholar]
- NY/T 648-2002; Technical Specification for Quality Evaluation of Potato Harvesters. Standards Press of China: Beijing, China, 2002.
- Zhang, Z.; Wang, H.; Li, Y.; Yang, X.; Ibrahim, I.; Zhang, Z. Design and Experiment of Multi stage Separation Buffer Potato Harvester. Trans. Chin. Soc. Agric. Mach. 2021, 52, 96–109. [Google Scholar]
- Wang, F.; Cao, Q.; Li, Y.; Pang, Y.; Xie, K.; Zhang, Z. Design and Passability Test of Self-propelled Potato Combine Harvester in Hilly Regions. J. Agric. Mech. 2023, S2, 10–19. [Google Scholar]
- Jia, B.; Sun, W.; Zhao, Z.; Wang, H.; Zhang, H.; Liu, X.; Li, H. Design and Field Test of a Remotely Controlled Self-propelled Potato Harvester with Manual Sorting Platform. Am. J. Potato Res. 2023, 100, 193–209. [Google Scholar] [CrossRef]
- Wang, H.; Zhang, Y.; Sun, W.; Zhang, W.; Liu, X.; Zhang, H. Design and Experiment of Vibration Shovel Potato Digger. Chin. J. Agric. Mach. Chem. 2018, 39, 1–5+20. [Google Scholar]
- Ren, S. Design and Experiment of Soil Crushing Digging Device for Potato Harvesters in Hilly and Mountainous Areas. Master’s Thesis, Sichuan Agricultural University, Yaan, China, 2021. [Google Scholar]
- Ju, Y.; Sun, W.; Zhao, Z.; Wang, H.; Liu, X.; Zhang, H.; Li, H.; Simionescu, P.A. Development and Testing of a Self-Propelled Machine for Combined Potato Harvesting and Residual Plastic Film Retrieval. Machines 2023, 11, 432. [Google Scholar] [CrossRef]
- Zhou, J.; Yang, S.; Li, M.; Chen, Z.; Zhou, J.; Gao, Z.; Chen, J. Design and Experiment of a Self-Propelled Crawler-Potato Harvester For Hilly And Mountainous Areas. INMATEH-Agric. Eng. 2021, 64, 151–158. [Google Scholar] [CrossRef]
- Li, B.; Sun, W.; Zhao, Z.; Simionescu, P.A. Development and Validation of a Potato Seeding Machine with Integrated Plastic Film Mulch Punching Mechanism. Agronomy 2024, 14, 1570. [Google Scholar] [CrossRef]
- Issa, I.I.M.; Zhang, Z.; El-Kolaly, W.; Yang, X.; Wang, H. Design, Ansys analysis and performance evaluation of potato digger harvester. Int. Agric. Eng. J. 2020, 29, 60–73. [Google Scholar]
- GB/T25417-2010; Technical Specifications for Potato Planting Machines. Standards of China: Beijing, China, 2010. (In Chinese)
- GB/T6242-2006; Test Methods for Potato Planter Machinery. Standards of China: Beijing, China, 2006. (In Chinese)
- NY/T1415-2021; Technical Specification for Quality Evaluation of Potato Planting Machines. Standards of China: Beijing, China, 2021. (In Chinese)
- NY/T 3481-2019; Rhizome Chinese Medicinal Materials Harvesters Traditional Specification of Quality Evaluation. Ministry of Agriculture and Rural Affairs of the People’s Republic of China: Beijing, China, 2019.


| Parameters | Numerical Values |
|---|---|
| Machine length × width × height | 5670 × 2040 × 1800 (mm) |
| Engine power | 54 kw |
| Working width | 1500 mm |
| Overall quality | 3100 kg |
| Digging depth (adjustable) | 200~300 mm |
| Suspension mode | Three-point suspension |
| Parameters | Numerical Values |
|---|---|
| Machine length × width × height | 1800 × 950 × 380 (mm) |
| Overall quality | 920 kg |
| Track width | 230 mm |
| Track grounding length/mm | 1600 mm |
| Ground clearance for tracks | 250 mm |
| Track center distance | 1190 mm |
| Drive wheel radius | 150 mm |
| Guide wheel radius | 115 mm |
| Radius of the supporting wheel | 85 mm |
| Bracket wheel radius | 70 mm |
| Driving Conditions | Fr1 | Fr2 | Fr3 | Fr4 | FR |
|---|---|---|---|---|---|
| Straight-line driving on level ground | 0 | 0 | 14.31 | 1.61 | 15.92 |
| Climbing and driving in a straight line | 10.36 | 0 | 14.31 | 1.61 | 26.28 |
| Steering on level ground | 0 | 12.91 | 14.31 | 1.61 | 28.83 |
| Climbing and steering | 10.36 | 12.91 | 14.31 | 1.61 | 39.19 |
| Parameters | Limit Gradient for Cross-Slope Travelling (°) | Longitudinal Slope Uphill Limiting Gradient Angle (°) | Longitudinal Downhill Limit Slope Angle (°) | Over the Vertical Wall Limit Height (mm) | Crossing the Extreme Width of the Trench (mm) |
|---|---|---|---|---|---|
| Numerical Values | 20 | 26 | 23 | 450 | 1150 |
| Parameters | Numerical Values |
|---|---|
| Terrain Stiffness (k_c) | 0.42 |
| Terrain Stiffness (k_phi) | 2.19 × 10⁻² |
| Exponential Number (n) | 0.5 |
| Cohesion (c) | 4.14 × 10⁻³ |
| Shearing Deformation Modulus (K) | 13 |
| Suspension mode | 25 |
| Sinkage Ratio | 5 × 10⁻² |
| Velocity/m.s−1 | Vertical Wall Height/mm | |||||
|---|---|---|---|---|---|---|
| 250 | 300 | 350 | 400 | 450 | 500 | |
| 0.2 | pass | pass | pass | pass | pass | abortive |
| 0.4 | pass | pass | pass | pass | pass | abortive |
| Velocity/m.s−1 | Trench Width Height/mm | |||||
|---|---|---|---|---|---|---|
| 800 | 1000 | 1100 | 1200 | 1300 | 1400 | |
| 0.2 | pass | pass | pass | pass | abortive | abortive |
| 0.4 | pass | pass | pass | pass | abortive | abortive |
Disclaimer/Publisher’s Note: The statements, opinions and data contained in all publications are solely those of the individual author(s) and contributor(s) and not of MDPI and/or the editor(s). MDPI and/or the editor(s) disclaim responsibility for any injury to people or property resulting from any ideas, methods, instructions or products referred to in the content. |
© 2024 by the authors. Licensee MDPI, Basel, Switzerland. This article is an open access article distributed under the terms and conditions of the Creative Commons Attribution (CC BY) license (https://creativecommons.org/licenses/by/4.0/).
Share and Cite
Chen, Y.; Wang, Z.; Zhang, H.; Liu, X.; Li, H.; Sun, W.; Li, H. Investigation of the Traveling Performance of the Tracked Chassis of a Potato Combine Harvester in Hilly and Mountainous Areas. Agriculture 2024, 14, 1625. https://doi.org/10.3390/agriculture14091625
Chen Y, Wang Z, Zhang H, Liu X, Li H, Sun W, Li H. Investigation of the Traveling Performance of the Tracked Chassis of a Potato Combine Harvester in Hilly and Mountainous Areas. Agriculture. 2024; 14(9):1625. https://doi.org/10.3390/agriculture14091625
Chicago/Turabian StyleChen, Yangzhou, Zeyu Wang, Hua Zhang, Xiaolong Liu, Hui Li, Wei Sun, and Hongling Li. 2024. "Investigation of the Traveling Performance of the Tracked Chassis of a Potato Combine Harvester in Hilly and Mountainous Areas" Agriculture 14, no. 9: 1625. https://doi.org/10.3390/agriculture14091625
APA StyleChen, Y., Wang, Z., Zhang, H., Liu, X., Li, H., Sun, W., & Li, H. (2024). Investigation of the Traveling Performance of the Tracked Chassis of a Potato Combine Harvester in Hilly and Mountainous Areas. Agriculture, 14(9), 1625. https://doi.org/10.3390/agriculture14091625