Article

People, Palms, and Productivity: Testing Better Management Practices in Indonesian Smallholder Oil Palm Plantations †

by
Lotte S. Woittiez
1,*,
Maja Slingerland
1,
Meine van Noordwijk
1,
Abner J. Silalahi
2,
Joost van Heerwaarden
1 and
Ken E. Giller
1
1
Plant Production Systems Group, Wageningen University & Research, Radix Nova, Building 109, 6708 PB Wageningen, The Netherlands
2
PT. Central Alam Resources Lestari, Jalan HR Soebrantas No. 134, Panam, Pekanbaru 28293, Riau, Indonesia
*
Author to whom correspondence should be addressed.
This paper is a part of the Ph.D. Thesis of Lotte S. Woittiez, presented at Wageningen University (The Netherlands).
Agriculture 2024, 14(9), 1626; https://doi.org/10.3390/agriculture14091626
Submission received: 26 July 2024 / Revised: 6 September 2024 / Accepted: 10 September 2024 / Published: 17 September 2024
(This article belongs to the Section Agricultural Economics, Policies and Rural Management)

Abstract

:
More than 40% of the total oil palm area in Indonesia is owned and managed by smallholders. For large plantations, guidelines are available on so-called ‘best management practices’, which should give superior yields at acceptable costs when followed carefully. We tested a subset of such practices in a sample of smallholder plantations, aiming to increase yields and profitability. We implemented improved practices (weeding, pruning, harvesting, and fertiliser application) in 14 smallholder plantations of 13–15 years after planting in Jambi province (Sumatra) and in West-Kalimantan province (Kalimantan) for a duration of 3 to 3.5 years. During this period, we recorded yields, measured palm leaf parameters and analysed leaf nutrient contents. Yield recording then continued for an additional two years. In the treatment plots, the yields did not increase significantly, but the size of the bunches and the size of the palm leaves increased significantly and substantially. The tissue nutrient concentrations also increased significantly, although after three years, the potassium concentrations in the rachis were still below the critical value. Because of the absence of yield increase and the additional costs for fertiliser inputs, the net profit of implementing better management practices was negative, and ‘business as usual’ was justified financially. Some practices, such as harvesting at 10-day intervals and the weeding of circles and paths, were received positively by those farmers who could implement them autonomously, and were applied beyond the experiment. It is challenging to find and implement intensification options that are both sustainable and profitable, that have a substantial impact on yield, and that fit in the smallholders’ realities. On-farm experimentation and data collection are essential for achieving sustainable intensification in smallholder oil palm plantations.

1. Introduction

Palm oil is currently the most important vegetable oil in the world, with an annual production of around 75 million metric tonnes in 2021 [1]. The oil palm (Elaeis guineensis Jacq.) is a highly efficient crop, with potential production well over 10 t oil ha−1 year−1 [2]. Indonesia is the world’s largest palm oil producer, with a cultivated area of 12 million hectares in 2020 [1], equivalent to about 11% of the combined land area of Sumatra and Kalimantan. Currently, over 40% of the Indonesian oil palm area is managed by smallholder farmers [3], many of whom depend on oil palm as their primary source of income [4]. Indonesian smallholders are usually classified as plasma farmers (also called scheme or tied, i.e., fields were planted as a company scheme and bunches are sold to the company mill); independent farmers (i.e., fields were planted independently by smallholder farmers, and bunches can usually be sold to any mill); and mixed farmers (or tied+, i.e., farmers who own both plasma and independent fields) [5,6]. Most smallholder farmers manage their plantations individually, and yields are around three t oil (14 t fresh fruit bunches) ha−1 year−1 [7], which is less than yields of large plantations [3] and much less than the potential yield [8]. Oil palm expansion in Indonesia and Malaysia has been associated with tropical deforestation and biodiversity loss [9], and expansion of plantations into peat forests has caused large emissions of CO2 [10]. If oil palm is to continue its role as the main global source of vegetable oil, then rapid and uncontrolled expansion need to be replaced with intensification and controlled expansion into areas of degraded land [11].
Good agricultural practices (GAP) in nursery, immature, and mature oil palm plantations are well described [12] and can result in excellent yields of above seven t oil ha−1 year−1 in commercial plantations when implemented rigorously [13]. In smallholder oil palm production, the same agronomic principles apply as in large-scale plantations, but smallholders face a range of unique constraints and challenges [7,14,15,16,17]. The production constraints for unsupported smallholders (independent or in partnership with an unsupportive company) are especially large. These smallholders have less investment capacity and less access to knowledge and inputs [3]. They have less options in selecting favourable soil conditions and must accept site quality as is, with limited opportunities to modify drainage or correct specific soil constraints. And the quality of the planting materials they use is often poor [7,18]. For these reasons, aiming for ‘best practices’ is not necessarily fitting for smallholders, and recommendations from large-scale companies for improving yields cannot be assumed to be suitable for smallholder farmers as well. We define better (rather than ‘best’) management practices as practices that increase yield or the environmental performance or both, without aiming for (or claiming) the absolute best.
Studies on the management of smallholder plantations [3,7,14,16,17,19,20,21] generally point to limited implementation of good agricultural practices in smallholder fields. This can be attributed, at least partly, to the costs farmers face when trying to increase yields, due to high input prices, labour costs, uncertain farm-gate prices for their products, challenges in obtaining credit for investments and lack of reliable information on crop responses to be expected. In addition, oil palm is a relatively new crop, and many farmers lack experience with good agronomic practices. Nevertheless, yields of around 5.5 t oil ha−1 over the productive plantation lifetime have been reported with several groups of well-organised plasma smallholders [22]. Thus, smallholders can achieve similar yields to large plantations, provided that the establishment phase was well managed, and farmers work together to alleviate constraints, e.g., the limited availability of transportation, labour and inputs.
The current poor productivity in smallholder plantations means that more land is required to meet the demand for palm oil. Improving yields in smallholder plantations with sub-standard planting materials and/or suboptimal crop management can be achieved through two pathways: rehabilitation (improving yield in existing stands) and renovation (replanting). In practice, replanting is a large investment, and improving yields in existing stands through the implementation of better management practices is the more likely approach to be taken up in plantations well below the ‘critical age’ of 25 years after planting. Knowledge of the yield effects and the costs and benefits of better practices in smallholder oil palm plantations is limited (but see [23,24,25,26]). Here, we report a study on the implementation of better practices in 14 smallholder plantations in Sumatra and Kalimantan, in Indonesia. We address the following questions: (1) What yields can be achieved in mature smallholder oil palm plantations after implementing better practices; (2) How do palm growth, tissue nutrient concentrations and yields change over time in response to better practices; and (3) What are the costs, benefits and risks of intensification? Our objectives are to improve our understanding of the response of mature smallholder oil palms plantations to better practices, to assess the costs and benefits, and to provide recommendations on the opportunities and the risks of different agronomic practices.
Section 2 provides a description of the study area and an overview of the experimental setup, measurements, and data analysis. In Section 3, we present our results. In Section 4, we critically discuss our results and place them in a broader perspective. In Section 5, we present our conclusions, recommendations, and proposed ways forward.

2. Materials and Methods

This research project started in 2014 and consisted of two phases: an implementation phase (2014 to 2017) and an extension phase (2018 to 2019), in which only yield recording continued and all other project activities were terminated.

2.1. Research Area

Fourteen paired experimental plots were established in existing smallholder oil palm plantations in Indonesia. The plantations were in two contrasting regions: Sintang regency, West-Kalimantan province on the island of Borneo (referred to as ‘Sintang’), and Muaro Jambi regency, Jambi province on Sumatra (referred to as ‘Jambi’; see Table 1 for soil characteristics and Supplementary Materials Box S1 and Figures S1 and S2 for other details of the two sites). In Jambi, the experiments were in Ramin village (1°30′9.94″ S, 103°48′41.09″ E) and started in April 2014. Ramin village was selected out of several villages because the palms in the plantations were of the right age, and over two-thirds of the tested bunches were of the tenera variety. In Sintang, there was an ongoing collaboration with the farmer cooperative in Mrarai village (0°6′56.37″ S, 111°27’13.52″ E), where the experiments were established in plasma fields with 100% tenera planting materials in September 2014. For more information about Jambi and Sintang, see Supplementary Materials Box S1 and Figures S1 and S2.

2.2. Farmer Selection

Farmers in each site were selected non-randomly based on the location of their plantations and their willingness and capacity to participate. We preferred non-random selection because the project required substantial labour inputs over a four-year period, so willingness to participate was crucial. In Jambi, the selected sample consisted of six independent smallholder farmers (J1–J6; Table 1), who were all (extended) family or close friends of a local leader. The average plantation size of the sample was 19 ha, which was significantly larger than the average plantation size of other farmers in the village (4.1 ha). In Sintang, eight plasma plantations of two hectares each were selected (S1–S8; Table 1), of which three were managed by one farmer but owned by others. The main biophysical selection criterion was soil type (three plantations had peat pockets; the others were on mineral soils only). Both in Jambi and in Sintang, the farmers in the sample were relatively wealthy and were expected to have enough time, money and labour available to implement the required management practices in the experimental fields. The plantation company in Sintang did not provide any management support, but harvesting was arranged through the plasma cooperative. For full site descriptions including rainfall and temperature data, see Supplementary Materials Box S1 and Figures S1 and S2.

2.3. Training and Management

At the start of the project, all participating farmers were trained in better management practices, both in a classroom and in the field. The better management practices that were implemented are listed in Table 2. Practices are described in detail in [27,28,29]. Before the first round of fertiliser application, farmers were asked to establish weeded circles, harvesting paths, and frond stacks, and to carry out pruning. Management practices were recorded monthly and scored during annual field audits on a scale from 1 (poor) to 3 (good; see Supplementary Materials Box S2 and Table S1 for details). Nutrient applications before the start of the project were estimated on the basis of farmer recall. Based on the results from soil and leaf testing, a fertiliser application plan for a target yield of 24 t ha−1 year−1 was drawn up by an experienced oil palm agronomist (Table 3). Fertilisers were purchased directly from distributors in Jambi and Sintang and were applied by the farmers and the researchers together. Rock phosphate was broadcast everywhere apart from the harvesting path; KCl (in Jambi) and Korn Kali B (in Sintang) were applied over the frond stack; and urea and borate (in Jambi) were applied in the palm circle. Fertiliser applications were repeated every six months (urea, Korn Kali B) or yearly (rock phosphate, borate). Empty fruit bunches (EFB), copper and zinc were applied only once.

2.4. Experimental Setup

Each two-hectare plantation was divided into three parts: a BMP plot of about one ha (where better management practices were introduced); a REF plot of about one ha (the reference or control, where farmers were encouraged to continue with their management as usual); and two rows of palms between the plots to separate them, which were managed as the REF plots and were not sampled. To fulfil their function as a demonstration, the BMP plots were always the ones next to the road. If both plots were next to the road, then the BMP plot was allocated randomly. The plots were mapped with a GPS device, and the number of productive palms was counted.

2.5. Yield Recording

Production was recorded at every harvest by a local project assistant. The harvesters were instructed by the farmers to separate the bunches from the BMP and the REF plots, and for each plot, the number of bunches was counted, and the total weight was recorded. The bunch weight was calculated by dividing the total weight over the bunch number. Yield recording continued until September 2019.

2.6. Vegetative Measurements; Soil and Tissue Sample Collection

In all plots on mineral soil, six sample palms per plot (referred to as LSU; Leaf Sampling Units) were selected based on a grid system, representing the four corners of the plot, and two palms in the middle. In the peat plots, four palms per soil type per plot were selected. Unhealthy, immature, and shaded palms, and palms within two rows from the plot border were excluded. Leaf 17 was identified and excised [30], and the length, petiole width and thickness, and number of leaflets of leaf 17 were measured or counted, as well as the length and breadth of the eight largest leaflets (four from the left and four from the right side of the rachis). The trunk girth at breast height and the height of the trunk (at the base of leaf 41) were measured. The middle ~0.20 m piece of the eight largest leaflets of leaf 17 were collected as leaf samples. In addition, a piece of rachis of approximately 0.20 m in length was sampled from the same point on the leaf. Vegetative measurements and tissue sampling were repeated yearly. Samples were collected between 8.30 am and 4.30 pm. Where possible, sampling within three months after fertilizer application or directly after heavy rainfall was avoided. In two plantations in Sintang (S4 and S6), the tissue samples from the individual palms were collected at 4-month intervals and analysed separately (apart from the sample at the start of the experiment) to collect more detailed information and assess between-tree variability. Soil sampling was carried out once, at the start of the project. Soil samples were collected with an Edelman combination auger at 0–0.40 m deep. Two samples were collected in the zones of fertilizer application around each sample palm: one at 0.5 m from the trunk in the palm circle (representing around 20% of the plantation area) and one at 3 m from the trunk in the inter-row under the frond stack (representing around 12% of the plantation area) [31].

2.7. Processing and Analysis of Soil Samples

Soil samples were air-dried in plastic trays or open plastic bags and then ground and sieved with a 2 mm sieve. The <2 mm soil fraction was analysed as follows: pH in water; extractable P using the Bray II protocol; Al + H through 1 M KCl extraction followed by titration; soil-extractable K using 1 M ammonium acetate extraction followed by flame photometry; soil-extractable Mg and Ca using 1 M ammonium acetate extraction followed by atomic absorption spectrometry (AAS); and soil texture by the Bouyoucos hydrometer method. Samples were ground further to <0.5 mm for the analysis of soil organic N through Kjeldahl digestion and distillation followed by titration; and of total organic matter through the Walkley–Black chromic acid wet oxidation method. All samples were analysed at Central Group CPS Laboratory in Pekanbaru, Sumatra.

2.8. Processing and Analysis of Leaf Samples

Before drying, the midrib of the leaflets was removed, and the remainder was cut into 50 mm strips. Rachis samples were shredded using a machete. Leaflet and rachis samples were first air-dried and then oven-dried at ~70 °C for 48 h. After drying, the leaflets were coarsely ground in a coffee grinder, and subsamples were sent to the laboratory for analysis. In the laboratory, the samples were ground finely and passed through a 0.5 mm sieve. Then, the following analyses were carried out: leaf nitrogen through Kjeldahl digestion and semi-micro Kjeldahl distillation; leaf and rachis P through dry ashing followed by spectrometric analysis (vanadomolybdate method); leaf and rachis K using flame emission photometry after dry ashing; leaf Ca and Mg by atomic absorption spectroscopy after ashing; and leaf B using spectrometry after dry-ashing and uptake in H2SO4. Samples were analysed at Central Group CPS Laboratory in Pekanbaru, Sumatra.

2.9. Data Analysis

One plantation (S2) was excluded from the data analysis because the data were incomplete and management practices in the BMP plot were not implemented to a sufficient standard. The results from fields S3 and S5 in Sintang were excluded from the yield analysis because plantation sizes were not clear, and J4 in Jambi was excluded because yield records in 2014–2015 showed abnormal numbers (bunch weights > 35 kg). This resulted in a total of 5 fields in each of the areas for yield and cost–benefit calculations. For other calculations, six fields in Jambi and seven in Sintang were included. The palms on peat were excluded from the tissue nutrient concentrations and the vegetative growth calculations; we only included data from the palms on mineral soil.
All parameters were normally distributed apart from petiole cross-section (PCS; D(104) = 0.092, p < 0.05), which was log-transformed to resolve skewness. Tissue nutrient concentrations were analysed per plot (n = 26), and vegetative growth parameters were collected and analysed for individual palms (n ≤ 148, depending on the number of missing values). Production data were aggregated over months by calculating the monthly mean and sum for bunch weights and total production, respectively. Yield was defined as the total production in metric tons divided by the plot size in hectares (note: BMP plots in Jambi were significantly larger than REF plots). Four outliers for bunch weight (>3 × Interquartile Range) were removed before statistical analysis. To analyse differences in bunch weight and yield between BMP and REF treatments over time the following linear mixed model was used (Equation (1)):
Bunch weight/Yield ~ Year * Area * Treatment + Field/Plot/Year/Month
In this model, the terms Field, Plot, Year and Month (as nominal variables) are nested random effects needed to account for the spatial and temporal dependencies in the data. Time dependence in the monthly residual variation was accounted for by an autocorrelative covariance structure with a lag of 1 month. Fixed terms represented Treatment (BMP or REF), Year (as numeric variable, 2014 to 2019) and Area (Jambi or Sintang). The * operator in the model indicates the expansion of all main effects and interactions. The interaction of Treatment and Year was included to specifically test for cumulative effects of improved management over time. Significance of fixed effects was calculated using an F test with Satterthwaite’s approximation for the denominator degrees of freedom. All statistical analyses were performed in R.
Farmers were asked to record data on costs of labour and inputs, but the records were repeatedly found to be incomplete, except for fertiliser costs. For this reason, only fertiliser costs were included to calculate the annual change in costs (BMP—REF; 106 Rp ha−1 year−1) in the cost–benefit analysis. Fertiliser costs included the actual or reported purchase costs for all fertilisers that were applied (including empty fruit bunches). Prices per bag or ton were multiplied with the number of bags or tons ha−1 year−1, and summed to give the total fertiliser cost ha−1 year−1. Benefits were calculated by subtracting annual yields in the REF plots from annual yields in the BMP plots (kg ha−1 year−1) and then multiplying with an average bunch price of 1200 Rp kg−1. Outcomes were converted to USD using an exchange rate of 15,000 Rp USD−1. In 2018 and 2019, we assumed that the costs were equal to the mean costs over the previous years as we did not have data on fertiliser applications during these years.

3. Results

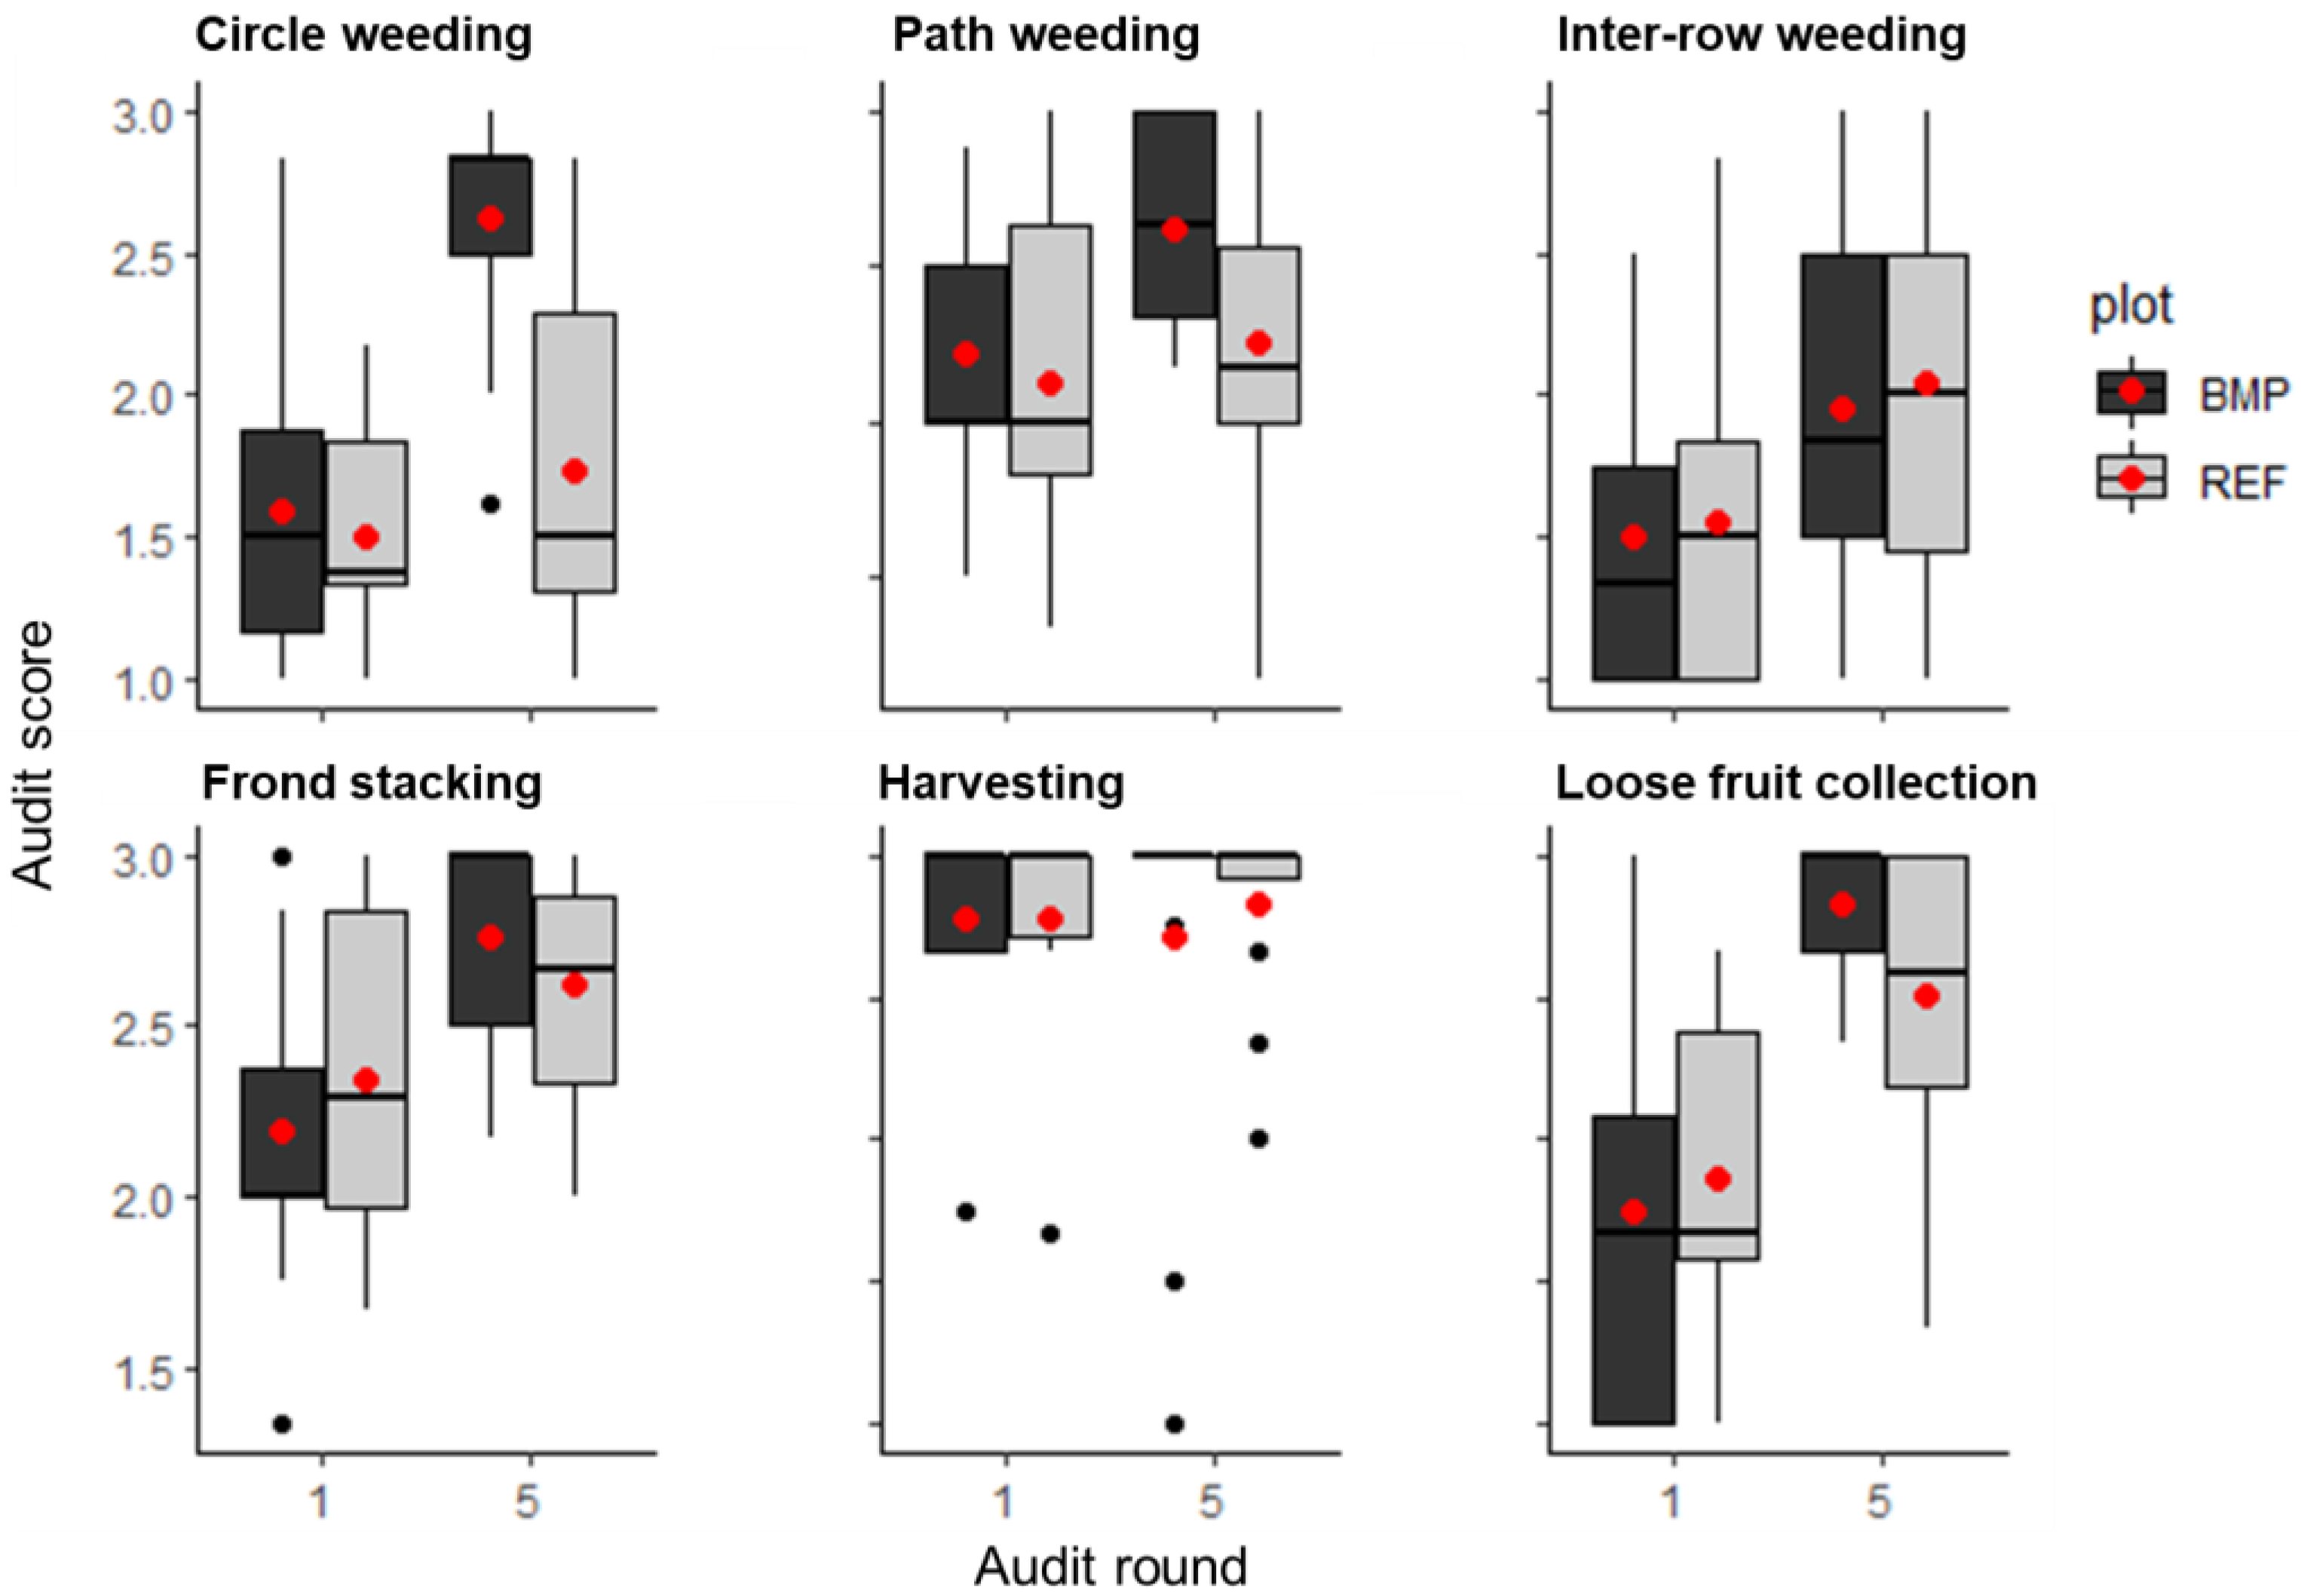
3.1. Application of Management Practices

Field audit results from audit 1 (baseline) and audit 5 (final) are shown in Figure 1. We observed clear improvements in plantation management, especially circle weeding, frond stacking, and loose fruit collection. Generally, the improvements were observed in both the BMP and the control plots (see also Supplementary Materials Box S2). For nutrient application, farmers were specifically requested to continue their previous practices in the control plots, but the application practices changed quite strongly during the project (Figure 2). At least five farmers reported that they started to apply more fertilisers after learning from the programme. Three farmers stopped applying fertilisers altogether for one or more years to save money for plantation expansion (one farmer) or for family matters (two farmers). Farmer S4 began with a very under-fertilised plot and he resumed fertiliser application in the control plot at the start of the project.
While less nutrients were generally applied in REF plots than in the BMP plots in Jambi, the median applications in the control plots in Sintang were mostly similar to the BMP median.

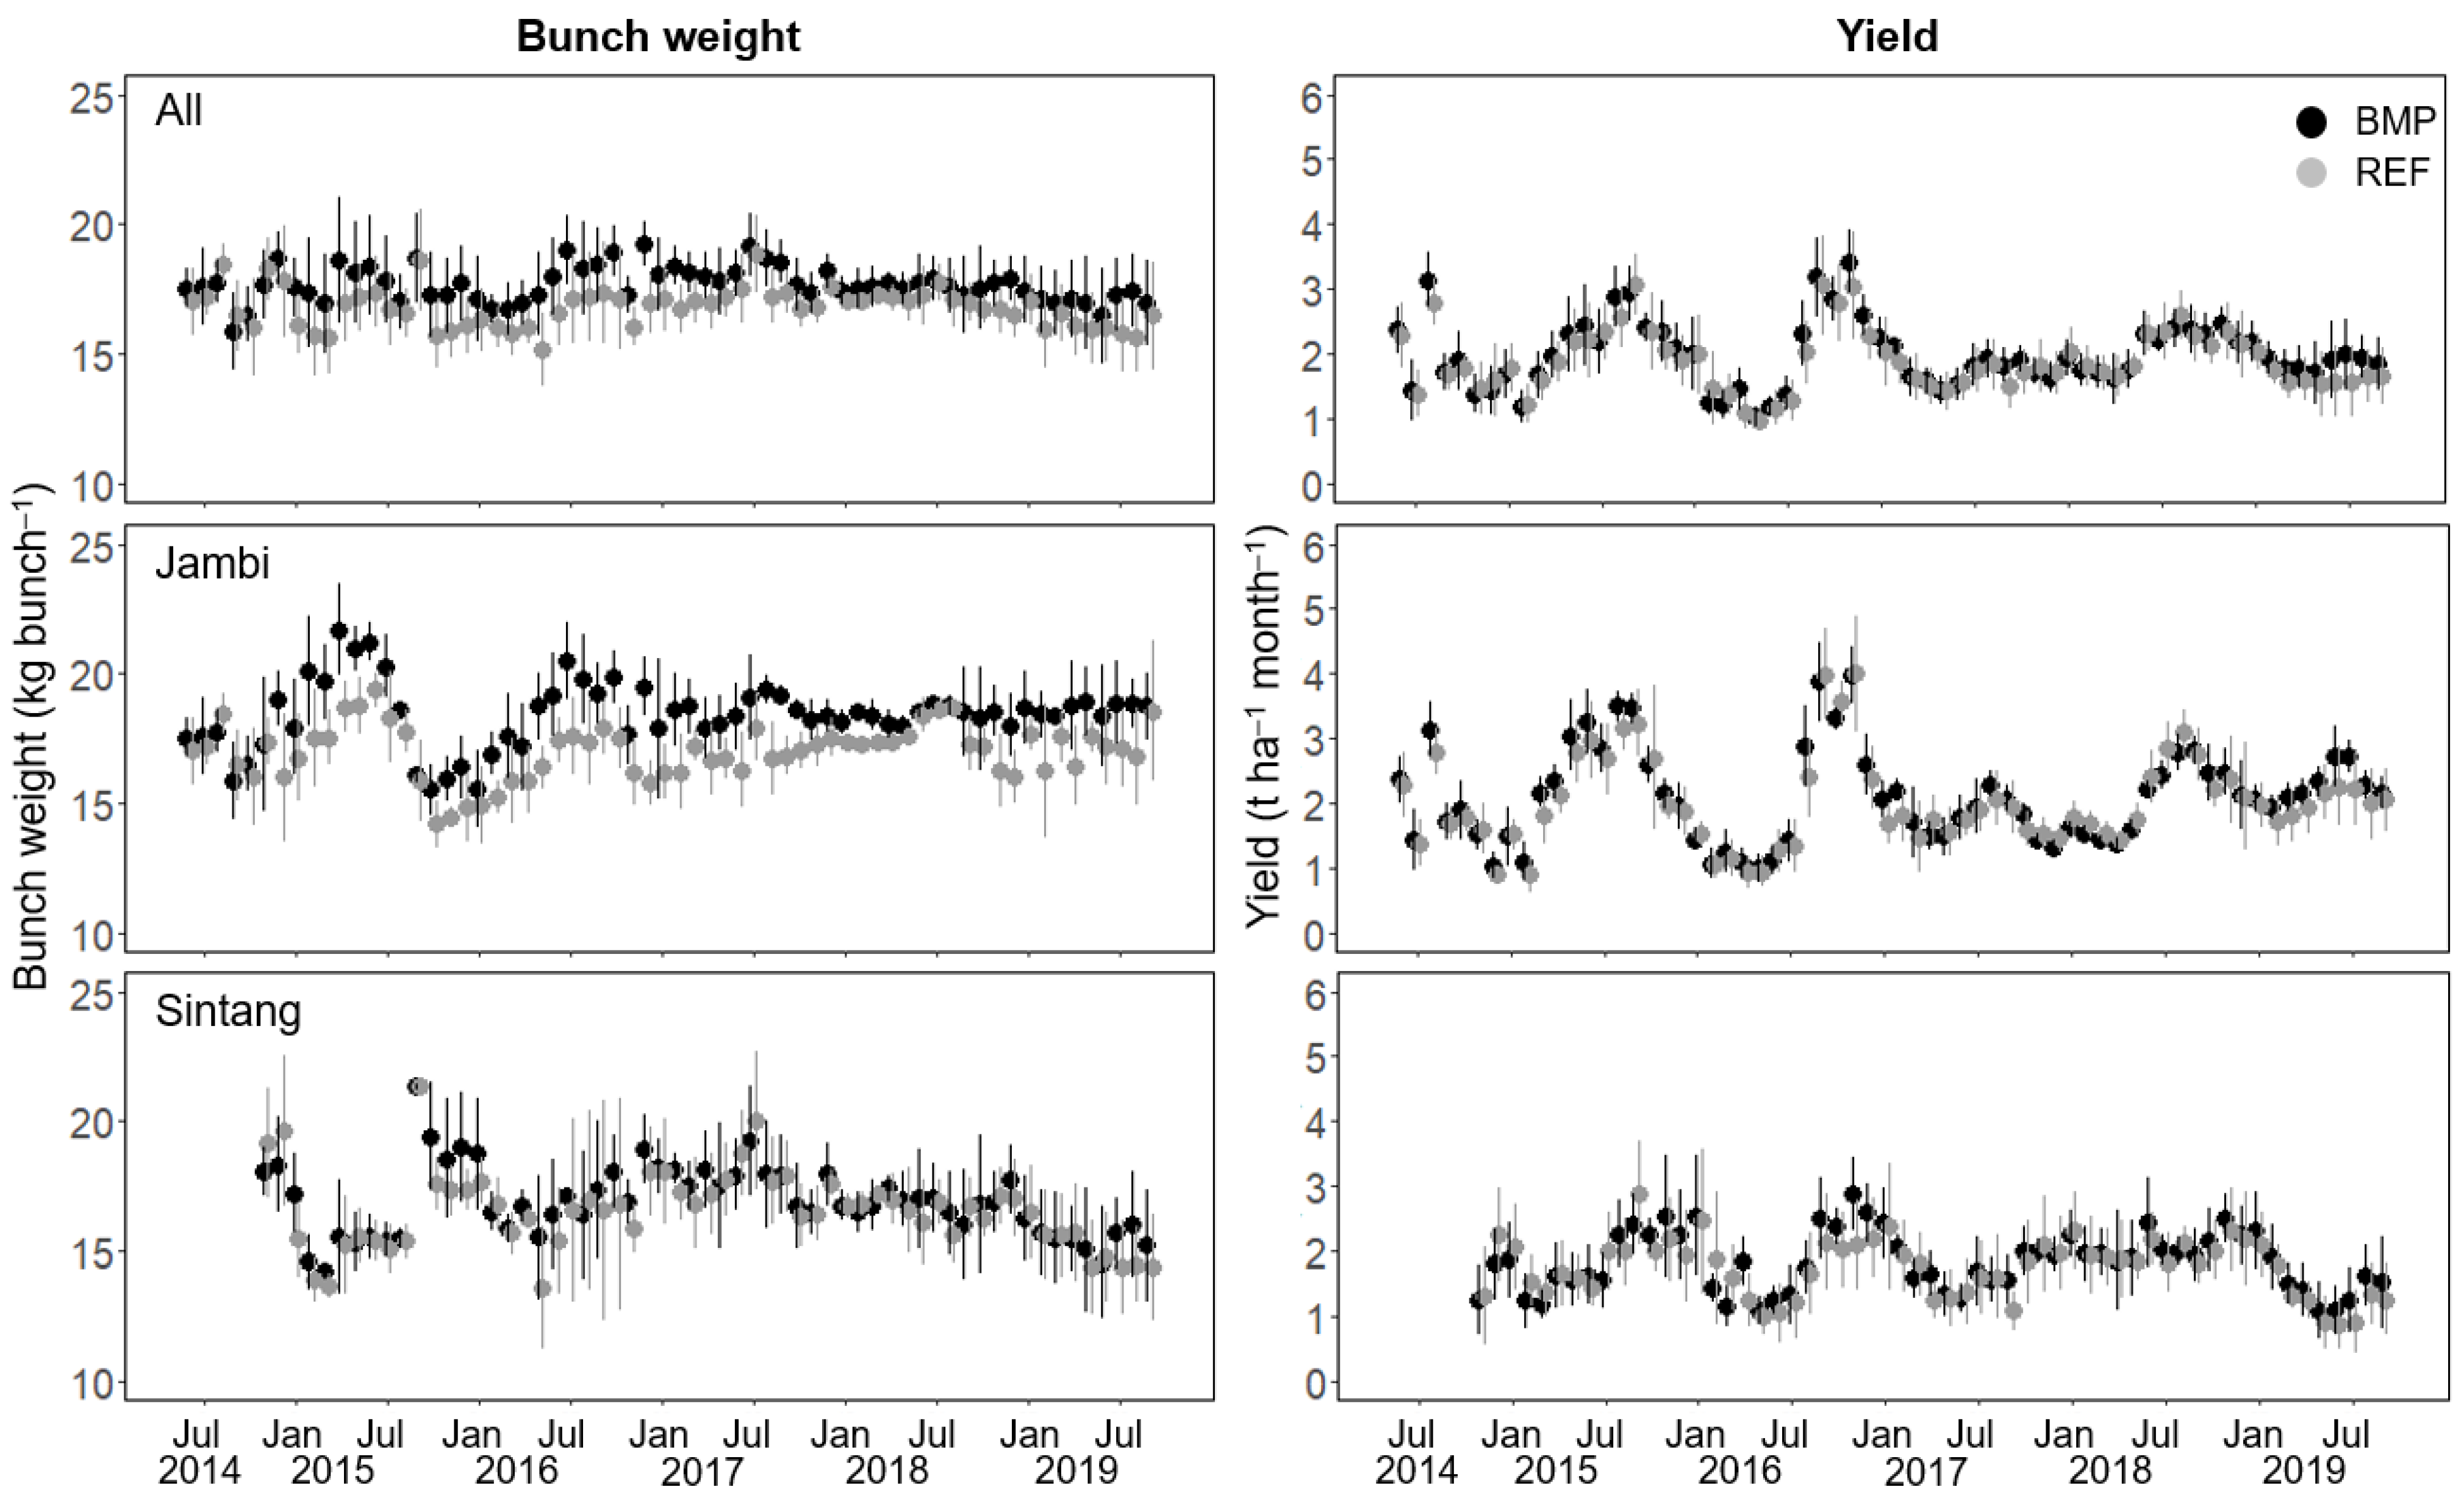
3.2. Bunch Weight and Yield

Averaged over both areas, mean bunch weights showed a clear and significant treatment response (mean weight BMP—weight REF 0.834 kg; 95% C.I. 0.278–1.39, p = 0.003; Figure 3), but there was a significant interaction with area (p = 0.04) and the response was much smaller (0.25) and not significant in Sintang when tested separately (p = 0.640). Although we detected no systematic increase in the effect of best practices on bunch weight over time, it can be seen in Figure 3 that differences between BMP and REF in Jambi only became visible after the first six months. A distinct depression in bunch weights from July to November 2015 is also visible for Jambi, during which no differences between treatments were observed. Bunch weights recovered steadily in the subsequent months, with BMP showing consistently higher values until the end of the study period.
Annual yields in participating fields varied between 17.5 and 32 t ha−1 year−1 in 2018 (Figure S3). A significant treatment effect on yield was not observed (mean difference in monthly yield BMP—REF 0.085 t ha−1; 95% C.I. −0.12–0.29; p = 0.45; Figure 3). The estimated mean difference over all trials would suggest a yearly yield benefit of BMP of 1.02 t ha−1 over a mean reference yield of 22.4 t ha−1. There was no significant difference in yields between research areas, and we found no evidence for a consistent yearly time trend in either yield or treatment response.

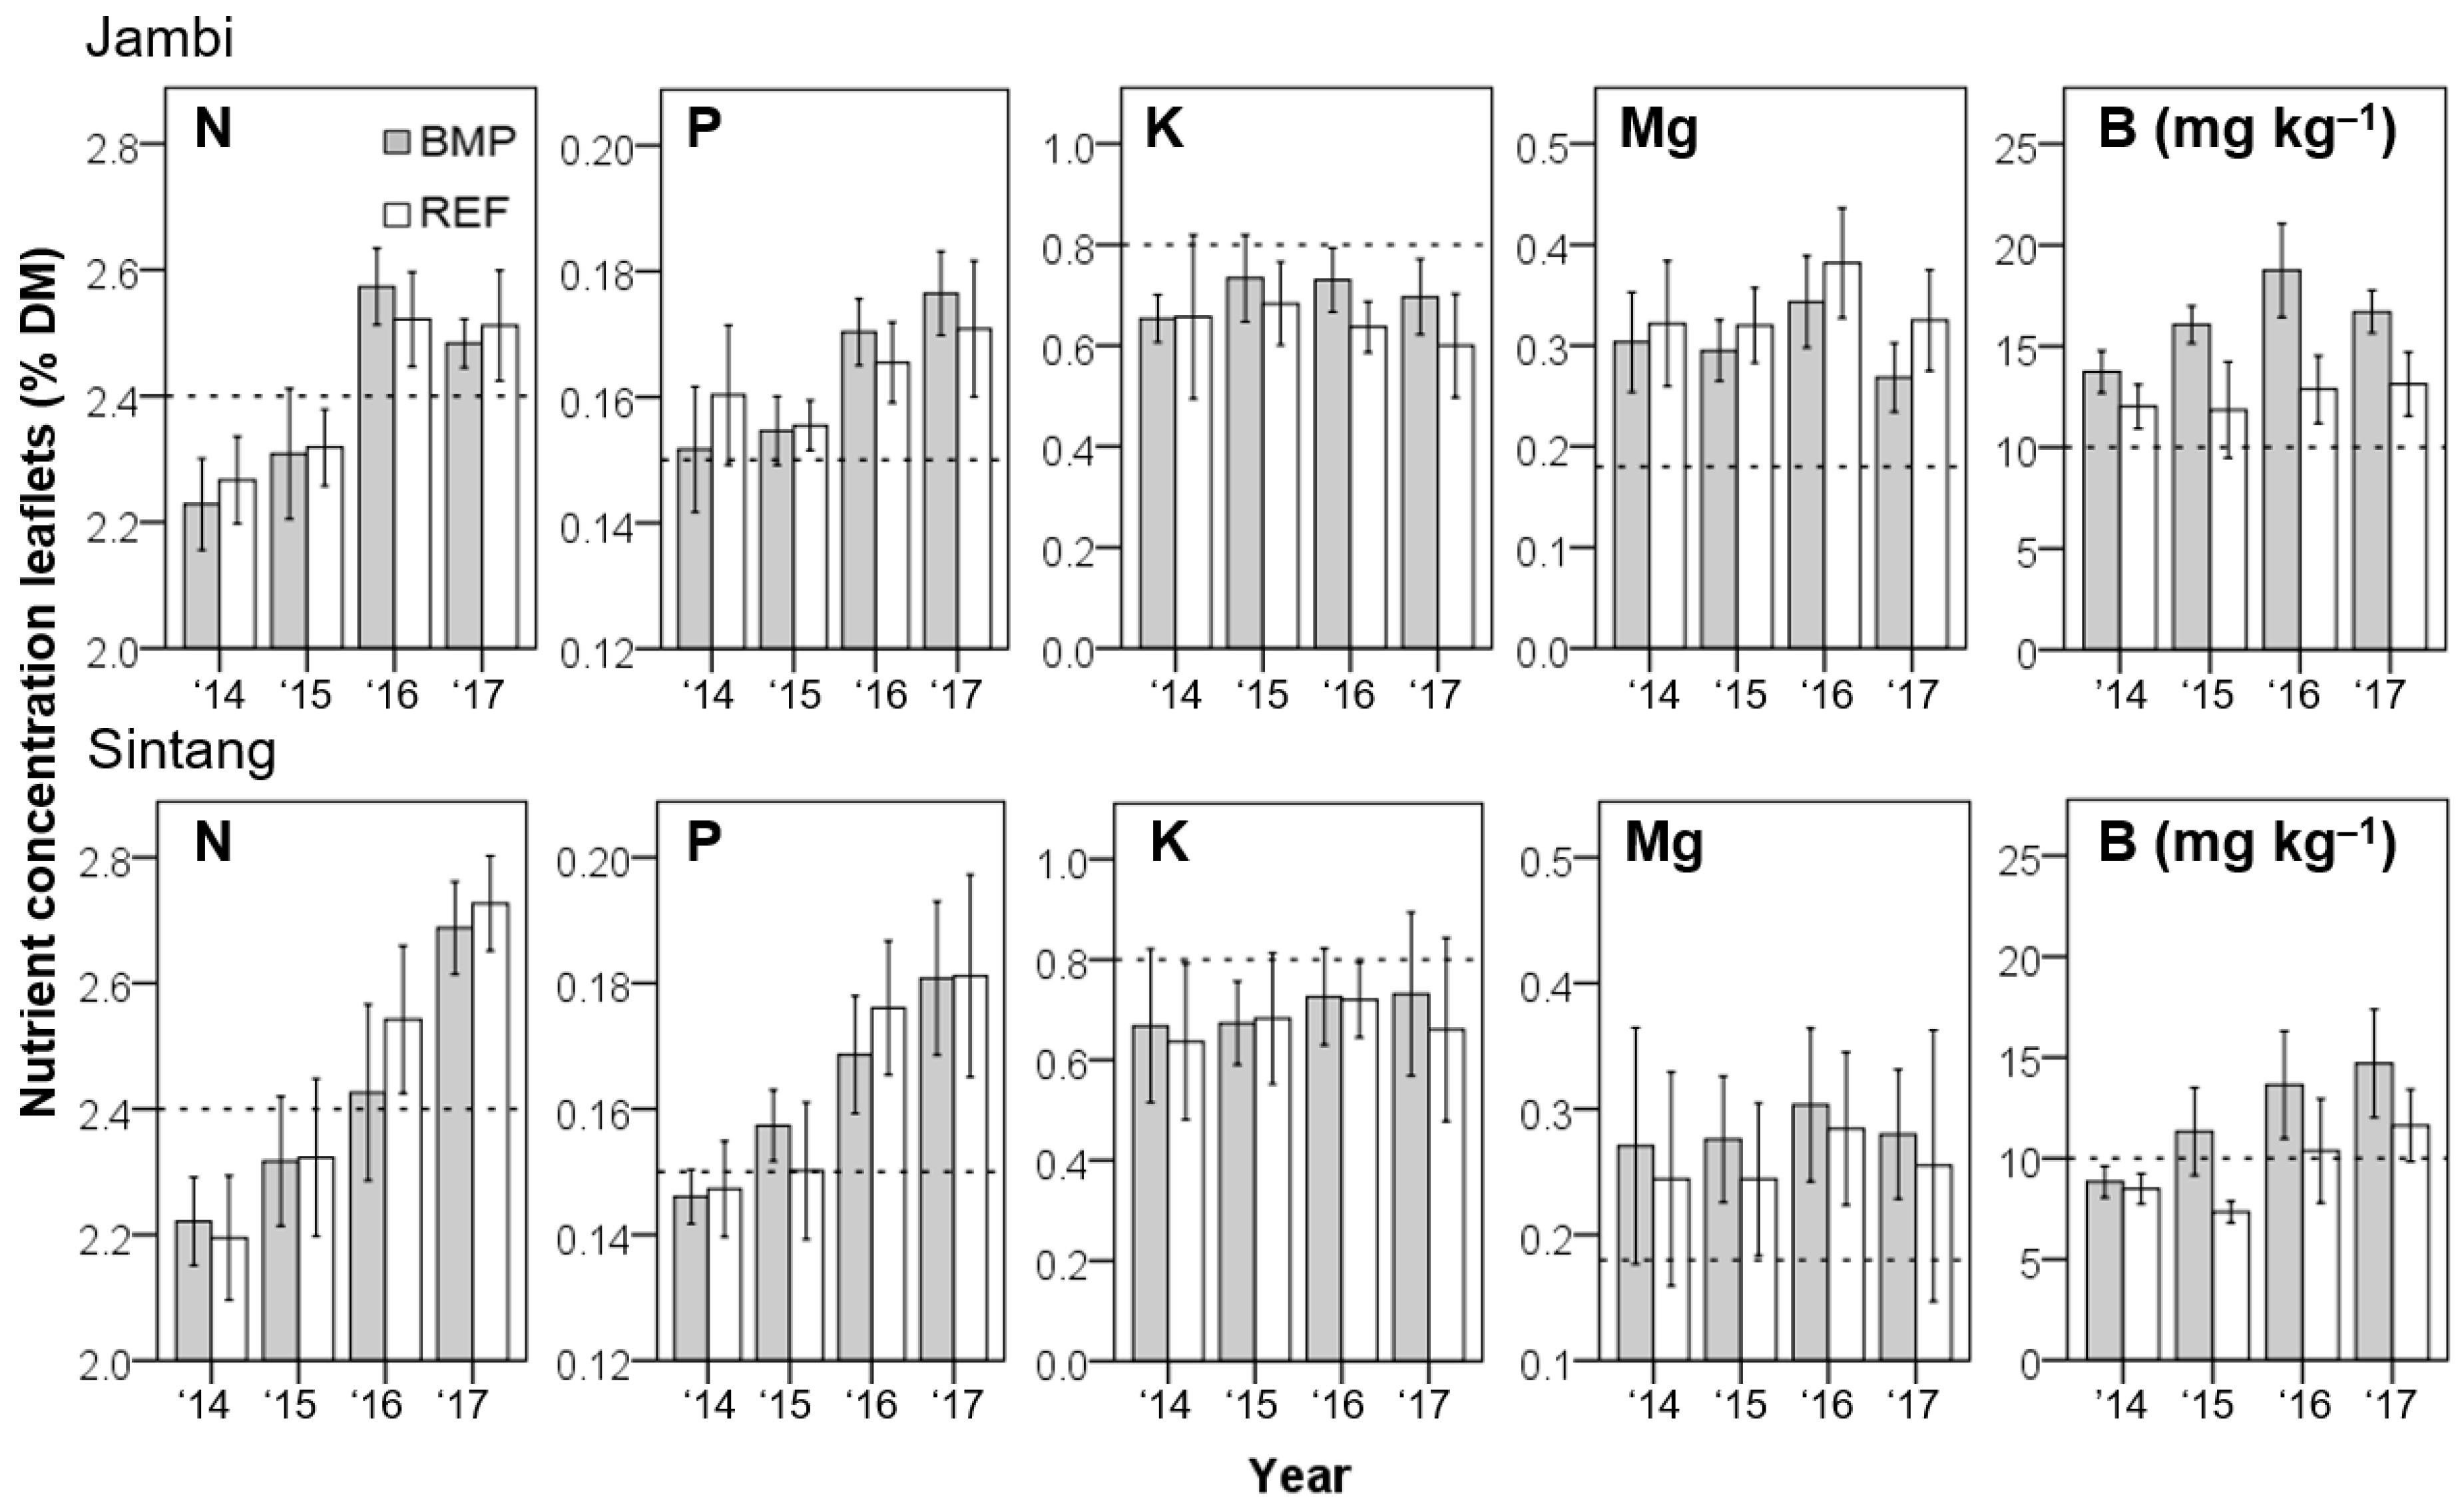
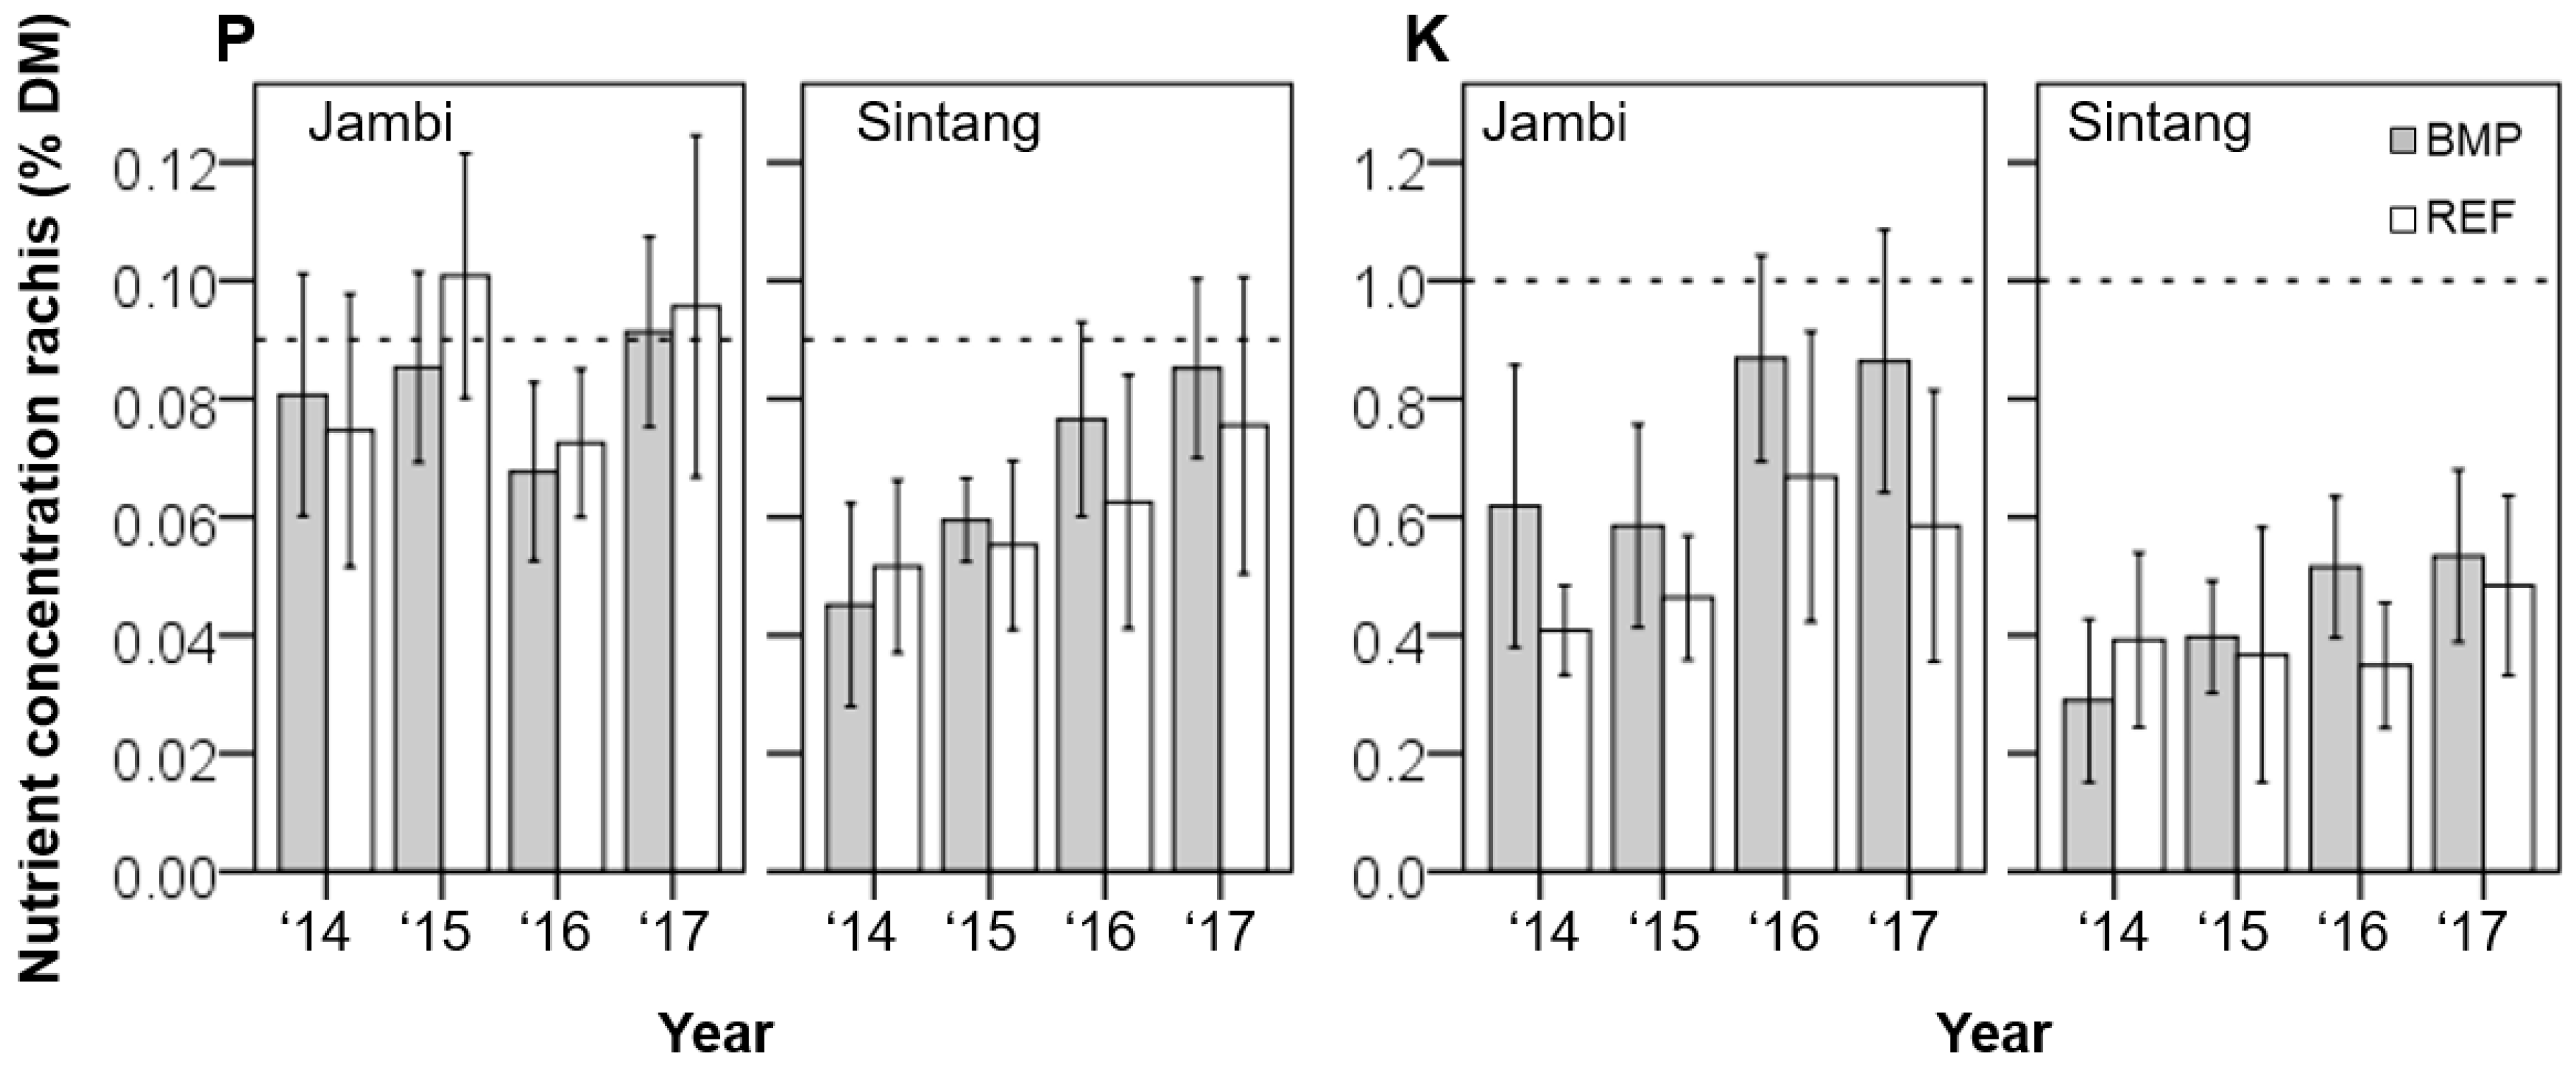
3.3. Tissue Nutrient Concentrations

At the start of the project, the average tissue nutrient concentrations for N, P and K (but not Mg and B) were below the critical values, and fertiliser applications were expected to increase tissue concentrations (Figure 4; see Supplementary Table S2 for an overview per field and Supplementary Figure S4 for results from individual palms measured every four months in fields S4 and S6). During the project, the concentrations of N, P, K and B in the palm tissue increased significantly. For the concentrations of N, P and Mg in the leaflets and of P in the rachis, there was a significant positive effect of year (p < 0.001) but not of treatment (Figure 4 and Figure 5). There was no effect of year or treatment on leaflet K, but a highly significant positive effect of both treatment (p < 0.001) and year (p < 0.01) on rachis K (Figure 4 and Figure 5). In Jambi, rachis K values were significantly larger than in Sintang (p < 0.01). Three years after the start of the experiment, average rachis K concentrations remained below the critical value, but leaflet concentrations relative to the total leaf cation (TLC) concentration were above or close to critical values in Jambi from 2015 onwards. Leaflet B concentrations responded rapidly to increased B fertiliser application, and both treatment and year had a highly significant positive effect (p < 0.001).

3.4. Vegetative Growth

Palm vegetative growth parameters were measured at each sampling round (Figure 6 and Figure S5; Table S2). As all the palms in the sample plantations were more than ten years old, no significant increase in leaf size due to palm ageing was expected, but palm height was expected to increase gradually. All vegetative growth parameters were strongly correlated (p < 0.01) apart from leaflet length and leaflet breadth.
On average, there was a significant positive treatment effect on petiole cross section, palm height, leaflet length (p < 0.05) and leaflet breadth (p < 0.01) from 2015 onwards. The effect was even more pronounced in 2017. Frond length did not show a significant treatment response but increased strongly between 2014 and 2016 (p < 0.01; Figure 6). On average, changes were more pronounced in Jambi than in Sintang. In 2014 and 2015, there were no significant differences between the BMP and the REF plots for any of the vegetative parameters.

3.5. Costs and Benefits

The quality of the data on maintenance costs (particularly weeding and pruning) was insufficient to calculate exact differences between the treatments but some trends were observed. Average labour costs were around 100,000 Rp man-day−1 in the research areas, and farmers spent 5–10 man-days ha−1 year−1 on pruning and weeding activities. Farmers used 3–6 L ha−1 year−1 of herbicides, on average, representing a cost of Rp 200,000–400,000 (USD 16–33). The estimated reduction in herbicide use due to circle weeding (instead of clear weeding) was around one litre per hectare per event, while the labour demand went from a full day to about half a day per hectare.
We used only fertiliser prices and changes in yield to calculate the profitability of the BMP plots compared with the control plots (Table 4); other costs (harvesting, weeding, pruning) were excluded. Although the yields in the BMP plots were marginally (but not significantly) larger than in the control plots, the costs for fertilisers increased more than the returns in yield. This led to decreases in profit in Jambi, but in Sintang, the margins in 2016 and 2017 were positive. The price of fertilisers and the price that farmers received for their product strongly determined the profitability of fertiliser applications; farmers in Sintang did not (overall) apply less fertiliser in the REF than in the BMP plots, but they used cheaper, subsidised fertiliser, and received the same bunch price, so the profits in the REF plots were larger.

4. Discussion

In this research, we set out to learn along with farmers, who were supported in trying several changes in their management practices. We installed treatment and control plots, but these concepts need to be adapted to farmers and their approach to learning, because the reality is that if interventions seem to ‘work’, farmers are tempted to apply them on their whole farm [33]. We could not assume homogeneous BMP and control treatments, and we interpreted our results with this important constraint in mind.
Averaged over all trials and locations, we observed reference yields of about 22.4 t ha−1 year−1, which did not increase significantly by applying better management practices. We tested if yields increased significantly for the farmers with the poorest starting yields, but this was also not the case. We did observe significant positive effects of BMP for bunch weight and vegetative growth parameters (Figure 3 and Figure 4), and, to a lesser extent, tissue nutrient concentrations (Figure 5 and Figure 6), particularly K and B. Below, we explore the reasons why we observed some effects of our experimental practices but why these did not result in significant improvements in yield in both areas, and we discuss the lessons learned from three years of on-farm experimentation.
The non-significant increase in total yield can be explained by the increase in bunch weight, from 16.5 to 17.3 kg bunch−1 (mean in final year). We did not observe a change in bunch number. The sample size in our study was small and yields in the experimental fields were already substantial when the project started, which are likely to be key reasons why yield responses were small and not significant. Larger yield improvements have been demonstrated in earlier projects. In a well-described but small (n = 2) study on the rehabilitation of nutrient-deficient oil palm plots, Sidhu et al. [23] demonstrated that within three years after resuming nutrient applications, yields from un-fertilised plots increased by 10–15 t ha−1 and were restored to the same yield as fully fertilised plots (>33 t ha−1 year−1). We observed a similar trend in field S4 in Sintang, where yields steadily increased in response to resumed fertiliser applications, especially during the first two years of the project (Figure S6). This response was paralleled in the control plot, where fertiliser applications were also resumed. In another experiment, Griffiths and Fairhurst [24] achieved large yield gains in a four-year rehabilitation project in a company plantation, with large investments in drainage and soil conservation, but with fertiliser application rates similar to our own. Rhebergen et al. [34] demonstrated significant yield improvements (7–12 t ha−1) through the implementation of BMPs in Ghana. A later study among 261 smallholder farmers in Ghana showed that only the application of fertiliser had a significant positive effect on yield [26]. These studies and the results from field S4 show that it is possible to achieve substantial yield increases over a three to four-year project.
Clear differences between BMP and REF plots existed in terms of both quantities and fertiliser types applied in Jambi, and in terms of fertiliser types, but not quantities, applied in Sintang (Figure 1; Table 3). The nutrients applied before the start of the project were calculated based on farmer recall, but these may have been over-estimated, which means that nutrient applications in the REF plots increased along with applications in the BMP plots. This would explain the observed trends in tissue nutrient concentrations and may have contributed to the absence of a significant yield advantage in the BMP plots. At the start of the project, the concentrations of N, P and K in the leaflets and rachis were mostly below the critical concentrations [32,35] in both research areas, suggesting that deficiencies were prevalent. The N, P and B concentrations in the leaflets were increased to well above the individual critical values within one or two years after the project start (Figure 5 and Figure S4), indicating that applications of these nutrients were sufficient to meet the demand and correct existing deficiencies. The K concentrations changed more slowly, and average leaflet concentrations never reached the critical threshold (Figure 5). The limited increase in leaflet K concentrations in Jambi may have been due to the high Ca2+ concentrations in the soil (24–34 mmol kg−1 in the circle and under the frond stack, respectively). In such conditions, the application of KCl may actually reduce the leaflet K concentration while increasing yield [36]. The K concentration relative to TLC (total leaf cations) was on average sufficient (>31.3) in the BMP plots in Jambi and nearly sufficient (28.6) in Sintang, but rachis K values in both areas indicated a severe deficiency throughout the project (Figure 6). Palms in the experiment of [23] reached rachis K concentrations of >1.0% in year 3, but in Sintang, the average K concentrations in the rachis did not exceed 0.6% at the end of the project, which indicates a severe deficiency [32]. Concentrations in Jambi were higher but also remained below the deficiency line. We propose that the deficiency threshold for rachis K, which was set on the basis of fertiliser experiments in well-managed company plantations [32], may be too strict for smallholder conditions and requires further analysis and adaptation [37]. The Mg over TLC concentration in Sintang went from low (26.1) in 2014 to deficient (24.1) in 2017, which was probably due to the antagonistic effect of K on Mg uptake from the soil [38]. In Jambi, where native soil Mg concentrations were very high, Mg over TLC concentrations fell from 32.5 (sufficient) in 2014 to 27.2 (low) in 2017. This suggests that Mg fertilisers in Jambi will be required in the future if the K applications as proposed in the BMP are continued. Boron fertiliser was applied in relatively large quantities, which resulted in a spike in tissue B concentrations (Figure 5). It is likely that B applications can be reduced without negative effects on yield, as the relationships between B fertilisation and yield are not well established [39].
The years 2013 and 2014 in Sintang were unusually dry (Figure S2), which may have affected yields. The 2015 El Niño event occurred about one year after the start of the experiments, when the palms were highly productive (average fruit bunch yields of over 3.5 t ha−1 month−1), requiring maximum quantities of assimilates. We observed an immediate reduction in bunch weight and yield, which points at acute assimilate shortages in the palms. These shortages may have led to bunch and inflorescence abortion and to a massive shift in sex determination towards male inflorescences, which would explain the absence of a production peak during the high season of 2017, two years after the event. Caliman et al. [40] suggested that highly productive palms are more sensitive to drought and are more likely to experience severe effects than poorly producing palms. In addition to drought, water logging may have affected the productivity of the palms in Jambi. Unfortunately, we did not measure the ground water table, but farmers and our local staff reported that drainage greatly improved in 2014 (which may have contributed to the productivity peak in 2015) and deteriorated again afterwards. In combination with heavy rains, this led to reported water logging in the fields in Jambi between January and June and again in 2017, when patches of three REF plantations were flooded for three months. We expect that water logging impacted the yields in Jambi after 2015, but we do not have sufficient data to confirm this. Another potential yield-constraining factor in our fields was inter-palm competition (e.g., [41]). Average planting densities were 135–140 palms hectare−1, but palms were relatively old. The increased frond sizes may well have led to increased competition for sunlight, which reduces the positive effects on yield. It would be worthwhile to investigate if selective thinning is an essential step for increasing yields in older plantations where the LAI is already high [42,43].
Most farmers implemented circle and path weeding in the BMP plots, and either clear weeding or circle and path weeding in the control plots. There are no reliable studies that show convincingly that weeding practices have a significant impact on oil palm yield [13], but good practices save costs for input and labour and were readily adopted. An indirect but important benefit of good weeding (especially the establishment of paths and circles) and pruning is that these practices facilitate quick and complete harvesting; at least one farmer stated that the harvesting costs per tonne in the well-weeded and well-pruned BMP plots were less, because harvesters adapt the price to the effort required for harvesting. Increased harvesting frequency probably affected yield, but there was no differentiation between the treatments. Before the start of the project, the farmers in both areas harvested once per 14 or 15 days, while the optimum harvesting interval is 10 days or less [44]. In Jambi in particular, the participants rigorously followed the recommended 10-day harvesting round in the period 2014–2016 (both in the BMP and in the control plots) but stopped doing so in 2017 because of other circumstances. Increased harvesting frequency has been proposed as a strong driver of increased bunch yield [45,46] and improved oil content and quality [44], leading to improved bunch prices [19].
Although we are confident in the yields we reported, especially in Jambi, recording oil palm yields is difficult in smallholder settings due to the way harvesting is organised [6]. The farmers were dependent on the cooperative (Sintang) or local traders (Jambi) to arrange the harvesting and transport of their bunches; few harvested themselves. Farmers in Sintang particularly had little control over the harvesting practices and over the timing of harvesting. There appeared to be a shortage of harvesting labour and the harvesting teams changed regularly, so training them was not feasible. The subdivision of the fields into BMP and REF plots was not relevant for the harvesters and the separation of the bunches was not always carried out correctly. In addition, the farmers were not always informed when the harvesting took place, so not all yields could be recorded. The problems with yield recording were particularly severe for the fields containing peat pockets (S2, S3 and S5), which were re-sized during the project. For future research in smallholder plantations, we recommend that the whole field or block is used as the experimental unit unless a very good and independent yield recording system can be put in place.
Due to the absence of a clear and significant yield response, the costs of the additional nutrient applications consistently outweighed the benefits of our treatment, even without considering the additional labour investments for fertiliser application. These results are in line with the findings of Hutabarat et al. [19], who studied a group of RSPO-certified independent smallholders and observed that the implementation of better management practices similar to ours, in combination with RSPO certification, led to a small increase in yield but a decrease in farm income, due to the great increase in costs. There appears to be an economic trade-off between nutrient application and yield, as fertiliser costs are substantial [47]. Industry-standard nutrient application may not lead to the best economic performance in smallholder plantations, and investing in land (if available), rather than in fertilizers, is probably a better strategy for many smallholder farmers. The effects of factors like palm age, planting density, slope and drainage on productivity [48] require more attention when yield-improvement projects are set up in smallholder plantations. Average yields in our research areas were far beyond the estimated national average for smallholders [3]. It is likely that fertiliser application and other BMPs will have a stronger effect on yield and a larger effect on income in plantations that are more nutrient-constrained and have poorer starting yields, and at times when bunch prices are sufficiently high.

5. Conclusions

During our long-term engagement with the farmers, we did not manage to improve yields significantly in either Jambi or Sintang, and the economic returns to the experimental practices were negative due to the additional input costs. Despite these disappointing outcomes, the experiments enabled us to identify better management practices that the participating farmers adopted willingly. These practices had in common that they were attractive financially (such as circle and path weeding), demonstrated clear benefits (the 10-day harvesting interval resulting in better prices at the mill in Jambi) or had visible effects in the field (palm roots growing into frond stacks; leaves turning green after the application of K). On the other hand, practices that were expensive and did not have clear effects (such as regular pruning) were not so readily implemented. Our results emphasise that it is challenging to find and implement intensification options that are both sustainable and profitable, and that have a substantial impact on yield, especially in plantations where yields are already substantial. Identifying such options is essential for achieving rehabilitation at a larger scale, with approaches that are environmentally and financially sustainable and that fit within farmers’ realities and preferences. Initiatives like mandatory certification (ISPO), voluntary certification (e.g., RSPO) and mandatory international standards (e.g., EUDR) put more and more pressure on farmers to adhere to good practices and monitor inputs and outputs. Digital tools (e.g., remote sensing, apps) can help with these efforts, but on-farm experimentation and data collection remain a key priority. Trying out better management practices and unravelling the interacting effects of nutrient applications, flooding, drought and planting density on productivity over time in farmers’ fields helps to improve our understanding of the processes that underlie productivity in oil palm plantations while engaging fully with the farmers.

Supplementary Materials

The following supporting information can be downloaded at: https://www.mdpi.com/article/10.3390/agriculture14091626/s1, Box S1: Sample selection and site description; Box S2: Field audits; Figure S1: Map with study sites; Figure S2: Weather in Jambi and Sintang; Figure S3: Yearly yields; Figure S4: Tissue nutrients in field S4 and S6; Figure S5: Vegetative growth in field S4 and S6; Figure S6: Monthly yield in field S4 and S6; Table S1: Field audit form; Table S2: Combination table tissue nutrients – vegetative growth – yield.

Author Contributions

Conceptualization, L.S.W., M.S., M.v.N. and K.E.G.; Formal analysis, L.S.W., A.J.S. and J.v.H.; Funding acquisition, L.S.W. and K.E.G.; Investigation, L.S.W.; Methodology, L.S.W., M.S., M.v.N., J.v.H. and K.E.G.; Resources, A.J.S.; Supervision, M.S., M.v.N. and K.E.G.; Visualization, L.S.W.; Writing—original draft, L.S.W. and J.v.H.; Writing—review and editing, L.S.W., M.S., M.v.N., A.J.S. and K.E.G. All authors have read and agreed to the published version of the manuscript.

Funding

This research was funded by Wageningen University and Research, the Dutch Development Organisation (SNV), Johnson & Johnson Consumer Companies Inc., and K + S Kali GmbH.

Institutional Review Board Statement

Not applicable.

Data Availability Statement

The original data presented in the study are openly available in Wageningen Library at 10.4121/e952246f-f564-40dc-9081-3ae9567cb433.

Acknowledgments

We thank the farmers in Desa Ramin and Desa Mrarai for their hospitality, their enthusiastic and cheerful participation, their hard work, and their wonderful knowledge and insights. We acknowledge the support of PPKS Indonesia for supporting the field work, of ICRAF for hosting us, and of RISTEK for kindly providing the necessary visas. Sri Turhina was indispensable for the project, and she played an essential role in the field work and data collection.

Conflicts of Interest

The authors declare no conflicts of interest. Johnson & Johnson Consumer Companies Inc. and K + S Kali had no role in the design of the study; in the collection, analyses, or interpretation of data; in the writing of the manuscript; or in the decision to publish the results.

References

  1. USDA-FAS. Production, Supply and Distribution Online: Historical Datasets, Oilseeds; USDA Foreign Agricultural Service: Washington, DC, USA, 2021. Available online: https://apps.fas.usda.gov/psdonline/app/index.html#/app/downloads (accessed on 30 December 2021).
  2. Corley, R.H.V. How much palm oil do we need? Environ. Sci. Policy 2009, 12, 134–139. [Google Scholar] [CrossRef]
  3. Molenaar, J.W.; Persch-Ort, M.; Lord, S.; Taylor, C.; Harms, J. Diagnostic Study on Indonesian Oil Palm Smallholders: Developing a Better Understanding of Their Performance and Potential; International Finance Corporation: Jakarta, Indonesia, 2013; p. 84. [Google Scholar]
  4. Euler, M.; Krishna, V.; Schwarze, S.; Siregar, H.; Qaim, M. Oil palm adoption, household welfare, and nutrition among smallholder farmers in Indonesia. World Dev. 2017, 93, 219–235. [Google Scholar] [CrossRef]
  5. Vermeulen, S.; Goad, N. Towards Better Practice in Smallholder Palm Oil Production; Natural Resource Issues Series No. 5; IIED: London, UK, 2006; p. 55. [Google Scholar]
  6. Jelsma, I.; Schoneveld, G.C.; Zoomers, A.; van Westen, A.C.M. Unpacking Indonesia’s independent oil palm smallholders: An actor-disaggregated approach to identifying environmental and social performance challenges. Land Use Policy 2017, 69, 281–297. [Google Scholar] [CrossRef]
  7. Monzon, J.P.; Li Lim, Y.; Tenorio, F.A.; Farrasati, R.; Pradiko, I.; Sugianto, H.; Donough, C.R.; Edreira, J.I.R.; Rahutomo, S.; Agus, F.; et al. Agronomy explains large yield gaps in smallholder oil palm fields. Agric. Syst. 2023, 210, 103689. [Google Scholar] [CrossRef]
  8. Hoffmann, M.P.; Castaneda Vera, A.; Wijk, M.T.v.; Giller, K.E.; Oberthür, T.; Donough, C.; Whitbread, A.M. Simulating potential growth and yield of oil palm (Elaeis guineensis) with PALMSIM: Model description, evaluation and application. Agric. Syst. 2014, 131, 1–10. [Google Scholar] [CrossRef]
  9. Abood, S.A.; Lee, J.S.H.; Burivalova, Z.; Garcia-Ulloa, J.; Koh, L.P. Relative contributions of the logging, fiber, oil palm, and mining industries to forest loss in Indonesia. Conserv. Lett. 2015, 8, 58–67. [Google Scholar] [CrossRef]
  10. Murdiyarso, D.; Hergoualc’h, K.; Verchot, L.V. Opportunities for reducing greenhouse gas emissions in tropical peatlands. Proc. Natl. Acad. Sci. USA 2010, 107, 19655–19660. [Google Scholar] [CrossRef]
  11. Smit, H.H.; Meijaard, E.; van der Laan, C.; Mantel, S.; Budiman, A.; Verweij, P. Breaking the link between environmental degradation and oil palm expansion: A method for enabling sustainable oil palm expansion. PLoS ONE 2013, 8, e68610. [Google Scholar] [CrossRef]
  12. Fairhurst, T.; Griffiths, W.; Rankine, I. TCCL Field Handbooks of Oil Palm Agronomy; Tropical Crop Consultants: Kent, UK, 2019. [Google Scholar]
  13. Woittiez, L.S.; van Wijk, M.T.; Slingerland, M.; van Noordwijk, M.; Giller, K.E. Yield gaps in oil palm: A quantitative review of contributing factors. Eur. J. Agron. 2017, 83, 57–77. [Google Scholar] [CrossRef]
  14. Euler, M.; Hoffmann, M.P.; Fathoni, Z.; Schwarze, S. Exploring yield gaps in smallholder oil palm production systems in eastern Sumatra, Indonesia. Agric. Syst. 2016, 146, 111–119. [Google Scholar] [CrossRef]
  15. Martin, S.; Rieple, A.; Chang, J.; Boniface, B.; Ahmed, A. Small farmers and sustainability: Institutional barriers to investment and innovation in the Malaysian palm oil industry in Sabah. J. Rural Stud. 2015, 40, 46–58. [Google Scholar] [CrossRef]
  16. Woittiez, L.S.; Slingerland, M.; Rafik, R.; Giller, K.E. Nutritional imbalance in smallholder oil palm plantations in Indonesia. Nutr. Cycl. Agroecosystems 2018, 111, 73–86. [Google Scholar] [CrossRef]
  17. Woittiez, L.S.; Turhina, S.; Deccy, D.; Slingerland, M.; Van Noordwijk, M.; Giller, K.E. Fertiliser application practices and nutrient deficiencies in smallholder oil palm plantations in Indonesia. Exp. Agric. 2018, 55, 543–559. [Google Scholar] [CrossRef]
  18. Jelsma, I.; Woittiez, L.S.; Ollivier, J.; Dharmawan, A.H. Do wealthy farmers implement better agricultural practices? An assessment of implementation of good agricultural practices among different types of independent oil palm smallholders in Riau, Indonesia. Agric. Syst. 2019, 170, 63–76. [Google Scholar] [CrossRef]
  19. Hutabarat, S.; Slingerland, M.; Rietberg, P.; Dries, L. Costs and benefits of certification of independent oil palm smallholders in Indonesia. Int. Food Agribus. Manag. Rev. 2018, 21, 681–700. [Google Scholar] [CrossRef]
  20. Molenaar, J.W.; Orth, M.; Lord, S.; Meekers, P.; Taylor, C.; Darto, M.; Elson, D.; Ginting, L. Analysis of the Agronomic and Institutional Constraints to Smallholder Yield Improvement in Indonesia; AidEnvironment and Global Sustainability Associates: Amsterdam, The Netherlands, 2010; p. 74. [Google Scholar]
  21. Sugianto, H.; Monzon, J.P.; Pradiko, I.; Tenorio, F.A.; Lim, Y.L.; Donough, C.R.; Sunawan; Rahutomo, S.; Agus, F.; Cock, J.; et al. First things first: Widespread nutrient deficiencies limit yields in smallholder oil palm fields. Agric. Syst. 2023, 210, 103709. [Google Scholar] [CrossRef]
  22. Jelsma, I.; Slingerland, M.; Giller, K.E.; Bijman, J. Collective action in a smallholder oil palm production system in Indonesia: The key to sustainable and inclusive smallholder palm oil? J. Rural Stud. 2017, 54, 198–210. [Google Scholar] [CrossRef]
  23. Sidhu, M.; Kong, C.; Sinuraya, Z.; Kurniawan, M.; Hasyim, A. Resumption of manuring and its impact on the nutrient status, growth and yield of unfertilised oil palm. Planter 2009, 85, 675–689. [Google Scholar] [CrossRef]
  24. Griffiths, W.; Fairhurst, T. Implementation of best management practices in an oil palm rehabilitation project. Better Crops Int. 2003, 17, 16–19. [Google Scholar]
  25. Rhebergen, T.; Fairhurst, T.; Whitbread, A.; Giller, K.E.; Zingore, S. Yield gap analysis and entry points for improving productivity on large oil palm plantations and smallholder farms in Ghana. Agric. Syst. 2018, 165, 14–25. [Google Scholar] [CrossRef]
  26. Atta-Ankomah, R.; Danso-Mensah, K. Best management practices for sustainable oil palm production: The case of smallholder farmers’ adoption in Ghana. For. Trees Livelihoods 2022, 31, 123–138. [Google Scholar] [CrossRef]
  27. Rankine, I.R.; Fairhurst, T.H. Field Handbook: Oil Palm Series, Volume 3—Mature, 2nd ed.; Potash & Phosphate Institute (PPI): Singapore, 1999; Volume 3, p. 135. [Google Scholar]
  28. Woittiez, L.S.; Haryono, S.; Turhina, S.; Dani, H.; Dukan, T.P.; Smit, H.H. Smallholder Oil Palm Handbook Module 2: Harvesting, Grading, Transport, 3rd ed.; Wageningen University and SNV International Development Organisation: Wageningen, The Netherlands, 2016; 25p. [Google Scholar]
  29. Woittiez, L.S.; Haryono, S.; Turhina, S.; Dani, H.; Dukan, T.P.; Smit, H.H. Smallholder Oil Palm Handbook Module 3: Plantation Maintenance, 3rd ed.; Wageningen University and SNV International Development Organisation: Wageningen, The Netherlands, 2016; 53p. [Google Scholar]
  30. Chapman, G.W.; Gray, H.M. Leaf analysis and the nutrition of the oil palm (Elaeis-guineensis Jacq). Ann. Bot. 1949, 13, 415–433. [Google Scholar] [CrossRef]
  31. Fairhurst, T. Management of Nutrients for Efficient Use in Smallholder Oil Palm Plantations. Ph.D. Thesis, Wye College, University of London, London, UK, 1996; p. 211. [Google Scholar]
  32. Foster, H.L.; Prabowo, N.E. Partition and transfer of nutrients in the reserve tissues and leaves of oil palm. In Proceedings of the Workshop on Nutrient Needs in Oil Palm, Singapore, 17–18 October 2006; p. 18. [Google Scholar]
  33. Williams, S.E.; van Noordwijk, M.; Penot, E.; Healey, J.R.; Sinclair, F.L.; Wibawa, G. On-farm evaluation of the establishment of clonal rubber in multistrata agroforests in Jambi, Indonesia. Agrofor. Syst. 2001, 53, 227–237. [Google Scholar] [CrossRef]
  34. Rhebergen, T.; Zingore, S.; Giller, K.E.; Frimpong, C.A.; Acheampong, K.; Ohipeni, F.T.; Panyin, E.K.; Zutah, V.; Fairhurst, T. Closing yield gaps in oil palm production systems in ghana through best management practices. Eur. J. Agron. 2020, 115, 19. [Google Scholar] [CrossRef]
  35. Ollagnier, M.; Ochs, R. Management of mineral nutrition in industrial oil palm plantations. Fertilizer savings. Oléagineux 1981, 36, 409–421. [Google Scholar]
  36. Dubos, B.; Baron, V.; Bonneau, X.; Flori, A.; Ollivier, J. High soil calcium saturation limits the use of leaf potassium diagnosis when KCl is applied in oil palm plantations. Exp. Agric. 2017, 54, 794–804. [Google Scholar] [CrossRef]
  37. Woittiez, L.S. On Yield Gaps and Better Management Practices in Indonesian Smallholder Oil Palm Plantations. Ph.D. Thesis, Wageningen University, Wageningen, The Netherlands, 2019; pp. xii + 287. [Google Scholar]
  38. Daliparthy, J.; Barker, A.V.; Mondal, S.S. Potassium fractions with other nutrients in crops—A review focusing on the tropics. J. Plant Nutr. 1994, 17, 1859–1886. [Google Scholar] [CrossRef]
  39. Corrado, F.; Quencez, P.; Tailliez, B. Boron deficiency in oil palm. Symptoms and corrections. Oléagineux 1992, 47, 719–725. [Google Scholar]
  40. Caliman, J.P.; Southworth, A.; Jatmika, A.; Bangun, D.; Asmono, D.; Sutarta, E.S.; Pamin, K.; Guritno, P.; Prawirosukarto, S.; Wahyono, T.; et al. Effect of drought and haze on the performance of oil palm. In Proceedings of the International Oil Palm Conference ‘Commodity of the Past, Today, and the Future’, Bali, Indonesia, 23–25 September 1998; pp. 250–274. [Google Scholar]
  41. Breure, C.J. Preliminary results from an oil palm density x fertiliser experiment on young volcanic soils in West New Britain. In Proceedings of the International Developments in Oil Palm: Proceedings of the Malaysian International Agricultural Oil Palm Conference, Kuala Lumpur, Malaysia, 14–17 June 1976; pp. 192–207. [Google Scholar]
  42. Teuscher, M.; Gérard, A.; Brose, U.; Buchori, D.; Clough, Y.; Ehbrecht, M.; Hölscher, D.; Irawan, B.; Sundawati, L.; Wollni, M.; et al. experimental biodiversity enrichment in oil-palm-dominated landscapes in Indonesia. Front. Plant Sci. 2016, 7, 1538. [Google Scholar] [CrossRef]
  43. Uexküll, H.v.; Henson, I.E.; Fairhurst, T. Canopy management to optimize yield. In Oil Palm Management for Large and Sustainable Yields; Fairhurst, T., Härdter, R., Eds.; Potash & Phosphate Institute of Canada, Potash & Phosphate Institute, International Potash Institute: Singapore, 2003; pp. 163–180. [Google Scholar]
  44. Corley, R.H.V. Ripening, harvesting and oil extraction. Planter 2001, 77, 507–524. [Google Scholar]
  45. Donough, C.; Witt, C.; Fairhurst, T. Yield intensification in oil palm using BMP as a management tool. In Proceedings of the International Oil Palm Conference, Yogyakarta, Indonesia, 1–3 June 2010. [Google Scholar]
  46. Lee, J.S.H.; Ghazoul, J.; Obidzinski, K.; Koh, L.P. Oil palm smallholder yields and incomes constrained by harvesting practices and type of smallholder management in Indonesia. Agron. Sust. Dev. 2014, 34, 501–513. [Google Scholar] [CrossRef]
  47. Mettauer, R.; Baron, V.; Turinah; Demitria, P.; Smit, H.; Alamsyah, Z.; Penot, E.; Bessou, C.; Chambon, B.; Ollivier, J.; et al. Investigating the links between management practices and economic performances of smallholders’ oil palm plots. A case study in Jambi province, Indonesia. Agric. Syst. 2021, 194, 103274. [Google Scholar] [CrossRef]
  48. Foster, H.L.; Mohammed, A.T. Variation in the fertilizer requirements of oil palm in peninsular Malaysia. I. Within the same soil series. PORIM Bull. 1988, 1–9. [Google Scholar]
Figure 1. Audit results for six plantation management practices. 1 = poor/not according to standard; 2 = acceptable but can be improved; 3 = fully according to standard. See Supplementary Materials Box S2 and Table S1 for more information.
Agriculture 14 01626 g001
Figure 2. Nutrient application practices in the REF plots for N, P and K in Jambi (top row) and Sintang (bottom row). Whiskers show the minimum and maximum values; the box shows the 1st and 3rd quartile; the line shows the median. Values of >1.5 interquartile range are shown as circles. The horizontal dashed line shows the median applications in the BMP plots during the project duration (2015–2017, excluding ‘corrective’ applications in 2014 and empty fruit bunch applications in Sintang in 2016). Applications in the period before the experiment were calculated based on farmer recall.
Agriculture 14 01626 g002
Figure 3. Bunch weights (left) and yields (right) in all plantations (top, n = 10) and plantations in Jambi (middle, n = 5) and Sintang (bottom, n = 5). Error bars show the 95% confidence intervals of the observed means.
Agriculture 14 01626 g003
Figure 4. Mean leaflet nutrient concentrations in Jambi (n = 6; top row) and Sintang (n = 7, bottom row). The error bars show the 95% confidence interval of the observed mean, and dotted lines show the critical nutrient concentrations adapted from [27] and the Bah Lias Research Station Annual Reports (unpublished).
Agriculture 14 01626 g004
Figure 5. Mean rachis nutrient concentrations for P and K in Jambi (n = 6) and Sintang (n = 7). The error bars show the 95% confidence interval of the observed mean, and dotted lines show the critical nutrient concentrations adapted from [32].
Agriculture 14 01626 g005
Figure 6. Vegetative growth parameters measured for palms in Jambi (n = 6; top row) and Sintang (n = 7, bottom row), showing from left to right: frond length, petiole cross-section (PCS), leaflet length, leaflet breadth, and palm height. Error bars show the 95% confidence intervals of the observed means.
Agriculture 14 01626 g006
Table 1. Soil and biophysical properties of the BMP and the REF plots in the 14 sample plantations.
CodePalm DensitySoil PropertiesRemarks
TextureSOC apH bN bP bCa bMg bK b
(palms ha−1) (%) (%)(mg kg−1)(mmol kg−1)
Jambi
J1132Clay3.84.20.149.017.07.510.832017: Flooding in REF plot
J2130Clay4.94.50.2033.829.410.51.13
J3142Clay3.14.60.147.017.58.450.93Full legume cover crop
J5137Clay3.84.20.1524.717.04.891.132017: Flooding in REF plot
J6135Clay4.34.30.1712.030.011.00.85
J4 c153Clay3.54.60.1428.933.49.021.80
Sintang
S1144Silt loam4.64.80.0626.96.100.531.93Palm density BMP too high
S4135Sandy loam4.54.90.0911.54.200.901.00
S6136Clay loam5.44.40.1394.74.530.532.28Sloping
S7135Clay loam4.64.90.1073.76.450.851.95Sloping; eroded
S8134Loam3.84.80.0825.22.850.481.40Sloping
S3 c137Clay loam7.44.90.1043.411.71.950.50
S3P c,d136Peat22.64.10.82174.463.25.732.75Front + back of field (0.9 ha)
S5 c138Sandy loam5.24.90.0612.214.11.281.15
S5P c,d134Peat20.54.10.9273.428.32.783.18Centre of field (0.9 ha)
S2 e135Loam7.34.90.1466.211.11.031.80Sloping
S2P d,e136Peat21.84.20.76228.931.32.653.53Centre of field (0.8 ha)
a Average between circle and interrow at 0–0.40 m depth. b Circle at 0–0.40 m depth. c Removed from yield records and cost–benefit analyses. d Plantations S2, S3 and S5 were partly on peat soils, which are shown on separate lines (S2P, S3P, and S5P) because the soil properties were very different. e Removed from the sample because data are incomplete and management was not carried out correctly.
Table 2. Better management practices (BMPs) implemented in the smallholder fields.
CategoryActivityMethodFrequency
WeedingEstablishing weeded circlesManual/mechanical/chemical3 rounds/year
Establishing harvesting pathsManual/mechanical/chemical 3 rounds/year
Removing woody weedsManual/mechanical/chemical2 rounds/year
Cutting inter-row weeds to knee heightManual/mechanical2 rounds/year
PruningPruning to 40 leaves per palmManual2 rounds/year
Stacking fronds in U-boxManualAt pruning/harvesting
HarvestingHarvesting when bunches are fully ripe (at least 1 loose fruit)ManualEvery 10 days
Collecting bunches separately at roadsideManual/with motorbikeAt harvesting
Collecting all loose fruitsManualAt harvesting
Counting bunches and recording bunch qualityManualAt harvesting
Recording yield per plotManualAt harvesting
OtherMaking footbridges over canalsManualAt project start
Table 3. Nutrient applications in the BMP plots in Jambi and Sintang. EFB = empty fruit bunches.
NutrientAmount (kg palm−1 year−1)Applied asRemarks
2014 a20152016 b2017
Jambi
N0.80.90.90.9UreaTwo splits
P0.60.20.20.2Rock phosphateOne split
K1.21.51.51.5KClTwo splits
B0.030.030.030.03Fertiliser borateOne split
Sintang
N0.51.23.21.2Urea; EFB (2016)Two splits
P00.60.40.2Rock phosphate; EFB (2016)One split
K0.71.36.71.3Korn Kali B; EFB (2016)Two splits
Mg0.10.20.50.2Korn Kali B; kieserite; EFB (2016)Two splits
B0.020.030.010.03Korn Kali B; EFB (2016)Two splits
Cu00.0500CuSO4 (2015)One split, on peat
Zn00.0800ZnSO4 (2015)One split, on peat
a In Sintang, the experiments started in the end of 2014, so only one round of Korn Kali B and urea was applied in that year. b In Sintang, 36 t fresh EFB per field were applied in 2016.
Table 4. Costs and benefits of fertiliser application in the BMP plots.
LocationYearYield Change aChange in Benefits bChange in Costs cChange in Profit dChange in Profit e ($)
(kg ha−1 year−1)(Million Rp ha−1 year−1)USD
Jambi201521512.582.96−0.38−25.20
20164920.592.77−2.18−145.27
201711171.342.98−1.64−109.34
2018 f−1010−1.212.90−4.11−274.16
2019 f23622.832.90−0.07−4.47
Average10221.232.90−1.67−111.55
Sintang2015−105−0.134.44−4.57−304.41
201628613.431.721.71114.18
20179991.200.700.5033.25
2018 f6210.752.29−1.54−102.95
2019 f19392.332.290.042.42
Average12631.522.29−0.77−51.64
Combined201510231.233.70−2.47−164.81
201616772.012.24−0.23−15.21
201710581.271.84−0.57−38.04
2018 f−194−0.232.60−2.83−188.89
2019 f21502.582.60−0.02−1.36
Average11431.372.60−1.23−81.93
a The increase in yield in the BMP plots compared with the control plots. b Benefits are the yield change times the fruit bunch price, using an average price of 1200 Rp kg−1. c The difference in fertiliser expenses in the BMP versus the control plot. d The difference between the benefits and the costs. e Currency rate was assumed to be 15,000 Rp per USD. f In 2018 and 2019, fertiliser costs were assumed to be similar to the average of the previous three years.
Disclaimer/Publisher’s Note: The statements, opinions and data contained in all publications are solely those of the individual author(s) and contributor(s) and not of MDPI and/or the editor(s). MDPI and/or the editor(s) disclaim responsibility for any injury to people or property resulting from any ideas, methods, instructions or products referred to in the content.

