Article

Design and Optimization of Power Harrow Soil Crushing Components for Coastal Saline–Alkali Land

1
College of Mechanical & Electronic Engineering, Shandong Agricultural University, Tai’an 271018, China
2
Yellow River Delta Intelligent Agricultural Machinery and Equipment Industry Research Academy, Dongying 257000, China
3
Shandong Agricultural Equipment Intelligent Engineering Laboratory, Tai’an 271018, China
*
Authors to whom correspondence should be addressed.
Agriculture 2025, 15(2), 206; https://doi.org/10.3390/agriculture15020206
Submission received: 27 December 2024 / Revised: 16 January 2025 / Accepted: 17 January 2025 / Published: 18 January 2025
(This article belongs to the Section Agricultural Technology)

Abstract

:
In China, there are approximately 36.7 million hectares of available saline–alkali land. The quality of land preparation significantly influences the yield of crops grown in saline–alkali soil. However, saline–alkali soil is highly compacted, and, currently, the market lacks land-preparation products specifically tailored to the unique characteristics of saline–alkali land. The soil crushing performance of existing power harrows fails to meet the requirements for high-quality land preparation, thus affecting crop planting yields. Consequently, it is imperative to conduct research on the design and performance improvement of the soil crushing components of power harrows for saline–alkali land. This paper centers on the key soil crushing component, the harrow blade, and conducts research from the perspectives of kinematics and dynamics. Initially, the ranges of key structural and motion parameters are determined, such as the angle of the harrow blade cutting edge, the thickness of the of the harrow blade cutting edge, and the ratio of the circumferential speed to the forward speed. Subsequently, through simulation tests integrating the Discrete Element Method (DEM) and the Box–Behnken Design (BBD), the optimal parameter combination is identified. The impact of the forward speed and the rotational speed of the vertical-shaft rotor on soil disturbance is analyzed. The relationship between soil disturbance and soil heaping is explored, and an optimal forward speed of around 6 km/h is determined. Field tests are conducted to verify the cause of soil heaping. The test results show that the soil crushing rates are all above 85%, with an average soil crushing rate of 88.66%. These test results have achieved the predetermined objectives and meet the design requirements.

1. Introduction

Soil serves as the most fundamental and crucial means of production in agriculture. According to the “Third National Land Resource Survey”, China’s arable land area amounts to 127 million hectares [1], ranking third globally, after the United States and India. Nevertheless, the per capita arable area is merely 0.093 hectares, ranking 126th in the world. For instance, Canada’s per capita arable land is 18 times that of China. Facing a shortage of arable land resources, there are approximately 36.7 million hectares of available saline–alkali land in China. The rational development and utilization of saline–alkali land for crop cultivation represents one of the significant approaches to alleviate the scarcity of cultivated land resources in China. Moreover, rational tillage is an important means to enhance the quality and properties of saline–alkali soil and boost crop yields [2,3,4]. The quality of land preparation exerts a remarkable influence on the yields of crops planted in saline–alkali soil. Saline–alkali soil is highly compacted. However, power harrows are well-suited for crushing hard-textured soil and can carry out high-quality soil crushing operations [5,6,7,8]. In recent years, they have begun to be promoted and applied in China [9,10,11,12,13].
At present, the power harrows developed by European and American countries have reached a high level of maturity [14,15,16]. They have entered a large-scale production phase and are now moving towards high-efficiency development [17,18,19]. Ahmet et al. [20] carried out an in-depth investigation into the impacts of power harrowing on wheat straw mulching and straw incorporation into the field. Their experiments mainly concentrated on the effectiveness of power harrowing in stubble treatment. Their results demonstrate that, during power harrowing, the mixing of stubble and soil generally occurs in the upper part of the working depth, and the mixture remains within the upper 2–6 cm cultivated soil layer. Balsari et al. [21] conducted a comprehensive analysis of the performance of a tractor–power–harrow system under various working conditions. They delved into the relationship between the operating parameters of the tractor–power–harrow system (including the rated speed of the tractor, the rated working depth, and the speed of the harrow teeth) and the mechanical load (i.e., the PTO torque and traction force). This research provides data-based references for R&D and production enterprises aiming to optimize the parameters of power harrows to reduce energy consumption. In recent years, power harrows have been increasingly and extensively promoted and applied in the dry farmland of northern China. Researchers from universities and research institutions across the country have conducted in-depth studies on the adaptability of power harrows and have made unremitting efforts to optimize and enhance their performance. In 2012, Zhang et al. [22] designed a vertical rotary tiller. To prevent tillage omissions, they analyzed its operating motion trajectory using kinematic methods, established the motion–trajectory equation and the mathematical model of the operating area, and determined core structural parameters such as the initial installation angle of rotary blades on adjacent cutter shafts. In 2015, Wang et al. [23] utilized ANSYS/LS-DYNA971 to simulate the soil cutting process of the vertical rotary tillage tool. They explored the variation laws of cutting power consumption and equivalent stress of the vertical rotary tillage tool during soil cutting operations. In 2017, Liu et al. [24] studied the motion trajectory of the vertical rotary tillage blade during operation and established a motion–trajectory equation. To avoid the “soil-resistance” phenomenon, they optimized and designed the key structural parameters of the rotary tillage blade assembly. However, hitherto, researchers have not yet carried out a systematic optimization design for the structural parameters and operation-related parameters of the key soil crushing components of power harrows. As a result, an overall improvement in the soil crushing rate has not been achieved.
The Discrete Element Method (DEM) has manifested extraordinary prowess in accurately and comprehensively simulating a wide spectrum of soil environments. In recent years, it has burgeoned into a preeminent and potent methodology for delving into the structure and operational efficiency of tillage and land preparation equipment, especially power harrows [25,26]. By harnessing the capabilities of the DEM for simulation, it becomes feasible to conduct a painstakingly detailed analysis of the operation of the power harrow’s crucial soil contacting components. Moreover, it enables in-depth explorations of the intricate soil disturbance process. Additionally, this method empowers researchers to explore how pivotal structural and motion parameters exert an impact on operation quality [27,28]. In 2020, considering the distinctive topography, soil characteristics, and unique planting agronomic patterns of mulberry gardens, Yang Shuo et al. [29] ingeniously applied the DEM to carry out the optimization design and testing of a power harrow. This application led to the development of a more customized solution that precisely caters to the specific requirements of mulberry garden environments. In 2021, Zhang et al. [30] utilized DEM to perform a simulation-based analysis of the tillage load generated by a joint land preparation machine. Specifically, within the driving harrow operation model, they employed this method to simulate and analyze the forces acting on the driving harrow. This research significantly contributed to a more profound understanding of the mechanical behavior of land preparation machinery under diverse operational conditions. In 2023, Wang et al. [31] conducted a simulation-based study on the tillage operation performance of vertical rotary tillage blades using the DEM. They analyzed the stress conditions of the vertical rotary tillage blades during operation, as well as the fragmentation and mixing of soil particles. Simultaneously, they thoroughly investigated the self-wear of rotary tillage blades with different structural forms and their influence mechanisms on soil particles, thereby providing a solid theoretical foundation for the subsequent optimization of structural parameters.
Despite the fact that power harrows developed in both developed countries and China have reached a high level of maturity and are now in large-scale serialized production, these are all designed for operation under conventional soil conditions. To date, there has been a complete lack of research into the operational effectiveness of power harrows in saline–alkali soil. Saline–alkali soil exhibits distinct characteristics. Its surface is extremely hardened, while deep-layered soil has properties similar to those of heavy clay soil, which is markedly different from the traditional sandy soil in the north and heavy clay soil in the south of China. Traditional power harrows do not perform well when applied in saline–alkali soil. In particular, their soil crushing performance fails to meet the requirements for high-quality land preparation [32,33,34], thus exerting a negative impact on crop yields. Consequently, there is an urgent necessity to conduct research on the design and performance enhancement of the soil crushing components of power harrows, taking into account the complex soil layer structure specific to saline–alkali soil.

2. Materials and Methods

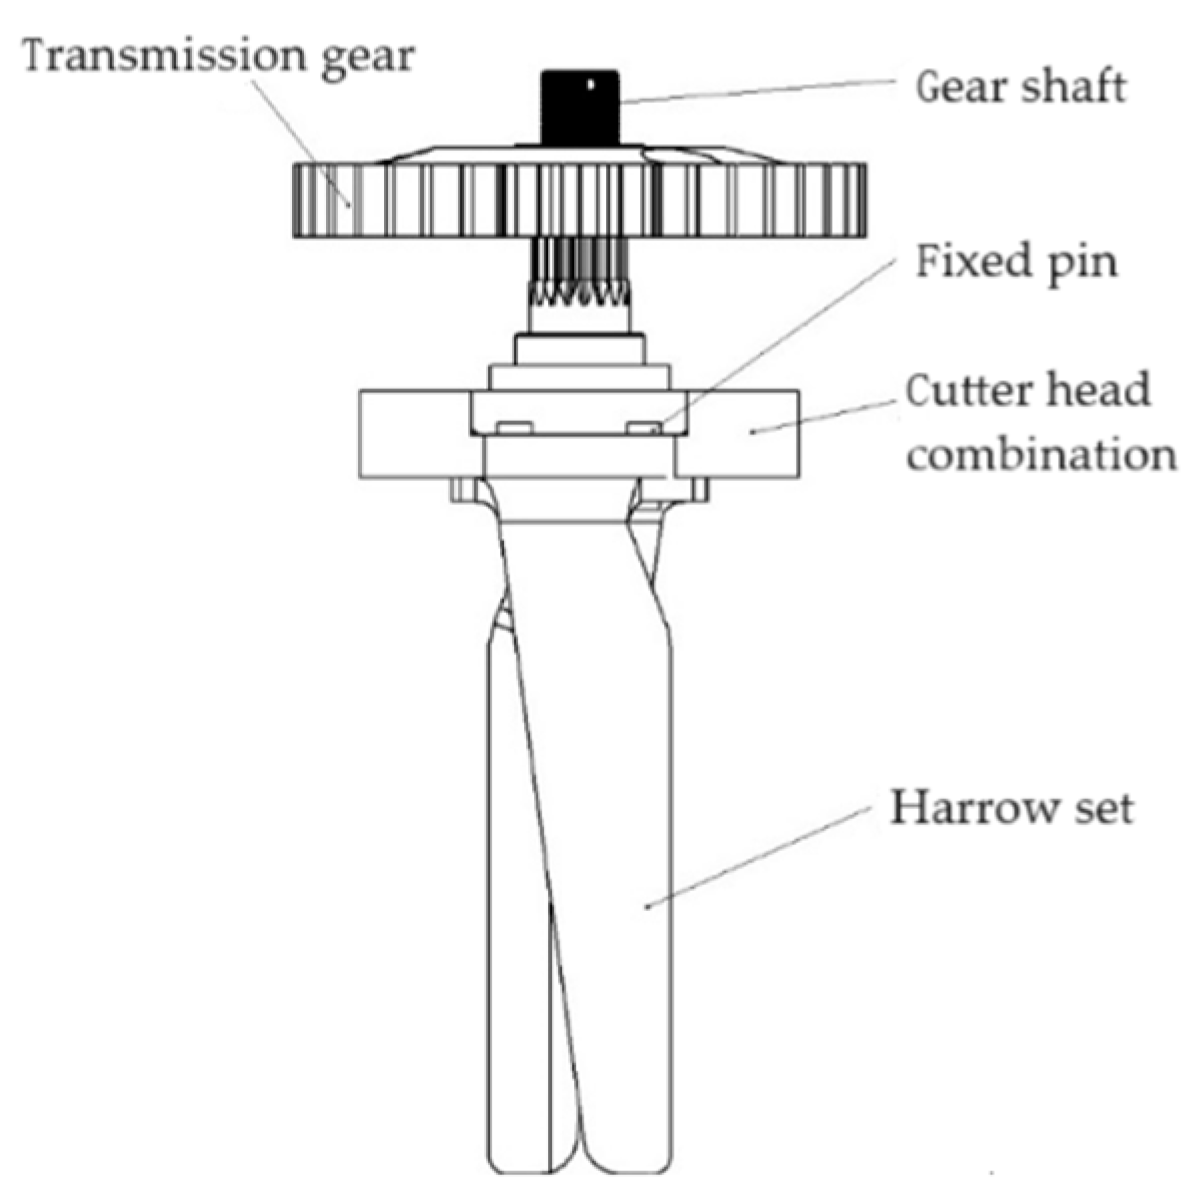
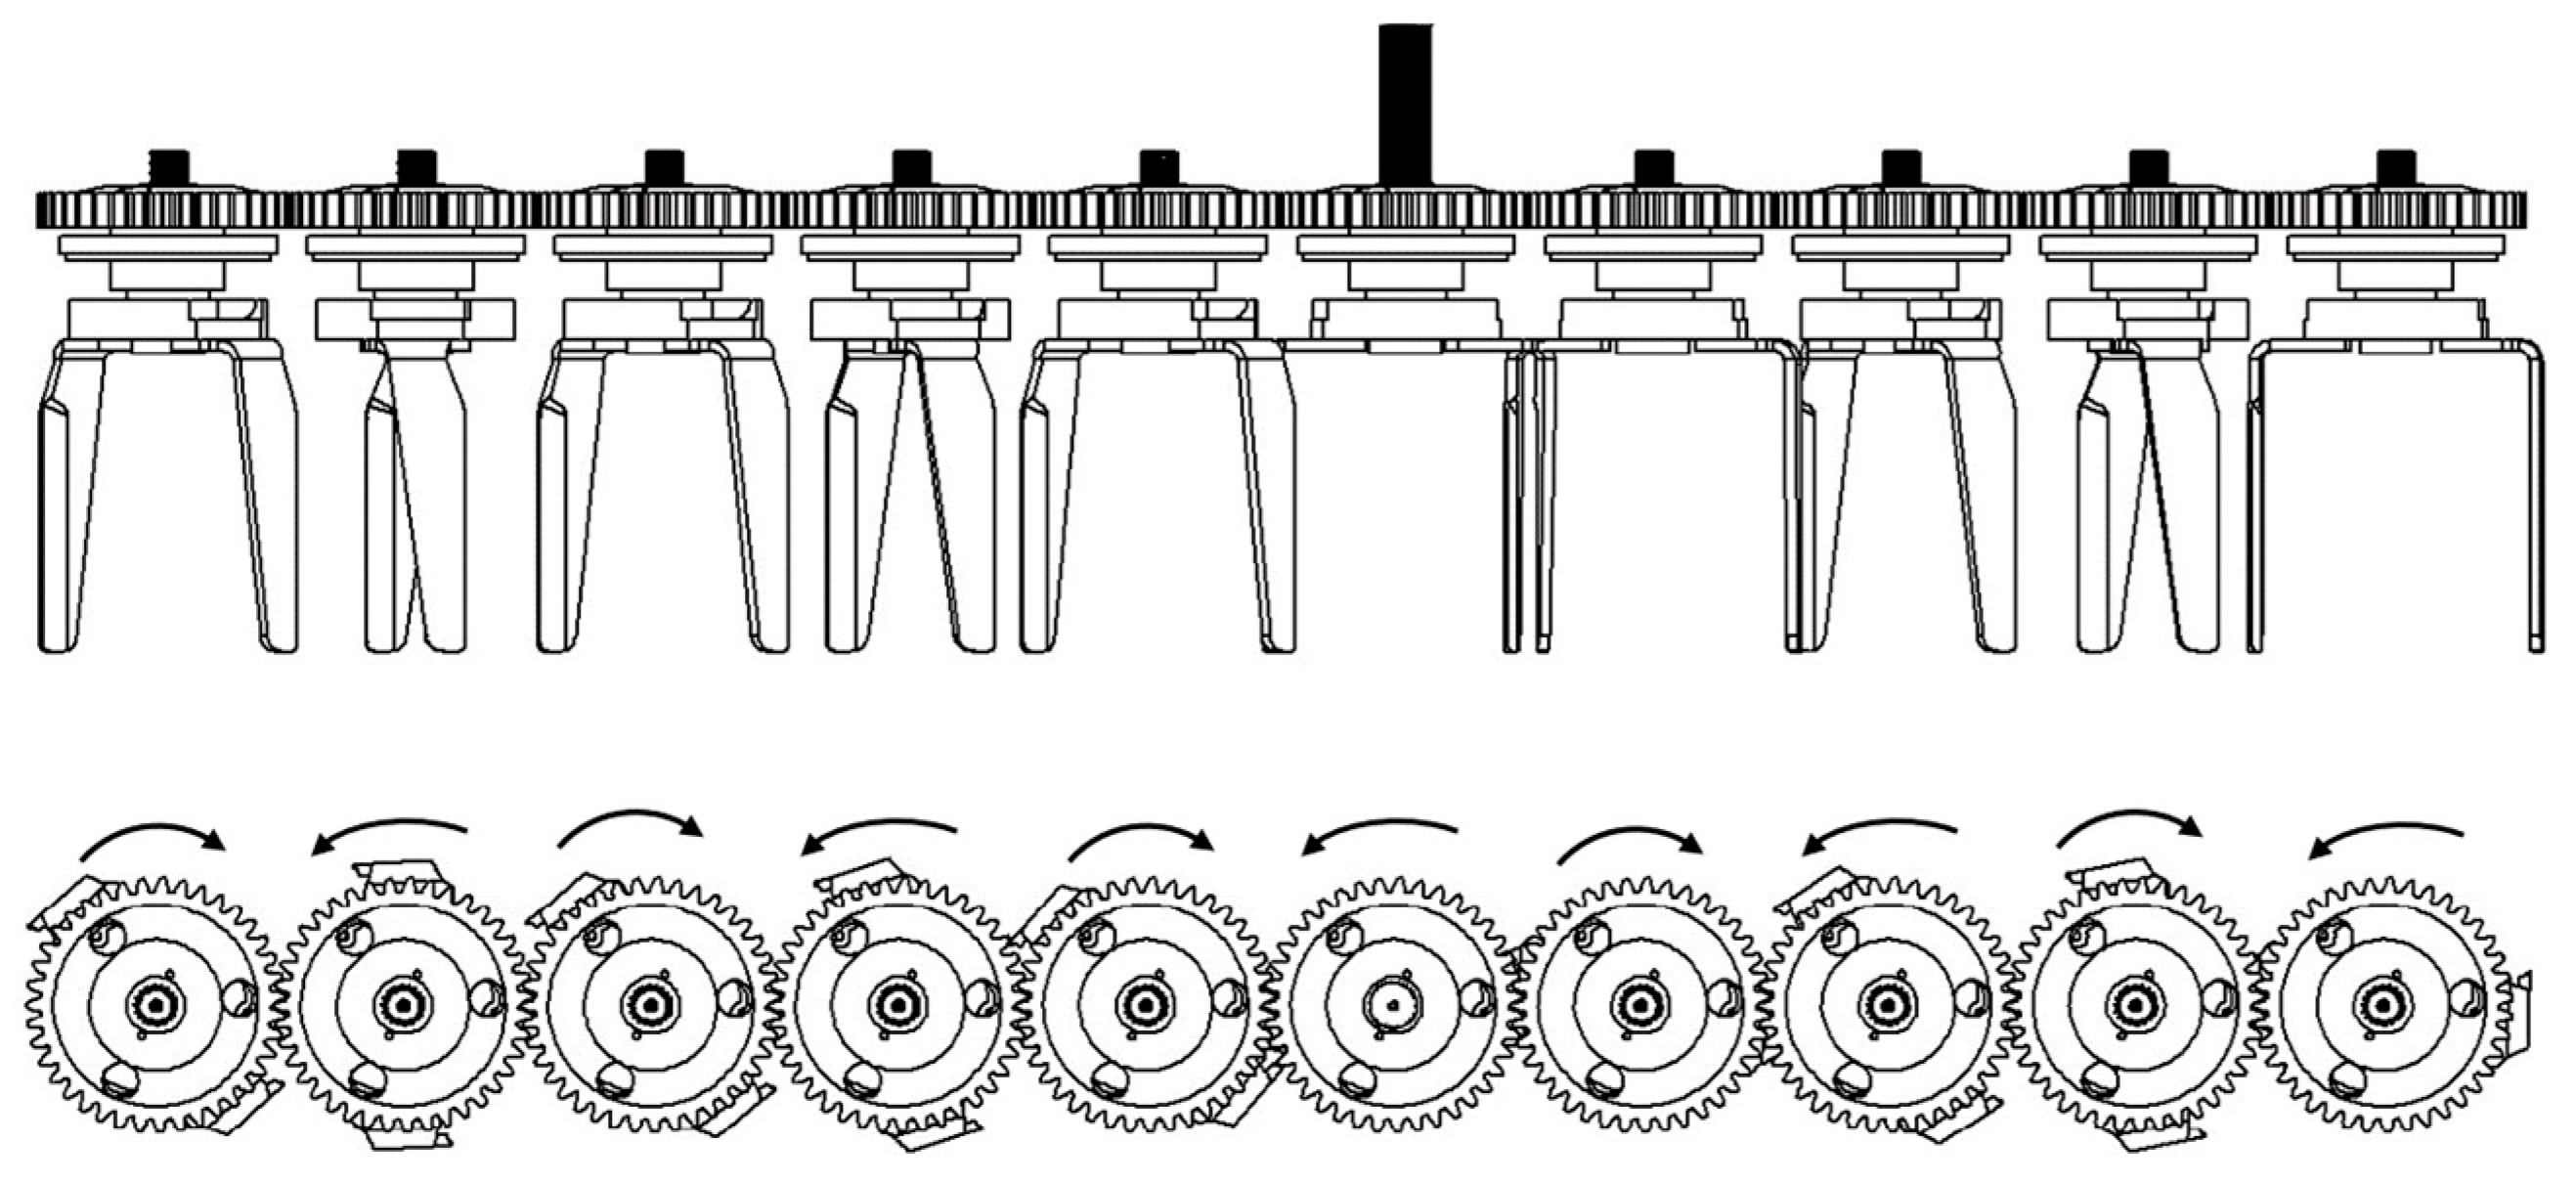
2.1. Machine Structure and Working Principle

The power harrow is principally constituted by several core components, including a three-point suspension, power–input transmission, transmission gear box, vertical rotor, depth-limiting suppression roller, frame, side retaining plate, and others. Prior to the land preparation operation, the power harrow requires depth control. This involves adjusting the crushing height of the depth-limiting roller and the working height of the side retaining plate. Power initiates its transmission journey from the tractor’s output shaft to the power–input gearbox. Subsequently, within the power transmission process, the power is transferred from the power–input gearbox via the power transmission shaft to the drive gearbox. The vertical-axis rotor is firmly connected to the drive gear shaft. This connection enables the harrow knives to rotate at a high speed, thereby facilitating soil crushing and soil disturbing operations. The depth-limiting and compacting roller, which is connected to the machine frame, plays a crucial role in rapidly compacting and leveling the soil’s surface. The overall structure of the entire machine is presented in Figure 1.

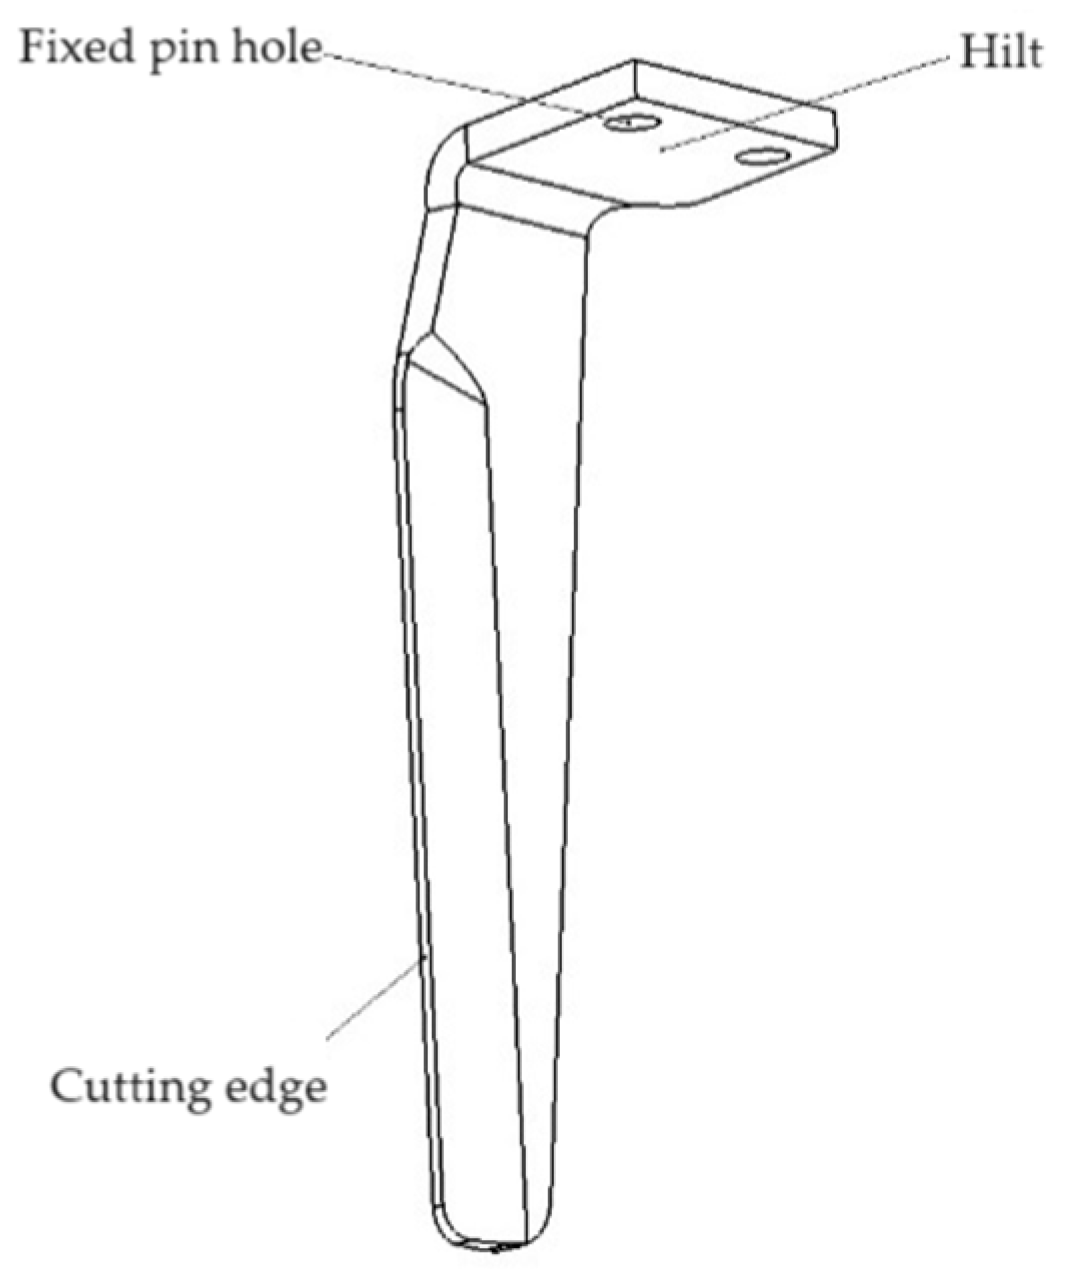
2.2. Design of the Soil Crushing Components of the Power Harrow

The key soil crushing component of the power harrow is the vertical rotor. Comprising mainly a set of harrow cutters, a cutter head set, fixed pins, gear shaft, transmission gear, and so on, the vertical rotor is designed with precision. A set of harrow knives are installed on the cutter head group at a precisely corresponding angle of 180°. Each knife is securely fixed to the cutter head group by a set of fixing pins, ensuring a stable structure that remains free from displacement during operation. Simultaneously, the cutter head group is connected to the gear shaft through splines, while the transmission gear, which is also connected to the gear shaft, supplies the necessary power for the vertical rotor to function. Its detailed structure is illustrated in Figure 2. During operation, the vertical-axis rotor engages in a complex synthetic movement, rotating while moving forward, which is essential for effectively performing soil crushing tasks.
During power harrow operation, the two adjacent vertical rotors transmit power through the transmission gear group and rotate relative to each other. The structure and transmission of the vertical-rotor group are shown in Figure 3.
The harrow tool serves as the core component of the vertical rotor, and its operational performance stands as the most crucial determinant influencing the effectiveness of the power harrow. At present, the structure and motion parameters of the harrow tool have not been designed and developed specifically for saline–alkali soil. Therefore, it is imperative to enhance the structure and motion parameters of the harrow tool through design optimization. This optimization aims to boost the operational performance of the power harrow under the challenging conditions of saline–alkali soil. The structure of the harrow tool mainly encompasses components such as the hilt and the cutting edge. Its detailed structure is presented in Figure 4.
During the operation of the harrow knife, the cutting edge assumes a pivotal role in fulfilling the soil cutting function. Through an in-depth exploration of the interaction between the soil and the harrow knife, the stress state of the saline–alkali soil in contact with the cutting edge is meticulously investigated. Subsequently, a dynamic-based mathematical model is systematically established. This model enables a comprehensive analysis of the key factors that exert a significant influence on the soil breaking effect. The findings of this research offer a solid theoretical foundation for the design of both the structural and motion parameters of harrow knives, thereby facilitating the optimization of their performance in the context of working with saline–alkali soil.
By regarding the saline–alkali soil in contact with the cutting edge as a particle and designating it as the origin, a two-dimensional coordinate system was meticulously constructed. This coordinate system served as the basis for establishing the dynamic model of the saline–alkali soil under the action of the harrow’s force. The dynamic model is presented in Figure 5.
Based on the dynamic analysis of the harrow and soil’s interaction, a dynamic mathematical model of soil particles was established to analyze the key factors affecting the soil breaking effect. First, according to the above figure, the tangential and normal dynamic equations of the saline–alkali soil acting on the harrow blade on the cutting edge are established:
a k sin π 2 θ α + β a q cos θ + α β = F N F 2 cos π 2 θ α F 1 sin π 2 θ α a k cos π 2 θ α + β + a q cos θ + α β + M α x = f + F 2 sin π 2 θ α F 1 cos π 2 θ α
where θ —angle of harrow knife rotation, rad.
By calculus calculation of the above formula, the dynamic mathematical model of saline–alkali soil particles can be obtained:
ω = d θ d t tan β = ω 2 r sin θ ω 2 sin θ + d v 0 d t a k = ω 4 r 2 + d v 0 d t 2 2 ω 2 r d v 0 d t cos π θ a q = d 2 ω r d t + d 2 v 0 d t a x = d ω r cos α cos π 2 d t
where ω —rotational angular velocity of the harrow knife, rad/s.
Analysis of the type and factors that affect the rate of saline soil ground soil include the machine speed v 0 and the rotational angular velocity of the harrow knife ω . The angle between the cutting edge curve and the front of the cutting edge α is the edge wedge angle. The v 0 and ω are the motion parameters, and α is the structural parameter. After the key parameters affecting the soil crushing rate are obtained based on the dynamic mathematical model, it is necessary to design and optimize the key parameters.
(1)
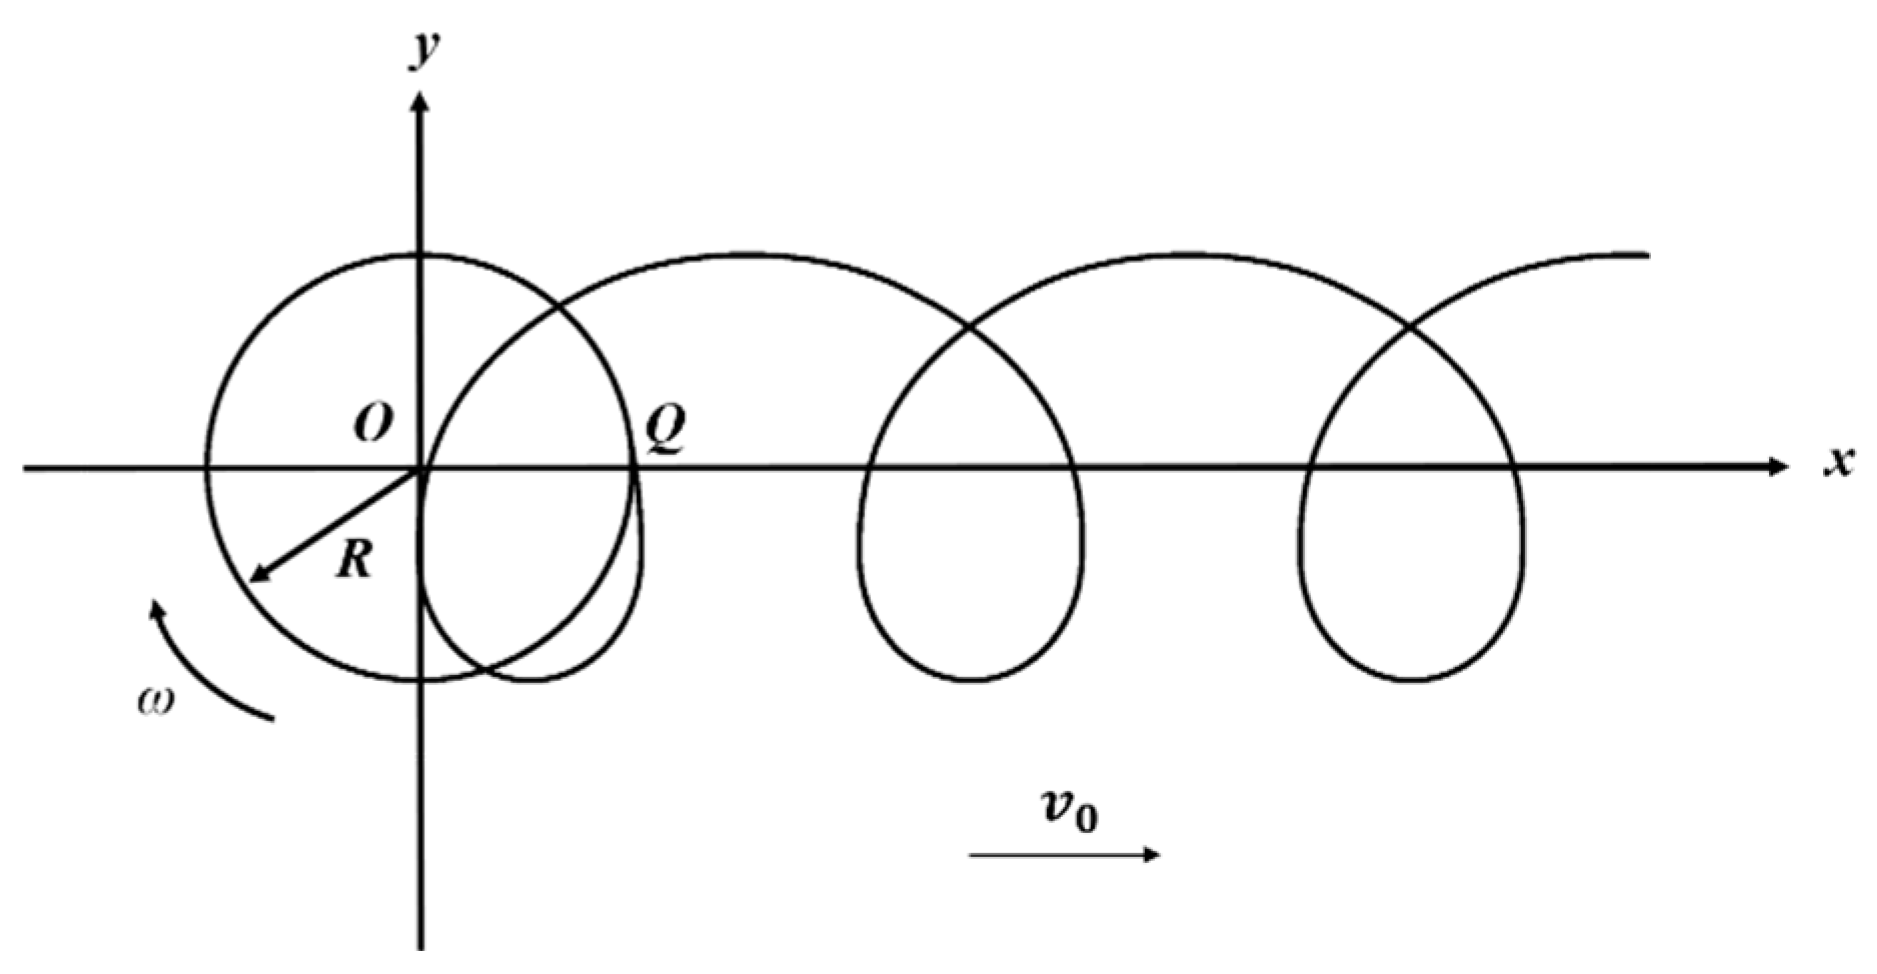
Study on kinematic parameter relationship.
Firstly, the forward speed of the machine v 0 and the rotational angular velocity of the harrow knife ω are the influential key motion parameters on soil cutting quality. Taking the rotation center of the vertical-axis rotor as the origin, a two-dimensional coordinate system is established in which the forward direction of the power harrow machine is the horizontal axis x. The motion path of the harrow knife is shown in Figure 6.
Through a detailed analysis grounded in the motion path diagram of the harrow knife, it becomes evident that the movement of the harrow knife is a composite of uniform linear motion and uniform circular motion. By closely examining this motion path diagram, the motion equation for an arbitrary point on the harrow knife can be precisely derived as follows.
x Q = v 0 t + R cos ω t y Q = R sin ω t
where t denotes harrow motion time, s.
In theory, the trajectory of the harrow knife is a cycloid, and this cycloid depends on the forward speed of the power harrow and the circular motion speed of the harrow knife, then the trajectory equation of the cycloid is as follows:
λ = R ω v 0
where λ denotes the ratio of peripheral to forward velocity.
In general, the value of λ should be greater than 1, that is, the linear speed of any point of the harrow knife is more than 1 times the speed of the power harrow machine. The size of λ determines the motion track of the harrow, which seriously affects the working quality of the power harrow, including that the missing harrow affects the soil breakage rate and that the heavy harrow causes energy waste. According to the above formula and the motion path diagram of the harrow knife, the key parameter causing the phenomenon of the missing harrow and re-harrow is that, on the curvature radius of any point on the motion path of the harrow knife, the curvature radius ρ is as follows:
ρ = λ cos ω t 1 λ cos ω t λ 2 λ 2 + 1 2 λ cos ω t 3 / 2 λ 2 ω sin ω t
From the equation for the radius of curvature ρ , it can be seen that λ and t determine the size of the radius of curvature ρ . With an increase in λ , the radius of the curvature of the motion path of the harrow knives will increase, and the increase in the curvature radius will increase the density of the cycloid until the motion paths of the harrow knives coincide, which indicates that no missing harrow will occur.
In order to find out the size of λ , Solidworks 2022 (Dassault Systèmes Co., Ltd., Waltham, MA, USA) is used for 3D modeling of the vertical axis rotor, and the dynamics simulation software RecurDyn V9R2 (Seongnam City, Republic of Korea) is used for motion simulation.
The distance between the original power harrow blade and the rotating center of the vertical rotor is 120–130 mm. Due to the serious hardening of the saline–alkali soil, the soil block volume after the collision of the soil harrow blade is large. On the basis of ensuring the overall operation effect, the distance between the harrow blade and the rotating center of the vertical rotor is designed to be 150 mm to reduce the overall resistance. In practical operations, the forward speed of a power harrow typically ranges from 0.5 to 2.5 m/s. To study the motion parameters of the power harrow, the intermediate value within this commonly used forward speed range is selected as a parameter for investigation. Set the overall forward speed of the power harrow to 1.5 m/s. Through virtual simulation, λ is set to 1, 2, 3, and 4, respectively, that is, the rotation speed of the vertical rotor is 95.54 r/min, 191.08 r/min, 286.62 r/min, and 382.16 r/min, respectively. The trajectory diagram of the harrow tip motion over 3 s is shown in Figure 7.
As can be seen from the figure above, when λ ≤ 1, that is, when the rotation speed of the vertical rotor is 95.54 r/min, the harrow knife on the vertical rotor only has a forward motion track during operation, that is, it can only push the soil forward and cannot form multiple fast and effective cutting. With an increase in λ , the single harrow blade of the vertical axis rotor begins to move in the opposite direction, which can ensure the trochoidal track, reduce the area of tillage leakage and improve the soil breaking effect. The area with overlapping lines is the harrowed area. When λ increases to 3, the rotation areas of the two harrows of the vertical rotor overlap, which further reduces the area of the missing tillage area. Therefore, in order to improve the soil breaking effect of the power harrow, the ratio of the circular speed of any point on the harrow knife to the forward speed of the tool λ should be greater than 3.
According to the size of λ , the overall transmission design and motion parameters of the power harrow are carried out to ensure that the power harrow can complete effective soil plowing work at different forward speeds. On this basis, the reasonable matching of the overall motion parameters and structural parameters is completed, so as to obtain the optimal operation effect of the dynamic harrow under the condition of saline–alkali soil.
(2)
Structural parameter design research.
Following from the research, the main structural parameters that affect the working performance and reliability of the harrow mainly include cutting edge angle γ, harrow tool height h, harrow tool thickness b, cutting edge length a, cutting edge front thickness c, etc. Its specific structure is shown in Figure 8.
Taking saline–alkali soil planting cotton as an example, the soil preparation depth is required to be 20–25 cm, the design harrow tool height h is 35 cm, and the cutting edge length a is 28 cm. The harrow blade thickness b and blade cutting edge angle are γ ( α = π 2 γ ). The thickness of the front end of the cutting edge c is the core structural parameter that affects the soil cutting effect of the harrow knife. Because the saline–alkali soil is more serious, the overall strength of the harrow knife must be improved, so the harrow knife thickness b should be increased from the usual size of 12 mm to more than 15 mm.
The cutting edge angle γ is the core parameter that affects the soil breaking ability and reduces the soil movement phenomenon. A suitable cutting edge angle γ can effectively reduce the resistance of the harrow when it is inserted into the soil and during operation. Meanwhile, the cutting edge angle γ will change the area of the soil acting on the harrow to affect its force and soil breaking effect. The resistance will increase and the earth pushing phenomenon will occur, which will also affect the soil breaking rate. The determination of the cutting edge angle γ needs to be scientifically tested.

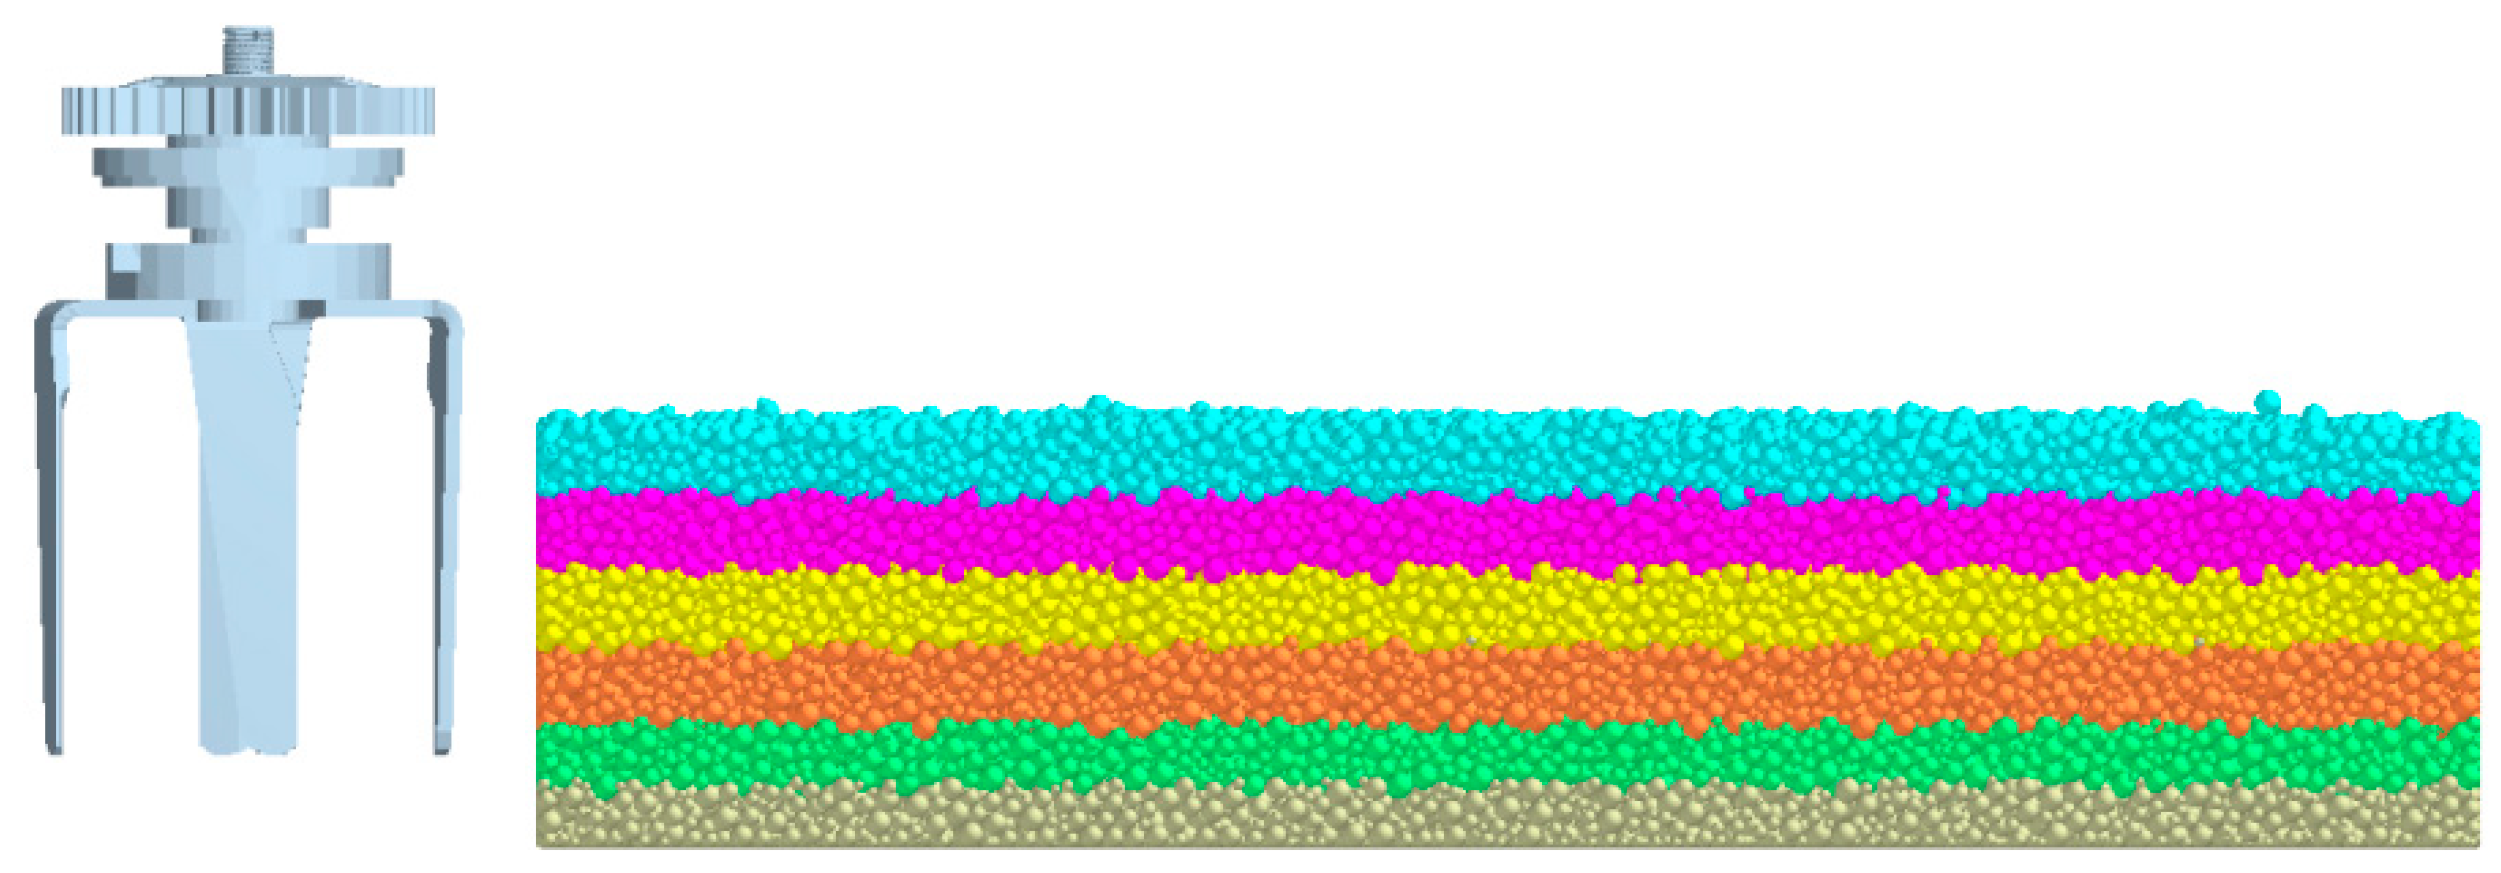
2.3. Establishment of the Discrete Element Simulation Model

The structural design of the vertical rotor and its core component, the harrow knife, has been carried out with meticulous precision, strictly following kinematic and dynamic principles. Consequently, a series of vital structural parameters have been determined. To be specific, the distance from the harrow knife to the rotational center of the vertical rotor is 150 mm, the height of the harrow knife is 300 mm, the length of the cutting edge reaches 250 mm, and the thickness of the harrow knife is 15 mm, among other parameters. However, the cutting edge angle and the thickness of the cutting edge front still necessitate further in-depth exploration. During this process, a comprehensive investigation into the working mechanism of the vertical rotor has also been carried out, aiming to gain a more profound understanding of its operational characteristics and to potentially optimize its performance in the future. Research has clearly demonstrated that the ratio, symbolized as λ, of the circular speed of an arbitrary point on the harrow knife to the forward speed of the tool must be greater than 3. Nevertheless, the precise optimal value for this ratio remains undetermined. Furthermore, the relationships and synergistic effects between motion parameters and structural parameters have yet to be investigated. To overcome these hurdles, it is essential to carry out simulation tests based on the Discrete Element Method (DEM). Through these tests, we intend to conduct a comprehensive analysis of how the cutting edge angle, the thickness of the cutting edge front, and parameter λ influence the soil crushing rate. Additionally, we will explore the interactive effects among these parameters. By taking these steps, we can effectively improve the performance of the vertical rotor, enabling it to operate more efficiently and meet the specific requirements of soil working operations more effectively.

2.3.1. Geometric Simulation Model of the Vertical Rotor of the Power Harrow

To accurately mirror the actual operational performance of the power harrow’s vertical rotor, a geometric simulation of the entire vertical-shaft rotor of the power harrow is necessary. Drawing on the foregoing research regarding the structural parameters of the vertical rotor and its key components, SolidWorks 2022 is employed to meticulously create a three-dimensional model of the power harrow’s vertical-rotor group. Subsequently, this model is seamlessly imported into EDEM 2020 (DEM Solutions Co., Ltd., Edinburgh, UK), thereby establishing a geometric simulation model of the power harrow’s vertical-rotor group. This process ensures that the simulation can closely approximate real-world conditions, providing a reliable basis for further analysis and optimization of the vertical rotor’s operation.

2.3.2. Parameter Setting of Discrete Element Simulation Test

The parameter settings for Discrete Element simulation tests hold a position of utmost importance within the simulated domain. We have engaged in a painstaking exploration of the inherent parameters of saline–alkali soil. This exploration encompasses aspects such as density, Poisson’s ratio, and shear modulus at varying depths, namely 0–5 cm, 5–10 cm, 10–15 cm, 15–20 cm, 20–25 cm, and 25–30 cm. In addition, they have delved into contact parameters, including the coefficient of restitution, static friction coefficient, and dynamic friction coefficient. Furthermore, the contact parameters between the harrow blade and saline–alkali soil particles have been precisely determined [35]. Once the Hertz–Mindlin with Bonding model was finalized, the parameters of this contact model mainly comprised the bonding radius, normal stiffness, critical normal stress, tangential stiffness, and critical tangential stress. These parameters were optimized and established through a combination of referencing the relevant literature and conducting fundamental experiments. The detailed parameter settings for the Discrete Element simulation tests are presented in Table 1, serving as a crucial foundation for the subsequent simulation analyses and research.

2.3.3. The Whole Simulation Model of Discrete Element Is Established

In light of the structural design of the power harrow’s vertical-shaft rotor elaborated earlier, a three-dimensional model of the vertical-shaft rotor group was meticulously established. Subsequently, this model was smoothly imported into the EDEM 2020 software. In line with the discrete element model of the soil plow layer previously developed, a soil model tailored for the simulation of the power harrow’s vertical-shaft rotor was constructed. To be more specific, six soil bins were created, each with dimensions of 1500 mm in length, 1000 mm in width, and 300 mm in height. For the sake of differentiation and clarity, each soil bin was represented by a distinct color. The simulation time was precisely set to 10 s. The comprehensive discrete element simulation model is vividly depicted in Figure 9, providing a clear visual representation for further analysis and study.

2.4. Discrete Element Simulation Test Scheme

Building upon the extensive research and painstaking analysis of the vertical-rotor device carried out in this study, the test factors for this experiment have been precisely determined. There are three in total: the cutting edge angle of the harrow, the cutting edge thickness of the harrow, and the ratio of the circular speed to the forward speed of the vertical rotor. Simultaneously, the number of broken bonds has been chosen as the test index. This selection of test factors and index is based on a deep understanding of the device’s operation and the key parameters that influence its performance, aiming to comprehensively evaluate the effectiveness and performance of the vertical-rotor device under different conditions.
To begin with, appropriate values for each factor are carefully selected. Subsequently, single-factor tests are conducted independently on these three test factors. The aim of this is to accurately determine the influencing trend in each test factor on the test index, thereby providing a solid data foundation for the successful execution of subsequent orthogonal tests.
(1)
Influence of harrow cutting edge angle on working effect of vertical rotor.
Since the single-factor test needs to be carried out first, when exploring the influence of the harrow’s cutting edge angle on the operational effect of the vertical-axis rotor, two tested factor values must be determined: the thickness of the front end of the harrow’s cutting edge, and the ratio of the circular speed of the vertical-axis rotor to the forward speed. The thickness of the front end of the harrow cutting edge is set at 4 mm, and the ratio of the circular speed of the vertical-axis rotor to the forward speed is set as 5. It should be noted that when selecting the cutting edge angle of the harrow knife within the range of 5–40°, an angle less than 5° is likely to result in insufficient strength of the harrow knife, leading to fracture. The tested angle interval for each group is set at 5°. Some of the relevant structures are presented in Figure 10.
(2)
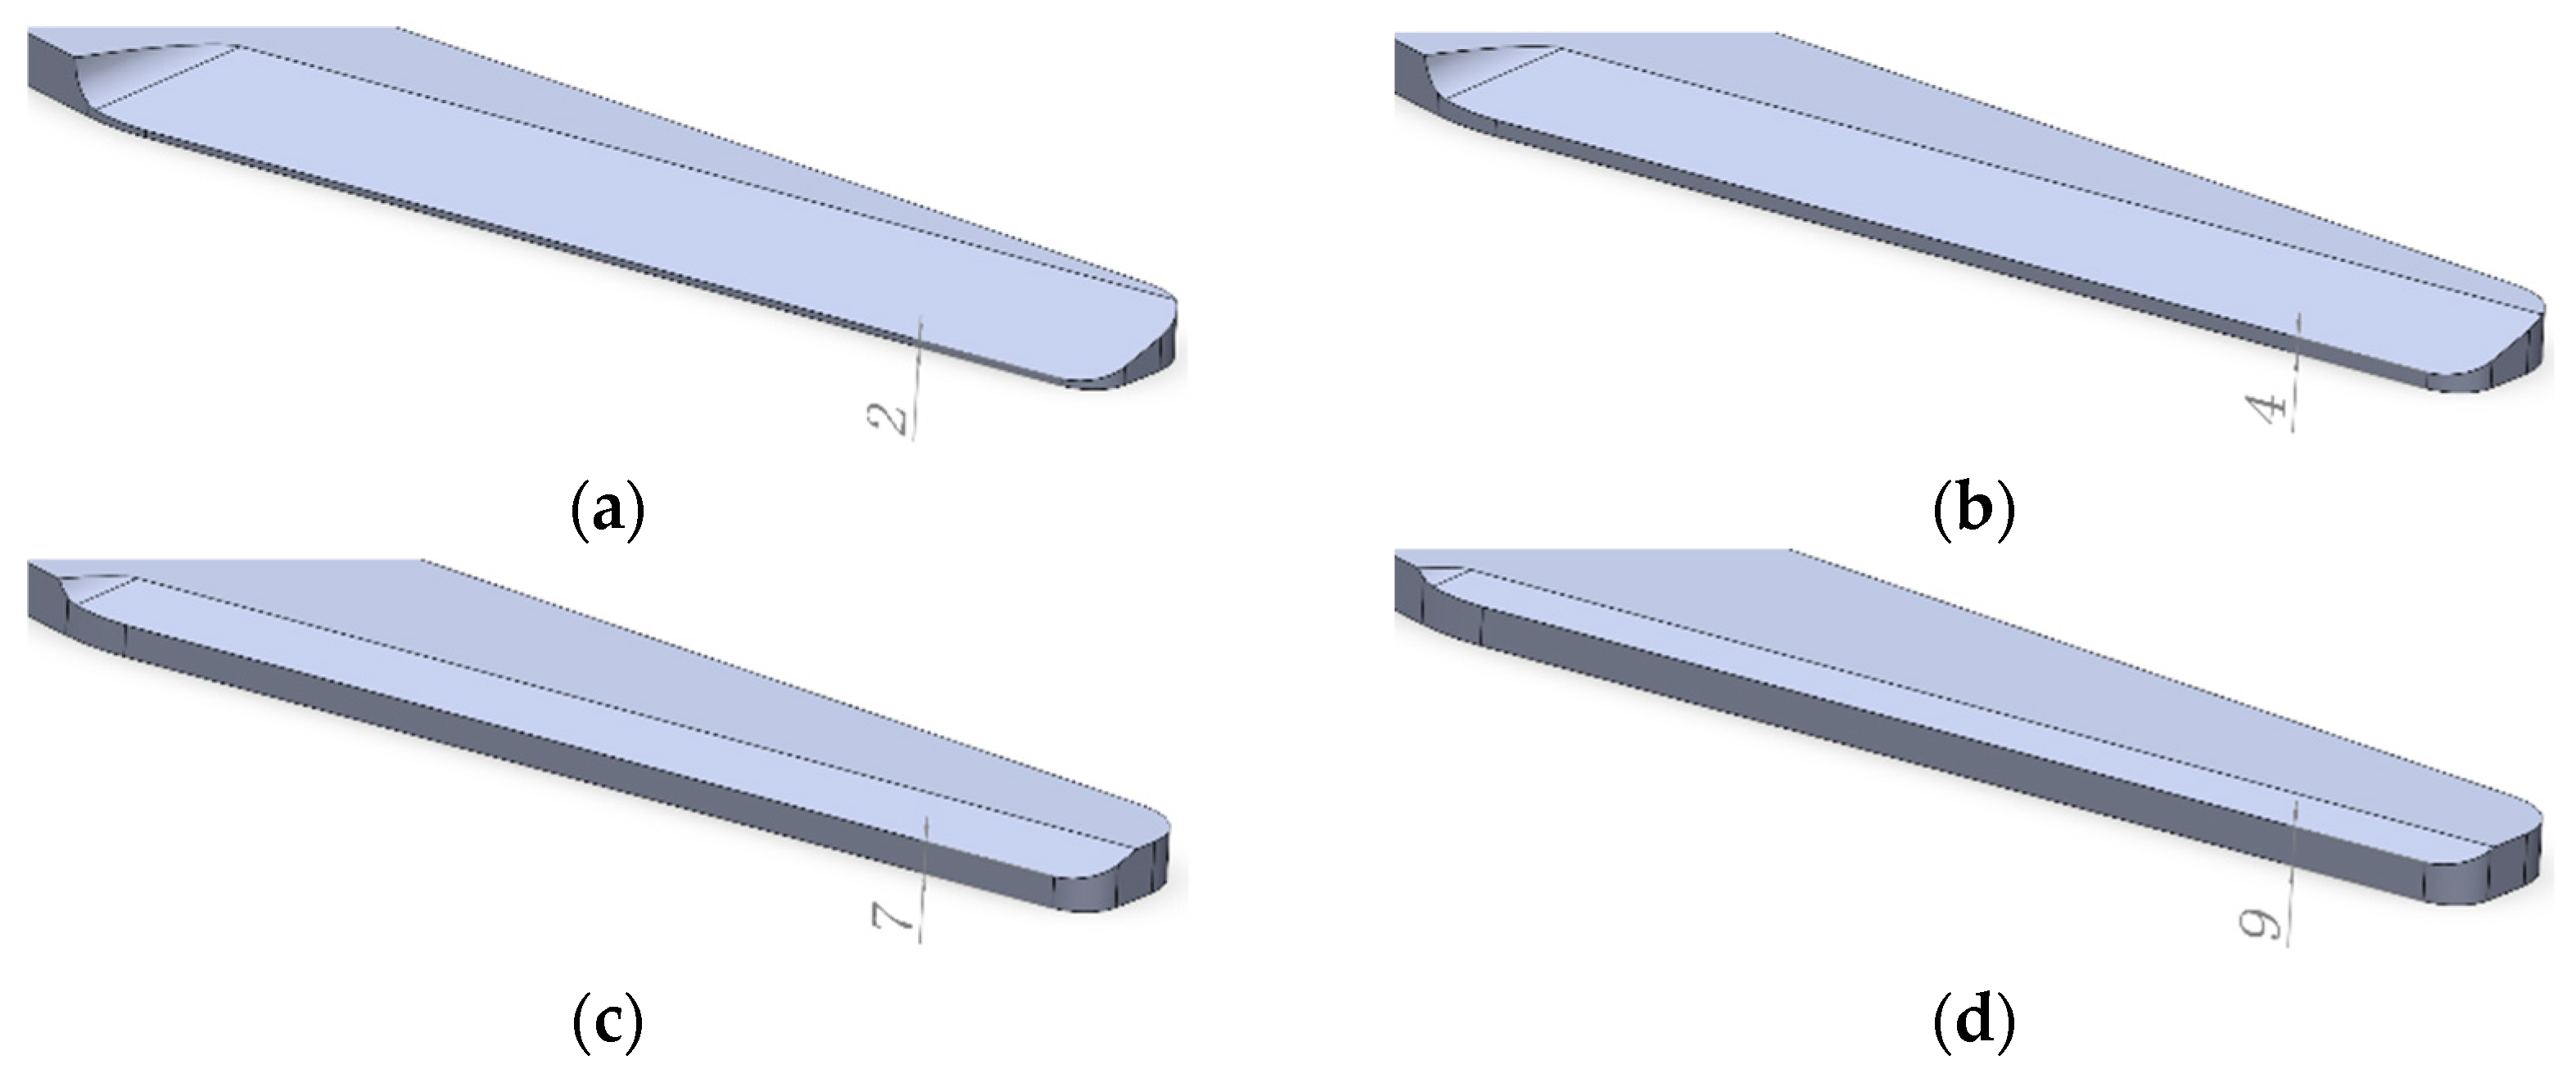
Influence of cutting edge thickness of harrow cutter on the working effect of the vertical rotor.
When investigating the influence of the cutting edge thickness of the harrow blade on the working effect of the vertical-axis rotor, the cutting edge angle of the harrow and the ratio of the circumferential speed of the vertical-axis rotor to the forward speed are defined. The cutting edge angle of the harrow blade is set at 20° and the ratio of the circumferential speed of the vertical-axis rotor to the forward speed is specified as 5. The thickness of the front end of the cutting edge of the harrow knife is selected within the range of 2–10 mm, with a thickness interval of 1 mm for each test group. Some of the relevant structures are illustrated in Figure 11.
(3)
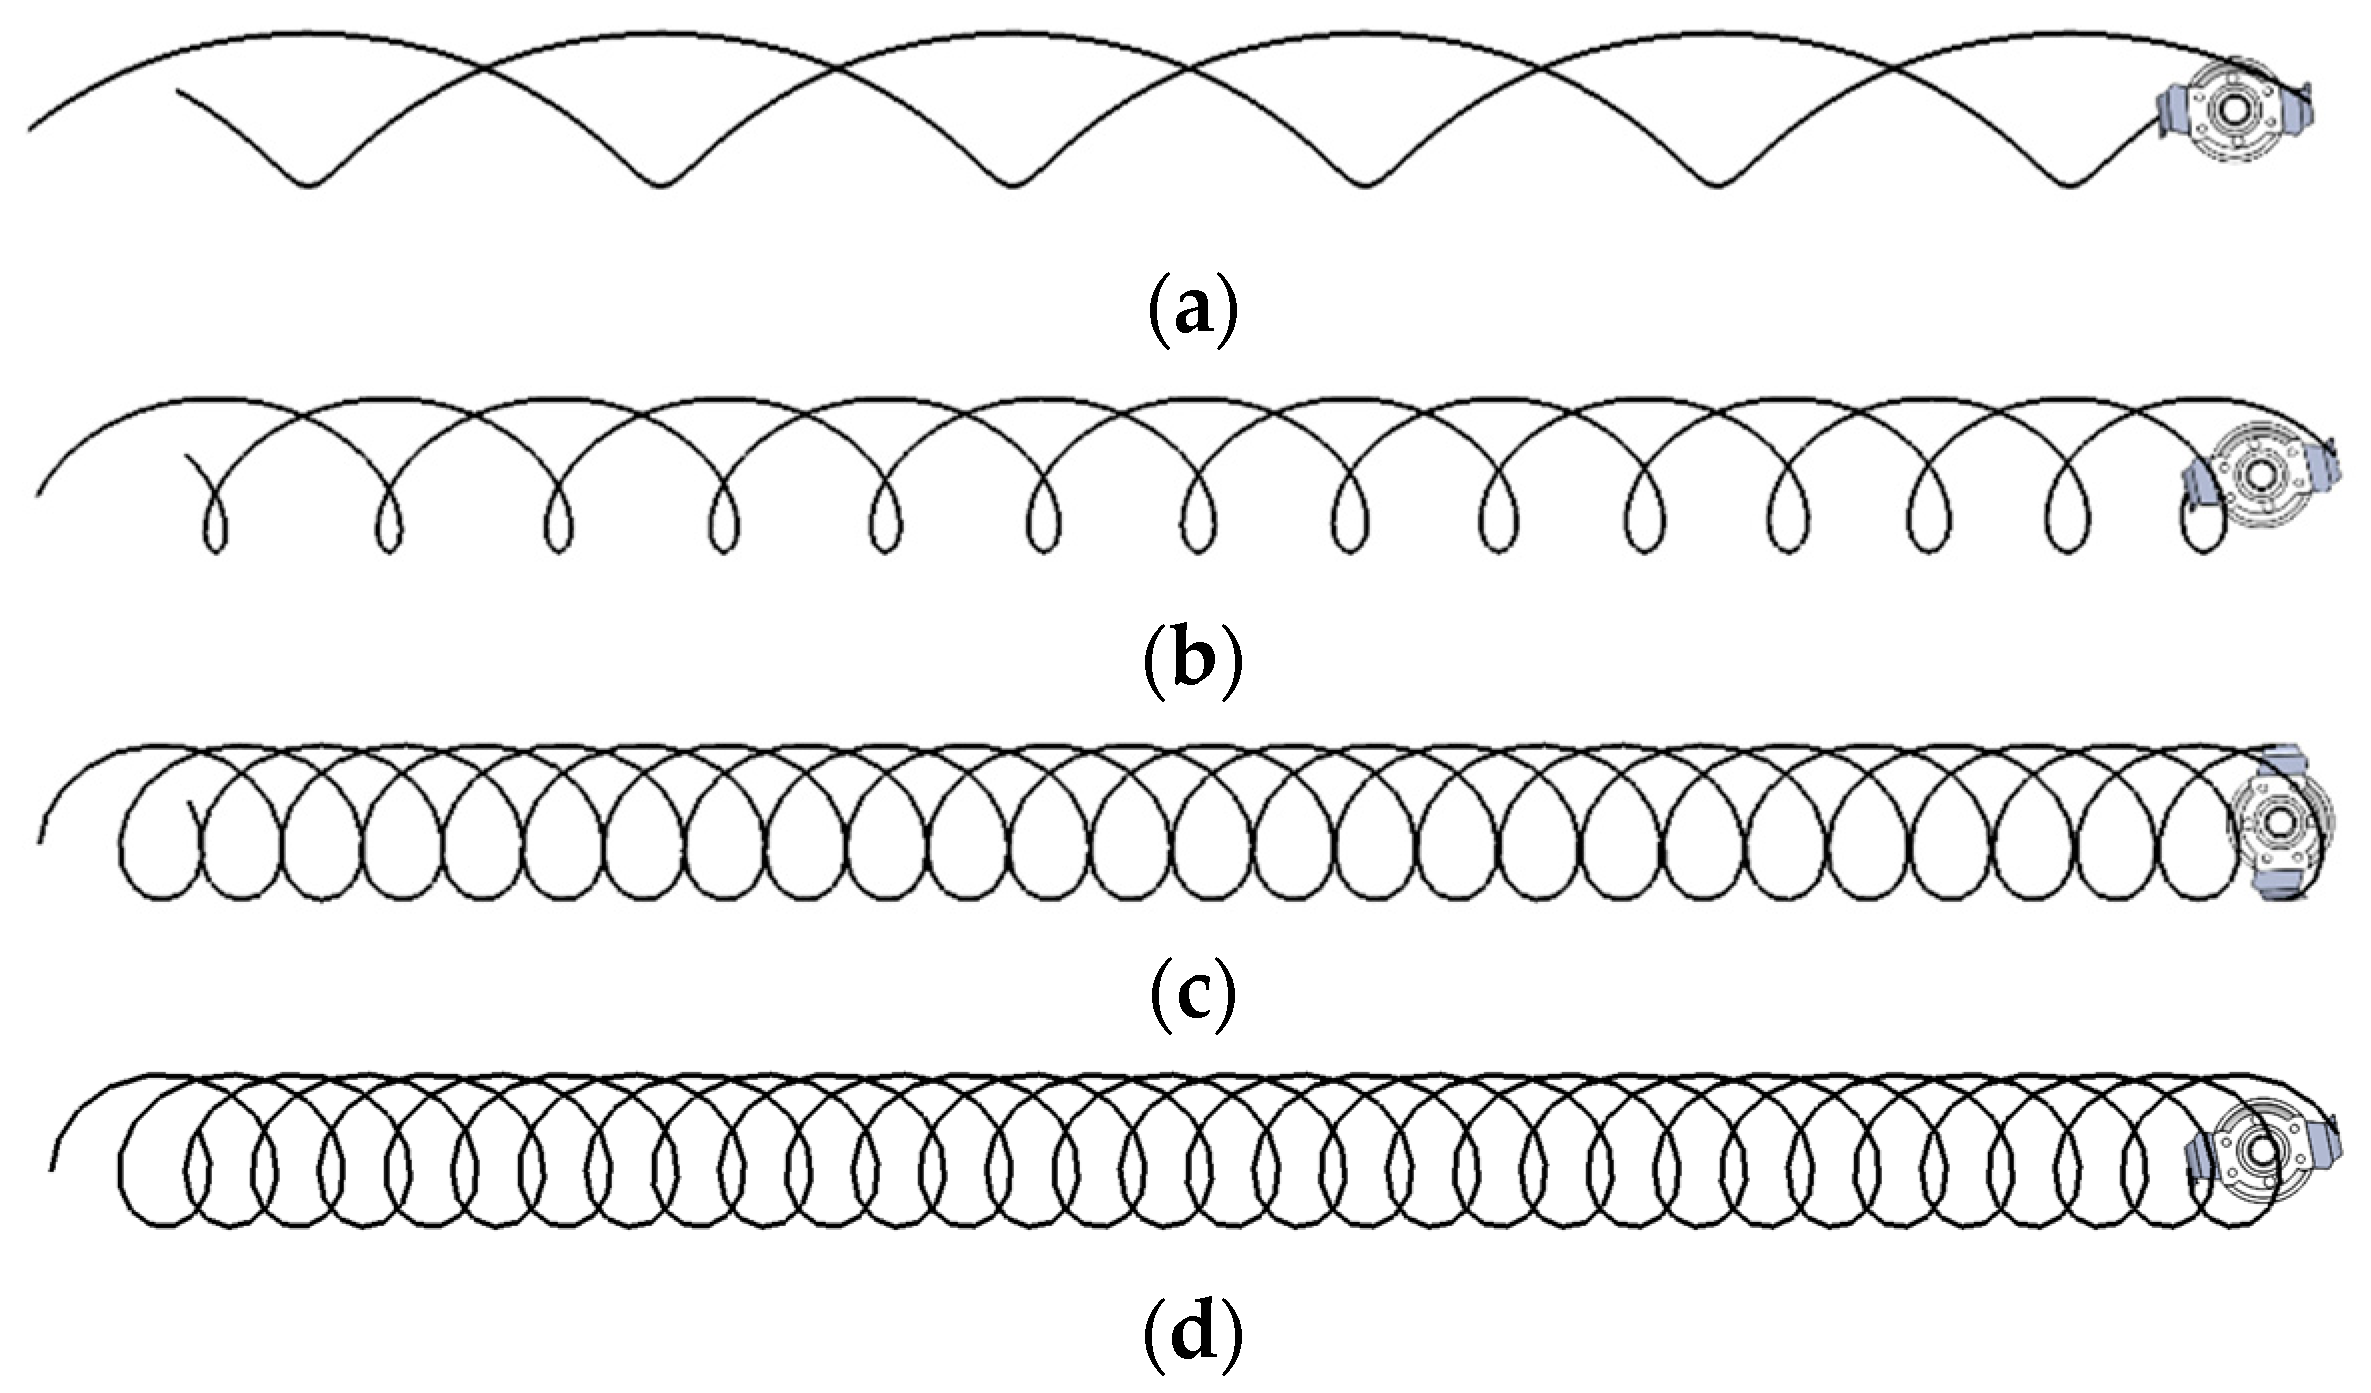
Influence of the ratio of circular speed to forward speed of the vertical axis rotor on the operating effect.
When exploring the impact of the ratio between the circular speed and the forward speed of the vertical rotor on its operational performance, it is crucial to initially fix the cutting edge angle of the harrow and the thickness of the harrow cutting edge’s front end. In this instance, the cutting edge angle of the harrow is set at 20°, and the thickness of the harrow cutting edge’s front end is set to 4 mm. The ratio of the circumferential velocity to the forward velocity is varied within the range of 3–10, with a ratio interval of 1 for each test group. This configuration enables a clear observation of how alterations in this ratio influence the operating effect of the vertical rotor, thereby facilitating a more accurate understanding of the vertical rotor’s performance under different speed ratios.
(4)
Orthogonal experimental design for the multi-factor soil crushing operation of the vertical rotor.
The experiment is carried out in accordance with the conclusions derived from the single-factor tests. Three crucial test factors are chosen: the cutting edge angle of the harrow knife, the thickness of the front end of the harrow knife’s cutting edge, and the ratio of the circumferential speed to the forward speed. Taking into account the results achieved in the single-factor tests, three suitable levels are meticulously determined for each factor. This approach ensures that the subsequent experimental analysis can comprehensively and accurately evaluate the impact of these factors on the overall performance, laying a solid foundation for obtaining reliable and valuable experimental outcomes.
Given that there exists a multivariate nonlinear regression relationship among the three factors, namely the harrow cutting edge angle, the thickness of the harrow cutting edge front end, the ratio of circular velocity to forward velocity, and the number of bond breaks, the Box–Behnken Design (BBD) test design methods are utilized in this experiment. Specifically, by establishing a response surface model, a comprehensive analysis of the test data can be conducted. This approach facilitates a more in-depth understanding of the intricate interactions among these factors and their combined influence on the soil crushing operation of the vertical rotor, thereby providing valuable insights into optimizing the performance of the system under study.

2.5. Field Trial Scheme

Based on the content of the discrete element simulation tests, experimental research was conducted on the soil crushing rate. The optimal parameter combination that yields the maximum number of bond breaks is also the optimal combination that can achieve the highest soil crushing rate. Therefore, the design and testing of the device were carried out in accordance with this optimal parameter combination, aiming to enhance the performance and efficiency of the device and obtain the most satisfactory results in soil crushing operations.
(1)
Field test plan for soil crushing rate.
① Testing instruments: Optimized power harrow, Dongfanghong 1604 tractor (China Yituo Group Co., Ltd., Luoyang, China) (installing the Beidou automatic driving system enables precise control of the forward speed), meter stick (Ningbo Deli Group Co., Ltd., Ningbo, China), electronic balance (Shenyang Longwei Electronics Co., Ltd., Shenyang, China), etc.
② Test method: The measurement method involves randomly selecting 10 test areas, each with an area of 0.5 × 0.5 m. Subsequently, all of the soil within a depth of 20 cm is removed. The longest edge of each clod is measured, and, taking 5 cm as the reference, the clods greater than, equal to, and less than 5 cm are collected. Then, these clods are weighed using electronic scales. The percentage of the mass of the three types of clods in the total mass of clods is calculated, and the proportion of the mass of clods that are less than or equal to 5 cm is defined as the broken soil rate. The calculation formula is as follows:
S = m a m b
In the formula, the symbols represent the following:
S—Soil crushing rate, %;
m a —Mass of soil clods with a size less than or equal to 5 cm, kg;
m b —Total mass of all soil clods, kg.
Determination of operation parameters: Based on the optimized best combination parameters from the simulation test, set the operation parameters for the field test, with a harrowing depth of 20 cm.
(2)
Test location and time.
Test period: 25 July–5 August 2023.
Test location: The Agricultural Test and Demonstration Base for Saline–Alkali Land in the Yellow River Delta Agricultural High-tech Industrial Demonstration Zone, Dongying City, Shandong Province. The soil parameters were measured by employing the methods detailed in Ref. [35]. The soil conditions at the experimental site are shown in Table 2.

3. Results and Discussion

3.1. Discrete Element Simulation Results

(1)
Results of the influence of the cutting edge angle of the rake knife on the operation effect of the vertical rotor.
The tests were carried out with strict adherence to the designed simulation test plan, controlling for the variables. The test results are shown in Table 3 and Figure 12 and Figure 13.
To vividly depict the variation in the number of broken bonds with respect to the cutting edge angle, a line chart demonstrating the relationship between the number of broken bonds and the cutting edge angle was created, as presented in Figure 13. It is clear from the data above that within the range of the cutting edge angle from 5° to 20°, the number of broken bonds remains relatively high. Nevertheless, once the cutting edge angle surpasses 20°, the number of broken bonds shows a precipitous decline. This decline indicates that the soil crushing effect becomes less satisfactory, suggesting that an excessive cutting edge angle may not be conducive to achieving an optimal soil crushing outcome.
(2)
Influence of the thickness of the front end of the rake knife’s cutting edge on the operation effect of the vertical-shaft rotor.
The tests were carried out strictly in accordance with the designed simulation test plan, with variables controlled. The test results are shown in Table 4 and Figure 14 and Figure 15.
To present a clear visual representation of how the number of broken bonds changes with the thickness of the cutting edge front end, a line chart portraying the number of broken bonds as a function of the cutting edge front end thickness was carefully constructed, as shown in Figure 15. Evidently, according to the data above, when the thickness of the cutting edge front end ranges from 2 to 5 mm, the number of broken bonds is relatively large. However, once the thickness of the cutting edge front end goes beyond 5 mm, the number of broken bonds experiences a sharp decline. This decline indicates that the soil crushing effect is less than satisfactory, suggesting that an overly thick cutting edge front end may impede the efficient crushing of soil.
(3)
Results of the influence of the ratio of the circumferential speed of the vertical rotor to the forward speed on the operation effect of the vertical rotor.
The tests were meticulously executed in strict compliance with the pre-designed simulation test plan, while effectively controlling all variables. The comprehensive test results are presented in Table 5, as well as in Figure 16 and Figure 17.
To provide a clear visual representation of how the number of broken bonds varies with the ratio of the circumferential speed to the forward speed, a line chart illustrating the number of broken bonds as a function of this ratio was meticulously crafted, as shown in Figure 17. Evidently, as is clear from the table above that, when the ratio of the circumferential speed to the forward speed falls within the range of 6–10, the number of broken bonds remains relatively high. Nevertheless, once this ratio drops below 6, the number of broken bonds experiences a rapid decline. This decline indicates that the soil crushing effect is far from ideal, suggesting that a relatively low ratio of circumferential speed to forward speed may not be conducive to achieving an efficient soil crushing operation.
(4)
Results of the multi-factor orthogonal test for the soil crushing operation of the vertical-rotor.
Combined with the analysis conclusion of the single-factor test, the factor levels of the test are shown in Table 6.
Scientific tests were conducted in strict accordance with the horizontal data of each factor in Table 6. The following test results are obtained, as shown in Table 7.
According to the simulation test results in Table 7, the regression coefficient and significance analysis of the number of bond breaks are carried out, and the analysis results are shown in Table 8.

3.2. Analysis and Discussion

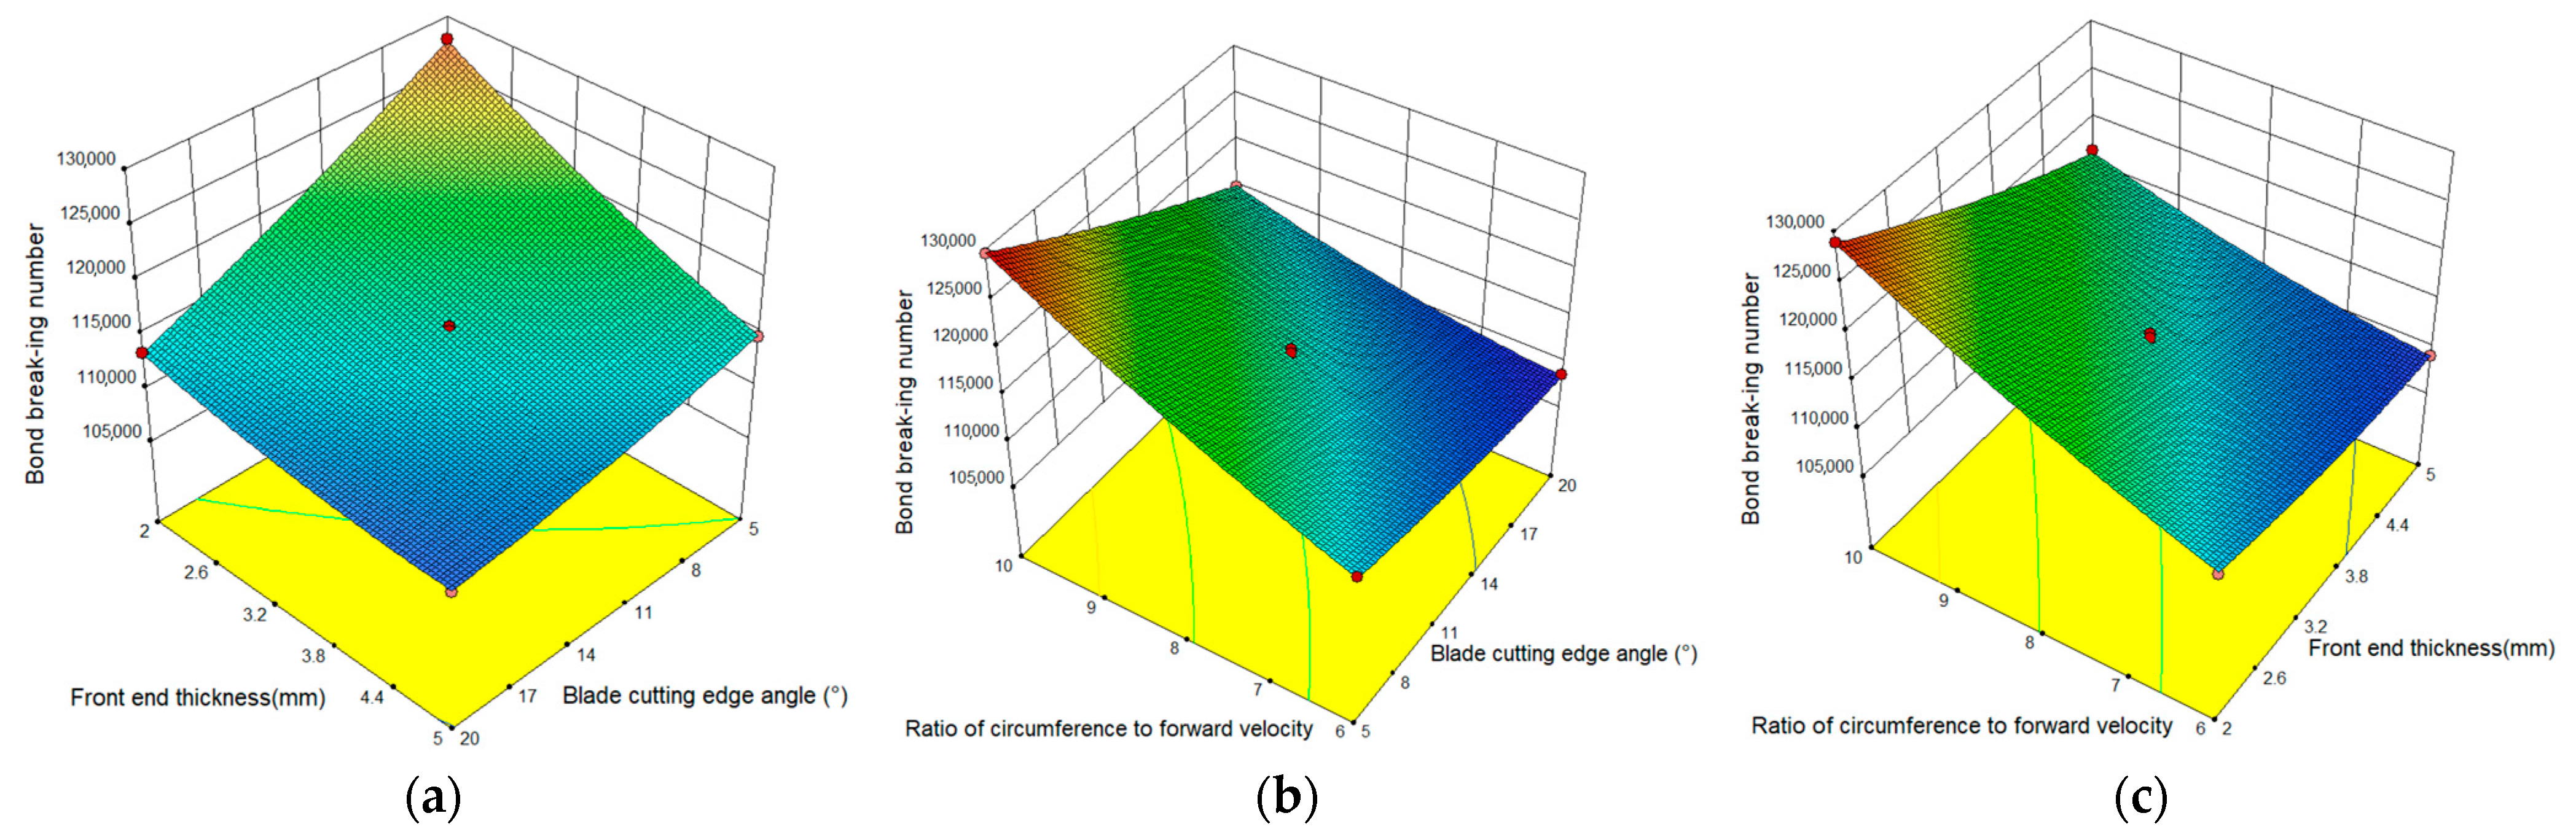
3.2.1. Response Surface Regression Analysis

As shown in Table 8, the value p < 0.0001 < 0.05 of the model is extremely significant. It can be seen from the table that p values of A, B, C, AB, AC, BC, A2, B2, and C2 are all less than 0.05, indicating that all regression terms, including the three interaction terms, have a significant impact on the number of bond breaks.
On the basis of the preliminary conclusions and trends of the above single-factor experiments, the significance of the influence of the above three factors on the number of bond breaks is further studied by studying the three-dimensional response surface graphs of the interactions between AB, AC, and BC, respectively, as shown in Figure 18.
First, one of the influencing factors is fixed at 0, and then the interaction between the other two influencing factors is analyzed. As depicted in Figure 18a, when the ratio of the harrow knife’s circular speed to the forward speed is 8, and as the cutting edge angle of the harrow knife and the thickness of the harrow knife cutting edge increase simultaneously, the number of bond fractures gradually decreases. Conversely, when the cutting edge angle of the harrow knife increases while the thickness of the harrow knife cutting edge decreases, the number of bond fractures gradually increases. Notably, this decreasing trend is more pronounced with changes in the thickness of the harrow knife cutting edge. This indicates that the thickness of the harrow knife cutting edge front edge has a more significant impact on the number of bond breaks than the cutting edge angle. In Figure 18b, when the cutting edge angle of the harrow knife and the ratio of the circular speed to the advancing speed increase simultaneously, the number of bond breaks gradually increases. When the cutting edge angle of the harrow knife increases while the ratio of the circular speed to the advancing speed decreases, the number of bond breaks gradually decreases, and this decreasing trend is more substantial in the ratio of the circular speed to the advancing speed. Evidently, the effect of the ratio of circular velocity to forward velocity on the number of bond breaks is greater than that of the cutting edge angle of the harrow. Regarding Figure 18c, when the thickness of the harrow knife cutting edge front end and the ratio of the circumferential speed to the forward speed increase simultaneously, the number of bond fractures gradually increases. When the thickness of the harrow knife cutting edge front end increases while the ratio of the circumferential speed to the forward speed decreases, the number of bond fractures gradually decreases, with the decreasing trend being more prominent in the ratio of the circumferential speed to the forward speed. Thus, the effect of the ratio of circular velocity to forward velocity on the number of bond breaks is greater than that of the thickness of the harrow-cutting edge front edge. In conclusion, it can be clearly seen that the order of factors affecting the number of bond breaks is: the ratio of circular velocity to forward velocity > thickness of the harrow knife cutting edge > cutting edge angle of the harrow knife.
At the same time, according to the feedback information in Table 8, the regression equation of the number of bond breaks after operation is obtained:
Y = 1.153 E + 005 4822.37 A 4047.84 B + 5785.50 C + 2339.00 A B 2416.75 A C 2091.25 B C + 490.80 A 2 + 730.30 B 2 + 903.05 C 2
According to the agronomic requirements, the regression equation was optimized, and the optimal combination of A = 6.204°, B = 2.675 mm, and C = 9.896 was obtained. The optimal combination was verified using a simulation test, and the number of bond breaks was 132,556.

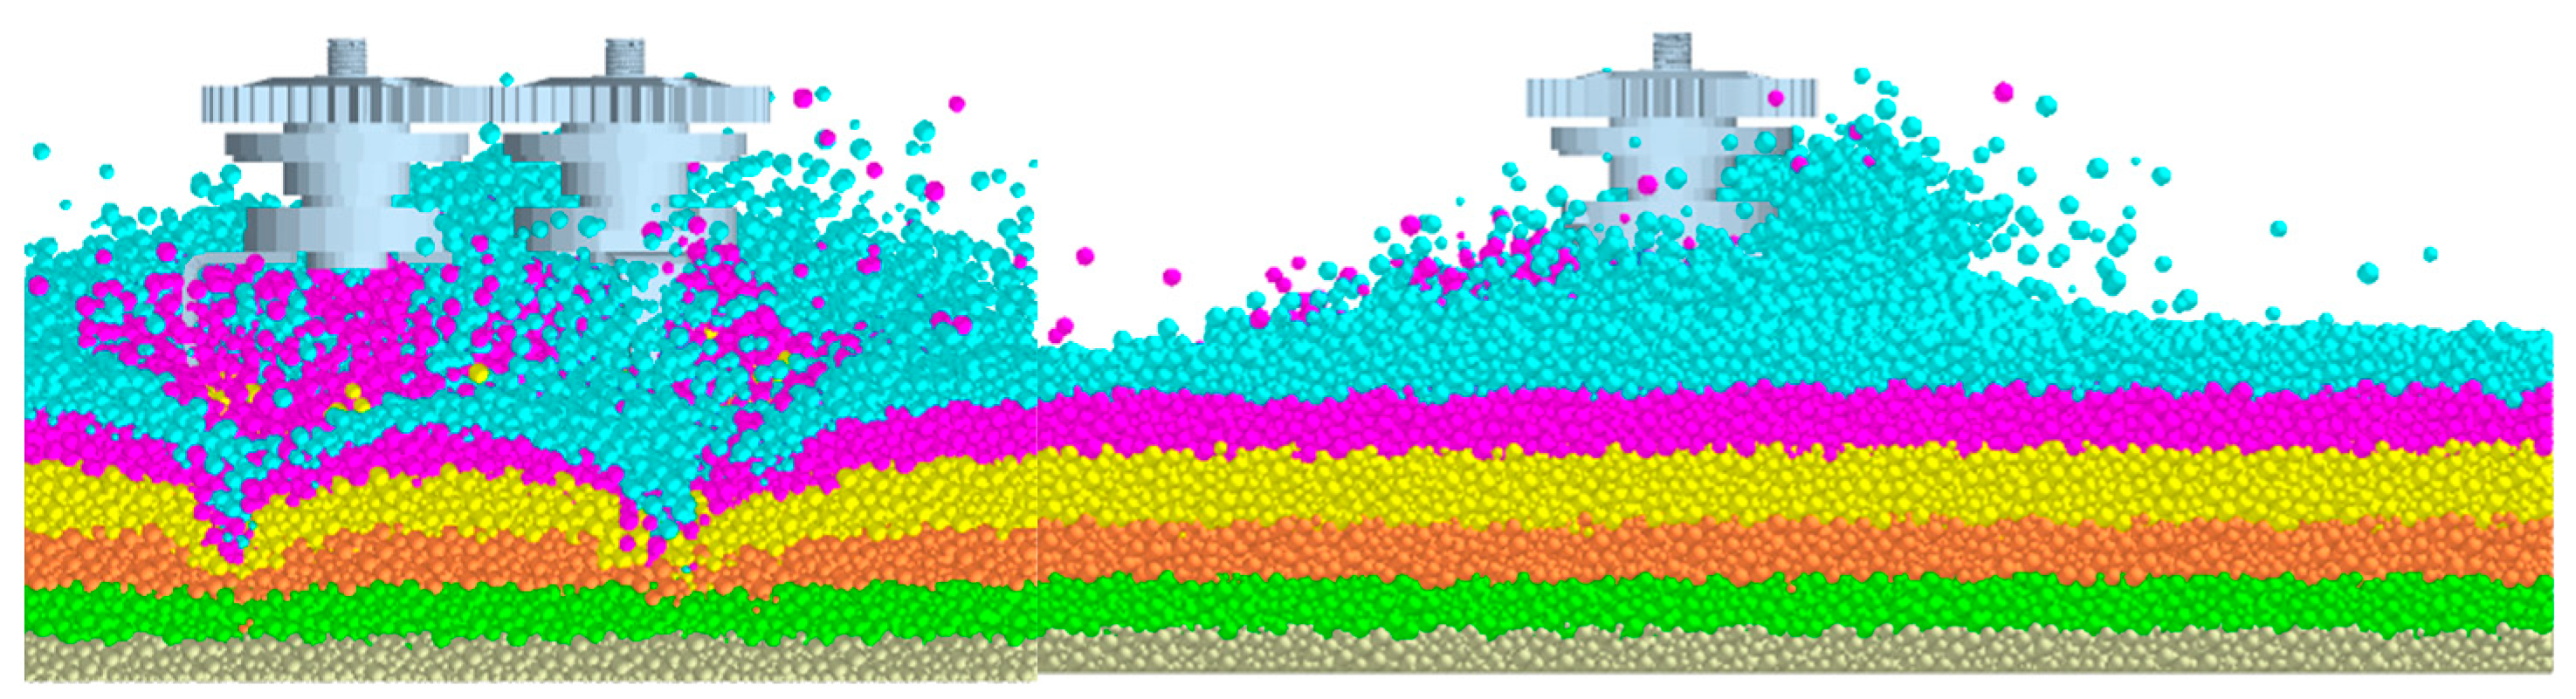
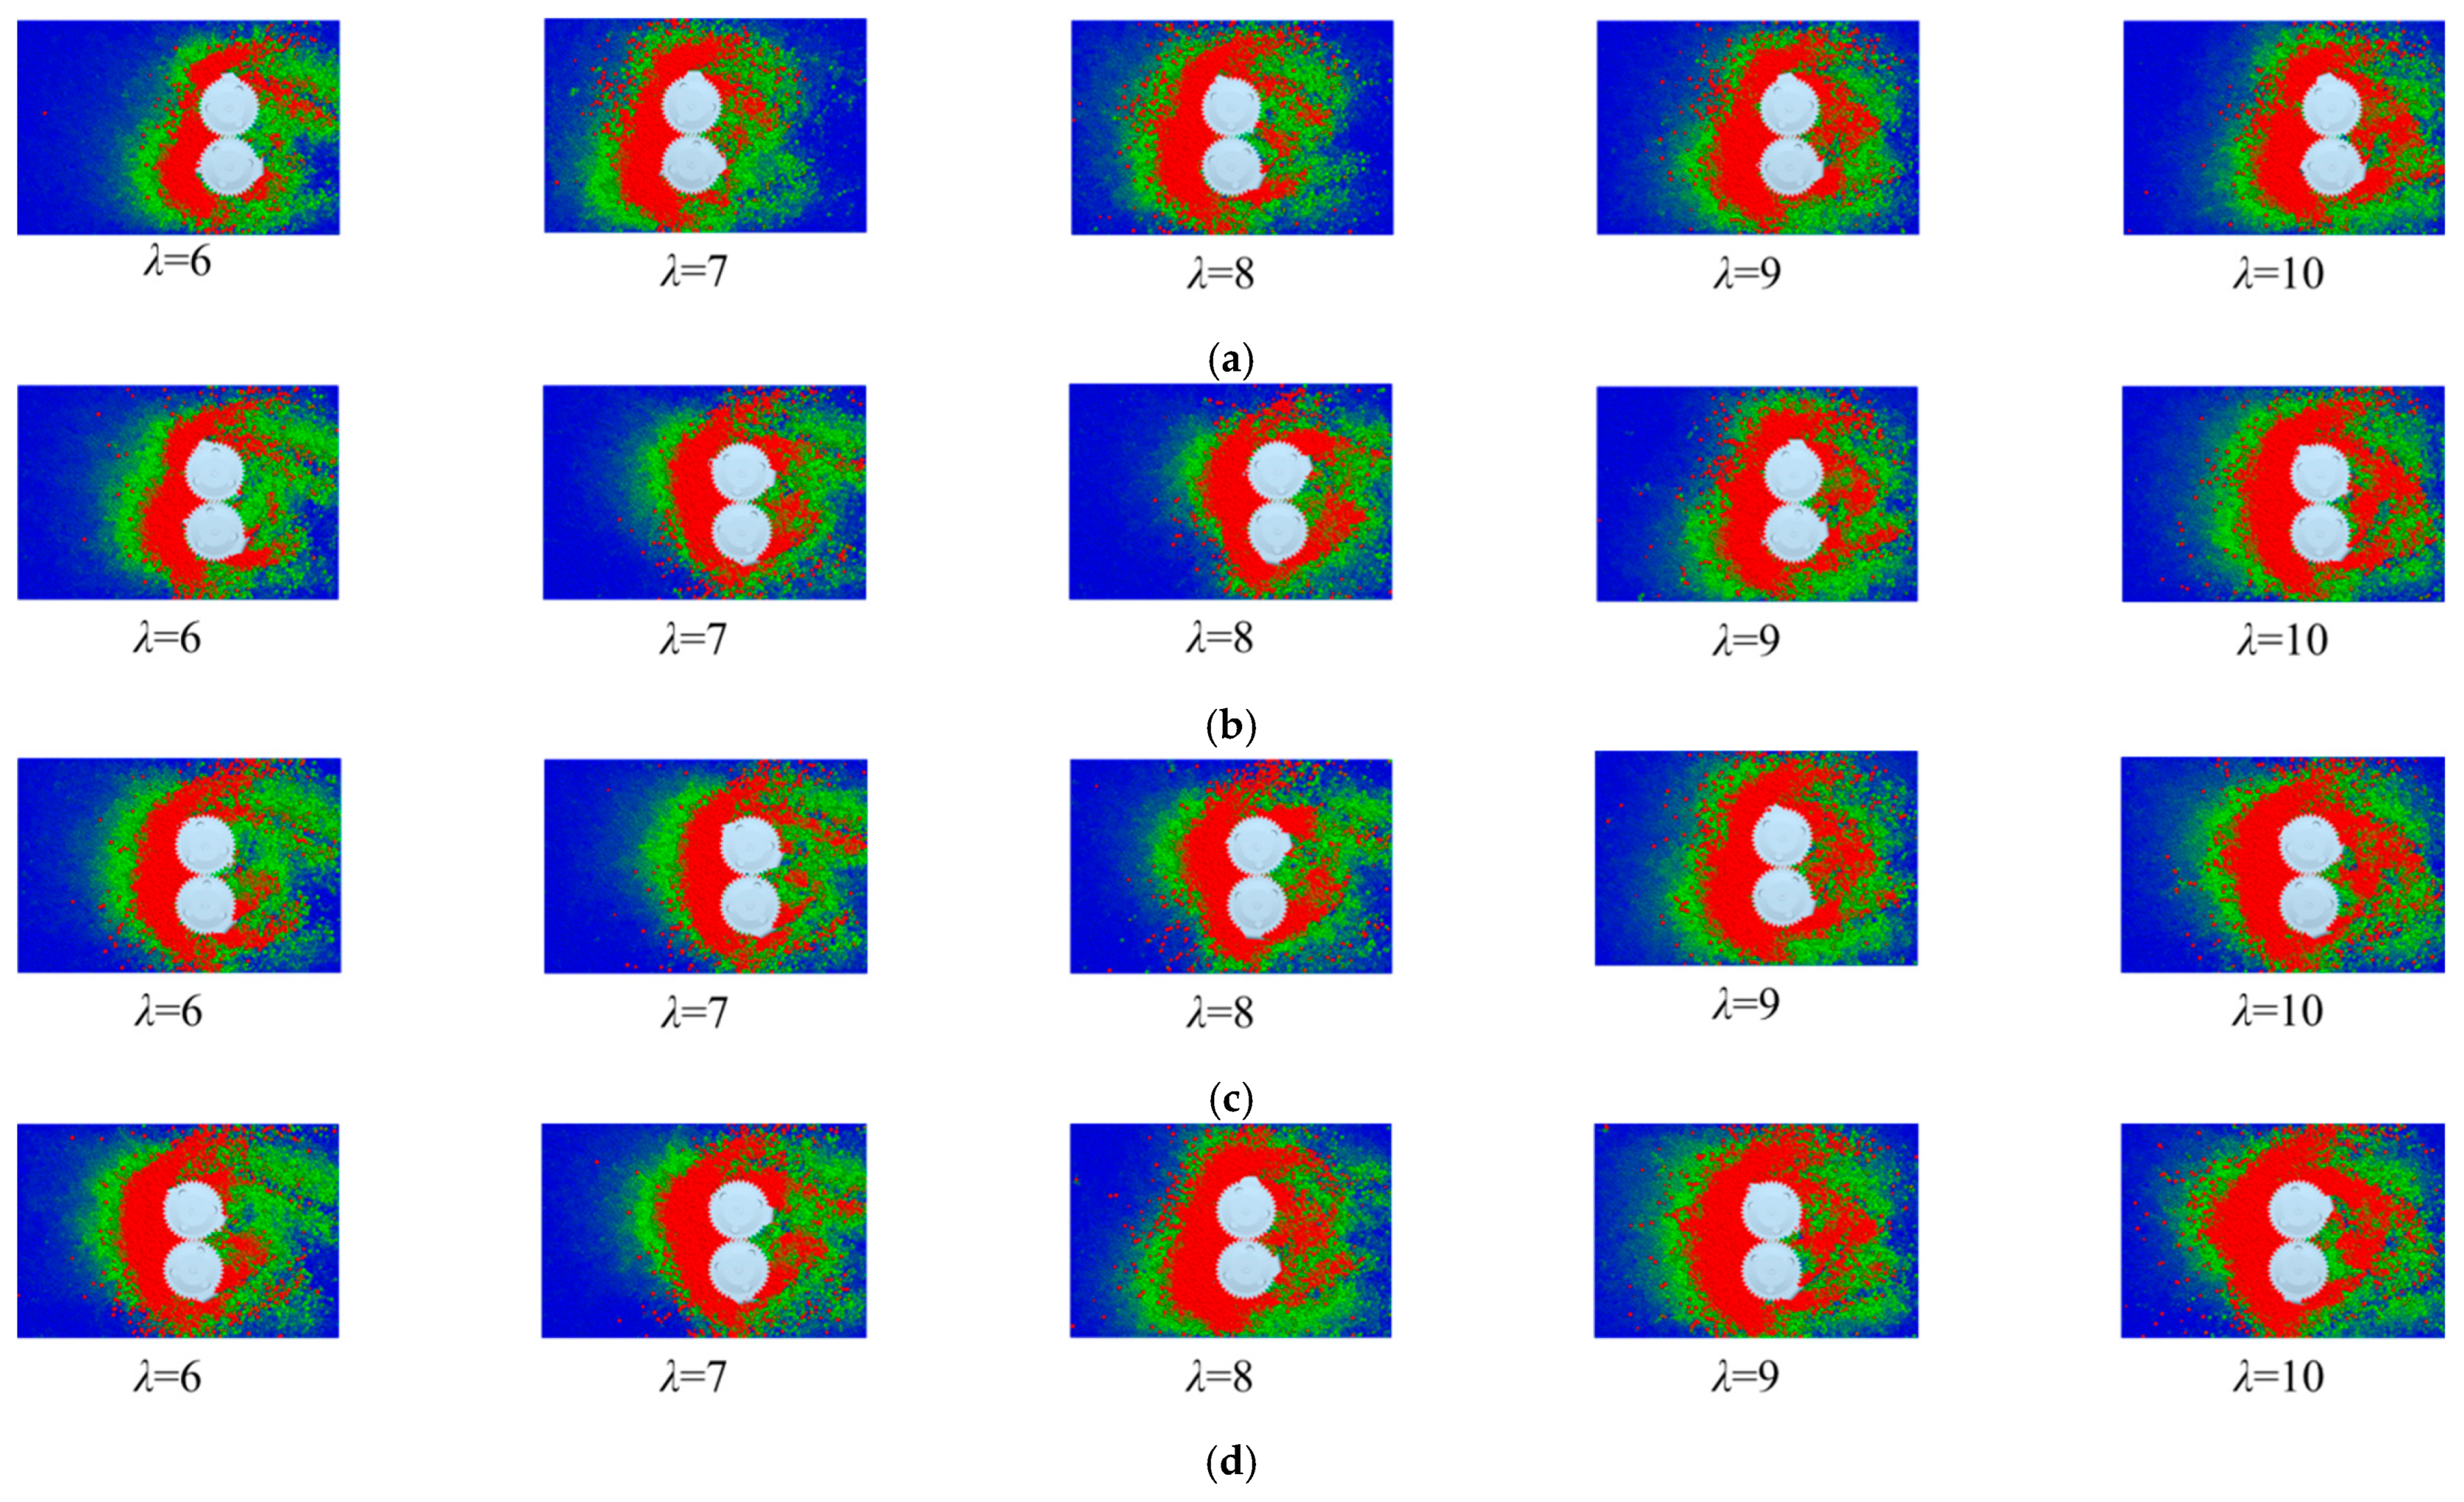
3.2.2. Analysis of Soil Disturbance and Soil Blockage

Drawing on the results of single-factor and orthogonal experiments, our objective is to enhance the quality of dynamic harrow land preparation operations, minimize soil disturbance, and reduce the occurrence of soil blockage. Research has disclosed a strong correlation between these aspects and the working speed. Consequently, when determining the ratio of circumferential speed to forward speed, simulation tests are conducted within the suitable forward speed range of 5–8 km/h. This exploration is focused on unraveling the relationship between soil disturbance and soil blockage, with the ultimate goal of identifying the optimal forward speed. The pertinent data can be observed in Figure 19 and Figure 20.
As can be seen from Figure 19 and Figure 20, under the condition of the same forward speed, soil disturbance will increase as the value of λ rises. Conversely, when the value of λ remains constant, soil disturbance will increase with the increase in the forward speed. Based on the actual operation scenario, for there to be no soil blockage, the disturbance of the soil should not exceed the height of the main gathering area of the transmission gear. When the forward speed is 5 km/h, no soil blockage phenomenon occurs. When the forward speed reaches 6 km/h, no soil heaping phenomenon occurs when λ < 9; however, when 9 < λ < 10, the soil heaping phenomenon emerges. When the forward speed is greater than 7 km/h, soil blockage will occur as long as λ > 7. Considering all of these factors, λ = 9.896 is one of the optimal combination parameters. Through the simulation analysis of soil disturbance, it is found that when the forward speed is approximately 6 km/h, the soil disturbance is relatively minor, and it is less likely to generate a soil disturbance phenomenon. This comprehensive analysis of the relationship between forward speed, λ value, soil disturbance, and soil blockage provides valuable insights for optimizing the operation of relevant machinery and achieving better land treatment effects.

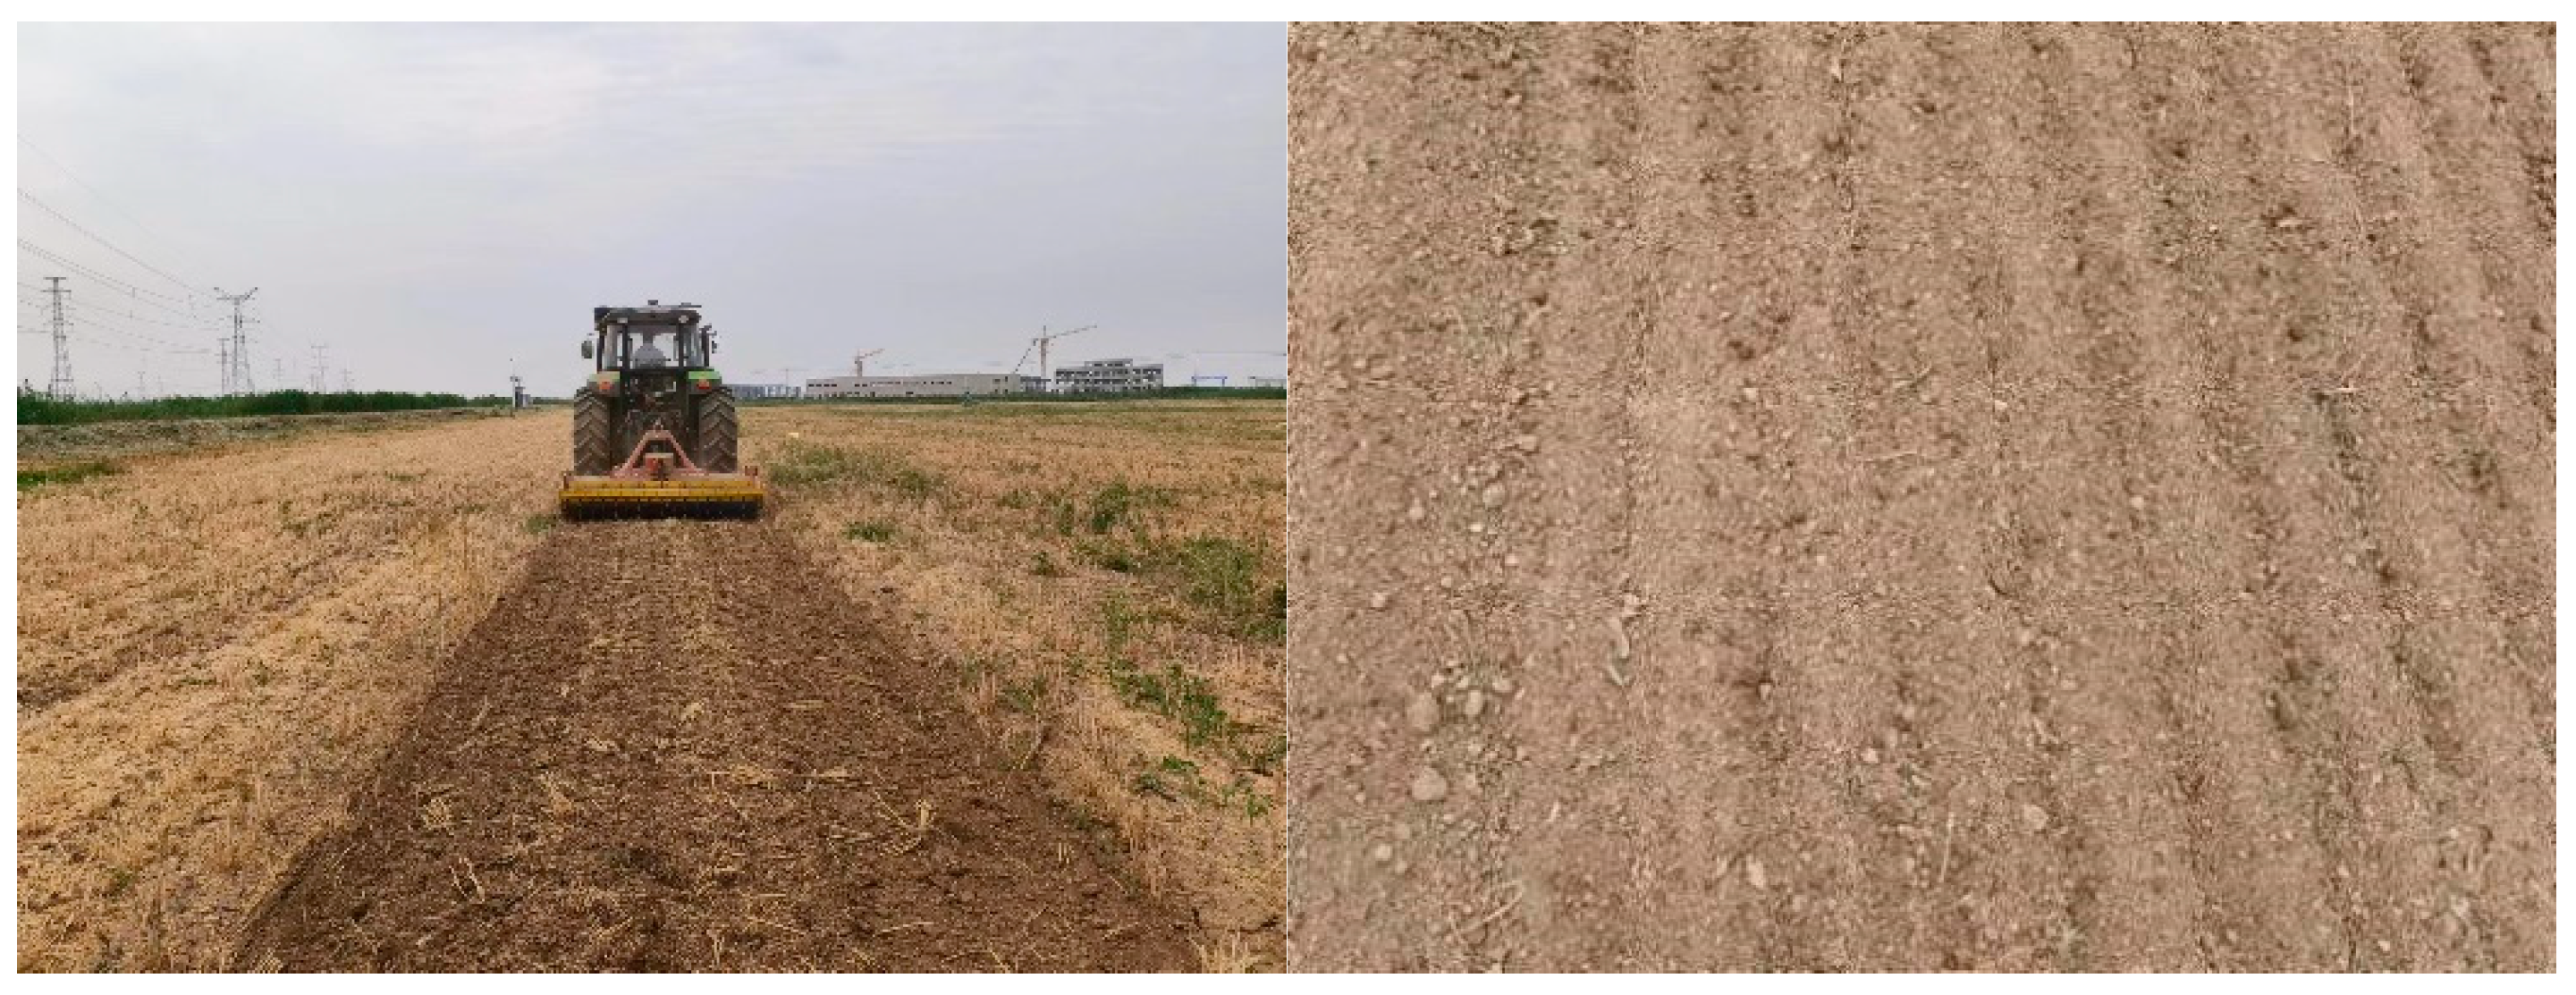
3.3. Field Test Results

Based on the Discrete Element simulation tests, the harrow blades were manufactured through high-precision machining. The key structural parameters of the harrow blades are as follows: the cutting edge angle is 6.204°, the thickness of the front end of the cutting edge is 2.675 mm, the forward speed was set at 6 km/h, and the rotational speed of the vertical-shaft rotor was set at 1052 r/min.
In accordance with the field test plan specifically designed for measuring the soil fragmentation rate, the tests were carried out with meticulous adherence to scientific methodologies. This rigorous approach successfully generated a wealth of test results and data. Following the optimized operation of the power harrow, a remarkable increase in the soil fragmentation rate of saline–alkaline soil has been observed. Notably, the surface soil exhibits almost no signs of compaction. Moreover, only a negligible number of soil clods have a longest side length exceeding 10 cm. The operational effect of the power harrow, which vividly demonstrates these improvements, is visually presented in Figure 21.
The test results are shown in Table 9.
It can be seen from the data in the table that, after ten soil crushing operations, the measured soil crushing rate is higher than 85% and the average crushing rate is 88.66%, reaching the predetermined target and meeting the design requirements.

4. Conclusions

With the aim of maximizing the comprehensive utilization value of saline–alkali land and boosting the yield of crops cultivated therein, research was meticulously conducted to enhance the soil crushing performance of power harrows, taking into full account the unique soil characteristics of saline–alkali land. Specially designed soil crushing operation components for power harrows in saline–alkali land were successfully developed. These components not only serve as crucial equipment support for the large-scale development and efficient utilization of saline–alkali land, but also mark a significant step forward in the field of agricultural land improvement. The detailed research findings are presented as follows:
(1)
The overall structure and key components of the power harrow were meticulously designed through the profound integration of agricultural machinery and agronomy concepts. This design process primarily entailed several crucial steps. First, kinetic research was carried out to precisely determine the parameters that have a direct impact on the soil crushing effect of the harrow blades. Then, in close combination with agronomic requirements, the reasonable range of structural parameters was preliminarily ascertained. Moreover, kinematics was employed to conduct a detailed analysis of the motion parameters influencing the soil crushing effect. Through this in-depth analysis, a reasonable parameter range was successfully obtained. All these efforts provide solid data support for subsequent simulation-based optimization, which is essential for enhancing the overall performance and efficiency of the power harrow in soil crushing operations.
(2)
The Discrete Element Method (DEM) was employed to simulate the soil crushing process of the vertical-shaft rotor. Taking the number of key fractures as the test index, and considering the cutting edge angle of the harrow blade, the thickness of the front end of the harrow blade’s cutting edge, and the ratio of the circumferential speed to the forward speed as the test factors, an in-depth analysis of the interactions among these test factors was conducted. Subsequently, a regression equation was established, and the optimal combination of the test factors was determined. Based on these findings, the trial production of the soil crushing device was successfully completed.
(3)
Field tests were conducted in strict accordance with agronomic requirements. The test results reveal that the soil crushing rate exceeds 85%, with an average soil crushing rate of 88.66%. These test results have successfully achieved the predetermined objectives and fulfill the design requirements. The research and development of the power harrow, along with its crucial soil crushing components, have significantly enhanced the quality of land-preparation operations in saline–alkali land. This not only has the potential to increase crop yields, but also offers essential equipment support for the comprehensive development and utilization of saline–alkali land, thus contributing to the expansion and optimization of agricultural activities in such challenging terrains.

Author Contributions

Conceptualization, N.X. and X.L.; methodology, N.X.; software, N.X.; validation, N.X., Z.X., J.Y., Z.G., Y.T., C.X. and D.W.; resources, X.L. and D.W.; data curation, N.X.; writing—original draft preparation, N.X.; writing—review and editing, X.L.; project administration, X.L.; All authors have read and agreed to the published version of the manuscript.

Funding

This research was supported by National Key R&D Program of China (2022YFD2300101) and Key Research and Development Program of Shandong Province (Science and Technology Demonstration Project) (2024SFGC0405) and Shandong Provincial Cotton Industry Technology System Innovation Team Machinery Post Expert Project (SDAIT-03-09) and Key R&D Program (Major Science and Technology Innovation Project) in Shandong Province (2021CXGC010813).

Institutional Review Board Statement

Not applicable.

Informed Consent Statement

Not applicable.

Data Availability Statement

The original contributions presented in this study are included in the article; further inquiries can be directed to the corresponding authors.

Conflicts of Interest

The author declares no conflicts of interest.

References

  1. Bulletin on the main data of the Third National Land Survey. In Proceedings of the 2021 Office of the Leading Group of the Third National Land Survey of the State Council, Ministry of Natural Resources, National Bureau of Statistics, Beijing, China, 25 August 2021.
  2. Bao, X.M.; Hua, Y.W.; Song, X.L.; Niu, J.P.; Cai, D.H. Design Development and Structure Analysis of 1BQ–4.0 Power Drive Harrow. TAFE 2021, 48, 55–57. [Google Scholar]
  3. Anup, B.; Hifjur, R.; Thomas, E.V. A comparative study on tillage performance of rota-cultivator (a passive-active combination tillage implement) with rotavator (an active tillage implement). Soil Till. Res. 2021, 207, 104861. [Google Scholar]
  4. Han, Y.J.; Li, Y.W.; Zhao, H.H.; Chen, H.; Liu, D.X. Simulation of Soil Cutting by Vertical Rotary Blade Based on SPH Method. J. Southwest Univ. 2016, 38, 150–155. [Google Scholar]
  5. Fang, H.M. Research on the Straw-Soil-Rotary Blade Interaction Using Discrete Element Method. Ph.D. Thesis, Nanjing Agricultural University, Nanjing, China, 2016. [Google Scholar]
  6. He, C. Design and Research of Deep Loosening and Vertical Rotary Tillage and Wheat Wide-Narrow-Row Sowing Compound Machine. Master’s Thesis, Henan Agricultural University, Zhengzhou, China, 2019. [Google Scholar]
  7. Zheng, K. Study on Subsoiling and Rotary Tillage Operation Adjustable Combine Machine. Ph.D. Thesis, China Agricultural University, Beijing, China, 2019. [Google Scholar]
  8. Zhang, H. Experimental Study on Vibrating Subsoiling Components in Soda Saline Alkali Soil. Master’s Thesis, Henan Agricultural University, Zhengzhou, China, 2019. [Google Scholar]
  9. Hu, W.H.; Yang, F.Z.; Zhao, G.D.; Lin, Y.L.; Huang, K. Analysis and Optimization of Working Parameters of Vertical Rotary Tiller Blade Based on Didcrete Element Method. J. China Agric. Mach. 2022, 43, 25–41. [Google Scholar]
  10. Tian, Y.F. Design and Test of Vertical Strip Rotary Cultivator in Straw Return Mode. Master’s Thesis, Jilin Agricultural University, Changchun, China, 2023. [Google Scholar]
  11. Wang, Y.B.; Rong, G.; Li, H.W. Design and Parameter Optimization of Vertical Driving-Type Surface Rotary Tillage Machine. Trans. Chin. Soc. Agric. Eng. 2019, 35, 38–47. [Google Scholar]
  12. Massimiliano, V.; Michele, M.; Giovanni, M.; Alessandro, B.; Lorenzo, C. Correlation between power harrow energy demand and tilled soil aggregate dimensions. Biosyst. Eng. 2023, 225, 54–68. [Google Scholar]
  13. Tang, W.B.; Liu, E.G.; He, C.; Jin, C.; Liu, C.X. Design and Experiment of Vertical Rotary Cultivator. Agric. Mach. Res. 2022, 10, 77–87. [Google Scholar]
  14. Ucgul, M.; Saunders, C.; Fielke, J.M. Discrete Element Modelling of Top Soil Burial Using a Full Scale Mouldboard Plough under Field Conditions. Biosyst. Eng. 2017, 160, 140–153. [Google Scholar] [CrossRef]
  15. Asaf, Z.; Rubinstein, D.; Shmulevich, I. Determination of Discrete Element Model Parameters Required for Soil Tillage. Soil Till. Res. 2007, 92, 227–242. [Google Scholar] [CrossRef]
  16. Barr, J.B.; Ucgul, M.; Desbiolles, J.M.A.; Fielke, J.M. Simulating the Effect of Harrow Angle on Narrow Opener Performance with the Discrete Element Method. Biosyst. Eng. 2018, 171, 1–15. [Google Scholar] [CrossRef]
  17. Mustafa, U.; Chris, S.; Peilin, L.; Sang-Heon, L.; Jacky, M.A.D. Analyzing the Mixing Performance of A Rotary Spader Using Digital Image Processing and Discrete Element Modelling (DEM). Comput. Electron. Agric. 2018, 151, 1–10. [Google Scholar]
  18. Cao, L.F.; Zhang, C.C.; Zhang, J.H.; Liu, C.X.; Zhao, H. Design and Analysis of the Rotary Blade System of Y-Shaped Vertical Rotary Cultivator. Agric. Mach. Res. 2018, 8, 47–51. [Google Scholar]
  19. Zhang, J. Design and Experimental Study on Driving Target and Plastic Film Collecting Combined Operation Machine. Master’s Thesis, Xinjiang Agricultural University, Ürümqi, China, 2013. [Google Scholar]
  20. Ahmet, C.; Sefa, A. The effect of power harrow on the wheat residue cover and residue incorporation into the tilled soil layer. Soil Till. Res. 2022, 215, 105202. [Google Scholar]
  21. Balsari, P.; Biglia, A.; Comba, L.; Sacco, D.; Eloi, A.L.; Varani, M.; Mattetti, M.; Barge, P.; Tortia, C.; Manzone, M.; et al. Performance Analysis of a Tractor-Power Harrow System Under Different Working Conditions. Biosyst. Eng. 2021, 202, 28–41. [Google Scholar] [CrossRef]
  22. Zhang, M.; Wu, C.Y.; Chen, C.L. Drive System Design and Blade Motion Analysis of Vertical Rotary Cultivator. J. China Agric. Mach. 2013, 34, 66–69. [Google Scholar]
  23. Wang, M.; Li, P.P.; Wang, J.H.; Li, K.; Xiao, H.G. Simulation of Soil Cutting Process of Vertical Rotary Tillage Tool in Tea Plantation Based on LS-DYNA. J. Anal. At. Spectrom. 2015, 9, 422–425. [Google Scholar]
  24. Liu, F.J.; Mi, Y.; Liao, N.; Di, M.L.; Liu, Y.D.; Liu, H.K. Research Design of Vertical Rotary Cultivator and Experiment. Agric. Mach. Res. 2017, 11, 81–84. [Google Scholar]
  25. Sun, J.; Wang, Y.; Ma, Y.; Tong, J.; Zhang, Z. DEM Simulation of Bionic Subsoilers (Tillage Depth > 40 cm) with Drag Reduction and Lower Soil Disturbance Characteristics. Adv. Eng. Softw. 2018, 119, 30–37. [Google Scholar] [CrossRef]
  26. Gao, M.Y.; Liu, E.H.; Zhang, B.K. Design and Testing of a Soil Stratification on-Demand Tillage Compound Cultivator. Modern Agric. 2014, 8, 55–56. [Google Scholar]
  27. Zhang, X.Y.; Zhang, L.X.; Hu, X.; Wang, H.; Shi, X.B.; Ma, X. Simulation of Soil Cutting and Power Consumption Optimization of a Typical Rotary Tillage Soil Blade. Appl. Sci. 2022, 12, 8177. [Google Scholar] [CrossRef]
  28. Power-Driven Harrow; Ministry of Agriculture and Rural Development of the People’s Republic of China: Beijing, China, 2019; Volume 3, p. 8.
  29. Yang, S. Optimal Design and Experimental on Rotary Harrow in Mulberry Field. Master’s Thesis, Shandong Agricultural University, Taian, China, 2020. [Google Scholar]
  30. Zhang, Q.B.; Liu, Y.G.; Zhang, R.; Zhao, W.; Yang, X.W.; Li, R.Y.; Hu, C.Q. Simulation and Analysis of Driving Harrowing Load of Combined Soil Preparation Machine Based on Discrete Element Method. Agric. Mach. Res. 2021, 4, 167–173. [Google Scholar]
  31. Wang, L.Y.; Yang, F.Z.; Li, W.H.; Jiang, F.L.; Jian, S.C. Simulation Research on the Performance of Vertical Rotary Tillage Cutter Based on Discrete Element Method. Agric. Mach. Res. 2023, 2, 9–20. [Google Scholar]
  32. Xu, B. Design and Experiment on Seedbed Arrangement of Rape Seeding Transplater and Matching Device. Master’s Thesis, Huazhong Agricultural University, Wuhan, China, 2018. [Google Scholar]
  33. Wang, L.Y. Research on The Development and Operation Stability of Seed and Fertilizer Precision Sowing and Tillage Integreted Machine. Master’s Thesis, Qingdao University of Technology, Qingdao, China, 2021. [Google Scholar]
  34. Zhao, J.F.; Wang, W.; Sun, Z.X.; Su, X.J. Improvement and Verification of Pressure-Sinkage Model in Homogeneous Soil. Trans. Chin. Soc. Agric. Eng. 2016, 32, 60–66. [Google Scholar]
  35. Xu, N.; Xin, Z.B.; Yuan, J.; Gao, Z.H.; Tian, Y.; Xia, C.; Liu, X.M.; Wang, D.W. Calibration of Discrete Element Simulation Parameters and Model Construction for the Interaction Between Coastal Saline Alkali Soil and Soil-Engaging Components. Agricultueral 2024, 15, 7. [Google Scholar] [CrossRef]
Figure 1. Power harrow machine structure.
Agriculture 15 00206 g001
Figure 2. Structure diagram of vertical rotor.
Agriculture 15 00206 g002
Figure 3. Structure and transmission diagram of vertical-rotor group.
Agriculture 15 00206 g003
Figure 4. Harrow tool structure.
Agriculture 15 00206 g004
Figure 5. Dynamic analysis of harrow and soil interaction. O is the contact point between the soil and the harrow blade; v 0 is the forward speed of the power harrow machine, m/s; a q is the implicated acceleration of the soil after the harrowing knife’s action, m/s2; a x is the relative acceleration of the soil, m/s2; a k is the Coriolis acceleration of the soil, m/s2; f is the friction between the cutting edge of the harrow and the soil, N, tangential to the cutting edge curve; F N is the pressure exerted on the soil by the cutting edge, N, where the direction is perpendicular to the cutting edge curve; F 1 is the longitudinal component of the adjacent clods, N; F 2 is the lateral component force of the adjacent clods, N; α is the angle between the cutting edge curve and the front of the cutting edge, also known as the edge wedge angle, rad; γ is the angle between the cutting edge curve and the back of the harrow, also known as the cutting edge angle, rad; β is the machine direction; and a q is the angle, rad.
Agriculture 15 00206 g005
Figure 6. Motion path diagram of the harrow knife. R denotes the distance from any point on the harrow knife to the center axis of rotation of the vertical rotor, mm; Q is an arbitrary point on the locus.
Agriculture 15 00206 g006
Figure 7. Trajectory diagram. (a) 95.54 r/min; (b) 191.08 r/min; (c) 286.62 r/min; (d) 382.16 r/min.
Agriculture 15 00206 g007
Figure 8. Schematic diagram of harrow knife structural parameters.
Agriculture 15 00206 g008
Figure 9. Discrete element integral simulation model.
Agriculture 15 00206 g009
Figure 10. Schematic diagram of different cutting edge angles. (a) Cutting edge angle of 5°; (b) cutting edge angle of 15°; (c) cutting edge angle of 30°; (d) cutting edge angle of 40°.
Agriculture 15 00206 g010
Figure 11. Diagram showing the front end thickness of different cutting edges. (a) Front end thickness of 2 mm; (b) front end thickness of 4 mm; (c) front end thickness of 7 mm; (d) front end thickness of 9 mm.
Agriculture 15 00206 g011
Figure 12. Discrete element simulation of harrow operation with different cutting edge angles.
Agriculture 15 00206 g012
Figure 13. Bond fracture conditions under different cutting edge angles.
Agriculture 15 00206 g013
Figure 14. Discrete element simulation of harrow operation with different cutting edge front thickness.
Agriculture 15 00206 g014
Figure 15. Bond fracture conditions under different front end thicknesses of the cutting edge.
Agriculture 15 00206 g015
Figure 16. Discrete element simulation of harrow operation with different ratios of circular velocity to forward velocity.
Agriculture 15 00206 g016
Figure 17. The situation of bond breakage under different ratios of circumferential speed to forward speed.
Agriculture 15 00206 g017
Figure 18. The interactions between various factors on the number of broken bonds. (a) The interaction between blade cutting edge angle and front end thickness. (b) The interaction between blade cutting edge angle and ratio of circumference to forward velocity. (c) The interaction between front end thickness and ratio of circumference to forward velocity.
Agriculture 15 00206 g018
Figure 19. Side view of soil disturbance under different forward speeds: (a) 5 km/h; (b) 6 km/h; (c) 7 km/h; (d) 8 km/h.
Agriculture 15 00206 g019
Figure 20. Top view of soil disturbance under different forward speeds: (a) 5 km/h; (b) 6 km/h; (c) 7 km/h; (d) 8 km/h.
Agriculture 15 00206 g020
Figure 21. Field trial.
Agriculture 15 00206 g021
Table 1. Discrete element simulation test parameters.
Contact Model ParametersParameter Ranges
Depth/cm0–55–1010–1515–2020–2525–30
Bond radius/mm5.165.165.165.295.295.29
Normal stiffness/N·m−35 × 1075 × 1075 × 1075 × 1075 × 1075 × 107
Critical normal stress/Pa3.05 × 1043.05 × 1043.05 × 1044.03 × 1044.03 × 1044.03 × 104
Shear stiffness/N·m−35 × 1075 × 1075 × 1075 × 1075 × 1075 × 107
Critical tangential stress/Pa3.05 × 1043.05 × 1043.05 × 1044.03 × 1044.03 × 1044.03 × 104
Poisson’s ratio of saline–alkali soil0.380.380.370.370.370.36
Shear modulus of saline–alkali soil/Pa1 × 1061 × 1061.01 × 1061.02 × 1061.02 × 1061.05 × 106
Saline soil density/g·cm−31.6531.6821.7251.7461.7751.793
Soil intergranular recovery coefficient0.420.390.380.360.350.35
Coefficient of static friction between soil particles0.350.420.520.640.780.96
Coefficient of dynamic friction between soil particles0.0550.0580.0620.0710.0800.0885
Harrow knife Poisson ratio0.30
Harrow knife shear modulus/Pa7.9 × 1010
Harrow density/kg·m−37860
Soil–harrow recovery coefficient0.480.450.430.400.380.35
Coefficient of static friction between soil and harrow0.430.460.4740.5120.5340.556
Coefficient of dynamic friction between soil and harrow0.04540.04920.05280.05520.05800.0608
Table 2. Soil conditions of the experimental field.
DepthSoil Compactness/kg.cm−2Soil Density/g.cm−3Soil Moisture Content/%
0–5 cm19.101.65316.82
5–10 cm18.421.68221.35
10–15 cm18.061.72522.52
15–20 cm17.361.74624.08
20–25 cm16.931.77524.68
25–30 cm16.151.79326.28
Table 3. Design and test results of single-factor test for harrow cutting edge angle.
Serial NumberHarrow Cutting Edge Angle (°)Bond Break Number
15114,983
210115,136
315114,085
420113,521
52593,763
63078,658
73553,147
84029,563
Table 4. Experimental design and results of harrow cutting edge thickness factor.
Serial NumberHarrow Cutting Edge Thickness (mm)Bond Break Number
12121,237
23121,963
34120,794
45117,389
5691,856
6779,563
7854,632
8946,535
91041,763
Table 5. Experimental design and results of the ratio of the circumference velocity to the forward velocity factor.
Serial NumberThe Ratio of the Circumference Velocity to the Forward VelocityBond Break Number
1389,653
2495,462
35109,873
46117,654
57119,356
68120,398
79119,537
810120,657
Table 6. Factors and levels.
LevelA
Blade Cutting Edge Angle/°
B
Front End Thickness/mm
C
Ratio of Circumference to Forward Velocity
−1526
012.53.58
120510
Table 7. Test scheme and test results.
Serial NumberAB C Y
Bond Breaking Number
Blade Cutting Edge Angle/° Front End Thickness/mm Ratio of Circumference to Forward Velocity
112.53.58114,963
2528127,865
312.53.58115,087
453.510129,564
512.526112,873
62058109,876
712.5510116,832
82028113,549
912.53.58115,321
10203.56108,678
1112.53.58115,783
1212.556109,107
13203.510115,079
1412.53.58115,398
1553.56113,496
1612.5210128,963
17558114,836
Table 8. Significance analysis of bond fracture number.
Polynomial RegressionQuadratic SumDegree of FreedomMean SquareFp
Model6.568 × 10897.298 × 107720.24<0.0001
A1.860 × 10811.860 × 1081836.06<0.0001
B1.328 × 10811.328 × 1081310.97<0.0001
C2.678 × 10812.678 × 1082642.69<0.0001
AB2.188 × 10712.188 × 107215.97<0.0001
AC2.336 × 10712.336 × 107230.57<0.0001
BC1.749 × 10711.749 × 107172.64<0.0001
A21.014 × 10611.014 × 10610.010.0158
B22.246 × 10612.246 × 10622.160.0022
C23.434 × 10613.434 × 10633.890.0006
Residue7.093 × 10571.013 × 105
Lack of fit3.076 × 10531.025 × 1051.020.4719
Error4.017 × 10541.004 × 105
Aggregate6.575 × 10816
Table 9. Results of field test of soil fragmentation.
Testing Order Number12345678910
Percentage of soil breaking (%)87.686.988.290.388.591.889.288.386.289.6
Disclaimer/Publisher’s Note: The statements, opinions and data contained in all publications are solely those of the individual author(s) and contributor(s) and not of MDPI and/or the editor(s). MDPI and/or the editor(s) disclaim responsibility for any injury to people or property resulting from any ideas, methods, instructions or products referred to in the content.

